Lab 2 Software Upgrade
基于KeYmaera X的实验室2:跟随领导者说明书

Lab2:Follow the Leader15-424/15-624/15-824Logical Foundations of Cyber-Physical SystemsTA:Katherine Cordwell(***************.edu)Betabot Due Date:Friday,September27th BEFORE12:00noon with NO late days,worth20points Veribot Due Date:Thursday,October3th,11:59PM(2late days,max6per semester),worth80points Lab Resources:https:///course/lfcps19/lab2.zipUpdate!KeYmaera X is undergoing active development and we will sometimes release updates in between labs as our favorite usersfind bugs.So,here is a quick guide to updating KeYmaera X!Check if you need to update.To do so,ensure that you are connected to the Internet and then start KeYmaera X.Check the footer of any page on the KeYmaera X web interface.The footer should either say“KeYmaera X...(latest)”or else it should tell you that a new version is available(e.g.,“version4.7.2is now available...”)Whenever you notice it is time to update,complete these steps:1.Shut down KeYmaera X2.Delete your keymaerax.jar3.Download the latest keymaerax.jar from:/keymaerax.jarUsually,that is all you have to do.The release notes at:/download.html#News contains all of the changes made in each release and should also tell you about any incompatibilities.For the upgrade from KeYmaera X4.7.1to KeYmaera X4.7.2,we have(among other small things)slightly improved the UI.1Event-triggered Highway DrivingFigure1:Lead and control carIn this problem,you will design a hybrid program(HP)to model a controlled car(ctrl)following a lead car(lead)along a straight road.The requirements for the model are listed below in text;you should write a HP that appropriately models these requirements.•The lead car should keep a constant and non-negative velocity(i.e.,vel lead≥0).1•The driver of the controlled car can only choose to accelerate at rate A,where A>0,or brake at rate −B,where B>0.The choice of acceleration A should only be available to the driver when it is safe,a condition that you will have to define,while the choice to brake should always be available.•The controlled car has continuous access to the lead car’s position and velocity(i.e.,the controller you design should be event-triggered).•Assume the cars are infinitesimal points.In other words,a crash occurs only if the position of the controlled car exceeds the position of the lead car(i.e.,a crash occurs only if pos ctrl>pos lead).•Your controller must always have a transition,otherwise the safety property would be vacuously true in some(or all)cases.For example,the safety theorem[?false]safe holds vacuously for any postcondition safe because the test?false always fails.To avoid this,make sure your tests work like if-then-else statements.If you guard control decisions with a series of tests like:(?φ1;α1)∪...∪(?φn;αn)∪β,make sure the conditionsφi’s are exhaustive,i.e.,in every state,at least one of the guards is true,or that you havea fallback optionβwhich is always available.1.(Betabot).Write your answers to these three questions in lab2.txt with brief explanations:•What is a good safety condition for this system?•Under which initial conditions would the system satisfy your safety condition?For example,ifthe cars already start at pos ctrl>pos lead then they have already crashed before your controllercould do anything at all to save the day!•What would be a good criteria for claiming that your model is efficient?2.(Betabot).Fill in the missing parts of the HP in the given templatefile.Alsofill in your safetyand initial conditions from the previous part as logical formulas in the template.Save thisfile as L2Q1.kyx.While a proof is not required at the Betabot due date,you should strive to get the model and controller correct,because that will give you a better basis for the Veribot that you will be proving.3.(Veribot).Use KeYmaera X to prove that the HP you designed satisfies your safety condition andexport the proof in L2Q1.kyx.4.(Veribot).Bonus:Drivers get uncomfortable when their car gets too close to the car ahead.Updateyour safety condition to require that the cars never come within a constant distance c of each other.Update your model to satisfy this requirement and prove it safe in KeYmaera X.Submit the resulting file as L2Q1bonus.kyx.Only attempt the bonus problem after successfully proving safety without the buffer.You will only get bonus credit if your model without the buffer is proved successfully in the Veribots submission. 2Time-triggered Highway DrivingIn this problem,you will increase thefidelity of your model by changing some of the modeling assumptions. First,the lead car is now allowed to arbitrarily either accelerate at rate A or brake at rate−B.Second, when your(controlled)car chooses an acceleration,it may be stuck with that choice for some time.You will therefore need to design a time-triggered controller instead of an event-triggered one.Your model will now have a“stopwatch”which must be set to0before each continuous evolution.•The lead car may accelerate or brake arbitrarily at rate A or−B respectively.The controlled car never has access to the lead car’s acceleration.2•In the event-triggered controller,your car could only accelerate at rate A or brake at rate−B.This means that once it comes to a stop,it has no option but to accelerate.If acceleration is not safe,then the controller has no control options and the safety property would become vacuously true.To address this issue and avoid vacuously true theorems,in this problem you are additionally allowed to set your car’s acceleration to0.•The controlled car has intermittent access to the lead car’s position and velocity.The time between updates is variable,but is guaranteed to be less than time T(i.e.,your controller must be time-triggered).•The safety property should never be vacuously true(i.e.,the transition semantics of your hybrid program should not be empty).Ensure that the tests you use for guarding control decisions are exhaustive.1.(Betabot).Using the given template,design a time-triggered controller and model the system as ahybrid program.Then,write a dL formula expressing safety under suitable initial conditions for this new controller.Submit thisfile as L2Q2.kyx.2.(Veribot).Use KeYmaera X to prove that your time-triggered controller is safe.Export the proof inL2Q2.kyx.3.(Veribot).Question:Compare and contrast the Event-triggered and Time-triggered highway driving.Describe their relationship.Which was easier to prove safe?Which would be easier to implement?Why and what caused these differences?Submit your answer to this question in lab2.txt.4.(Veribot).Question:Suppose now that the lead car has faulty brakes.When it decides to brake,itcould be braking at any one of rates−B,−B2,−B4or−B8instead.Is your controller still safe?Explainwhy or why not.Submit your answer to this question in lab2.txt.3Submission ChecklistThis lab and all remaining labs in this course may be submitted in groups of two.If you are working with a partner,then you must submit afile called andrewids.txt containing both of your Andrew IDs.To make the grading infrastructure happy,please put them on a single line separated by a space,e.g.:kcordwel aplatzerMake sure you submit thisfile when working in a group.Otherwise,one of you will not get credit because there is no record of your submission.Additionally,ONLY one of you should submit on Autolab so that we do not end up grading your submissions twice.For both Betabot and Veribot submissions,remember to check the Autograder’s output on Autolab to ensure that yourfiles were submitted in the right format,parse correctly,etc.If you are working in a group, please also ensure that the Autograder correctly reports your Andrew IDs in its output,e.g.: ==>Group Andrew IDs:kcordwel,aplatzerUse the provided templates,and do not forget tofill in the section at the top.It gives us important information when grading your submission!31.Initial submission(Betabot).Submit a zipfile on Autolab containing your preliminary.kyxfilesfor each of the tasks as well as the Betabot discussionfile.This will enable us to give you feedback halfway through the assignment,so that you do not get stuck!If you want,you can include some small comments about your approach and questions you might have.While a proof is not required at the Betabot due date,you should,nevertheless,strive to get the model and controller correct,because that will give you a better basis for the Veribot that you will be proving.It will also result in a higher Betabot grade and allow us to provide more useful feedback.The Betabot zipfile should contain:•L2Q1.kyx•L2Q2.kyx•lab2.txt(with your answer to Q1.1)•andrewids.txt(only if working in pairs)2.Final submission(Veribot).Thefinal submission works the same way,except you submit.kyxfiles which contain both the model and the proof and your Veribot discussionfile.To receive full credit, proofs must be complete(i.e.,a successful“Proof Result”window appears after running the tactic you have submitted).The Autograder for this lab(and all remaining labs)will not check that your proof works auto-matically because the models and proofs are a lot more complicated.Thus,you will not see any ==>Succeeded at proving...lines in its output.The Veribot zipfile should contain:•L2Q1.kyx•L2Q2.kyx•L2Q1bonus.kyx(only for bonus credit)•lab2.txt(with your answer to Q2.3and Q2.4)•andrewids.txt(only if working in pairs)4。
logletlab 使用指南
logletlab 使用指南Loglet Lab 2 User GuideLoglet Lab 2 is a Java version of the original Loglet Lab software, rewritten from the ground up. Loglet Lab is also available at no cost under a BSD-like license, so it can be used on any platform that supports Java, including Windows, Mac OS X, and Linux.The purpose of this document is to guide you through the installation and basic use of Loglet Lab. For more information on how to use logistic anlaysis, you should read through the Logistics Primer and original tutorial.Contents1.License2.About Loglet Lab1.Differences from Loglet Lab 1.x3.Installation1.System requirements2.Download and install4.Your first loglet1.Starting up2.New document/edit plot info3.Enter data4.Do a fit5.Save your work5.Features1.Logistic fits2.Multiple data sets3.Logistic substitution4.Turning off autoscaling5.How to format text and Excel documents for import6.Printing and export6.Further readingLicenseCopyright (c) 2003, Program for the Human Environment, The Rockefeller University, except where noted. All rights reserved.Redistribution and use in source and binary forms, with or without modification, are permitted provided that the following conditions are met:1.Redistributions of source code must retain the above copyright notice, this list of conditions and the following disclaimer.2.Redistributions in binary form must reproduce the above copyright notice, this list of conditions and the following disclaimer in the documentation and/or other materials provided with the distribution.3.Neither the name of The Program for the Human Environment nor The Rockefeller University nor the names of its contributors may be used to endorse or promote products derived from this software without specific prior written permission.THIS SOFTWARE IS PROVIDED BY THE COPYRIGHT HOLDERS AND CONTRIBUTORS "AS IS" AND ANY EXPRESS OR IMPLIED WARRANTIES, INCLUDING, BUT NOT LIMITED TO, THE IMPLIED WARRANTIES OF MERCHANTABILITY AND FITNESS FOR A PARTICULAR PURPOSE ARE DISCLAIMED. IN NO EVENT SHALL THE REGENTS OR CONTRIBUTORS BE LIABLE FOR ANY DIRECT, INDIRECT, INCIDENTAL, SPECIAL, EXEMPLARY, OR CONSEQUENTIAL DAMAGES (INCLUDING, BUT NOT LIMITED TO, PROCUREMENT OF SUBSTITUTE GOODS OR SERVICES; LOSS OF USE, DATA, OR PROFITS; OR BUSINESS INTERRUPTION) HOWEVER CAUSED AND ON ANY THEORY OF LIABILITY, WHETHER IN CONTRACT, STRICT LIABILITY, OR TORT (INCLUDING NEGLIGENCE OR OTHERWISE) ARISING IN ANY WAY OUT OF THE USE OF THIS SOFTWARE, EVEN IF ADVISED OF THE POSSIBILITY OF SUCH DAMAGE.About Loglet LabDifferences from Loglet Lab 1.xData entry interface. Entering data in Loglet Lab 1.x was not very intuitive. As part of the re-implementation, Loglet Lab 2.x uses standard user interface compenents which makes entering data much easier. Also, since many users already have their data in Microsoft Excel and text documents, Loglet Lab 2.x supports opening these files directly.Fitting interface. In Loglet Lab 1.x, fits were done through a series of dialogs, which drew attention away from the main interface. For Loglet Lab 2.x, we decided to take a more direct approach by placing a fiting panel in the main window. The fitting process itself has been streamlined, while at the same time, the user has more control; you can change values and instantly see the revised fit in the plot.Also, in Loglet Lab 1.x, statistical bootstrapping was provided as a separate button in the interface. In Loglet Lab 2.x, this is automatically done on every computer-generated fit (i.e., when you click on the "Fit" button as opposed to using your own values).Export to PNG. Many users wanted to add their graphs to web pages and PowerPoint presentations. Loglet Lab can now savetheir plots as Portable Network Graphics (PNG) images, which are supported in the current versions of common office applications (such as Microsoft Office) and web browsers (including Internet Explorer, Netscape, and Safari).Cross-platform availability. Loglet Lab 1.x was only available for Windows. However, we found that there were many users who used Mac or Unix (particularly in the scientific community). Byre-implementing the application to Java, we can make Loglet Lab available for many platforms.Extensibility. As part of the re-implementation, we also redesigned the fitting process into modules. By implementing a few common interfaces, new fitting models can be more easily integrated into the code base. To this end, we plan to make the source code available under a BSD-like license, which will allow others to add their own ideas to the program. Because we have re-implemented in Java, development can also take place on any platform.InstallationSystem RequirementsAgain, because Loglet Lab is written entirely in Java, it can be used on any platform that supports Java. We have tested it on Windows 98, 2000, Mac OS X, and RedHat Linux.To use Loglet Lab 2.x, you will need at least 32 MB RAM (128 recommended) and about 1 MB free space on your hard drive. In addition, you must have a Java Runtime Environment (JRE) v 1.4.1or later. This will require another 50 MB free space on your hard drive.Getting a JRE•Windows or Linux users: A JRE can be downloaded from Sunat /j2se/downloads/index.html. You do not need the full SDK.•Mac OS X users: Java support is built into the OS; if you are running 10.2.x (Jaguar), you should run Software Update to upgrade to Java 1.4.1 if you haven't already.Download and InstallGo to /LogletLab/2.0/download.html to get the Loglet Lab package for your operating system. Windows and Mac users can get an installer which will automate most of the installation. Linux/Unix users can get a TAR file which contains all of the necessary files to run Loglet Lab 2 (excluding the JRE).WindowsIf you have a beta version of Loglet Lab 2 already installed on your machine, we recommend uninstalling it. Loglet Lab 2 will not affect Loglet Lab 1 (a.k.a. "Loglet Lab for Windows").To install Loglet Lab 2, double-click onLL-<version-number>-install.exe. The installer will guide you through the installation process; most users should be able to use the default options. The installer creates an icon in your desktop and a group in your Programs menu, which includes a link to an uninstaller.。
朗迈2(LabUmat2+Urised2)全自动尿液分析仪的应用

朗迈2(LabUmat2+Urised2)全自动尿液分析仪的应用发表时间:2017-12-27T12:44:12.643Z 来源:《中国误诊学杂志》2017年第21期作者:李再容[导读] LabUmat2采用反射率光度计读取高容量尿液试纸条颜色变化信息,通过触摸屏简单的操作。
四川省内江市市中区人民医院检验科 641000摘要:目的朗迈2(LabUmat2+Urised2)全自动尿液分析仪是LabUmat2尿液干化学分析仪和Urised2尿液有型成分分析仪通过同一标本运输轨道联机检测尿常规的全自动仪器。
检测项目多、速度快、精密度高,尿液有形成分分析结合人工显微镜检查准确度高。
方法:LabUmat2全自动尿液干化学分析仪:反射光度计法,折射仪法。
Urised2全自动尿液有型成分分析仪:自动离心镜检,影像式神经网络智能识别系统检测。
结果:LabUmat2分析仪,配用专用的尿液分析试纸条,检测尿液化学成分;Urised2分析仪检测尿液有形成分。
结论:朗迈2(LabUmat2+UriSed2)全自动尿液分析仪应用全过程严格按照检测前、检测中、检测后的质量保证体系做好全程质量控制,可及时、准确获得尿常规报告,为临床诊断、疗效监测、预后判断提供可靠依据。
同时也是临床实验室尿常规检测技术的提高。
关键词:尿液;尿液干化学;尿液有形成分【 abstract 】 objective to lang step 2(LabUmat2 + Urised2)automatic urine analyzer is LabUmat2 urine dry chemistry analyzer and stylish composition analyzer through the same Urised2 urine specimen transportation rail and system software online automatic instrument used in urine routine test.The detection program is much,the speed is fast,the precision is high,the urine physical component analysis combines with the artificial microscope to check the accuracy high.Methods:LabUmat2 automatic urine dry chemical analyzer:reflection photometry,refractometry.Urised2 automatic urine with type component analyzer:automatic centrifugal microscopy,imaging neural network intelligent recognition system detection.Results:labumat2-full automatic urine dry chemical analyzer,with general name:urine analysis test paper strip(dry chemical method),English name:LabStrip U11 Plus GL.Conclusion:lang step 2(LabUmat2 + UriSed2)automatic urine analyzer application process in strict accordance with the inspection before,during and after testing quality assurance system completes the entire journey quality control,can be timely and accurately get the urine routine reporting,for clinical diagnosis,therapeutic effect monitoring and prognosis judgement to provide reliable basis.It is also the improvement of urine detection technology in clinical laboratory.Keywords:urine,urine,dry chemistry,urine,physical composition.一、朗迈2(LabUat2+UriSed2)全自动尿液分析仪方法学原理(一)、LabUmat2尿液干化学分析仪检测原理【1】LabUmat2采用反射率光度计读取高容量尿液试纸条颜色变化信息,通过触摸屏简单的操作,自动化处理测试试纸条和试管—包括标本混匀和精确定量并注样到试剂模块单元上,采用更先进和专利检测技术进行试纸条评估,增加了通过物理检测单元进行特殊的比重、颜色和浊度检测,智能化的数据管理提供高效的效率从而使得尿液分析变得简单。
计算机专业英语第三版教学课件Unit2Software
Michael: I have checked the information. It is no problem to install it on the Windows 10.
迈克尔:我已经查看了相关信息。在Windows 10中安装没有问题。
Unit 2
Lesson 14
迈克尔正向技术支持部门的玛丽询问如何安装声卡。
Mary: Hello, Technical Support Department, what can I do for you?
玛丽:您好,技术支持中心,我能为您做些什么?
Michael: Hello, I want to replace the sound card with a new one. But I do not know how to operate in Windows 10 after I plug the card.
2. _O_p_e_r_a_ti_n_g__s_y_st_e_m__k_e_e_p__s_t_ra_c_k__o_f_f_il_e_s_a_n_d__d_i_re_c_to_r_ie_s on the disk.
3. _O_p_e_r_a_ti_n_g__s_y_st_e_m__c_o_n_tr_o_ls_p_e_r_ip_h_e_ra_l_d_e_v_ic_e_s_s_uc_h__as__di_s_k drives and printers.
Unit 2 Software
Lesson 1 Operating Systems Lesson 2 Office Software Lesson 3 Multimedia and Multimedia Software Lesson 4 Using Email Client Software
RSA-G2实验室吸收谱仪-H版本 发布于2023年4月说明书
Site Preparation GuideTable of Contents (2)Ideal Setup (3)System Components (4)Instrument Measurements (5)Utility Requirements (6)Computer Requirements .......................................................................................................... 7–8 Hardware (7)Software (8)Accessories (9)ACS and Chiller Panel ................................................................................................... 9–11 Air Dryer .. (12)Liquid Nitrogen Controller (13)Site Preparation Checklist (14)TA Instrument Offices (15)Select a location with adequate floor space and a rigid laboratory bench that is level and is in a vibration-free environment. For optimal performance it is recommended that the instrument beplaced by itself on a separate marble table.Bench width: 2.1 m (7 ft)Bench depth: 76 cm (30 in) min.Distance from the wall: 20 cm (8 in) min.MAIN SYSTEM COMPONENTSA. Computer (Controller)B. InstrumentC. Power Supply EnclosureD. Forced Convection Oven Enclosure E1. Liquid Nitrogen Controller & LN2 TankORE2. Air Cooling SystemMAIN INSTRUMENTPOWER SUPPLY ENCLOSUREFORCED CONVECTION OVEN ENCLOSUREPOWER• 180–264 VAC, 47–63 Hz, and single phase•Dedicated 20 A outlet. US sites require an L6-20 outlet.GASConditions • Must be dry• Must be free from oil (0.01 mg/m 3) and dirt (5 µm)Dew Point* -10°C or betterPressure 100 psig (0.7 MPa)Flow Rate9.5 scfm (270 L/min) If using N 2 gas as FCO heater source, air flow rate is 6 scfm (170 L/min). Separate N 2 gas source must be 70–125 psig and able to sustain a flow rate of 3.5 scfm (100 L/min) *TA Instruments recommends purchasing the air dryer to account for the necessary dew point and air quality.NEMA L6-20 plugHARDWARE REQUIREMENTSProcessor •Intel® Core™ i5 8400 or better• 2.8 GHz with 9 MB L2 cache Memory ≥ 16 GB RAM DDR4 2666 SDRAMHard drive ≥ 80 GB free space• 1.5 GB required for Full version of TRIOS•675 MB required for Lite version of TRIOS (without Online help)DVD (optional) ≥ 48x CD-ROM or DVD (optional for installing TRIOS)Screen resolution Required: 1280 x 1024 with 24-bit colorsRecommended: 1920 x 1080 with 24-bit colorsGraphic memory 128 MBScreen (LCD) size Required: 19” or greaterRecommended: 24” wide screenUSB II port Required with FCO Camera option.Network card Ethernet 10Base T/100 Base TXAdditional Ethernet card(s) Necessary if connecting the instrument directly and access is needed to theCorporate LAN.Ethernet Cabling 10/100BaseTX Ethernet hub/switch. Must be EIA-568B Category 5+ UTP Client-Server Protocol DHCPImage Capture (CameraOption) DirectX 9.0 or higherTCP/IP ports used •TCP: 20010, 20011•UDP: 5050, 5056SOFTWARE REQUIREMENTSItemOperating System •Windows 10 or 11 Enterprise, Ultimate, & Professional •Home version not supported•≥ 64-bit versionInternet Internet connection is strongly recommended for ongoing support after installationService Pack Microsoft Operating System Service PackUpdates Windows Operating System and associated Microsoft updates must be up to date.Windows 10 must be 1709 or later.Network A second network card for corporate connection is recommended. TA Instruments is not responsible for resolving issues associated with connections to your corporate network.Conflicts TA Instruments is not responsible for resolving hardware/software conflicts created by the addition of third-party hardware or software to the computer.ACS-2 MEASUREMENTSACS-3 MEASUREMENTSFCO CHILLER PANEL MEASUREMENTS – SMC MODELFCO CHILLER PANEL MEASUREMENTS – PARKER MODEL (DISCONTINUED)AIR COOLING SYSTEM REQUIREMENTS8A, 9A, 9.1A, or 11A (refer to the serial number plate on the rear of the unit) Circulator Power Cooling Gas LN2Fluid Light Hardware Software Temp Lab CustomerNEMA L6-20 plugAIR DRYER REQUIREMENTScondensation into water (installed by Customer’s maintenance personnel) Circulator Power Cooling Gas LN2Fluid Light Hardware Software Temp Lab CustomerLIQUID NITROGEN CONTROLLER MEASUREMENTSLIQUID NITROGEN CONTROLLER REQUIREMENTSRequirementsShould be placed on the same side as the FCOCustomer must provide: 160 L (or larger) Liquid Nitrogen tank with a pressure of14–22 psig (95–150 kPa gauge)LN 2 pressure above 30 psig (207 kPa gauge) may cause damage to the Liquid Nitrogen Controller. Keep the supply line short and provide adequate insulation to minimize gaseous nitrogen build-up in the supply line. Failure to do so may cause the Liquid Nitrogen Controller to malfunction frequently. Use the 3 ft. hose provided by TA Instruments for this reason.Circulator Power Cooling Gas LN 2 Fluid Light Hardware Software Temp Lab CustomerRSA-G2 Solids AnalyzerFor information on our latest products, contact information, and more, see our website at: .To find your local TA Instruments office and contact information, visit/contact/ta-directory/TA Instruments – Waters LLCCorporate Headquarters159 Lukens DriveNew Castle, DE 19720USATelephone: 302-427-4000Fax: 302-427-4001Email: **********************。
操作系统Lab2实验报告

深入学习 操作系统的原理和实 现细节,包括进程通 信、死锁处理、虚拟 化技术等。
实践应用
希望将所学的操作系 统知识应用到实际项 目中,提高自己的实 践能力。
持续学习
随着技术的不断发展 ,操作系统也在不断 更新和进步,需要保 持持续学习的态度。
探索新领域
对于新兴的操作系统 领域,如云操作系统 、物联网操作系统等 ,也希望有所涉猎和 探索。
学生将了解操作系统内核的组成和功能,以及操作系统如何通过内核 实现各种基本功能。
学生将通过实验深入了解操作系统的内部实现细节,提高自己对操作 系统设计和实现的认知水平。
02
实验内容
进程管理实验
总结词
理解进程状态及其转换、进程控制块PCB的组成、进程调度算法。
详细描述
通过实验,我们深入了解了进程的概念、状态及其转换。进程控制块PCB的组成,包括进程标 识符、进程状态、优先级、CPU寄存器内容等信息。此外,我们还学习了进程调度算法,如先 来先服务、最短作业优先、优先级调度等,并进行了模拟实验。
THANKS
感谢观看
操作系统Lab2实验 报告
汇报人:
202X-01-08
目录
• 实验目的 • 实验内容 • 实验结果与分析 • 问题与改进建议 • 总结与展望
01
实验目的
理解操作系统的基本概念
01
掌握核心概念
02
操作系统是计算机系统的核心软件,负责管理计算机硬件和软件资源 ,为用户提供便利的操作界面和高效的服务。
03
操作系统具有并发性、虚拟性、异步性和随机性的特点,这些特点决 定了操作系统在计算机系统中的重要地位和作用。
04
操作系统的基本功能包括进程管理、内存管理、文件管理和设备管理 ,这些功能是操作系统实现其核心目标的基础。
LabX Laboratory Software 2 连接实验室仪器说明书

Power Your Titration Benchwith LabX®L a b o r a t o r y S o f t w a r e2C o n n e c t Y o u r L a bSingle SoftwareFor Many Laboratory InstrumentsThe new LabX ® from METTLER TOLEDO offers a great new possibility to con-nect your titrators, balances, density meters and refractometers, melting point instruments and Quantos systems all with one single software. This uniform software and interface means less training and also helps toincrease your efficiency. With a unique approach, LabX allows you to work from either the instrument or PC or both and if required, with complete compliance.Reducing redundant software for different instruments helps you save time and money spent on maintenance and support. Use LabX to increase the efficiency of your workflow and eliminate waste by using LabX for your pa-perless lab documentation. Inte-grate LabX with 3rd party software such as LIMS, ERP , etc. for a fully integrated process.LabX offers many tools to help you optimize your workflow in the laboratory and increase efficiency. Connect your METTLER TOLEDO instruments to LabX and benefit from simplified operation, efficient method editing with the graphical layout, fast sample series modi-fications and tailored reports.Less training also means less time and money spent educat-ing your workforce. LabX offers the same concept of use for all instruments. Beyond that, users will recognize similar workflow concepts throughout the instrument terminals for fast adaptation to new instruments and seamless integration.Cost EffectiveWorkflow Optimization Less Training3LabX offers you all the conve-nience of centrally managed software. With one database all users have access to the same data, which can be restricted to the appropriate access accord-ing to your user management. Create your SOP methods once and all the instruments from dif-ferent laboratories will always have access to the latest version.Central Management4Work from PC or Titrator or Both For Flexible OperationAll methods and series are stored in one database. Thus the meth-ods and sample series that you create in LabX or at the instru-ment are always available wher-ever you are. Beyond that, the ti-trator and workbench intelligently display solely those methods and sample series that can be run by the selected titrator model.Each instrument connected to LabX has its own workbench correlating to that instrument. It offers all the components needed to run your daily tasks and the tools to monitor your sample series and results. Use the sta-tistics view for quick and easy inspection of results to see if they are within established limits.LabX offers you full flexibility for the way you want to work. Either start your analysis at the instrument or from the PC and have constant access to both your current sample analysis and latest results. No matter where you are use LabX Mail to receive a tailored message with the latest results, when a sample changer is ready to test new samples or when results are out of specification.LabX anticipates the different demands of users and the way they like to work. Thus, LabX of-fers you full flexibility wherever you work. For example: start your sample series at the titrator and move to other daily tasks. Open up the workbench from your office and monitor the same series you previously started.Methods & Series WorkbenchFlexible Operation F u l l F l e x i b i l i t y5Have access to your results from the titrator or your PC. Use search folders to structure results from different analyses. LabX offers you a sample and a series based view of your results to match your needs. Each series offers the statistics tab for a quick and simple overview of the results. Use LabX to simplify sample changer operation with thetransparent and easy-to-manage sample series tables. Track the state of your series from any LabX connected PC in your laboratory. Alter your series by adding or inserting urgent samples while operating.Whether you are on the go or cur-rently not located next to your titra-tor or LabX network, use LabX Mail to have messages or results sent to you. Increase your efficiency by receiving tailored messages: e.g. “Results out of specifications” or “Ready for more samples”.Results Automation LabX Mail6Execute Your Daily TasksWith One Click®Use the Scheduler to automati-cally start tasks, e.g. begin Karl Fischer pretitrations just before coming into the lab for the day. Or schedule LabX to do the daily sensor calibration for you. Periodically take samples of production-line baths to observe the correct ion concentrations.Execute your tasks with One Click. Simply create a shortcut to methods, sample series, series sequences, tasks or manual op-erations, e.g. drain your beaker to waste, and have direct access to your most common analyses. All the shortcuts you create at the workbench are also displayed at the titrator and vice versa.Excellence Balances connected to LabX have a dedicated entry point for titration tasks that re-quire weighing. Simply pick the task and the balance will guide you through the samples. Start your titration and add more sample weights as you‘re test-ing for improved productivity.One Click is a well-recognized concept of METTLER TOLEDO instruments. LabX offers you the same concept and helps to easily distribute shortcuts for different users over various instruments. To facilitate your workflow, LabX offers the task scheduler and SmartCodes ™ to automate youranalyses. Use SmartSample ™ for secure and efficient titration weighing.O n e C l i c k A p p r o a c hSchedule TasksShortcuts Simple Weighing7Remove transcription and order-ing errors as well as improve effi-ciency with the new SmartSample RFID technology workflow. Identify and weigh your titration samples at an Excellence Analytical Bal-ance with the SmartSample kit. Enter the sample identification (ID) at the balance to make sure the ID and weight are properly as-signed to the physical sample. Fully automate the selection of the correct method and transcription of samples IDs with a barcode or SmartSample RFID tag. Thus, eliminate sample order errors by reading the sample information as you test it, as well as ensur-ing the right method is selected for each product. Use the auto-mated 1D and 2D barcode reader with InMotion ™ Autosamplers.SmartSample ™ SmartCodes ™8R e g u l a t o r y C o m p l i a n c eTraceable and CompliantEnsured with LabX®Work from the instrument or PC and LabX will ensure that you are fully compliant with regulatory standards such as FDA 21 CFR Part 11. Use the services offered from METTLER TOLEDO for software verification (IPac) or full validation of your system with the Validation Manuals I & II. A sophis-ticated user management, electronic signatures and release process for methods and reports are additional handy features of LabX that support your daily reporting.Centrally set up the user manage-ment with users and assign rights to roles. Instruments connected to LabX have the same user man-agement, i.e. use the same login at the instrument and PC, to offer full traceability whether you work at the instrument or in LabX. Enforce your own account poli-cies to meet company or regula-tory guidelines and standards.The LabX Initial Software verifica-tion Package (IPac) is a service product of METTLER TOLEDO to ensure successful software instal-lation and proper operation at the installation site. Use the IPac to meet your standards for quality management and documentation. IPac contents are:– Installation Qualification (IQ)– Operational Qualification (OQ)– General System Suitability TestFor software validation in ac-cordance with regulatory bodies such as FDA, METTLER TOLEDO offers onsite validation support with the Validation Manuals I and II. Validation Manual I of-fers the necessary documenta-tion for vendor qualification and Validation Manual II for the validation of the software including installation and opera-tional qualification (IQ & OQ).User ManagementIPac Validation Manual I and II9The Regulation option of LabX server provides all the necessary tools to meet the FDA regulation (21 CFR Part 11) for data ma-nagement and storage. All rele-vant actions taken at the instru-ment or PC are recorded in the audit trail of LabX for full traceabi-lity and flexibility, no matter where you work.To differentiate between devel-opment and the final version of methods, report templates and other objects can be approved and then released. Use the flexible views at the titrator and LabX to display only the released method for daily use or switch to the lat-est amended method for any further modifications needed.Define your electronic signa-ture policies according to your standards. For example, make sure that new methods follow your own review and approval process before they are released for your daily applications in the lab. Reviewed objects such as methods, results or reports, etc. are protected from any alteration.Regulatory Compliance Propose & ReleaseElectronic Signature10M o d u l a r A p p r o a c hBuild the SystemThat Perfectly Matches Your NeedsLabX ® offers a modular licensing approach to meet your needs today and in the future. Choose the starter pack that suits your requirements and add optional licenses to match your customized needs. Integrate additional instruments to your LabX system by simply activating the relevant instru-ment license key in LabX.Titration Starter PacksIncluded Optional11automatically into LabX creating tasks or even start the analyses directly. Import and export data directly in CSV and XML formats. Exporting and importing was never more powerful and able to meet your needs.Straight fingerprint reader. With the regulation option combined with the user management option, your system will be audit-ready at any time.system integration option allows bi-directional integration. Centrally start and control tasks directly from your ELN or LIMS. These 3rd party systems are able to send tasks directly to the METTLER TOLEDO instrument touchscreen terminal.freely customize reports with all details and options, such as charts, plots, and tables.* Only available with LabX Serverrights each user or role is given. Login to all your instruments and PCs on your LabX net-work with the same username and password or fingerprint via the LogStraight™ fingerprint reader.OptionsName DescriptionPart bX IPacLabX Initial Software verification Package (IPac) ensures successful software installation51710898LabX Validation Manual I All information necessary for the qualification of METTLER TOLEDO as the software supplier (vendor qualification)30003640LabX Validation Manual II Starterpack TitrationAll instructions and forms necessary for the validation of the software (IQ, OQ).30097758LabX ® Servicesfor efficient LabX system qualification and validation/LabXTitrationMultiparameter Analysis with One Click ®Today’s quality control and testing labs have a multitude of tests to be per-formed on a single sample and often have multiple samples to run at the same time. Combining tests with a multiparameter system can op-timize accuracy and reproducibility while saving valuable time and en-suring proper correlation of results to sample identification.Benefits of a Multiparameter Analysis System:• Efficient high sample throughput• Robust system layout and smart security checks for reliable unattended operation • Simple and ergonomic operation – pleasant to work with, short learning period • Optimized for fast, accurate and repeatable tests, and cleaning • Secure data handling thanks to our powerful LabX ® software• Onsite METTLER TOLEDO service installation, qualification and training See what METTLER TOLEDO can do to optimize your lab with a Multipa-rameter Analysis system: /titration-multiparameterFor more informationMettler-Toledo AG, Analytical CH-8603 Schwerzenbach, Schweiz Tel. +41 44 806 77 11Fax +41 44 806 72 40Subject to technical changes© 10/2013 Mettler-Toledo AG, 30100354Marketing Titration / MarCom AnalyticalQuality certificate. Development, production and testing according to ISO 9001.Environmental management system according to ISO 14001.“European conformity”. The CE conformity mark provides you with the assurance that our products comply with the EU directives.One Click is a Registered Trademark of METTLER TOLEDO in Switzerland, the European Union, Russia and bX is a Registered Trademark of METTLER TOLEDO inSwitzerland, USA, China, Germany and a further 13 countries.。
lab2操作方法

lab2操作方法
Lab2的操作方法涉及到网络配置,主要包括链路划分和路由配置。
具体操作步骤如下:
1. 二层链路划vlan:按照不同设备进行vlan的划分,如SW3-4的e0/0划为vlan156,e0/1在SW3上划为vlan153,在SW4上划为vlan164。
2. OSPF配置:所有OSPF都需要在接口下宣告。
3. 配置trunk链路:在SW3-6上配置trunk链路,具体操作方式因设备而异。
4. 配置spanning-tree mst:在SW3-6上配置spanning-tree mst,进行mst的配置和命名,以及实例的vlan设置。
以上是Lab2的基本操作步骤,具体细节可能因设备型号和网络环境而有所不同,请根据实际情况进行调整。
如需更多信息,建议咨询专业人士获取帮助。
LAB-2-1:升级到无类路由协议
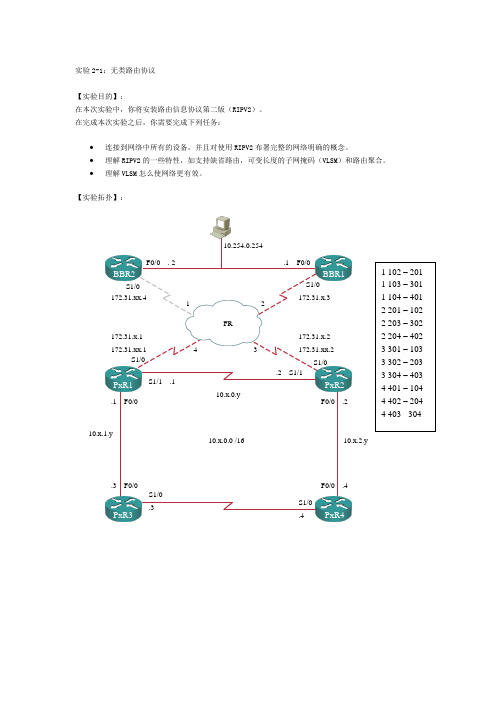
实验2-1:无类路由协议【实验目的】:在本次实验中,你将安装路由信息协议第二版(RIPV2)。
在完成本次实验之后,你需要完成下列任务:• 连接到网络中所有的设备,并且对使用RIPV2布署完整的网络明确的概念。
• 理解RIPV2的一些特性,如支持缺省路由,可变长度的子网掩码(VLSM )和路由聚合。
•理解VLSM 怎么使网络更有效。
【实验拓扑】:BBR2BBR1PxR1PxR2PxR4F0/0 . 2.1 F0/0F0/0 .2.1 F0/0.3 F0/0F0/0 .4S1/0 .3S1/0 .4S1/1 .1.2 S1/110.x.0.y10.x.2.y10.x.1.y10.254.0.254S1/0 S1/0S1/0S1/0172.31.x.1172.31.xx.1172.31.x.2 172.31.xx.2172.31.x.3172.31.xx.4FR12341 102 – 201 1 103 – 301 1 104 – 401 2 201 – 102 2 203 – 302 2 204 – 402 3 301 – 103 3 302 – 203 3 304 – 403 4 401 – 104 4 402 – 204 4 403 - 30410.x.0.0 /16注意:图中x为所在机架编号,y为路由器编号。
【实验帮助】:如果出现任何问题,可以向在值的辅导老师提出并请求提供帮助。
【命令列表】:【任务一】:探索有类路由选择。
使用TELNET或者其他终端程序建立与路由器建立联接。
记住在本实验中x是你的机架编号,y是你的路由器编号。
实验之前,导入初始的路由器配置。
实验过程:第一步:在所有的路由器上配置使用RIP 版本1,并发布网络(10.0.0.0)和,在帧中继边界路由器上,同时发布B类网络172.31.0.0。
第二步:使用命令version 1明确的指定使用RIPv1。
缺省情况下,路由器发送和接收版本1和版本2的路由,设置路由器使用版本1以防止骨干路由器同时运行两种版本。
ab实验 Lab 2_RSLogix5000软件应用
Lab2- 8 -
选择 Next
设置 RPI 时间,该时间决定了模拟量输入模块何时广播它的通道数据和状态数 据。 选择 Next
Lab2- 9 -
该窗口用来在上线时监视模块的运行。 选择 Next
Input Range:选择信号输入范围。 Scaling:为每个通道组态定标参数,将模拟量信号转换成工程量。 RTS:设置实时采样时间周期。该时间确定了模拟量输入模块何时更新其通道数据
4.组织数据 9) 右键点击 Controller Tags,选择 New Tag,新建标签数据。输入标签的名称、
描述(可选),选择标签类型和数据类型等,然后点击 OK。
点击这里打开数 据类型列表
Lab2- 13 -
Name:标签的名称遵循 IEC1131-1 标识符规则;不区分大小写。 Tag Type:标签类型分为普通型、别名型、发送型和接收型四种。 Data T ype:数据类型分为预定义数据类型和用户自定义数据类型两种。预定义 数 据 类 型 包 括 BOOL 、 SINT 、 INT 、 DINT 、 REAL 等 变 量 类 型 和 TIMER 、 COUNTER、CONTROL、MESSAGE、PID 等结构体;用户可以创建自定义结构 体,方法是右键点击 User-Defined,然后选择 New Data Type。 在数据类型中指定每一维的元素数目,标签便可以作为数组使用。
标,用户可以通过双击或者右键点击该图标然后选择“属性”来更改组态信息。
Lab2- 7 -
7) 组态本地模拟量 I/O 模块。 右键点击 I/O configuration 文件夹,然后选择 Ne w Module。在模块类型
列表中选择 1756-IF16(模拟量输入模块),单击 OK;确定版本信息后在跳 出的对话框中设置模块属性,输入模块的名称、描述(可选),选择槽号、通 讯格式、电子锁方式等;点击 Next 逐步设置 RPI 时间、通道数据范围、工程 量转换、通道数据报警高低限等内容;所有组态完成后,点击 Finish。
Lab 2

Lab 2VelocityOverviewIn this lab, we will explore the relationship between the position function and the velocity function of a moving object. In the lectures, we have seen that the velocity function v(t) is the derivative of the position function s(t) (and therefore s(t) is an antiderivative ofv(t)). We will be examining these statements in this lab by using a motion detector to measure the velocity and position of a person walking.Vocabulary used in this lab•Distance: This is the distance an object is from the motion detector. The words distance and position will be used interchangeably in this lab.•Displacement: This is “change of position,” that is, the difference between the initial and terminal coordinates the object. Displacement can be either positive or negative. (Think about what the difference between positive and negativedisplacement is.)•Velocity and speed: The important thing to note here is that velocity can be either positive or negative, depending on whether motion is in the positive ornegative direction. But speed = |v(t)| is never negative: it is the absolute value of the velocity. For example, a car’s speedometer is measuring speed and alwaysreads positive, regardless of the direction you’re traveling.•Total distance traveled: Perhaps this is best illustrated by an example. If you walk 2 meters forward and then 2 meters backward then your displacement willzero (the initial and terminal positions are the same so therefore the difference of coordinates is zero). But, you actually traveled 4 meters. In this case, the totaldistance traveled would be 4 meters. The “total distance traveled” is nevernegative.Mathematics for this labThe mathematics that we will need is the relationship between displacement and velocity: •Displacement is equal to the definite integral of velocity v(t) over a time interval.•Total distance traveled is equal to the definite integral of speed |v(t)|over a time interval.These ideas are discussed in the textbook on pages 374-375.Materials•Computer with Vernier computer interface.•Vernier motion detector. This will plug into the LoggerPro computer interface.•Separate “Lab Report 2” sheet. This is what you will turn in. It is due one week after your scheduled lab day, by 4:30 pm, in the Mathematics Office (Cupples I,room 100).Comments on the Motion DetectorThe motion detector works by emitting short bursts of ultrasonic sound waves. You will hear a clicking sound when the detector is operating. The detector “listens” for the ech o of these ultrasonic waves returning to it. The motion detector measures the time it takes for the sound waves to make the trip from the detector to the object and back to the detector. Knowing the speed of sound, the detector is then able to calculate the distance to the object.The specifications on the detector state that it has a minimum range of 0.4 m. and a maximum range of 6.0 m. The detector seems to work best if there is a smooth flat surface for the sound waves to bounce off of.Practically speaking, this means that as you collect data•Your motion needs to be parallel to the sensor and not perpendicular to it (i.e., you will need to walk either away from or towards the sensor, or both).•You will probably want to be holding a book or piece of cardboard in the sensor’s “line of sight” while you walk.•If neighboring lab teams are moving while you are collecting data, your motion detector might pick up their motion as well. You will have to cooperate with your neighboring teams so that your motion detector is only picking up data from your walking.•It is very important that the motion detector does not move. (What would the motion detector measure if it was moving?)ProcedureThe first thing to do is get the computer and motion detector ready.Connect the motion detector to the Dig/Sonic 2 port of the Lab Pro. Make sure the Lab Pro is connected to the USB port of the computer. (It is likely that these have already been done for you.)•Set the detector upright on the edge of the desk, facing out in a direction in which you have a clear path at least 2 m. long.•Open the LoggerPro program. You will want to select “Lab Pro USB” for the port in the Setup Interface. It is possible (hopefully not likely) that LoggerProwill not recognize the hardware. If this happens, unplugging the Lab Pro andplugging it back in should take care of the problem.•Open the experiment file for this lab. (Click on the “Open” button and open the file labeled “lab2_velocity.” (It is possible that LoggerPro will complain aboutthis file – just ignore any complaint and click “OK.”)•At this point, you should be able to collect distance and velocity data. Try playing around with the motion detector by pressing the “collect button” on thetoolbar. (For example: turn the sensor to face the nearest wall and collect data—what happens? Turn the sensor around and collect data by moving your handback-and-forth in front of it.) When you start collecting data, notice that velocity and distance data is graphed and the actual data appears in a table to the right ofthe graphs. Notice also that each time you start collecting new data, the data from the previous run is cleared. (Another way to clear recently collected data is toselect Data, Delete Run from the menu.)You are now ready to start collecting data that you will analyze.•Decide who will monitor the computer (and hit the collect button) and who will be the “mover”—the mover will create distance and velocity data bywalking back and forth in front of the motion detector.•Your goal is to generate a data set that exhibits both positive and negative velocity during the five seconds of movement.•There is a limited amount of free space in the lab for straight-line movement, so you will have to coordinate your data collection with your neighbors.Make sure you have a clear path before you start collecting your data.•The mover should take an initial position standing in front of the motion detector, holding a book or a piece of cardboard in the detector’s “line ofsight.” This will help to make a smoother velocity graph as you collect thedata.Before beginning, note the mover’s initial position. When the datacollection stops, the mover should remain in position while his/her partnernotes the terminal position. (An acceptable method to note these positionsis to put a marker, like a pen, on the floor where the mover’s feet start.)Measure and write down these positions (number of meters in front of thesensor); you’ll need this information later. (There will be a tape measurein the lab for you to measure the distances. You’re not looking for greataccuracy—just something in the right ballpark. Remember that 1 meter isapproximately 3.28 feet.).•Click on the “Collect” button and gather the data. When the mover hears the motion detector making the clicking sound, s/he should start moving along astraight line in front of the motion detector. Remember your goal to createdata with positive and negative velocity.After collecting your distance and velocity data, you should make sure your data looks “reasonable”: for example,•Is the graph of the velocity reasonably smooth?•Does the distance data in the table look like what you were expecting? Do the distances more-or-less match up with what you noted for the initial and finalpositions?•Is the velocity positive and negative when you were expecting it to be positive and negative?•If your data looks questionable, collect another set of data. (The good news is that it doesn’t take much time to collect another data set if necessary.) •If your data looks good, save it so that you can finish your report after the lab period if necessary. (If you didn’t bring a diskette, you could e-mail the datato yourself.)At this point, you are ready to analyze your data.•You should have two graphs –position (labeled “Distance vs. Time”) and velocity (labeled “Velocity vs. Time). You should print both of these graphs and also the table: activate each graph or table window before you print (so that youget a nice printout of each one separately).•Click on the “Examine” button (Analyze – Examine in the menu). This should allow you to more easily read both the graph and the data (watch what happenswhen you move the mouse to the graphs and the data table). Using this, answer#1-3 on Lab Report 2.DisplacementWe want to calculate the displacement of the mover after 5 seconds. We can do this in three different ways:a) by having LoggerPro estimate the integral of the velocityfunction v(t) for 0 <= t <= 5b) by using our data and the Fundamental Theorem of Calculus (Part II) to evaluate the same integralc) by using the measurements we made “by hand” during the data collection process.In detail:a) Using LoggerPro to estimate the integral of the velocity:•Click on the left-hand side of the velocity graph (Time=0) and drag the black line across to the right-hand side of the graph. While you are doing this, the values in the table window should be highlighted. Make sure you actually click on thegraph on not outside the graph (otherwise you will see the pop-up box asking you about the y-axis and y-scale).•Click the Integral button or choose Analyze – Integrate from the menu. A floating box with LoggerPro’s estimate of the value of the integral appears in the Veloci ty graph window. Note the units in this box: m/s * s, which is just meters (theseconds cancel out); don’t misread the units as “m/sec2” !! Print a copy of thegraph with the box. Record this value in #4a on the Lab Report.b) According the Fundamental Theorem of Calculus (Part II), we can compute the integral of v(t) over the time interval [0,5] using an antiderivative. In this situation, the numeric result can be worked out using subtracting two numbers taken from your data tables. In the Lab Report #4b state what numbers you are using and give the resulting value for the integral.c) Finally, calculate the displacement using the distances from the sensor that you measured during the data collection process. Record the result of the calculation in Lab Report #4c.In Lab Report #4d, you are asked to offer some reasons why the results in a), b) and c) are (probably) not equal.Total Distance TraveledTo find the total distance traveled, we need to integrate the speed |v(t)| during our 5 second time interval. To have LoggerPro do this,we need the speed data—so we create it in a new column:•Activate the velocity graph window by clicking on the velocity graph. Select View – Graph Options from the menu.•Modify the Graph Title by typing “Speed/” before Velocity. It should now read Speed/Velocity vs. Time. Click Apply, then click OK.•Select Data - New Column, Formula from the Data menu. The New Column window will appear.•Under the Options tab, in the Labels section, type “Speed” for Long Name, “sp”for Short Name and “m/s” for Units.•Click the Definition tab. In the Equation box, enter the formula(abs(“Velocity”)). You can (and should) do this by selecting “abs()” from the Functions list followed by selecting “Velocity” from the Variables list.•Click Try New Column. If it new data looks as it should (how should it look?), then click “OK”.•Notice that the new graph (Speed) coincides with the original velocity graph when the velocity is positive. How do these graphs compare when velocity is negative? •Click on the left-hand side of the speed/velocity graph (Time = 0) and drag the black line across to the right-hand side of the graph. All of the values in the table window should be highlighted.•Click the Integrate button. An Integral Selection window appears. Remove the check next to Velocity by clicking in its box. Make sure that Speed is checked.Click OK.• A floating box with LoggerPro’s estimate of the value of the integral appears in the Speed/Velocity graph window. Print a copy of the graph with the box. Report the total distance traveled on Lab Report, #5.Answer #6 and #7 on the Lab Report sheet.。
pintos Lab2 实验报告

华东师范大学软件学院实验报告实验课程:操作系统实践年级:大二实验成绩:实验名称:Pintos-User Programs 姓名:实验编号:学号:实验日期:2018/12/27指导教师:组号:实验时间:4学时一、实验目的当前, 我们已经完成了pintos 的第一部分(熟悉了其基础结构和线程包), 现在是开始处理系统中允许运行用户程序的部分的时候了。
基本代码已经支持加载和运行用户程序, 但不能加载和运行或交互性。
在此项目中, 我们将使程序能够通过系统调用与操作系统进行交互。
我们将在"userprog" 目录中进行工作, 但我们也将与pintos 的几乎所有其他部分进行交互。
具体目的如下:(1)了解Pintos操作系统的功能流程及内核的软件工程结构。
(2)通过Pintos操作系统内核的剖析,了解现有Pintos操作系统在处理用户程序方面中存在的参数传递问题,有效解决其参数传递的问题。
(3)通过Pintos内核剖析,了解其中断处理的机制,学会操作系统中断功能的编写方法。
(4)了解现有Pintos操作系统的系统调用功能,根据其中断机制,完善系统调用功能,使Pintos系统具有处理用户中断请求的功能。
(5)通过Pintos内核剖析,解决现有Pintos操作系统中存在的进程终止时缺少终端提示的问题。
(6)通过Pintos内核剖析,解决现有Pintos操作系统中存在的运行文件禁止写操作的问题。
二、实验内容与实验步骤实验内容如下:(1)在分析内核的基础上,对Pintos操作系统的参数传递问题提出有效的策略,设计算法,分步跟踪和调试,通过实践,有效解决参数传递问题,并对实验结果进行分析。
(2)通过Pintos操作系统内核的剖析,了解其中断处理的机制,在此基础上,完善Pintos的系统调用功能,设计算法,分步跟踪和调试,通过测试分析完善的系统调用功能。
(3)在分析内核的基础上,对现有Pintos操作系统进行完善,增加进程终止的终端提示功能,设计算法,分步跟踪和调试,通过实践,验证终端提示功的有效性。
Lab2_无线MAB_802.1x_WebAuth配置指南
Lab2: 无线MAB 802.1X WebAuth配置指南一、目的 (1)二、实验环境 (1)实验2.1:基于MAB的无线终端设备认证 (3)实验2.2:基于802.1X的无线终端设备认证 (7)实验2.3:基于LWA的无线WebAuth认证 (11)实验2.4:基于CWA的无线WebAuth认证 (16)一、目的本实验介绍了如何通过思科ISE,在无线网络环境中,实现MAB、802.1x和WebAuth 的配置步骤,包括:无线网络中的802.1x、MAB、WebAuth认证的配置步骤通过VLAN或DACL对终端设备的网络访问控制本实验包含了8个Pod,以下的实验步骤是以Pod1为例,其他Pod需要根据Pod的编号,使用相对应的IP地址。
二、实验环境以下是本次实验的网络拓扑图:说明:在VMWare上安装了8套ISE虚拟机,每套ISE的IP地址分别为10.10.10.71到10.10.10.78,分别对应Pod1到Pod8。
说明:每个Pod的IP地址是独立分配的,注意不要混用。
Windows Server 2008基本配置(所有Pod共用一套Windows 2008):版本:Windows Server 2008 Enterprise R2启用NTP服务启用Web服务器实验2.1:基于MAB的无线终端设备认证目的了解无线MAB和802.1X的认证过程,以及在无线控制器WLC和ISE上如何配置基于MAC地址跳过认证,即MAB(MAC Authentication Bypass)的认证过程。
(1)了解WLC上MAB和802.1X的配置和认证过程(2)通过配置MAB对不支持802.1X的设备进行认证和授权在本实验中,使用了iPhone做为终端设备来进行MAB测试。
配置步骤1.在ISE添加NAD设备登录到ISE管理界面,进入Administration > Network Resources > Network Devices,点击Add,输入以下信息,其它保持缺省值,将WLC2504加入到ISE上。
深入理解计算机系统LAB2

深入理解计算机系统LAB2————————————————————————————————作者: ————————————————————————————————日期:LAB1实验报告实验目的:使用课程知识拆除一个“Binary Bombs”来增强对程序的机器级表示、汇编语言、调试器和逆向工程等理解。
实验简介:ﻩ一个“BinaryBombs”(二进制炸弹,简称炸弹)是一个Linux可执行C程序,包含phase1~phase6共6个阶段。
炸弹运行各阶段要求输入一个字符串,若输入符合程序预期,该阶段炸弹被“拆除”,否则“爆炸”。
实验目标是你需要拆除尽可能多的炸弹。
运行结果:ﻩ通关密码储存在00131.txt文件中。
成功运行结果截图:ﻩ实验中的六组密码:PHASE1:字符串比较ﻩ本关比较简单,根据课件中的提示用GDB将最先压栈的那个字符串常量打印出来,然后将其作为密码输入,比较成功后即通关。
08048ab2 <phase_1>:8048ab2:ﻩ83ec 14 sub $0x14,%esp8048ab5:6ﻩ8 049f 04 08 push $0x8049f048048aba:ﻩff 74 24 1c ﻩpushl 0x1c(%esp)8048abe:ﻩe8 4d 04 00 00 ﻩcall 8048f10 <strings_not_equal> ﻩ将地址0x8049f04中的值打印出来:即“The future will be bettertomorrow.”PHASE2:循环在查看汇编语言的时候,会看到有调用一个read_six_number函数,猜测此题是让输入六个数字。
08048ad3 <phase_2>:8048ad3:ﻩ56 push%esi53push %ebx8048ad4:ﻩ83 ec2c ﻩsub $0x2c,%esp8048ad5:ﻩ8048ad8: 8d 44 24 10lea 0x10(%esp),%eax8048adc:ﻩ50push %eax8048add:ﻩff 74 243c ﻩpushl0x3c(%esp)8048ae1:e8 46 05 00 00 call804902c <read_six_numbers>83c410add $0x10,%esp8048ae6:ﻩ8048ae9:ﻩ83 7c24 0801ﻩcmpl $0x1,0x8(%esp)------→判定是否为18048aee: 74 1eﻩje 8048b0e <phase_2+0x3b>8048af0: e8 1205 00 00 ﻩcall 8049007 <explode_bomb>8048af5: eb 17 jmp 8048b0e <phase_2+0x3b>8048af7:ﻩ8b 03 ﻩmov (%ebx),%eax8048af9:0ﻩ1 c0 ﻩadd %eax,%eax----→进行自加,扩大两倍8048afb: 39 43 04 ﻩcmp %eax,0x4(%ebx)05je 8048b05 <phase_2+0x3748048afe:ﻩ2>8048b00:ﻩe8 02 05 00 00 call 8049007 <explode_bomb> 83c3 04 add $0x4,%ebx8048b05:ﻩ8048b08: 39 f3ﻩcmp %esi,%ebx8048b0a:75eb ﻩjne8048af7 <phase_2+0x24>8048b0c: eb 0a jmp8048b18 <phase_2+0x45>8048b0e:ﻩ8d 5c 24 08 lea 0x8(%esp),%ebx8048b12:ﻩ8d 7424 1c ﻩlea 0x1c(%esp),%esi8048b16: eb df jmp 8048af7 <phase_2+0x24>→循环8048b18:83 c4 24 ﻩadd $0x24,%esp8048b1b:ﻩ5b pop %ebx8048b1c: 5e ﻩpop %esi8048b1d:ﻩc3 ﻩret有汇编语言进行分析,不难看出,这道题目要求输入六个数字,并且要求第一个数字为1,之后跳入一个循环,将第一个数字加倍和已有的数字进行比较,所以不难看出所需要的密码是1,2,4,8,16,32这六个数字。
Lab2 命令解释程序的使用
实验二命令解释程序的使用一、实验目的掌握UNIX或LINUX环境下命令解释程序的使用能对编写简单的C程序,进行编译运行和调试。
二、实验内容输入LINUX相关命令后记录系统输出简单的C程序,进行编译运行和调试三、实验步骤1命令操作1)浏览目录和文件的各种属性ls –l、2)显示文件内容cat、more、3)改变文件和目录的权限chmod、4)显示当前目录pwd、5)文字统计wc、6)查看时间命令date 、time、7)帮助命令help、8)查看与删除进程命令ps, kill、9)查看在线用户who、2GNU gccGCC 是GNU提供的C 和C++ 编译器。
实际上,GCC 能够编译三种语言:C、C++ 和Object C(C 语言的一种面向对象扩展)。
利用gcc命令可同时编译并连接C 和C++ 源程序。
如果你有两个或少数几个C 源文件,也可以方便地利用GCC 编译、连接并生成可执行文件。
gcc 命令的基本用法如下:gcc [options] [filenames]gcc的主要选项:⏹-ansi 只支持ANSI 标准的C 语法。
这一选项将禁止GNU C 的某些特色,例如asm 或typeof 关键词。
⏹-c 只编译并生成目标文件。
⏹-DMACRO 以字符串“1”定义MACRO 宏。
⏹-DMACRO=DEFN 以字符串“DEFN”定义MACRO 宏。
⏹-E 只运行C 预编译器。
⏹-g 生成调试信息。
GNU 调试器可利用该信息。
⏹-IDIRECTORY 指定额外的头文件搜索路径DIRECTORY。
⏹-LDIRECTORY 指定额外的函数库搜索路径DIRECTORY。
⏹-lLIBRARY 连接时搜索指定的函数库LIBRARY。
⏹-m486 针对486 进行代码优化。
⏹-o FILE 生成指定的输出文件。
用在生成可执行文件时。
⏹-O0 不进行优化处理。
⏹-O 或-O1 优化生成代码。
⏹-O2 进一步优化。
LAB2

实ห้องสมุดไป่ตู้目的:
1. 2. 3. 4.
Spring 2009
学习使用 GEL 学习使用 DSK 板上的 AIC23 编解码器进行输入输出 理解中断方式的循环程序以及轮询方式的循环程序 学习使用查表法产生波形
双输入音频线使用说明: 分左右两个通道,可用于信号输入(接信号发生器)、输出 (接示波器),红色线为左通道, 蓝色线为右通道,剩余一根为地线。 输入输出口使用说明: C6713DSK 板上共四个输入输出口: LINE IN、 MIC IN 为输入, LINE OUT、 HEADPHONE 为输出。由于两输入接口是通过复用器复接,所以不能同时使用,选择方法如下: C6713dskinit.h 中,设置 Register 4,为 0x0011――选择 LINE IN 输入 为 0x0015――选择 MIC IN 输入 注意:由于通常所用到的输出函数 output_sample 默认是通过左通道输出数据,所以在 使用单路信号输入输出时,我们选用左通道(红色线)输入、输出。 Lab2_1 学习使用 GEL,理解使用轮询方式产生正弦波 1. 将双输入音频线接入 DSK 板 LINE OUT 接口,并将双输入音频线的左通道接示波器探 头。注意:接线全部完成后 DSK 板才能上电 2. 建立工程 lab2_1 3. 编写 gain.gel(参考本节课 ppt) 4. 编写程序,参考如下: #include "dsk6713_aic23.h" //codec-DSK support file Uint32 fs=DSK6713_AIC23_FREQ_8KHZ; //set sampling rate int loop = 0; //table index short gain = 10; //gain factor short sine_table[8]={0,707,1000,707,0,-707,-1000,-707}; //sine values short out_buffer[256]; //output buffer const short BUFFERLENGTH = 256; //size of output buffer int i = 0; void main() { int sample_data; comm_poll(); //init DSK, codec, McBSP while(1) //infinite loop { sample_data = sine_table[loop]*gain; //input sample output_sample(sample_data); //output sample out_buffer[i] = sine_table[loop]; //output to buffer i++; //increment buffer count if(i==BUFFERLENGTH) i=0;
lab2 介绍
内存布局及相关的宏(2)
KERNBASE
–
内核逻辑地址的起始点。从KERNBASE到4G的逻辑 地址映射了0-256M的物理内存,以方便内核直接访 问 用户态程序可以访问地址的界限,更高的内存用户 不可读。一般用来方便判断用户访存是否超界 用户有写权限的地址界限。UTOP和ULIM之间是用 户只读的内核数据结构,如UVPT,UPAGES
参考资料:
outline
Part 1 Physical Page Management
struct Page数据结构 queue.h中实现的双向链表
Part2--Ex2
Exercise2:
完成函数boot_alloc()、page_init()、page_alloc()、 page_free(),实现对物理内存页面的管理 struct Page queue.h中的链表
保护模式
Call cmain()加载内核。(其中包括 这些操作:检查ELF头、检查读多少 个扇区,加载)
虚拟内存布局及相关的宏(1)
/* Virtual memory map: Permissions * kernel/user * 4 Gig --> +----------------------------+ * | Remapped Physical Memory | RW/-* KERNBASE --> +----------------------------+ 0xf0000000 * | Cur. Page Table (Kern. RW) | RW/-- PTSIZE *VPT,KSTACKTOP --> +----------------------------+ 0xefc00000 --+ * | Kernel Stack | RW/-- KSTKSIZE | * | - - - - - - - - - - - - - -| PTSIZE * | Invalid Memory (*) | --/-| * ULIM --> +----------------------------+ 0xef800000 --+ * | Cur. Page Table (User R-) | R-/R- PTSIZE * UVPT --> +----------------------------+ 0xef400000 * | RO PAGES | R-/R- PTSIZE * UPAGES --> +----------------------------+ 0xef000000 * | | * | Empty Memory (*) | * | | * 0 --> +----------------------------+ */
Lab2实验报告

In this lab, I define 4 classes to implement the method.1.The first is Good with no attribute, just used to classify it’s a good chip.2.The second is Bad, the same with the Good class, but to express it’s a bad chip;3.The third is Test, used to find a good chip in the chip arrays . and here we use 分而治之法.4.The last is instance, using the good chip chosen in the third class to test other chips and print the outcome whether the chip is bad or good. And we use instanceof sign to test whether our outcome is true or not.(if chip is the instance of Good ,then it’s a good chip, otherwise it’s a bad one and compare with the outcome generated by the method in Test, we can judge whether the method can give what we want)Something added to my code.(1)I use arraylist to implement the array of chips and use two classes good andbad to represent good chips and bad chips.(2)I use true or false to represent 1 and 0 to express the outcome by mutual test.(3)To random the position of my chips, I use 伪随机. At first ,put the array intothe arraylist and then random some position and get the element at thisposition to the last of the array, so that we can get the random configuration of good and bad chips.代码部分//Class 1//define a good object which represent good chips without anyproperties.public class Good {}//Class 2//define a bad object which represent bad chipspublic class Bad {}//Class 3import java.util.ArrayList;public class Test {public static Object ultimate;/** the AtestB method is conformed with the requirement gg istrue ,gb is false, bg is true/false, bb is true/false, which is random because the chip is bad ,it has no ability to judge , and i use true and false to represent 0 and 1*/static boolean AtestB(Object A, Object B) {Good good = new Good();Bad bad = new Bad();if instanceof Good && B instanceof Good)return true;else if ((A instanceof Good && B instanceof Bad))return false;else {// use random to get the outcomeint result = (int) (Math.random() * 2);if (result == 0) {return false;} elsereturn true;}}// use n/2 method 分而治之static void nTest(ArrayList all) {int length = all.size();int divide = length / 2;ArrayList first = new ArrayList();ArrayList last = new ArrayList();ArrayList newList = new ArrayList();/** divide the arraylist all into 2 arraylist and test two objects whose* index are the same*/for (int i = 0; i < divide; i++) {first.add(all.get(i));}for (int i = divide; i < 2 * divide; i++) {last.add(all.get(i));}// if the length is odd, then judge whether divide/2 is evenif (length % 2 == 1) {// if divide/2 is even, then add the last element of "all" which is// left in the above procedure to the newListif (divide % 2 == 0) {newList.add(all.get(2 * divide));}}// if the test is all true and leave either one ,here I choose the// element in first arraylistfor (int i = 0; i < divide; i++) {if (AtestB(first.get(i), last.get(i))&& AtestB(last.get(i), first.get(i))) {newList.add(first.get(i));}}/** if arraylist has odd number, put the last one to temp and add it to* the newlist at last*/int newLength = newList.size();// if the length of the newList is 0,then the last one is a good chip,// and return it// if the length is 1,it must be a good chipif (newLength == 1) {ultimate = newList.get(0);return;}if (newLength == 0) {System.exit(0);}elsenTest(newList);}}//Class 4import java.util.ArrayList;public class Instance {/*** @param args*/public static void main(String[] args) {// TODO Auto-generated method stubArrayList array = new ArrayList();// make sure the good chips are greater than bad chips so that the// outcome is reliableint number = (int) (Math.random() * 1000);// the total number is// produced by randomint badNum = (int) (Math.random() * number); // the total number is// produced by randomif (badNum > number / 2) {System.out.println("the result will beunreliable,please try again!");System.exit(0);}int goodNum = number - badNum;// add good and bad chips into the array in sequence atfirstfor (int i = 0; i < badNum; i++) {array.add(new Bad());}for (int i = badNum; i < number; i++) {array.add(new Good());}// do the random change position so that the position of good and bad// chips are random rather than in sequencefor (int i = 0; i < 1000; i++) {int random = (int) (Math.random() * (number / 2));array.add(array.get(random));array.remove(random);}// output the total number and the good number and bad numberSystem.out.println("The total numbers of chips are " + array.size()+ "\n there are " + goodNum + " good chips. \n there are "+ badNum + " bad chips");Test test = new Test();test.nTest(array);// use the right one chose in the test method to test other chip so that// we can get the entire outcomefor (int i = 0; i < array.size(); i++) {if+ (i + 1)+ "st chip is good ");elseSystem.out.print("The test outcome the " + (i + 1)+ "st chip is bad ");// use the instanceof method to test whether the chip is good or bad// to test the outcome aboveif (array.get(i) instanceof Good)System.out.println("The right outcome the " + (i + 1)+ "st chip is good");elseSystem.out.println("The right outcome the " + (i + 1)+ "st chip is bad");}}}The naïve method which I didn’t write use this method: test an element by all other element of the array in sequence ,record all of the outcome anddo the circulation for every element until you find an element with the outcome like Num(true) >= Num(false).<Num(true) represents the numbers of true outcome , and Num(bad) represents the numbers of bad outcome>For there are N chips, A good chips and B bad chips and A > B, if N is odd, then A >= B+1,if what we test is a good chip ,then at least Numb(true) = A – 1 = Num(false).<all of the good chips say it’s good and all of the bad chips say it’s a bad chip>, if what we choose is a bad chip, then at least Num(false) = A > Num(true) = B – 1. <all of the good chips say it’s bad and all of thebad chips say it’s a good chip>. If N is even , then A >= B + 2, if we choose an good one, the worst case is ,Num(true) = A – 1 >= B + 1>Num(false) = B, if we choose a bad one ,Num(false) = A > Num(true) = B – 1. In conclusion, whether N is old or even ,as long as A > B, if we get the outcome like Num(true) >= Num(false), we can know that the chip is a good one. And we can use it to test all the other chips in the array and print the outcome to be seen by the professor.If we have B > A , the number of bad chips are bigger than that of good chips.If N = odd , B >= A + 1 When test a bad chip ,it’s possible we can get the result like, Num(true) = B – 1 >= Num(false) = A, and when we test a good chip, it’s possible that we can get the result Num(false) = B >= Num(true)= A – 1; if N = even ,B >= A +2, When test a bad chip ,it’s possible we can get the result like, Num(true) = B – 1 > Num(false) = A, and when we test a good chip, it’s possible that we can get the result Num(false) = B >=Num(true) = A – 1; so the outcome we get will be not right.About the b problem , I use Chinese to explain.分而治之法:分情况考虑(1)n为偶数随机的两两配对,则共有n/2对,分别测试<在我的代码里是从中间分成两个array,然后让两个数组里面的下标相同的去比较测试>。
安装、维护说明书

4. 责任免除
下列故障不属于保修范围 : 1) 操作不当。 2) 非本公司或本公司指定的其他公司对本产品进行的维修或改装。 3) 与非本公司指定的硬件或软件一起使用。 4) 因计算机病毒造成的本产品故障和包括基本软件在内的软件及数据 损坏。 5) 因停电或电压突然降低等电源故障引发的故障和包括基本软件在内 的软件及数据损坏。 6) 错误关机造成的故障和包括基本软件在内的软件及数据损坏。 7) 非产品本身原因造成的故障。 8) 因在高温高湿、腐蚀性气体或震动等恶劣环境中使用本产品而造成 的故障。 9) 因火灾、地震、其他自然灾害、放射性物质和有害物质的污染,以 及战争、暴乱和犯罪等不可抗拒事故造成的故障。 10) 安装后自行移动或运输产品时造成的故障。 11) 消耗品或等同于消耗品的零部件。 注意 : 软盘和 CD/DVD-ROM 等记录介质也属于消耗品。
3.3.1 3.3.2 3.3.3
3.4
未识别仪器 .........................................................................................................39
3.1.1 3.1.2
对各个仪器的系统配置进行注册 ....................................................................... 17 更改系统配置 .................................................................................................... 22 对 SPD-M30A 和 CBM-20A/CBM-20Alite 进行组设置 ......................................... 26 对 SPD-M20A 和 CBM-20A / CBM-20Alite 进行组设置 ................................... 27 对各个仪器的系统配置进行注册 ....................................................................... 32 更改所要连接的色谱柱 ..................................................................................... 36 更改 GC-2014 上的 DAFC 使用方式 ................................................................ 37 检查 PC 与 LC 之间的连接 ............................................................................... 39 检查 PC 和 PDA 检测器之间的连接 ................................................................. 41 检查 PC 与 GC 之间的连接 .............................................................................. 43 在启动 [ 分析 ] 程序时显示的信息 ...................................................................... 44
lab2ug电脑版下载教程

lab2ug电脑版下载教程
Lab2ug电脑版是一款功能强大的3D建模软件,可以帮助用户快速创建出令人
惊叹的3D模型。
本文将介绍如何下载Lab2ug电脑版。
首先,打开浏览器,访问Lab2ug官网,点击“下载”按钮,进入下载页面。
在下载页面,选择“Lab2ug电脑版”,然后点击“下载”按钮,开始下载安装包。
接下来,双击下载的安装包,开始安装Lab2ug电脑版。
在安装过程中,会提
示用户选择安装路径,选择完毕后,点击“下一步”,继续安装。
安装完成后,点击“完成”,打开Lab2ug电脑版,开始使用。
Lab2ug电脑版
的界面简洁明了,操作简单,可以帮助用户快速创建出令人惊叹的3D模型。
以上就是Lab2ug电脑版下载教程,Lab2ug电脑版是一款功能强大的3D建模
软件,可以帮助用户快速创建出令人惊叹的3D模型,值得拥有。
- 1、下载文档前请自行甄别文档内容的完整性,平台不提供额外的编辑、内容补充、找答案等附加服务。
- 2、"仅部分预览"的文档,不可在线预览部分如存在完整性等问题,可反馈申请退款(可完整预览的文档不适用该条件!)。
- 3、如文档侵犯您的权益,请联系客服反馈,我们会尽快为您处理(人工客服工作时间:9:00-18:30)。
NOTE: Location of upgrade files is located at: <add location>
Follow the instructions provided below to update your system:
Log Monitoring: During the upgrade process it is recommended to monitor a couple logs via a terminal window. Before you continue with executing the software upgrade, tail the following logs:
tail –f /var/log/vtl_init.log
tail –f /var/log/s2xmgr_java.log
1. Make sure you are logged into the Console Manager as administrator. Navigate to the Chassis Status
screen (System > Chassis).
2. Click Save Config in the MAINTENANCE TASKS list to save the current configuration.
3. Click on Software Update in the MAINTENANCE TASKS list. The Software Update screen is
displayed (Figure 1).
FIGURE 1. Software Update Screen
4. Download the update file to your workstation from the location provided to you by the instructor.
5. From the Software Update Wizard, browse to the location where you saved the zip
file and open it.
6. Click Next Step. A message appears, indicating that the upload process
may take a few minutes.
FIGURE 2. Software Update Upload Screen
7. When the upload is complete, the screen displays the SOFTWARE UPDATE WARNING. This warning
states that the system will reboot after the update and will interrupt your backup and restore operations if you have not shut them down.
FIGURE 3. Software Update Warning Screen
8. Click Next Step. The End-User License Agreement appears.
FIGURE 4. Software Update End User License Agreement Screen
9. Click ACCEPT. The files are extracted and the update begins.
FIGURE 5. Software Update Extracting Files Screen
The update is complete when the SOFTWARE UPDATE FINISHED screen appears(Figure 6). This screen displays a message indicating that the system is rebooting, and directs you to log in once the system reboot is complete.
FIGURE 6. Sample Software Update Finished Screen
10. Click Done. This does not interrupt the reboot process.
11. If you click Done before the process is complete, you may see a browser error or a“Cannot communicate
with chassis” error on the Login screen. Wait a few more minutes before trying to log in again.
The system is ready for use when the Notifications screen reports that “Initialization for node x completed”
for all nodes in the system after you log in. If you have email notifications enabled, the system will report via email when the S2100 platform is again ready for use.
FIGURE 7. Sample Notifications Screen
At this point, refer to the S2100 Data Protection Platform User Manual for additional information on configuring and managing your system。