曼昆微观经济学课后练习英文答案
曼昆微观经济学课后练习英文答案(第七章)
✍ how to define and measure consumer surplus.✍ the link between sellers’ costs of producing a good and the supply curve.✍ how to define and measure producer surplus.✍ that the equilibrium of supply and demand maximizes total surplus in a market. CONTEXT AND PURPOSE:Chapter 7 is the first chapter in a three-chapter sequence on welfare economics and market efficiency. Chapter 7 employs the supply and demand model to develop consumer surplus and producer surplus as a measure of welfare and market efficiency. These concepts are then utilized in Chapters 8 and 9 to determine the winners and losers from taxation and restrictions on international trade.The purpose of Chapter 7 is to develop welfare economics—the study of how the allocation of resources affects economic well-being. Chapters 4 through 6 employed supply and demand in a positive framework, which focused on the question, “What is the equilibrium price and quantity in a market?” This chapter now addresses the normative question, “Is the equilibrium price and quantity in a market the best possible solution to the resource allocation problem, or is it simply the price and quantity that balance supply and demand?” Students will discover that under most circumstances the equilibrium price and quantity is also the one that maximizes welfare.KEY POINTS:? Consumer surplus equals buyers’ willingness to pay for a good minus the amount they actually pay for it, and it measures the benefit buyers get from participating in a market.Consumer surplus can be computed by finding the area below the demand curve and above the price.? Producer surplus equals the amount sellers receive for their goods minus their costs of production, and it measures the benefit sellers get from participating in a market. Producer surplus can be computed by finding the area below the price and above the supply curve.? An allocation of resources that maximizes the sum of consumer and producer surplus is said to be efficient. Policymakers are often concerned with the efficiency, as well as the equality, of economic outcomes.? The equilibrium of supply and demand maximizes the sum of consumer and producer surplus.That is, the invisible hand of the marketplace leads buyers and sellers to allocate resources efficiently.? Markets do not allocate resources efficiently in the presence of market failures such as market power or externalities.CHAPTER OUTLINE:I. Definition of welfare economics: the study of how the allocation of resources affects economic well-being.A. Willingness to Pay1. Definition of willingness to pay: the maximum amount that a buyer will pay for a good.2. Example: You are auctioning a mint-condition recording of Elvis Presley’s first album. Four buyers show up. Their willingness to pay is as follows:for John. Because John is willing to pay more than he has to for the album,he derives some benefit from participating in the market.3. Definition of consumer surplus: the amount a buyer is willing to pay for a good minus the amount the buyer actually pays for it.4. Note that if you had more than one copy of the album, the price in the auction would end up being lower (a little over $70 in the case of two albums) and both John and Paul would gain consumer surplus.B. Using the Demand Curve to Measure Consumer Surplus1. We can use the information on willingness to pay to derive a demand curve for the rare2. . Because the demand curve shows the buyers’ willingness to pay, we can use the demand curve to measure consumer surplus.C. How a Lower Price Raises Consumer Surplusare paying less for the product than before (area A on the graph).b. Because the price is now lower, some new buyers will enter the market and receive consumer surplus on these additional units of output purchased (area B on the graph).D. What Does Consumer Surplus Measure?1. Remember that consumer surplus is the difference between the amount that buyers are willing to pay for a good and the price that they actually pay.2. Thus, it measures the benefit that consumers receive from the good as the buyers themselves perceive it.III. Producer SurplusA. Cost and the Willingness to Sell1. Definition of cost: the value of everything a seller must give up to produce a good .2. Example: You want to hire someone to paint your house. You accept bids for the work from four sellers. Each painter is willing to work if the price you will pay exceeds her opportunity cost. (Note that this opportunity cost thus represents willingness to sell.) The costs are: ALTERNATIVE CLASSROOM EXAMPLE:Review the material on price ceilings from Chapter 6. Redraw the market for two-bedroom apartments in your town. Draw in a price ceiling below the equilibriumprice.Then go through:✍ consumer surplus before the price ceiling is put into place.✍ consumer surplus after the price ceiling is put into place.You will need to take some time to explain the relationship between the producers’ willingness to sell and the cost of producing the good. The relationship between cost and the supply curve is not as apparent as the relationship between the demand curve and willingness to pay. It is important to stress that consumer surplus is measured in monetary terms. Consumer surplus gives us a way to place a monetary cost on inefficient market outcomes (due to government involvement or market failure).except for Grandma. Because Grandma receives more than she would require to paint the house, she derives some benefit from producing in the market.4.Definition of producer surplus: the amount a seller is paid for a good minus the seller’s cost of providing it.5. Note that if you had more than one house to paint, the price in the auction would end up being higher (a little under $800 in the case of two houses) and both Grandma and Georgia would gain producer surplus.B. Using the Supply Curve to Measure Producer Surplus1. We can use the information on cost (willingness to sell) to derive a supply curve for2. marginal seller . Because the supply curve shows the sellers’ cost (willingness to sell), we can use the supply curve to measure producer surplus.are receiving more for the product than before (area C on the graph).b. Because the price is now higher, some new sellers will enter the market and receive producer surplus on these additional units of output sold (area D on the graph).D. Producer surplus is used to measure the economic well-being of producers, much like consumer surplus is used to measure the economic well-being of consumers.ALTERNATIVE CLASSROOM EXAMPLE:Review the material on price floors from Chapter 6. Redraw the market for anagricultural product such as corn. Draw in a price support above the equilibriumprice.Then go through:✍ producer surplus before the price support is put in place.✍ producer surplus after the price support is put in place.Make sure that you discuss the cost of the price support to taxpayers.IV.Market EfficiencyA. The Benevolent Social Planner1. The economic well-being of everyone in society can be measured by total surplus, which is the sum of consumer surplus and producer surplus:Total Surplus = Consumer Surplus + Producer SurplusTotal Surplus = (Value to Buyers – Amount Paid by Buyers) +(Amount Received by Sellers – Cost to Sellers)Because the Amount Paid by Buyers = Amount Received bySellers:2. Definition of efficiency: the property of a resource allocation of maximizing the total surplus received by all members of society .3. Definition of equality: the property of distributing economic prosperity uniformly the members of society .a. Buyers who value the product more than the equilibrium price will purchase the product; those who do not, will not purchase the product. In other words, the free market allocates the supply of a good to the buyers who value it most highly, as measured by their willingness to pay.b. Sellers whose costs are lower than the equilibrium price will produce the product; those whose costs are higher, will not produce the product. In other words, the free market allocates the demand for goods to the sellers who can produce it at the lowest cost.to the marginal buyer is greater than the cost to the marginal seller so total surplus would rise if output increases.b. At any quantity of output greater than the equilibrium quantity, the value of the product to the marginal buyer is less than the cost to the marginal seller so total surplus would rise if output decreases.3. Note that this is one of the reasons that economists believe Principle #6: Markets are usually a good way to organize economic activity.It would be a good idea to remind students that there are circumstances whenthe market process does not lead to the most efficient outcome. Examplesinclude situations such as when a firm (or buyer) has market power over priceor when there are externalities present. These situations will be discussed inlater chapters.Pretty Woman, Chapter 6. Vivien (Julia Roberts) and Edward (Richard Gere)negotiate a price. Afterward, Vivien reveals she would have accepted a lowerprice, while Edward admits he would have paid more. If you have done a goodjob of introducing consumer and producer surplus, you will see the light bulbsgo off above your students’ heads as they watch this clip.C. In the News: Ticket Scalping1. Ticket scalping is an example of how markets work to achieve an efficient outcome.2. This article from The Boston Globe describes economist Chip Case’s experience with ticket scalping.D. Case Study: Should There Be a Market in Organs?1. As a matter of public policy, people are not allowed to sell their organs.a. In essence, this means that there is a price ceiling on organs of $0.b. This has led to a shortage of organs.2. The creation of a market for organs would lead to a more efficient allocation of resources, but critics worry about the equity of a market system for organs.V. Market Efficiency and Market FailureA. To conclude that markets are efficient, we made several assumptions about how markets worked.1. Perfectly competitive markets.2. No externalities.B. When these assumptions do not hold, the market equilibrium may not be efficient.C. When markets fail, public policy can potentially remedy the situation. SOLUTIONS TO TEXT PROBLEMS:Quick Quizzes1. Figure 1 shows the demand curve for turkey. The price of turkey is P1 and the consumer surplus that results from that price is denoted CS. Consumer surplus is the amount a buyer is willing to pay for a good minus the amount the buyer actually pays for it. It measures the benefit to buyers of participating in a market.Figure 1 Figure 22. Figure 2 shows the supply curve for turkey. The price of turkey is P1 and the producer surplus that results from that price is denoted PS. Producer surplus is the amount sellers are paid for a good minus the sellers’ cost of providing it (measured by the supply curve). It measures the benefit to sellers of participating in a market.Figure 33. Figure 3 shows the supply and demand for turkey. The price of turkey is P1, consumer surplus is CS, and producer surplus is PS. Producing more turkeys than the equilibrium quantity would lower total surplus because the value to the marginal buyer would be lower than the cost to the marginal seller on those additional units.Questions for Review1. The price a buyer is willing to pay, consumer surplus, and the demand curve are all closely related. The height of the demand curve represents the willingness to pay of the buyers. Consumer surplus is the area below the demand curve and above the price, which equals the price that each buyer is willing to pay minus the price actually paid.2. Sellers' costs, producer surplus, and the supply curve are all closely related. The height of the supply curve represents the costs of the sellers. Producer surplus is the area below the price and above the supply curve, which equals the price received minus each seller's costs of producing the good.Figure 43. Figure 4 shows producer and consumer surplus in a supply-and-demand diagram.4. An allocation of resources is efficient if it maximizes total surplus, the sum of consumer surplus and producer surplus. But efficiency may not be the only goal of economic policymakers; they may also be concerned about equity the fairness of the distribution of well-being.5. The invisible hand of the marketplace guides the self-interest of buyers and sellers into promoting general economic well-being. Despite decentralized decision making and self-interested decision makers, free markets often lead to an efficient outcome.6. Two types of market failure are market power and externalities. Market power may cause market outcomes to be inefficient because firms may cause price and quantity to differ from the levels they would be under perfect competition, which keeps total surplus from being maximized. Externalities are side effects that are not taken into account by buyers and sellers. As a result, the free market does not maximize total surplus.Problems and Applications1. a. Consumer surplus is equal to willingness to pay minus the price paid. Therefore, Melissa’s willingness to pay must be $200 ($120 + $80).b. Her consumer surplus at a price of $90 would be $200 ? $90 = $110.c. If the price of an iPod was $250, Melissa would not have purchased one because the price is greater than her willingness to pay. Therefore, she would receive no consumer surplus.2. If an early freeze in California sours the lemon crop, the supply curve for lemons shifts to the left, as shown in Figure 5. The result is a rise in the price of lemons and a decline in consumer surplus from A + B + C to just A. So consumer surplus declines by the amount B + C.Figure 5 Figure 6In the market for lemonade, the higher cost of lemons reduces the supply of lemonade, as shown in Figure 6. The result is a rise in the price of lemonade and a decline in consumer surplus from D + E + F to just D, a loss of E + F. Note that an event that affects consumer surplus in one market often has effects on consumer surplus in other markets.3. A rise in the demand for French bread leads to an increase in producer surplus in the market for French bread, as shown in Figure 7. The shift of the demand curve leads to an increased price, which increases producer surplus from area A to area A + B + C.Figure 7The increased quantity of French bread being sold increases the demand for flour, as shown in Figure 8. As a result, the price of flour rises, increasing producer surplus from area Dto D + E + F. Note that an event that affects producer surplus in one market leads to effects on producer surplus in related markets.Figure 84. a.Figure 9b. When the price of a bottle of water is $4, Bert buys two bottles of water. His consumer surplus is shown as area A in the figure. He values his first bottle of water at $7, but pays only $4 for it, so has consumer surplus of $3. He values his second bottle of water at $5, but pays only $4for it, so has consumer surplus of $1. Thus Bert’s total consumer surplus is $3 + $1 = $4, which is the area of A in the figure.c. When the price of a bottle of water falls from $4 to $2, Bert buys three bottles of water, an increase of one. His consumer surplus consists of both areas A and B in the figure, an increase in the amount of area B. He gets consumer surplus of $5 from the first bottle ($7 value minus $2 price), $3 from the second bottle ($5 value minus $2 price), and $1 from the third bottle ($3 value minus $2 price), for a total consumer surplus of $9. Thus consumer surplus rises by $5 (which is the size of area B) when the price of a bottle of water falls from $4 to $2.5. a.Figure 10b. When the price of a bottle of water is $4, Ernie sells two bottles of water. His producer surplus is shown as area A in the figure. He receives $4 for his first bottle of water, but it costs only $1 to produce, so Ernie has producer surplus of $3. He also receives $4 for his second bottle of water, which costs $3 to produce, so he has producer surplus of $1. Thus Ernie’s total producer surplus is $3 + $1 = $4, which is the area of A in the figure.c. When the price of a bottle of water rises from $4 to $6, Ernie sells three bottles of water, an increase of one. His producer surplus consists of both areas A and B in the figure, an increase by the amount of area B. He gets producer surplus of $5 from the first bottle ($6 price minus $1 cost), $3 from the second bottle ($6 price minus $3 cost), and $1 from the third bottle ($6 price minus $5 price), for a total producer surplus of $9. Thus producer surplus rises by $5 (which is the size of area B) when the price of a bottle of water rises from $4 to $6.6. a. From Ernie’s supply schedule and Bert’s demand schedule, the quantityequilibrium quantity of two.b. At a price of $4, consumer surplus is $4 and producer surplus is $4, as shown in Problems 3 and 4 above. Total surplus is $4 + $4 = $8.c. If Ernie produced one less bottle, his producer surplus would decline to $3, as shown in Problem 4 above. If Bert consumed one less bottle, his consumer surplus would decline to $3, as shown in Problem 3 above. So total surplus would decline to $3 + $3 = $6.d. If Ernie produced one additional bottle of water, his cost would be $5, but the price is only $4, so his producer surplus would decline by $1. If Bert consumed one additional bottle of water, his value would be $3, but the price is $4, so his consumer surplus would decline by $1. So total surplus declines by $1 + $1 = $2.7. a. The effect of falling production costs in the market for stereos results in a shift to the right in the supply curve, as shown in Figure 11. As a result, the equilibrium price of stereos declines and the equilibrium quantity increases.Figure 11b. The decline in the price of stereos increases consumer surplus from area A to A + B + C + D, an increase in the amount B + C + D. Prior to the shift in supply, producer surplus was areas B + E (the area above the supply curve and below the price). After the shift in supply, producer surplus is areas E + F + G. So producer surplus changes by the amount F + G – B, which may be positive or negative. The increase in quantity increases producer surplus, while the decline in the price reduces producer surplus. Because consumer surplus rises by B + C + D and producer surplus rises by F + G – B, total surplus rises by C + D + F + G.c. If the supply of stereos is very elastic, then the shift of the supply curve benefits consumers most. To take the most dramatic case, suppose the supply curve were horizontal, as shown in Figure 12. Then there is no producer surplus at all. Consumers capture all the benefits of falling production costs, with consumer surplus rising from area A to area A + B.Figure 128. Figure 13 shows supply and demand curves for haircuts. Supply equals demand at a quantity of three haircuts and a price between $4 and $5. Firms A, C, and D should cut the hair of Ellen, Jerry, and Phil. Oprah’s willingness to pay is too low and firm B’s costs are too high, so they do not participate. The maximum total surplus is the area between the demand and supply curves, which totals $11 ($8 value minus $2 cost for the first haircut, plus $7 value minus $3 cost for the second, plus $5 value minus $4 cost for the third).Figure 139. a. The effect of falling production costs in the market for computers results in a shift to the right in the supply curve, as shown in Figure 14. As a result, the equilibrium price of computers declines and the equilibrium quantity increases. The decline in the price of computers increases consumer surplus from area A to A + B + C + D, an increase in the amount B + C + D.Figure 14 Figure 15Prior to the shift in supply, producer surplus was areas B + E (the area above thesupply curve and below the price). After the shift in supply, producer surplus isareas E + F + G. So producer surplus changes by the amount F + G – B, whichmay be positive or negative. The increase in quantity increases producer surplus,while the decline in the price reduces producer surplus. Because consumer surplusrises by B + C + D and producer surplus rises by F + G – B, total surplus rises byC +D + F + G.b. Because typewriters are substitutes for computers, the decline in the price of computers means that people substitute computers for typewriters, shifting the demand for typewriters to the left, as shown in Figure 15. The result is a decline in both the equilibrium price and equilibrium quantity of typewriters. Consumer surplus in the typewriter market changes from area A + B to A + C, a net change of C – B. Producer surplus changes from area C + D + E to area E, a net loss of C + D. Typewriter producers are sad about technological advances in computers because their producer surplus declines.c. Because software and computers are complements, the decline in the price and increase in the quantity of computers means that the demand for software increases, shifting the demand for software to the right, as shown in Figure 16. The result is an increase in both the price and quantity of software. Consumer surplus in the software market changes from B + C to A + B, anet change of A – C. Producer surplus changes from E to C + D + E, an increase of C + D, so software producers should be happy about the technological progress in computers.Figure 16d. Yes, this analysis helps explain why Bill Gates is one the world’s richest people, because his company produces a lot of software that is a complement with computers and there has been tremendous technological advance in computers.10. a. With Provider A, the cost of an extra minute is $0. With Provider B, the cost of anextra minute is $1.b. With Provider A, my friend will purchase 150 minutes [= 150 – (50)(0)]. WithProvider B, my friend would purchase 100 minutes [= 150 – (50)(1)].c. With Provider A, he would pay $120. The cost would be $100 with Provider B.Figure 17d. Figure 17 shows the friend’s demand. With Provider A, he buys 150 minutes andhis consumer surplus is equal to (1/2)(3)(150) – 120 = 105. With Provider B, hisconsumer surplus is equal to (1/2)(2)(100) = 100.e. I would recommend Provider A because he receives greater consumer surplus.11. a. Figure 18 illustrates the demand for medical care. If each procedure has a price of $100, quantity demanded will be Q1 procedures.Figure 18b. If consumers pay only $20 per procedure, the quantity demanded will be Q2 procedures. Because the cost to society is $100, the number of procedures performed is too large to maximize total surplus. The quantity that maximizes total surplus is Q1 procedures, which is less than Q2.c. The use of medical care is excessive in the sense that consumers get procedures whose value is less than the cost of producing them. As a result, the economy’s total surplus is reduced.d. To prevent this excessive use, the consumer must bear the marginal cost of the procedure. But this would require eliminating insurance. Another possibility would be that the insurance company, which pays most of the marginal cost of the procedure ($80, in this case) could decide whether the procedure should be performed. But the insurance company does not get the benefits of the procedure, so its decisions may not reflect the value to the consumer.。
曼昆宏观经济学最新英文版参考答案第25章
Chapter 25Problems and Applications1. The facts that countries import many goods and services yet must produce a large quantity ofgoods and services themselves to enjoy a high standard of living are reconciled by noting that there are substantial gains from trade. In order to be able to afford to purchase goods from othercountries, an economy must generate income. By producing many goods and services, then trading them for goods and services produced in other countries, a nation maximizes its standard of living.2. a. More investment would lead to faster economic growth in the short run.b. The change would benefit many people in society who would have higher incomes as theresult of faster economic growth. However, there might be a transition period in whichworkers and owners in consumption-good industries would get lower incomes, andworkers and owners in investment-good industries would get higher incomes. In addition,some group would have to reduce their spending for some time so that investment couldrise.3. a. Private consumption spending includes buying food and buying clothes; private investmentspending includes people buying houses and firms buying computers. Many otherexamples are possible. Education can be considered as both consumption and investment.b. Government consumption spending includes paying workers to administer governmentprograms; government investment spending includes buying military equipment andbuilding roads. Many other examples are possible. Government spending on healthprograms is an investment in human capital. This is truer for spending on health programsfor the young rather than those for the elderly.4. The opportunity cost of investing in capital is the loss of consumption that results from redirectingresources toward investment. Over-investment in capital is possible because of diminishingmarginal returns. A country can "over-invest" in capital if people would prefer to have higherconsumption spending and less future growth. The opportunity cost of investing in human capital is also the loss of consumption that is needed to provide the resources for investment. A countrycould "over-invest" in human capital if people were too highly educated for the jobs they couldget for example, if the best job a Ph.D. in philosophy could find is managing a restaurant.5. a. When a German firm opens a factory in South Carolina, it represents foreign directinvestment.b. The investment increases U.S. GDP because it increases production in the United States.The effect on U.S. GNP would be smaller because the owners would get paid a return ontheir investment that would be part of German GNP rather than U.S. GNP.6. a. The United States benefited from the Japanese investment because it made our capitalstock larger, increasing our economic growth.b. It would have been better for the United States to make the investments itself becausethen it would have received the returns on the investment itself, instead of the returnsgoing to Japan.7. Greater educational opportunities for women could lead to faster economic growth in the countriesof South Asia because increased human capital would increase productivity and there would beexternal effects from greater knowledge in the country. Second, increased educational1Chapter 25/Production and Growth 2opportunities for young women may lower the population growth rate because such opportunities raise the opportunity cost of having a child.8. a. Individuals with higher incomes have better access to clean water, medical care, and goodnutrition.b. Healthier individuals are likely to be more productive.c. Understanding the direction of causation will help policymakers place proper emphasis onthe programs that will achieve both greater health and higher incomes.9. a. Political stability could lead to strong economic growth by making the country attractive toinvestors. The increased investment would raise economic growth.b. Strong economic growth could lead to political stability because when people have highincomes they tend to be satisfied with the political system and are less likely to overthrowor change the government.10. a. If output is rising and the number of workers is declining, then output per worker must berising.b. Policymakers should not be concerned as long as output in the manufacturing sector is notdeclining. The reduction in manufacturing jobs will allow labor resources to move to otherindustries, increasing total output in the economy. An increase in productivity of workers(as measured by output per worker) is beneficial to the economy.。
曼昆经济学原理英文版习题答案35章THE SHORT-RUN TRADE-OFF BETWEEN INFLATION AND UNEMPLOYMENT
WHAT’S NEW IN THE SEVENTH EDITION:The section on ”A Financial Crisis Takes Us for a Ride Along t he Phillips Curve” has been updated.LEARNING OBJECTIVES:By the end of this chapter, students should understand:why policymakers face a short-run trade-off between inflation and unemployment.why the inflation-unemployment trade-off disappears in the long run.how supply shocks can shift the inflation-unemployment trade-off.the short-run cost of reducing inflation.how policymakers’ credibility might affect the cost of reducing inflation.CONTEXT AND PURPOSE:Chapter 22 is the final chapter in a three-chapter sequence on the economy’s short-run fluctuations around its long-term trend. Chapter 20 introduced aggregate supply and aggregate demand. Chapter 21 developed how monetary and fiscal policies affect aggregate demand. Both Chapters 20 and 21 addressed the relationship between the price level and output. Chapter 22 will concentrate on a similar relationship between inflation and unemployment.The purpose of Chapter 22 is to trace the history of economists’ thinking about the relationship between inflation and unemployment. Students will see why there is a temporary trade-off between inflation and unemployment, and why there is no permanent trade-off. This result is an extension of the results produced by the model of aggregate supply and aggregate demand where a change in the price level induced by a change in aggregate demand temporarily alters output but has no permanent impact on output.389390❖Chapter 22/The Short-Run Trade-off between Inflation and UnemploymentKEY POINTS:∙ The Phillips curve describes a negative relationship between inflation and unemployment. By expanding aggregate demand, policymakers can choose a point on the Phillips curve with higher inflation and lower unemployment. By contracting aggregate demand, policymakers can choose apoint on the Phillips curve with lower inflation and higher unemployment.∙ The trade-off between inflation and unemployment described by the Phillips curve holds only in the short run. In the long run, expected inflation adjusts to changes in actual inflation, and the short-run Phillips curve shifts. As a result, the long-run Phillips curve is vertical at the natural rate ofunemployment.∙ The short-run Phillips curve also shifts because of shocks to aggregate supply. An adverse supply shock, such as an increase in world oil prices, gives policymakers a less favorable trade-off between inflation and unemployment. That is, after an adverse supply shock, policymakers have to accept a higher rate of inflation for any given rate of unemployment, or a higher rate of unemployment for any given rate of inflation.∙ When the Fed contracts growth in the money supply to reduce inflation, it moves the economy along the short-run Phillips curve, which results in temporarily high unemployment. The cost of disinflation depends on how quickly expectations of inflation fall. Some economists argue that a crediblecommitment to low inflation can reduce the cost of disinflation by inducing a quick adjustment of expectations.CHAPTER OUTLINE:I. The Phillips CurveA. Origins of the Phillips Curve1. In 1958, economist A. W. Phillips published an article discussing the negative correlationbetween inflation rates and unemployment rates in the United Kingdom.2. American economists Paul Samuelson and Robert Solow showed a similar relationshipbetween inflation and unemployment for the United States two years later.3. The belief was that low unemployment is related to high aggregate demand, and highaggregate demand puts upward pressure on prices. Likewise, high unemployment is relatedto low aggregate demand, and low aggregate demand pulls price levels down.4. Definition of Phillips curve: a curve that shows the short-run trade-off betweeninflation and unemployment.Chapter 22/The Short-Run Trade-off between Inflation and Unemployment❖ 3915. Samuelson and Solow believed that the Phillips curve offered policymakers a menu ofpossible economic outcomes. Policymakers could use monetary and fiscal policy to chooseany point on the curve.B. Aggregate Demand, Aggregate Supply, and the Phillips Curve1. The Phillips curve shows the combinations of inflation and unemployment that arise in theshort run as shifts in the aggregate-demand curve move the economy along the short-runaggregate-supply curve.2. The greater the aggregate demand for goods and services, the greater the economy’s outputand the higher the price level. Greater output means lower unemployment. The higher theprice level in the current year, the higher the rate of inflation.3. Example: The price level is 100 (measured by the Consumer Price Index) in the year 2020.There are two possible changes in the economy for the year 2021: a low level of aggregatedemand or a high level of aggregate demand.a. If the economy experiences a low level of aggregate demand, we would be at a short-run equilibrium like point A. This point also corresponds with point A on the Phillips curve.Note that when aggregate demand is low, the inflation rate is relatively low and theunemployment rate is relatively high.b. If the economy experiences a high level of aggregate demand, we would be at a short-run equilibrium like point B. This point also corresponds with point B on the Phillips curve.Note that when aggregate demand is high, the inflation rate is relatively high and theunemployment rate is relatively low.392❖Chapter 22/The Short-Run Trade-off between Inflation and Unemployment Figure 24. Because monetary and fiscal policies both shift the aggregate-demand curve, these policiescan move the economy along the Phillips curve.a. Increases in the money supply, increases in government spending, or decreases in taxesall increase aggregate demand and move the economy to a point on the Phillips curvewith lower unemployment and higher inflation.b. Decreases in the money supply, decreases in government spending, or increases in taxesall lower aggregate demand and move the economy to a point on the Phillips curve withhigher unemployment and lower inflation.II. Shifts in the Phillips Curve: The Role of ExpectationsA. The Long-Run Phillips Curve1. In 1968, economist Milton Friedman argued that monetary policy is only able to choose acombination of unemployment and inflation for a short period of time. At the same time,economist Edmund Phelps wrote a paper suggesting the same thing.2. In the long run, monetary growth has no real effects. This implies that it cannot affect thefactors that determine the economy’s long-run unemployment rate.Chapter 22/The Short-Run Trade-off between Inflation and Unemployment ❖ 3933. Thus, in the long run, we would not expect there to be a relationship between unemployment and inflation. This must mean that, in the long run, the Phillips curve is vertical.4. The vertical Phillips curve occurs because, in the long run, the aggregate supply curve is vertical as well. Thus, increases in aggregate demand lead only to changes in the price leveland have no effect on the economy’s level of output. Thus, in the long run, unemployment will not change when aggregate demand changes, but inflation will.5. The long-run aggregate-supply curve occurs at the economy’s natural level of output. Thismeans that the long-run Phillips curve occurs at the natural rate of unemployment.394❖Chapter 22/The Short-Run Trade-off between Inflation and UnemploymentB. The Meaning of “Natural”1. Friedman and Phelps considered the natural rate of unemployment to be the rate towardwhich the economy gravitates in the long run.2. The natural rate of unemployment may not be the socially desirable rate of unemployment.3. The natural rate of unemployment may change over time.C. Reconciling Theory and Evidence1. The conclusion of Friedman and Phelps that there is no long-run trade-off between inflationand unemployment was based on theory, while the correlation between inflation andunemployment found by Phillips, Samuelson, and Solow was based on actual evidence.2. Friedman and Phelps believed that an inverse relationship between inflation andunemployment exists in the short run.3. The long-run aggregate-supply curve is vertical, indicating that the price level does notinfluence output in the long run.4. But, the short-run aggregate-supply curve is upward sloping because of misperceptionsabout relative prices, sticky wages, and sticky prices. These perceptions, wages, and pricesadjust over time, so that the positive relationship between the price level and the quantity ofgoods and services supplied occurs only in the short run.5. This same logic applies to the Phillips curve. The trade-off between inflation andunemployment holds only in the short run.6. The expected level of inflation is an important factor in understanding the difference betweenthe long-run and the short-run Phillips curves. Expected inflation measures how much peopleexpect the overall price level to change.7. The expected rate of inflation is one variable that determines the position of the short-runaggregate-supply curve. This is true because the expected price level affects the perceptionsof relative prices that people form and the wages and prices that they set.8. In the short run, expectations are somewhat fixed. Thus, when the Fed increases the moneysupply, aggregate demand increases along the upward sloping short-run aggregate-supplycurve. Output grows (unemployment falls) and the price level rises (inflation increases).9. Eventually, however, people will respond by changing their expectations of the price level.Specifically, they will begin expecting a higher rate of inflation.Chapter 22/The Short-Run Trade-off between Inflation and Unemployment ❖ 395D. The Short-Run Phillips Curve1. We can relate the actual unemployment rate to the natural rate of unemployment, the actual inflation rate, and the expected inflation rate using the following equation:a. Because expected inflation is already given in the short run, higher actual inflation leadsto lower unemployment.b. How much unemployment changes in response to a change in inflation is determined by the variable a, which is related to the slope of the short-run aggregate-supply curve.2. If policymakers want to take advantage of the short-run trade-off between unemployment and inflation, it may lead to negative consequences.a. Suppose the economy is at point A and policymakers wish to lower the unemploymentrate. Expansionary monetary policy or fiscal policy is used to shift aggregate demand tothe right. The economy moves to point B, with a lower unemployment rate and a higherrate of inflation.b. Over time, people get used to this new level of inflation and raise their expectations ofinflation. This leads to an upward shift of the short-run Phillips curve. The economy ends up at point C, with a higher inflation rate than at point A, but the same level ofunemployment.396 ❖ Chapter 22/The Short-Run Trade-off between Inflation and UnemploymentE. The Natural Experiment for the Natural-Rate Hypothesis1. Definition of the natural-rate hypothesis: the claim that unemployment eventually returns to its normal, or natural rate, regardless of the rate of inflation .2. Figure 6 shows the unemployment and inflation rates from 1961 to 1968. It is easy to see the inverse relationship between these two variables.3. Beginning in the late 1960s, the government followed policies that increased aggregate demand.a. Government spending rose because of the Vietnam War.b. The Fed increased the money supply to try to keep interest rates down.4. As a result of these policies, the inflation rate remained fairly high. However, even thoughinflation remained high, unemployment did not remain low.a. Figure 7 shows the unemployment and inflation rates from 1961 to 1973. The simple inverse relationship between these two variables began to disappear around 1970.b. Inflation expectations adjusted to the higher rate of inflation and the unemployment rate returned to its natural rate of around 5% to 6%.III. Shifts in the Phillips Curve: The Role of Supply ShocksA. In 1974, OPEC increased the price of oil sharply. This increased the cost of producing many goods and services and therefore resulted in higher prices.1. Definition of supply shock : an event that directly alters firms’ costs and prices,shifting the economy’s aggregate -supply curve and thus the Phillips curve .2. Graphically, we could represent this supply shock as a shift in the short-run aggregate-supplycurve to the left.3. The decrease in equilibrium output and the increase in the price level left the economy with stagflation.Chapter 22/The Short-Run Trade-off between Inflation and Unemployment ❖ 397B. Given this turn of events, policymakers are left with a less favorable short-run trade-off between unemployment and inflation.1. If they increase aggregate demand to fight unemployment, they will raise inflation further.2. If they lower aggregate demand to fight inflation, they will raise unemployment further. C. This less favorable trade-off between unemployment and inflation can be shown by a shift of theshort-run Phillips curve. The shift may be permanent or temporary, depending on how people adjust their expectations of inflation.D. During the 1970s, the Fed decided to accommodate the supply shock by increasing the supply of money. This increased the level of expected inflation. Figure 9 shows inflation and unemploymentin the United States during the late 1970s and early 1980s.IV. The Cost of Reducing InflationA. The Sacrifice Ratio1. To reduce the inflation rate, the Fed must follow contractionary monetary policy.a. When the Fed slows the rate of growth of the money supply, aggregate demand falls.b. This reduces the level of output in the economy, increasing unemployment.c. The economy moves from point A along the short-run Phillips curve to point B, which hasa lower inflation rate but a higher unemployment rate.Price Unemployment Rate398❖Chapter 22/The Short-Run Trade-off between Inflation and Unemploymentd. Over time, people begin to adjust their inflation expectations downward and the short-run Phillips curve shifts. The economy moves from point B to point C, where inflation islower and the unemployment rate is back to its natural rate.2. Therefore, to reduce inflation, the economy must suffer through a period of highunemployment and low output.3. Definition of sacrifice ratio: the number of percentage points of annual output lostin the process of reducing inflation by one percentage point.4. A typical estimate of the sacrifice ratio is five. This implies that for each percentage pointinflation is decreased, output falls by 5%.B. Rational Expectations and the Possibility of Costless Disinflation1. Definition of rational expectations: the theory according to which people optimallyuse all the information they have, including information about governmentpolicies, when forecasting the future.2. Proponents of rational expectations believe that when government policies change, peoplealter their expectations about inflation.3. Therefore, if the government makes a credible commitment to a policy of low inflation,people would be rational enough to lower their expectations of inflation immediately. Thisimplies that the short-run Phillips curve would shift quickly without any extended period ofhigh unemployment.C. The Volcker Disinflation1. Figure 11 shows the inflation and unemployment rates that occurred while Paul Volckerworked at reducing the level of inflation during the 1980s.2. As inflation fell, unemployment rose. In fact, the United States experienced its deepest recession since the Great Depression.3. Some economists have offered this as proof that the idea of a costless disinflation suggested by rational-expectations theorists is not possible. However, there are two reasons why we might not want to reject the rational-expectations theory so quickly.a. The cost (in terms of lost output) of the Volcker disinflation was not as large as many economists had predicted.b. While Volcker promised that he would fight inflation, many people did not believe him.Few people thought that inflation would fall as quickly as it did; this likely kept the short-run Phillips curve from shifting quickly.D. The Greenspan Era1. Figure 12 shows the inflation and unemployment rate from 1984 to 2005, called the Greenspan era because Alan Greenspan became the chairman of the Federal Reserve in 1987.2. In 1986, OPEC’s agreement with its members b roke down and oil prices fell. The result of this favorable supply shock was a drop in both inflation and unemployment.3. The rest of the 1990s witnessed a period of economic prosperity. Inflation gradually dropped, approaching zero by the end of the decade. Unemployment also reached a low level, leadingmany people to believe that the natural rate of unemployment had fallen.4. The economy ran into problems in 2001 due to the end of the dot-com stock market bubble,the 9-11 terrorist attacks, and corporate accounting scandals that reduced aggregate demand. Unemployment rose as the economy experienced its first recession in a decade.5. But a combination of expansionary monetary and fiscal policies helped end the downturn,and by early 2005, the unemployment rate was close to the estimated natural rate.6. In 2005, President Bush nominated Ben Bernanke as the Fed chairman. E. A Financial Crisis Takes Us for a Ride Along the Phillips Curve1. In his first couple of years as Fed chairman, Bernanke faced some significant economicchallenges.a. One challenge arose from problems in the housing and financial markets.b. The resulting financial crisis led to a large drop in aggregate demand and high rates of unemployment.c. Figure 13 shows the implications of these events for inflation and unemployment.d. From 2007 to 2009, as the decline in aggregate demand raised unemployment, it alsoreduced the inflation rate from about 3 percent to about 1 percent.e. From 2010 to 2012, unemployment fell and the inflation rate rose from about 1 percentto about 2 percent.f. In essence, the economy first rode down the Phillips curve and then rode back up.g. Note that expected inflation and the position of the short-run Phillips curve wererelatively stable during this period.SOLUTIONS TO TEXT PROBLEMS:Quick Quizzes1. The Phillips curve is shown in Figure 1.Figure 1To see how policy can move the economy from a point with high inflation to a point with lowinflation, suppose the economy begins at point A in Figure 2. If policy is used to reduceaggregate demand (such as a decrease in the money supply or a decrease in governmentpurchases), the aggregate-demand curve shifts from AD1 to AD2, and the economy movesfrom point A to point B with lower inflation, a reduction in real GDP, and an increase in theunemployment rate.Figure 22. Figure 3 shows the short-run Phillips curve and the long-run Phillips curve. The curves aredifferent because in the long run, monetary policy has no effect on unemployment, which tends toward its natural rate. However, in the short run, monetary policy can affect the unemployment rate. An increase in the growth rate of money raises actual inflation above expected inflation, causing firms to produce more since the short-run aggregate supply curve is positively sloped, which reduces unemployment temporarily.Figure 33. Examples of favorable shocks to aggregate supply include improved productivity and adecline in oil prices. Either shock shifts the aggregate-supply curve to the right, increasing output and reducing the price level, moving the economy from point A to point B in Figure 4.As a result, the Phillips curve shifts to the left, as the figure shows.Figure 44. The sacrifice ratio is the number of percentage points of annual output lost in the process ofreducing inflation by 1 percentage point. The credibility of the Fed’s commitment to reduceinflation might affect the sacrifice ratio because it affects the speed at which expectations ofinflati on adjust. If the Fed’s commitment to reduce inflation is credible, people will reducetheir expectations of inflation quickly, the short-run Phillips curve will shift downward, andthe cost of reducing inflation will be low in terms of lost output. But if the Fed is not credible,people will not reduce their expectations of inflation quickly, and the cost of reducinginflation will be high in terms of lost output.Questions for ReviewFigure 51. Figure 5 shows the short-run trade-off between inflation and unemployment. The Fed canmove the economy from one point on this curve to another by changing the money supply.An increase in the money supply reduces the unemployment rate and increases the inflation rate, while a decrease in the money supply increases the unemployment rate and decreases the inflation rate.Figure 62. Figure 6 shows the long-run trade-off between inflation and unemployment. In the long run,there is no trade-off, as the economy must return to the natural rate of unemployment on the long-run Phillips curve. In the short run, the economy can move along a short-run Phillips curve, like SRPC1 shown in the figure. But over time (as inflation expectations adjust) the short-run Phillips curve will shift to return the economy to the long-run Phillips curve, for example shifting from SRPC1 to SRPC2.3. The natural rate of unemployment is natural because it is beyond the influence of monetarypolicy. The rate of unemployment will move to its natural rate in the long run, regardless of the inflation rate.The natural rate of unemployment might differ across countries because countries havevarying degrees of union power, minimum-wage laws, collective-bargaining laws,unemployment insurance, job-training programs, and other factors that influence labor-market conditions.4. If a drought destroys farm crops and drives up the price of food, the short-run aggregate-supply curve shifts to the left and the short-run Phillips curve shifts to the right, because the costs of production have increased. The higher short-run Phillips curve means the inflation rate will be higher for any given unemployment rate.5. When the Fed decides to reduce inflation, the economy moves down along the short-runPhillips curve, as shown in Figure 7. Beginning at point A on short-run Phillips curve SRPC1, the economy moves down to point B as inflation declines. Once people's expectations adjust to the lower rate of inflation, the short-run Phillips curve shifts to SRPC2, and the economy moves to point C. The short-run costs of disinflation, which arise because the unemployment rate is temporarily above its natural rate, could be reduced if the Fed's action was credible, so that expectations would adjust more rapidly.Figure 7Quick Check Multiple Choice1. b2. d3. c4. a5. b6. dProblems and Applications1. Figure 8 shows two different short-run Phillips curves depicting these four points. Points aand d are on SRPC1 because both have expected inflation of 3%. Points b and c are onSRPC2 because both have expected inflation of 5%.Figure 82. a. A rise in the natural rate of unemployment shifts both the long-run Phillips curve and theshort-run Phillips curve to the right, as shown in Figure 9. The economy is initially onLRPC1 and SRPC1 at an inflation rate of 3%, which is also the expected rate of inflation.The increase in the natural rate of unemployment shifts the long-run Phillips curve toLRPC2 and the short-run Phillips curve to SRPC2, with the expected rate of inflationremaining equal to 3%.Figure 9b. A decline in the price of imported oil shifts the short-run Phillips curve to the left, asshown in Figure 10, from SRPC1 to SRPC2. For any given unemployment rate, theinflation rate is lower, because oil is such a significant aspect of production costs in the economy.Figure 10c. A rise in government spending represents an increase in aggregate demand, so it movesthe economy along the short-run Phillips curve, as shown in Figure 11. The economy moves from point A to point B, with a decline in the unemployment rate and an increase in the inflation rate.Figure 11d. A decline in expected inflation causes the short-run Phillips curve to shift to the left, asshown in Figure 12. The lower rate of expected inflation shifts the short-run Phillips curve from SRPC1 to SRPC2.Figure 12Figure 133. a. Figure 13 shows how a reduction in consumer spending causes a recession in both anaggregate-supply/aggregate-demand diagram and a Phillips-curve diagram. In bothdiagrams, the economy begins at full employment at point A. The decline in consumerspending reduces aggregate demand, shifting the aggregate-demand curve to the leftfrom AD1 to AD2. The economy initially remains on the short-run aggregate-supply curve AS1, so the new equilibrium occurs at point B. The movement of the aggregate-demand curve along the short-run aggregate-supply curve leads to a movement along short-run Phillips curve SRPC1, from point A to point B. The lower price level in the aggregate-supply/aggregate-demand diagram corresponds to the lower inflation rate in the Phillips-curve diagram. The lower level of output in the aggregate-supply/aggregate-demanddiagram corresponds to the higher unemployment rate in the Phillips-curve diagram.b. As expected inflation falls over time, the short-run aggregate-supply curve shifts to theright from AS1 to AS2, and the short-run Phillips curve shifts to the left from SRPC1 toSRPC2. In both diagrams, the economy eventually gets to point C, which is back on thelong-run aggregate-supply curve and long-run Phillips curve. After the recession is over, the economy faces a better set of inflation-unemployment combinations.Figure 144. a. Figure 14 shows the economy in long-run equilibrium at point a, which is on both thelong-run and short-run Phillips curves.b. A wave of business pessimism reduces aggregate demand, moving the economy to pointb in the figure. The unemployment rate increases and the inflation rate declines. If theFed undertakes expansionary monetary policy, it can increase aggregate demand,offsetting the pessimism and returning the economy to point a, with the initial inflationrate and unemployment rate.c. Figure 15 shows the effects on the economy if the price of imported oil rises. The higherprice of imported oil shifts the short-run Phillips curve to the right from SRPC1 to SRPC2.The economy moves from point a to point c, with a higher inflation rate and higherunemployment rate. If the Fed engages in expansionary monetary policy, it can returnthe economy to its original unemployment rate at point d, but the inflation rate will behigher. If the Fed engages in contractionary monetary policy, it can return the economy to its original inflation rate at point e, but the unemployment rate will be higher. Thissituation differs from that in part (b) because in part (b) the economy stayed on thesame short-run Phillips curve, but in part (c) the economy moved to a higher short-runPhillips curve, which gives policymakers a less favorable trade-off between inflation and unemployment.。
曼昆微观经济学英文版课后练习题第一章知识交流

曼昆微观经济学英文版课后练习题第一章知识交流Chapter 1Ten Principles of EconomicsMultiple Choice1. The word that comes from the Greek word for "one who manages a household" isa. market.b. consumer.c. producer.d. economy.ANS: D DIF: 1 REF: 1-0TOP: Economy MSC: Definitional2. The word “economy” comes from the Greek word oikonomos, which meansa. “environment.”b. “production.”c. “one who manages a household.”d. “one who makes decisions.”ANS: C DIF: 1 REF: 1-0TOP: Economy MSC: Definitional3. Resources area. scarce for households but plentiful for economies.b. plentiful for households but scarce for economies.c. scarce for households and scarce for economies.d. plentiful for households and plentiful for economies.ANS: C DIF: 1 REF: 1-0TOP: Resources, Scarcity MSC: Interpretive4. Economics deals primarily with the concept ofa. scarcity.b. poverty.c. change.d. power.ANS: A DIF: 1 REF: 1-0TOP: Scarcity MSC: Definitional5. Which of the following questions is not answered by the decisions that every society must make?a. What determines consumer preferences?b. What goods will be produced?c. Who will produce the goods?d. Who will consume the goods?ANS: A DIF: 2 REF: 1-0TOP: Economies MSC: Interpretive6. The overriding reason as to why households and societies face many decisions is thata. resources are scarce.b. goods and services are not scarce.c. incomes fluctuate with business cycles.d. people, by nature, tend to disagree.ANS: A DIF: 2 REF: 1-0TOP: Scarcity MSC: Interpretive7. The phenomenon of scarcity stems from the fact thata. most economies’ production methods are not very good.b. in most economies, wealthy people consume disproportionate quantities of goods and services.c. governments restricts production of too many goods and services.d. resources are limited.ANS: D DIF: 2 REF: 1-0TOP: Scarcity MSC: Interpretive8. Approximately what percentage of the world's economies experience scarcity?a. 25%b. 50%c. 75%d. 100%ANS: D DIF: 1 REF: 1-0TOP: Scarcity MSC: Interpretive9. When a society cannot produce all the goods and services people wish to have, it is said that the economy isexperiencinga. scarcity.b. shortages.c. inefficiencies.d. inequities.ANS: A DIF: 2 REF: 1-0TOP: Scarcity MSC: Interpretive10. For society, a good is not scarce ifa. at least one individual in society can obtain all he or she wants of the good.b. firms are producing the good at full capacity.c. all members of society can have all they want of the good.d. those who have enough income can buy all they want of the good.ANS: C DIF: 1 REF: 1-0TOP: Scarcity MSC: Interpretive11. Which of the following products would be consideredscarce?a. golf clubsb. Picasso paintingsc. applesd. All of the above are correct.ANS: D DIF: 2 REF: 1-0TOP: Scarcity MSC: Interpretive12. Economics is the study ofa. production methods.b. how society manages its scarce resources.c. how households decide who performs which tasks.d. the interaction of business and government.ANS: B DIF: 1 REF: 1-0TOP: Economies, Scarcity MSC: Definitional13. Economics is the study ofa. how society manages its scarce resources.b. the government's role in society.c. how a market system functions.d. how to increase production.ANS: A DIF: 1 REF: 1-0TOP: Economies, Scarcity MSC: Definitional14. In most societies, resources are allocated bya. a single central planner.b. a small number of central planners.c. those firms that use resources to provide goods and services.d. the combined actions of millions of households and firms.ANS: D DIF: 1 REF: 1-0TOP: Resource allocation MSC: Interpretive15. The adage, "There is no such thing as a free lunch," isused to illustrate the principle thata. goods are scarce.b. people face tradeoffs.c. income must be earned.d. households face many decisions.ANS: B DIF: 2 REF: 1-1TOP: Tradeoffs MSC: Interpretive16. The adage, "There is no such thing as a free lunch," meansa. even people on welfare have to pay for food.b. the cost of living is always increasing.c. to get something we like, we usually have to give up another thing we like.d. all costs are included in the price of a product.ANS: C DIF: 1 REF: 1-1TOP: Tradeoffs MSC: Definitional17. Economists use the phrase "There is no such thing as a free lunch," to illustrate the principle thata. inflation almost always results in higher prices over time.b. nothing is free in a market economy.c. making decisions requires trading off one goal against another.d. if something looks too good to be true, it probably is not worth pursuing.ANS: C DIF: 2 REF: 1-1TOP: Tradeoffs MSC: Interpretive18. Which of the following statements best represents the principle represented by the adage, "There is no such thing asa free lunch"?a. Melissa can attend the concert only if she takes her sisterwith her.b. Greg is hungry and homeless.c. Brian must repair the tire on his bike before he can ride it to class.d. Kendra must decide between going to Colorado or Cancun for spring break.ANS: D DIF: 3 REF: 1-1TOP: Tradeoffs MSC: Applicative19. The principle that "people face tradeoffs" applies toa. individuals.b. families.c. societies.d. All of the above are correct.ANS: D DIF: 1 REF: 1-1TOP: Tradeoffs MSC: Applicative20. A typical society strives to get the most it can from its scarce resources. At the same time, the society attempts to distribute the benefits of those resources to the members of the society in a fair manner. In other words, the society faces a tradeoff betweena. guns and butter.b. efficiency and equity.c. inflation and unemployment.d. work and leisure.ANS: B DIF: 1 REF: 1-1TOP: Efficiency, Equity MSC: Interpretive21. Guns and butter are used to represent the classic societal tradeoff between spending ona. durable and nondurable goods.b. imports and exports.c. national defense and consumer goods.d. law enforcement and agriculture.ANS: C DIF: 1 REF: 1-1TOP: Tradeoffs MSC: Interpretive22. When society requires that firms reduce pollution, there isa. a tradeoff because of reduced incomes to the firms' owners and workers.b. a tradeoff only if some firms are forced to close.c. no tradeoff, since the cost of reducing pollution falls only on the firms affected by the requirements.d. no tradeoff, since everyone benefits from reduced pollution.ANS: A DIF: 3 REF: 1-1TOP: Tradeoffs MSC: Applicative23. A tradeoff exists between a clean environment and a higher level of income in thata. studies show that individuals with higher levels of income actually pollute less than low-income individuals.b. efforts to reduce pollution typically are not completely successful.c. laws that reduce pollution raise costs of production and reduce incomes.d. by employing individuals to clean up pollution, employment and income both rise.ANS: C DIF: 2 REF: 1-1TOP: Tradeoffs MSC: Applicative24. Which of the following phrases best captures the notion of efficiency?a. absolute fairnessb. equal distributionc. minimum wasted. equitable outcomeANS: C DIF: 1 REF: 1-1TOP: Efficiency MSC: Interpretive25. Which of the following is true?a. Efficiency refers to the size of the economic pie; equity refers to how the pie is divided.b. Government policies usually improve upon both equity and efficiency.c. As long as the economic pie continually gets larger, no one will have to go hungry.d. Efficiency and equity can both be achieved if the economic pie is cut into equal pieces.ANS: A DIF: 2 REF: 1-1TOP: Efficiency, Equity MSC: Interpretive26. Efficiency means thata. society is conserving resources in order to save them for the future.b. society's goods and services are distributed equally among society's members.c. society's goods and services are distributed fairly, though not necessarily equally, among society's members.d. society is getting the maximum benefits from its scarce resources.ANS: D DIF: 1 REF: 1-1TOP: Efficiency MSC: Definitional27. Economists use the word equity to describe a situation in whicha. each member of society has the same income.b. each member of society has access to abundant quantities of goods and services, regardless of his or her income.c. society is getting the maximum benefits from its scarce resources.d. the benefits of society's resources are distributed fairly among society's members.ANS: D DIF: 2 REF: 1-1TOP: Equity MSC: Interpretive28. Senator Smith wants to increase taxes on people with high incomes and use the money to help the poor. Senator Jones argues that such a tax will discourage successful people from working and will therefore make society worse off. An economist would say thata. we should agree with Senator Smith.b. we should agree with Senator Jones.c. a good decision requires that we recognize both viewpoints.d. there are no tradeoffs between equity and efficiency.ANS: C DIF: 2 REF: 1-1TOP: Efficiency, Equity MSC: Applicative29. Which of the following words and phrases best captures the notion of equity?a. minimum wasteb. maximum benefitc. samenessd. fairnessANS: D DIF: 1 REF: 1-1TOP: Equity MSC: Definitional30. When government policies are enacted,a. equity can usually be enhanced without an efficiency loss, but efficiency can never be enhanced without anequity loss.b. efficiency can usually be enhanced without an equity loss, but equity can never be enhanced without anefficiency loss.c. it is always the case that either efficiency and fairness are both enhanced, or efficiency and equity are bothdiminished.d. None of the above are correct.ANS: D DIF: 2 REF: 1-1TOP: Government, Efficiency, Equity MSC: Applicative31. A likely effect of government policies that redistribute income and wealth from the wealthy to the poor is that those policiesa. enhance equity.b. reduce efficiency.c. reduce the reward for working hard.d. All of the above are correct.ANS: D DIF: 2 REF: 1-1TOP: Government, Efficiency, Equity MSC: Interpretive32. When the government implements programs such as progressive income tax rates, which of the following is likely to occur?a. Equity is increased and efficiency is increased.b. Equity is increased and efficiency is decreased.c. Equity is decreased and efficiency is increased.d. Equity is decreased and efficiency is decreased.ANS: B DIF: 2 REF: 1-1TOP: Government, Efficiency, Equity MSC: Interpretive33. As a result of a successful attempt by government to cut the economic pie into more equal slices,a. it is easier to cut the pie, and therefore the economy can produce a larger pie.b. the government can more easily allocate the pie to those most in need.c. the pie gets smaller, and there will be less pie overall.d. government will spend too much time cutting and it causes the economy to lose the ability to produce enough pie for everyone.ANS: C DIF: 3 REF: 1-1TOP: Government, Efficiency, Equity MSC: Analytical34. When the government attempts to improve equity in an economy the result is oftena. an increase in overall output in the economy.b. additional government revenue since overall income will increase.c. a reduction in equity.d. a reduction in efficiency.ANS: D DIF: 2 REF: 1-1TOP: Government, Efficiency, Equity MSC: Interpretive。
曼昆经济学原理英文版答案
曼昆经济学原理英文版答案As the creator of the Baidu Wenku document "Principles of Economics by Mankiw (English Version) Answers", I would like to provide a comprehensive guide to the solutions of the questions in the book. This document aims to help students better understand the principles of economics and improve their problem-solving abilities.Chapter 1: Ten Principles of Economics。
1. People face trade-offs.2. The cost of something is what you give up to get it.3. Rational people think at the margin.4. People respond to incentives.5. Trade can make everyone better off.6. Markets are usually a good way to organize economic activity.7. Governments can sometimes improve economic outcomes.8. The standard of living depends on a country's production.9. Prices rise when the government prints too much money.10. Society faces a short-run trade-off between inflation and unemployment.Chapter 2: Thinking Like an Economist。
曼昆经济学原理英文第六版答案
曼昆经济学原理英文第六版答案【篇一:曼昆经济学原理英文版文案加习题答案8章】ation a new in the news box on ―the tax debate‖ has been added.by the end of this chapter, students should understand:? how taxes reduce consumer and producer surplus.? the meaning and causes of the deadweight loss from a tax. ? why some taxes have larger deadweight losses than others. ? how tax revenue and deadweight loss vary with the size of a tax.chapter 8 is the second chapter in a three-chapter sequence dealing with welfare economics. in theprevious section on supply and demand, chapter 6 introduced taxes and demonstrated how a tax affects the price and quantity sold in a market. chapter 6 also described the factors that determine how the burden of the tax is divided between the buyers and sellers in a market. chapter 7 developed welfare economics—the study of how the allocation of resources affects economic well-being. chapter 8 combines the lessons learned in chapters 6 and 7 and addresses the effects of taxation on welfare. chapter 9 will address the effects of trade restrictions on welfare. the purpose of chapter 8 is to apply the lessons learned about welfare economics in chapter 7 to the issue of taxation that was addressed in chapter 6. students will learn that the cost of a tax to buyers and sellers in a market exceeds the revenue collected by the government. students will also learn about the factors that determine the degree by which the cost of a tax exceeds the revenue collected by the government.144? a tax on a good reduces the welfare of buyers and sellers of the good, and the reduction in consumer and producer surplus usually exceeds the revenue raised by the government. the fall in total surplus—the sum of consumer surplus, producer surplus, and tax revenue—is called thedeadweight loss of the tax.taxes have deadweight losses because they cause buyers to consume less and sellers to produce less, and these changesin behavior shrink the size of the market below the level that maximizes total surplus. because the elasticities of supply and demand measure how much market participants respond to market conditions, larger elasticities imply larger deadweight losses.as a tax grows larger, it distorts incentives more, and its deadweight loss grows larger. because a tax reduces the size of a market, however, tax revenue does not continually increase. it first rises with the size of a tax, but if the tax gets large enough, tax revenue starts to fall. ? ?i. the deadweight loss of taxationa. remember that it does not matter who a tax is levied on; buyers and sellers will likely share inthe burden of the tax.b. if there is a tax on a product, the price that a buyer pays will be greater than the price the sellerreceives. thus, there is a tax wedge between the two prices and the quantity sold will be smaller if there was no tax.c. how a tax affects market participants1. we can measure the effects of a tax on consumers by examining the change in consumersurplus. similarly, we can measure the effects of the tax on producers by looking at the change in producer surplus.then the benefit from the tax revenue must not be ignored.3. welfare without a taxa. consumer surplus is equal to: a + b + c.b. producer surplus is equal to: d + e + f.c. total surplus is equal to: a + b + c + d + e + f. 4. welfare with a tax a. consumer surplus is equal to: a.b. producer surplus is equal to: f.5. changes in welfare a. consumer surplus changes by: –(b +c). b. producer surplus changes by: –(d + e). c. tax revenue changes by: +(b + d). d. total surplus changes by: –(c + e). 6. definition of distortion, such as a tax. d. deadweight losses and the gains from tradec. tax revenue is equal to: b +d. d. total surplus is equal to: a +b + d + f.1. taxes cause deadweight losses because they prevent buyers and sellers from benefiting fromtrade.2. this occurs because the quantity of output declines; trades that would be beneficial to both the buyer and seller will nottake place because of the tax.3. the deadweight loss is equal to areas c and e (the drop intotal surplus).4. note that output levels between the equilibrium quantity without the tax and the quantitywith the tax will not be produced, yet the value of these unitsto consumers (represented by the demand curve) is larger than the cost of these units to producers (represented by the supply curve).ii. the determinants of the deadweight lossa. the price elasticities of supply and demand will determinethe size of the deadweight loss that occurs from a tax. 1. givena stable demand curve, the deadweight loss is larger when supply is relatively elastic.2. given a stable supply curve, the deadweight loss is larger when demand is relatively elastic. b. case study: the deadweight loss debate1. social security tax and federal income tax are taxes onlabor earnings. a labor tax places a tax wedge between thewage the firm pays and the wage that workers receive.2. there is considerable debate among economists concerning the size of the deadweight lossfrom this wage tax.3. the size of the deadweight loss depends on the elasticity of labor supply and demand, andthere is disagreement about the magnitude of the elasticity of supply.【篇二:曼昆经济学原理英文版文案加习题答案31章】basic conceptsthere is a new in the news feature on the changing nature of u.s. exports and an updated presentation of the u.s. trade deficit.by the end of this chapter, students should understand:??how net exports measure the international flow of goodsand services.??how net capital outflow measures the international flow of capital.??why net exports must always equal net foreign investment.??how saving, domestic investment, and net capital outflow are related.??the meaning of the nominal exchange rate and the real exchange rate.??purchasing-power parity as a theory of how exchange rates are determined.chapter 18 is the first chapter in a two-chapter sequence dealing with open-economy macroeconomics. chapter 18 develops the basic concepts and vocabulary associated with macroeconomics in an international setting: net exports, net capital outflow, real and nominal exchange rates, and purchasing-power parity. the next chapter, chapter 19, builds an open-economy macroeconomic model that shows how these variables are determined simultaneously.the purpose of chapter 18 is to develop the basic concepts macroeconomists use to study open economies. it addresses why a nation’s net exports must equal its net capital outflow. it also addresses the concepts of the real and nominal exchange rate and develops a theory of exchange ratedetermination known as purchasing-power parity.298??net exports are the value of domestic goods and services sold abroad (exports) minus the value offoreign goods and services sold domestically (imports). net capital outflow is the acquisition of foreign assets by domestic residents (capital outflow) minus the acquisition of domestic assets by foreigners (capital inflow). because every international transaction involves an exchange of an asset for a good or service, an economy’s net capital outflow always equals its net exports.an economy’s saving can be used to finance investment at home or buy assets abroad. thus, national saving equals domestic investment plus net capital outflow.the nominal exchange rate is the relative price of the currency of two countries, and the real exchange rate is the relative price of the goods and services of two countries. when the nominal exchange rate changes so that each dollar buys more foreign currency, the dollar is said to appreciate or strengthen. when the nominal exchange rate changes so that each dollarbuys less foreign currency, the dollar is said to depreciate or weaken.according to the theory of purchasing-power parity, a dollar (or a unit of any other currency) should be able to buy the same quantity of goods in all countries. this theory implies that the nominal exchange rate between the currencies of two countries should reflect the price levels in those countries. as a result, countries with relatively high inflation should have depreciating currencies, and countries with relatively low inflation should have appreciating currencies. ?? ?? ??i. we will no longer be assuming that the economy is a closed economy.a. definition of in the world.b. definition of around the world.ii. the international flows of goods and capitala. the flow of goods: exports, imports, and net exports1. definition of abroad.2. definition of domestically.imports, also called the trade balance.4. definition of : the value of a nation’s exports minus the value of its imports, also called net exports.5. definition of .6. definition of .7. definition of .8. there are several factors that influence a country’s exports, imports, and net exports:a. the tastes of consumers for domestic and foreign goods.b. the prices of goods at home and abroad.c. the exchange rates at which people can use domestic currency to buy foreign currencies.d. the incomes of consumers at home and abroad.e. the cost of transporting goods from country to country.f. government policies toward international trade.9. case study: the increasing openness of the u.s. economy a. figure 1 shows the total value of exports and imports (expressed as a percentage of gdp) for the united states since 1950. b. advances in transportation, telecommunications, and technological progress are some of the reasons why international trade has increased over time. c. policymakers around the world have also become more accepting of freetrade over time. 10. in the news: the changing nature of u.s. exports a. growing u.s. exports include entertainment royalties, tourism, travel, and services. b. this article from the wall street journal describes the growth in new exports. b. the flow of financial resources: net capital outflow1. definition of residents minus the purchase of domestic assets by foreigners.2. the flow of capital abroad takes two forms. a. foreign direct investment occurs when a capital investment is owned and operated by a foreign entity.b. foreign portfolio investment involves an investment that is financed with foreign money but operated by domestic residents.3. net capital outflow can be positive or negative.a. when net capital outflow is positive, domestic residents are buying more foreign assets than foreigners are buying domestic assets. capital is flowing out of the country.b. when net capital outflow is negative, domestic residents are buying fewer foreign assets than foreigners are buying domestic assets. the country is experiencing a capital inflow. 4. there are several factors that influence a country’s net capital outflow:a. the real interest rates being paid on foreign assets.b. the real interest rates being paid on domestic assets.c. the perceived economic and political risks of holding assets abroad.d. the government policies that affect foreign ownership of domestic assets.c. the equality of net exports and net capital outflow1. net exports and net capital outflow each measure a type of imbalance in a world market.a. net exports measure the imbalance between a country’s exports and imports in world markets for goods and services.b. net capital outflow measures the imbalance between the amount of foreign assets bought by domestic residents andthe amount of domestic assets bought by foreigners inworld financial markets.2. for an economy, net exports must be equal to net capital outflow.3. example: you are a computer programmer who sells some software to a japanese consumer for 10,000 yen. a. thesale is an export of the united states so u.s. net exports increase.b. there are several things you could do with the 10,000 yenc. you could hold the yen (which is a japanese asset) or use it to purchase another japanese asset. either way, u.s. net capital outflow rises.d. alternatively, you could use the yen to purchase a japanese good. thus, u.s. imports will rise so the net effect on net exports will be zero.e. one final possibility is that you could exchange the yen for dollars at a bank. this doesnot change the situation though, because the bank then must use the yen for something.alternative classroom example: assume that u.s. residents do not want to buy any foreign assets, but foreign residents want to purchase some stock in a u.s. firm (such as microsoft). how are the foreigners going to get the dollars to purchase the stock? they would do it the same way u.s. residents would purchase the stock—they would have to earn more than they spend. in other words, foreigners must sell the united states more goods and services than they purchase from the united states. this leads to negative net exports for the united states. the extra dollars spent by u.s. residents on foreign-produced goods and services would be used to purchase the stock in microsoft. 4. this example can be generalized to the economy as a whole.a. when a nation is running a trade surplus (nx 0), it must be using the foreign currencyto purchase foreign assets. thus, capital is flowing out of the country (nco 0).b. when a nation is running a trade deficit (nx 0), it must be financing the net purchase of these goods by selling assets abroad. thus, capital is flowing into the country (nco0).5. every international transaction involves exchange. when a seller country transfers a good orservice to a buyer country, the buyer country gives up some asset to pay for the good or service.6. thus, the net value of the goods and services sold by a country (net exports) must equal thenet value of the assets acquired (net capital outflow).d. saving, investment, and their relationship to the international flows1. recall that gdp (y ) is the sum of four components: consumption (c ), investment (i ),government purchases (g ) and net exports (nx ).【篇三:曼昆宏观经济学课后答案(英文版)】quizzes:1. gross domestic product measures two things at once: (1) the total income of everyonein the economy; and (2) the total expenditure on the economy’s output of goods and services. it can measure both of these things at once because income must equal expenditure for the economy as a whole.2. the production of a pound of caviar contributes more to gdp than the production of apound of hamburger because the contribution to gdp is measured by market value and the price of a pound of caviar is much higher than the price of a pound of hamburger.3. the four components of expenditure are: (1) consumption;(2) investment; (3)government purchases; and (4) net exports. the largest component is consumption, which accounts for more thantwo-thirds of total expenditure.4. nominal gdp is the production of goods and services valued at current prices. realgdp is the production of goods and services valued at constant prices. real gdp is a better measure of economicwell-being because it reflects the eco nomy’s ability to satisfy people’s needs and desires. thus a rise in real gdp means people have produced more goods and services, but a rise in nominal gdp could occur either because of increased production or because of higher prices.5. although gdp is not a perfect measure of well-being, policymakers should care about itbecause a larger gdp means that a nation can afford better health care, better educational systems, and more of the material necessities of life.questions for review:1.2.3.4. an economys income must equal its expenditure, since every transaction has a buyer and a seller. thus, expenditure by buyers must equal income by sellers. the production of a luxury car contributes more to gdp than the production of an economy car because the luxury car has a higher market value. the contribution to gdp is $3, the market value of the bread, which is the final good that is sold. the sale of used records does not affect gdp at all because it involves no current production.5. the four components of gdp are consumption, such as the purchase of a music cd;investment, such as the purchase of a computer by a business; government purchases, such as an order for military aircraft; and net exports, such as the sale of american wheat to russia.6. economists use real gdp rather than nominal gdp to gauge economic well-beingbecause real gdp is not affected by changes in prices, so it reflects only changes in the amounts being produced. if nominal gdp rises, you do not know if that is because of increased production or higher prices.7.the percentage change in nominal gdp is (600-200)/200 x 100 = 200%. the percentage change in real gdp is (400-200)/200 x 100 = 100%. the percentage change in the deflator is (150-100)/100 x 100 = 50%.8. it is desirable for a country to have a large gdp because people could enjoy more goodsand services. but gdp is not the only important measure of well-being. for example, laws that restrict pollution cause gdp to be lower. if laws against pollution were eliminated, gdp would be higher but the pollution might make us worse off. or, for example, an earthquake would raise gdp, as expenditures on cleanup, repair, and rebuilding increase. but an earthquake is an undesirable event that lowers our welfare.problems and applications:1. a. consumption increases because a refrigerator is a good purchased by ahousehold.b. investment increases because a house is an investment good.c. consumption increases because a car is a good purchased by a household, butinvestment decreases because the car in ford’s inventory had been counted as aninvestment good until it was sold.d. consumption increases because pizza is a good purchased by a household.e. government purchases increase because the government spent money to providea good to the public.f. consumption increases because the bottle is a good purchased by a household,but net exports decrease because the bottle was imported.g. investment increases because new structures and equipment were built.2.3. with transfer payments, nothing is produced, so there is no contribution to gdp. purchases of new housing are included in the investment portion of gdp because housingprovides services for a long time. for the same reason, purchases of new cars could be thought of as investment, but by convention, they are not. the logic could apply to any durable good, such as household appliances.if gdp included goods that are resold, it would be counting output of that particular year, plus sales of goods produced ina previous year. it would double-count goods that were sold more than once and would count goods in gdp for severalyears if they were produced in one year and resold in another. 4.5. a. 2001: ($1 per qt. of milk ? 100 qts. milk) + ($2 per qt. of honey ? 50 qts. honey)= $2002002: ($1 per qt. of milk ? 200 qts. milk) + ($2 per qt. of honey ? 100 qts.honey) = $4002003: ($2 per qt. of milk ? 200 qts. milk) + ($4 per qt. of honey ? 100 qts.honey) = $8002001: ($1 per qt. of milk ? 100 qts. milk) + ($2 per qt. ofhoney ? 50 qts. honey)= $2002002: ($1 per qt. of milk ? 200 qts. milk) + ($2 per qt. of honey ? 100 qts.honey) = $4002003: ($1 per qt. of milk ? 200 qts. milk) + ($2 per qt. of honey ? 100 qts.honey) = $4002001: ($200/$200) ? 100 = 1002002: ($400/$400) ? 100 = 1002003: ($800/$400) ? 100 = 200b. percentage change in nominal gdp in 2002 = [($400 - $200)/$200] ? 100 =100%.percentage change in nominal gdp in 2003 = [($800 -$400)/$400] ? 100 =100%.percentage change in real gdp in 2002 = [($400 - $200)/$200] ? 100 = 100%.percentage change in real gdp in 2003 = [($400 - $400)/$400] ? 100 = 0%.percentage change in the gdp deflator in 2002 = [(100 -100)/100] ? 100 = 0%.percentage change in the gdp deflator in 2003 = [(200 -100)/100] ? 100 =100%.prices did not change from 2001 to 2002. thus, thepercentage change in thegdp deflator is zero. likewise, output levels did not change from 2002 to 2003.this means that the percentage change in real gdp is zero.c. economic well-being rose more in 2002 than in 2003, since real gdp rose in2002 but not in 2003. in 2002, real gdp rose and prices didn’t. in 2003, realgdp didn’t rise and prices did.6.a.b.c.d.e.f.7. the growth rate of nominal gdp is higher than the growth rate of real gdp because of inflation. the growth rate of real gdp is ($8,367 - $8,203)/$8,203 ? 100% = 2.0%. real gdp in 2000 (in 1996 dollars) is $9,873/(118/100) = $8,367. real gdp in 1999 (in 1996 dollars) is $9,269/(113/100) = $8,203. the growth rate ofthe deflator is (118 - 113)/113 ? 100% = 4.4%. the growth rate of nominal gdp is ($9,873 - $9,269)/$9,269 ? 100% = 6.5%. economists ignore the rise in peoples incomes that is caused by higher prices becausealthough incomes are higher, the prices of the goods and services that people buy are also higher. therefore, they will not necessarily be able to purchase more goods and services. for this reason, economists prefer to look at real gdp instead of nominal gdp.many answers are possible.a. gdp equals the dollar amount barry collects, which is $400.8. 9.c.d.e.10. national income = nnp - sales taxes = $350 - $30 = $320. personal income = national income - retained earnings = $320 - $100 = $220. disposable personal income = personal income - personal income tax = $220 - $70 = $150. in countries like india, people produce and consume a fair amount of food at home that isnot included in gdp. so gdp per person in india and the united states will differ by more than their comparative economicwell-being.if the government cares about the total income of americans,it will emphasize gnp, since that measure includes the income of americans that is earned abroad and excludes the income of foreigners. if the government cares about the total amount ofeconomic activity occurring in the united states, it will emphasize gdp, which measures the level of production in the country, whether produced by domestic citizens or foreigners.a. the increased labor-force participation of women has increased gdp in theunited states, since it means more people are working and production hasincreased.if our measure of well-being included time spent working in the home and takingleisure, it wouldnt rise as much as gdp, since the rise in womens labor-forceparticipation has reduced time spent working in the home and taking leisure.other aspects of well-being that are associated with the rise in womens increasedlabor-force participation include increased self-esteem and prestige for women inthe workforce, especially at managerial levels, but decreased quality time spentwith children, whose parents have less time to spend with them. such aspectswould be quite difficult to measure. 11. 12. b. c.24章quick quizzes1. the consumer price index tries to measure the overall cost of the goods and servicesbought by a typical consumer. it is constructed by surveying consumers to fix a basket of goods and services that the typical consumer buys, finding the prices of the goods and。
曼昆微观经济学课后标准答案

曼昆微观经济学课后答案————————————————————————————————作者:————————————————————————————————日期:21.Consider the market for DVD movies,TV screens,and ticket at movie theaters. A.对每一对物品,确定它们是互补品还是替代品·DVD 和电视·DVD 和电影票·电视和电影票As: complements substitutes substitutesB.假设技术进步降低了制造电视机的成本。
画一个图说明电视机市场会发生什么变动。
As: demand curve不变supply curve向右移。
技术进步降低了制造电视机的成本,使电视机的供给曲线向右移动。
电视机的需求曲线不变。
电视机的均衡价格下降,均衡价格上升。
C.再画两个图说明电视机市场的变动如何影响DVD 市场和电影票市场。
答:DVD:demand curve不变supply curve向右移。
由于电视机和DVD 是互补品,电视机价格的下降使DVD 的需求增加。
需求增加引起DVD 均衡价格上升,均衡数量增加。
Movie tickets:supply curve不变demand curve向左移。
由于电视机和电影票是替代品,电视机价格的下降使电影票需求减少。
需求的减少使电影票的均衡价格下降,均衡数量减少。
2.Over the past 20 years,technological advance reduces the cost of computer chips.How do you think this affected the market for computers?For computer software?For typewriters?As: computer : supply curve向右移price 下降computer software: supply curve向右移price 下降typewriters : demand curve向左移3.Consider total cost and total revenue given in the following table:A.计算每种产量时的利润。
曼昆微观经济学英文答案ch01
1WHAT’S NEW:The discussions of Principle #4, “People respond to incentives,” Principle #7, “Governments cansometimes improve market outcomes,” and Principle #10, “Society faces a s hort-run tradeoff between inflation and unemployment” have been shortened. A definition for the term “business cycle” has been added. A new FYI box on “How to Read This Book” has been added and provides students with tips on studying.LEARNING OBJECTIVES: By the end of this chapter, students should understand:➢ that economics is about the allocation of scarce resources.➢ that individuals face tradeoffs.➢ the meaning of opportunity cost.➢ how to use marginal reasoning when making decisions.➢ how incent ives affect people’s behavior.➢ why trade among people or nations can be good for everyone.➢ why markets are a good, but not perfect, way to allocate resources.➢ what determines some trends in the overall economy.CONTEXT AND PURPOSE:Chapter 1 is the first chapter in a three-chapter section that serves as the introduction to the text. Chapter 1 introduces ten fundamental principles on which the study of economics is based. In a broad sense, the rest of the text is an elaboration on these ten principles. Chapter 2 will develop how economists approach problems while Chapter 3 will explain how individuals and countries gain from trade. The purpose of Chapter 1 is to lay out ten economic principles that will serve as building blocks for the rest of the text. The ten principles can be grouped into three categories: how people makedecisions, how people interact, and how the economy works as a whole. Throughout the text, references1 TEN PRINCIPLES OF ECONOMICS2 Chapter 1/Ten Principles of Economicswill be made repeatedly to these ten principles.KEY POINTS:1. The fundamental lessons about individual decisionmaking are that people face tradeoffs among alternative goals, that the cost of any action is measured in terms of forgone opportunities, thatrational people make decisions by comparing marginal costs and marginal benefits, and that people change their behavior in response to the incentives they face.2. The fundamental lessons about interactions among people are that trade can be mutually beneficial,that markets are usually a good way of coordinating trades among people, and that the government can potentially improve market outcomes if there is some sort of market failure or if the market outcome is inequitable.3. The fundamental lessons about the economy as a whole are that productivity is the ultimate sourceof living standards, that money growth is the ultimate source of inflation, and that society faces a short-run tradeoff between inflation and unemployment.CHAPTER OUTLINE:A. The word “economy” comes from the Greek word meaning “one who mana ges a household.”B. This makes some sense since in the economy we are faced with many decisions (just as a household is).C.Fundamental economic problem: resources are scarce. D. Definition of scarcity : the limited nature of society’s resources.E. Definition of economics: the study of how society manages its scarce resources.Chapter 1/Ten Principles of Economics 3A. Principle #1: People Face Tradeoffs1. “There is no such thing as a free lunch.” Making decisions requires trading of fone goal for another.2. Examples include how a student spends her time, how a family decides to spendits income, how the U.S. government spends tax dollars, how regulations mayprotect the environment at a cost to firm owners.3. A special example of a tradeoff is the tradeoff between efficiency and equity.a. Definition of efficiency: the property of society getting the most itcan from its scarce resources.b. Definition of equity: the property of distributing economicprosperity fairly among the members of society.c. For example, tax dollars paid by wealthy Americans and then distributedto those less fortunate may improve equity but lower the return to hardwork and therefore reduce the level of output produced by our resources.d.This implies that the cost of this increased equity is a reduction in theefficient use of our resources.4. Recognizing that tradeoffs exist does not indicate what decisions should be made.B. Principle #2: The Cost of Something Is What You Give Up to Get It1. Making decisions requires individuals to consider the benefits and costs of someaction.2. What are the costs of going to college?a. We cannot count room and board (at least all of the cost) because theperson would have to pay for food and shelter even if he was not inschool.b. We would want to count the value of the student’s time since he couldbe working for pay instead of attending classes and studying.4 Chapter 1/Ten Principles of Economics3. Definition of opportunity cost: whatever must be given up to obtainsome item.C. Principle #3: Rational People Think at the Margin1. Many decisions in life involve incremental decisions: Should I remain in schoolthis semester? Should I take another course this semester? Should I study anadditional hour for tomorrow’s exam?2. Definition of marginal changes: small incremental adjustments to a planof action.3. Example: You are trying to decide how many years you should stay in school.Comparing the lifestyle of an individual with a Ph.D. to that of an individual whohas dropped out of grade school would be inappropriate. You are likely decidingwhether or not to remain in school for an additional year or two. Thus, you needto compare the additional benefits of another year in school (the marginalbenefit) with the additional cost of staying in school for another year (themarginal cost).4. Another example: Suppose that flying a 200-seat plane across the country coststhe airline $100,000, which means that the average cost of each seat is $500.Suppose that the plane is minutes from departure and a passenger is willing topay $300 for a seat. Should the airline sell the seat for $300? In this case, themarginal cost of an additional passenger is very small.D. Principle #4: People Respond to Incentives1. Because people make decisions by weighing costs and benefits, their decisionsmay change in response to changes in costs and benefits.a. When the price of a good rises, consumers will buy less of it because itscost has risen.b. When the price of a good rises, producers will allocate more resources tothe production of the good because the benefit from producing the goodhas risen.2. Sometimes policymakers fail to understand how policies may alter incentives andbehavior.3. Example: Seat belt laws increase use of seat belts and lower the incentives ofindividuals to drive safely. This leads to an increase in the number of caraccidents. This also leads to an increased risk for pedestrians.If you include any incentive-based criteria on your syllabus, discuss it now. Forexample, if you reward class attendance (or penalize students who do not attendclass), explain to students how this change in the marginal benefit of attending classcan be expected to alter their behavior.Chapter 1/Ten Principles of Economics 5III. How People InteractA. Principle #5: Trade Can Make Everyone Better Off1. Trade is not like a sports competition where one side gains and the other sideloses.2. Consider trade that takes place inside your home. Certainly the family isinvolved in trade with other families on a daily basis. Most families do not buildtheir own homes, make their own clothes, or grow their own food.3. Just like families benefit from trading with one another so do countries.4. This occurs because it allows for specialization in areas that countries (or families)can do best.6 Chapter 1/Ten Principles of EconomicsB. Principle #6: Markets Are Usually a Good Way to Organize Economic Activity1. Many countries that once had centrally planned economies have abandoned thissystem and are trying to develop market economies.2. Definition of market economy: an economy that allocates resourcesthrough the decentralized decisions of many firms and households asthey interact in markets for goods and services.Chapter 1/Ten Principles of Economics 73. Market prices reflect both the value of a product to consumers and the cost ofthe resources used to produce it. Therefore, decisions to buy or produce goodsand services are made based on the cost to society of providing them.4. When a government interferes in a market and restricts price from adjustingdecisions that households and firms make are not based on the properinformation. Thus, these decisions may be inefficient.5. Centrally planned economies have failed because they did not allow the marketto work.6. FYI: Adam Smith and the Invisible Handa. Adam Smith’s 1776 work suggested that although individuals aremotivated by self-interest, an invisible hand guides this self- interest intopromoting society’s economic well-being.b. Smith’s astute perceptions will be discussed more fully in the chap ters tocome.C. Principle #7: Governments Can Sometimes Improve Market Outcomes1. There are two broad reasons for the government to interfere with the economy:the promotion of efficiency and equity.2. Government policy can be most useful when there is market failure.a. Definition of market failure: a situation in which a market left onits own fails to allocate resources efficiently.3. Examples of Market Failurea. Definition of externality: the impact of one person’s actions onthe well-being of a bystander.b. Definition of market power: the ability of a single economic actor(or small group of actors) to have a substantial influence onmarket prices.c. Because a market economy rewards people for their ability to producethings that other people are willing to pay for, there will be an unequaldistribution of economic prosperity.8 Chapter 1/Ten Principles of Economics4. Note that the principle states that the government can improve market outcomes.This is not saying that the government always does improve market outcomes. IV. How the Economy as a Whole WorksA. Principle #8: A Country’s Standard of Living Depends on Its Ability to Produce Goods andServices1. Differences in living standards from one country to another are quite large.2. Changes in living standards over time are also great.3. The explanation for differences in living standards lies in differences inproductivity.4. Definition of productivity: the quantity of goods and services producedfrom each hour of a worker’s time.5. High productivity implies a high standard of living.6. Thus, policymakers must understand the impact of any policy on our ability toproduce goods and services.B. Principle #9: Prices Rise When the Government Prints Too Much Money1. Definition of inflation: an increase in the overall level of prices in theeconomy.2. When the government creates a large amount of money, the value of moneyfalls.3. Examples: Germany after World War I (in the early 1920s), the United States inthe 1970s.C. Principle #10: Society Faces a Short-Run Tradeoff between Inflation and Unemployment1. Definition of Phillips curve: a curve that shows the short-run tradeoffbetween inflation and unemployment.2. This is a controversial topic among economists.3. This tradeoff is only temporary but it can last for several years.4. The Phillips curve is important for understanding the business cycle.5. Definition of business cycle: fluctuations in economic activity, such asemployment and production.Chapter 1/Ten Principles of Economics 96. Policymakers can exploit this tradeoff by using various policy instruments, butthe extent and desirability of these interventions is of continuing debate.D. FYI: How to Read this Book1. Economics is very useful to understand, but it can be a difficult subject to grasp.2. There are five tips to make reading and understanding the material inthe book easier.a. Summarize, don’t highlight.b. Test yourself.c. Practice, practice, practice.d. Study in groups.e. Don’t forget the real world.10 Chapter 1/Ten Principles of EconomicsSOLUTIONS TO TEXT PROBLEMS:Quick Quizzes1. The four principles of economic decisionmaking are: (1) people face tradeoffs; (2) the cost ofsomething is what you give up to get it; (3) rational people think at the margin; and (4) peoplerespond to incentives. People face tradeoffs because to get one thing that they like, they usually have to give up another thing that they like. The cost of something is what you give up to get it, not just in terms of monetary costs but all opportunity costs. Rational people think at the margin by taking an action if and only if the marginal benefits exceed the marginal costs. Peoplerespond to incentives because as they compare benefits to costs, a change in incentives maycause their behavior to change.2. The three principles concerning economic interactions are: (1) trade can make everyone betteroff; (2) markets are usually a good way to organize economic activity; and (3) governments can sometimes improve market outcomes. Trade can make everyone better off because it allowscountries to specialize in what they do best and to enjoy a wider variety of goods and services.Markets are usually a good way to organize economic activity because the invisible hand leadsmarkets to desirable outcomes. Governments can sometimes improve market outcomes because sometimes markets fail to allocate resources efficiently because of an externality or market power.3. The three principles that describe how the economy as a whole works are: (1) a country’sstandard of living depends on its ability to produce goods and services; (2) prices rise when thegovernment prints too much money; and (3) society faces a short-run tradeoff between inflation and unemployment. A country’s standard of living depends on its ability to produce goods andservices, which in turn depends on its productivity, which is a function of the education ofworkers and the access workers have to the necessary tools and technology. Prices rise whenthe government prints too much money because more money in circulation reduces the value of money, causing inflation. Society faces a short-run tradeoff between inflation and unemployment that is only temporary and policymakers have some ability to exploit this relationship usingvarious policy instruments.Questions for Review1. Examples of tradeoffs include time tradeoffs (such as studying one subject over another, orstudying at all compared to engaging in social activities) and spending tradeoffs (such as whether to use your last ten dollars on pizza or on a study guide for that tough economics course).2. The opportunity cost of seeing a movie includes the monetary cost of admission plus the timecost of going to the theater and attending the show. The time cost depends on what else youmight do with that time; if it's staying home and watching TV, the time cost may be small, but if it's working an extra three hours at your job, the time cost is the money you could have earned.3. The marginal benefit of a glass of water depends on your circumstances. If you've just run amarathon, or you've been walking in the desert sun for three hours, the marginal benefit is very high. But if you've been drinking a lot of liquids recently, the marginal benefit is quite low. The point is that even the necessities of life, like water, don't always have large marginal benefits.4. Policymakers need to think about incentives so they can understand how people will respond tothe policies they put in place. The text's example of seat belts shows that policy actions canhave quite unintended consequences. If incentives matter a lot, they may lead to a verydifferent type of policy; for example, some economists have suggested putting knives in steering columns so that people will drive much more carefully! While this suggestion is silly, it highlights the importance of incentives.5. Trade among countries isn't a game with some losers and some winners because trade can makeeveryone better off. By allowing specialization, trade between people and trade betweencountries can improve everyone's welfare.6. The "invisible hand" of the marketplace represents the idea that even though individuals andfirms are all acting in their own self-interest, prices and the marketplace guide them to do what is good for society as a whole.7. The two main causes of market failure are externalities and market power. An externality is theimpact of one person’s actions on the well-being of a bystander, such as from pollution or thecreation of knowledge. Market power refers to the ability of a single person (or small group ofpeople) to unduly influence market prices, such as in a town with only one well or only one cable television company. In addition, a market economy also leads to an unequal distribution ofincome.8. Productivity is important because a country's standard of living depends on its ability to producegoods and services. The greater a country's productivity (the amount of goods and servicesproduced from each hour of a worker's time), the greater will be its standard of living.9. Inflation is an increase in the overall level of prices in the economy. Inflation is caused byincreases in the quantity of a nation's money.10. Inflation and unemployment are negatively related in the short run. Reducing inflation entailscosts to society in the form of higher unemployment in the short run.Problems and Applications1. a. A family deciding whether to buy a new car faces a tradeoff between the cost of the carand other things they might want to buy. For example, buying the car might mean theymust give up going on vacation for the next two years. So the real cost of the car is thefamily's opportunity cost in terms of what they must give up.b. For a member of Congress deciding whether to increase spending on national parks, thetradeoff is between parks and other spending items or tax cuts. If more money goesinto the park system, that may mean less spending on national defense or on the policeforce. Or, instead of spending more money on the park system, taxes could be reduced.c. When a company president decides whether to open a new factory, the decision is basedon whether the new factory will increase the firm's profits compared to other alternatives.For example, the company could upgrade existing equipment or expand existing factories.The bottom line is: Which method of expanding production will increase profit the most?d. In deciding how much to prepare for class, a professor faces a tradeoff between thevalue of improving the quality of the lecture compared to other things she could do withher time, such as working on additional research.2. When the benefits of something are psychological, such as going on a vacation, it isn't easy tocompare benefits to costs to determine if it's worth doing. But there are two ways to think aboutthe benefits. One is to compare the vacation with what you would do in its place. If you didn'tgo on vacation, would you buy something like a new set of golf clubs? Then you can decide ifyou'd rather have the new clubs or the vacation. A second way is to think about how much work you had to do to earn the money to pay for the vacation; then you can decide if thepsychological benefits of the vacation were worth the psychological cost of working.3. If you are thinking of going skiing instead of working at your part-time job, the cost of skiingincludes its monetary and time costs, which includes the opportunity cost of the wages you aregiving up by not working. If the choice is between skiing and going to the library to study, then the cost of skiing is its monetary and time costs including the cost to you of getting a lower grade in your course.4. If you spend $100 now instead of saving it for a year and earning 5 percent interest, you aregiving up the opportunity to spend $105 a year from now. The idea that money has a time value is the basis for the field of finance, the subfield of economics that has to do with prices offinancial instruments like stocks and bonds.5. The fact that you've already sunk $5 million isn't relevant to your decision anymore, since thatmoney is gone. What matters now is the chance to earn profits at the margin. If you spendanother $1 million and can generate sales of $3 million, you'll earn $2 million in marginal profit,so you should do so. You are right to think that the project has lost a total of $3 million ($6million in costs and only $3 million in revenue) and you shouldn't have started it. That's true, but if you don't spend the additional $1 million, you won't have any sales and your losses will be $5million. So what matters is not the total profit, but the profit you can earn at the margin. In fact, you'd pay up to $3 million to complete development; any more than that, and you won't beincreasing profit at the margin.6. Harry suggests looking at whether productivity would rise or fall. Productivity is certainlyimportant, since the more productive workers are, the lower the cost per gallon of potion. Ronwants to look at average cost. But both Harry and Ron are missing the other side of theequation−revenue. A firm wants to maximize its profits, so it needs to examine both costs andrevenues. Thus, Hermione is right−it’s best to examine whether the extra revenue wouldexceed the extra costs. Hermione is the only one who is thinking at the margin.7. a. The provision of Social Security benefits lowers an individual’s incentive to save forretirement. The benefits provide some level of income to the individual when he or sheretires. This means that the individual is not entirely dependent on savings to supportconsumption through the years in retirement.b. Since a person gets fewer after-tax Social Security benefits the greater is his or herearnings, there is an incentive not to work (or not work as much) after age 65. Themore you work, the lower your after-tax Social Security benefits will be. Thus thetaxation of Social Security benefits discourages work effort after age 65.8. a. When welfare recipients who are able to work have their benefits cut off after two years,they have greater incentive to find jobs than if their benefits were to last forever.b. The loss of benefits means that someone who can't find a job will get no income at all,so the distribution of income will become less equal. But the economy will be moreefficient, since welfare recipients have a greater incentive to find jobs. Thus the changein the law is one that increases efficiency but reduces equity.9. By specializing in each task, you and your roommate can finish the chores more quickly. If youdivided each task equally, it would take you more time to cook than it would take your roommate, and it would take him more time to clean than it would take you. By specializing, you reduce the total time spent on chores.Similarly, countries can specialize and trade, making both better off. For example, suppose ittakes Spanish workers less time to make clothes than French workers, and French workers canmake wine more efficiently than Spanish workers. Then Spain and France can both benefit ifSpanish workers produce all the clothes and French workers produce all the wine, and theyexchange some wine for some clothes.10. a. Being a central planner is tough! To produce the right number of CDs by the right artistsand deliver them to the right people requires an enormous amount of information. Youneed to know about production techniques and costs in the CD industry. You need toknow each person's musical tastes and which artists they want to hear. If you make thewrong decisions, you'll be producing too many CDs by artists that people don't want tohear, and not enough by others.b. Your decisions about how many CDs to produce carry over to other decisions. You haveto make the right number of CD players for people to use. If you make too many CDsand not enough cassette tapes, people with cassette players will be stuck with CDs theycan't play. The probability of making mistakes is very high. You will also be faced withtough choices about the music industry compared to other parts of the economy. If youproduce more sports equipment, you'll have fewer resources for making CDs. So alldecisions about the economy influence your decisions about CD production.11. a. Efficiency: The market failure comes from the monopoly by the cable TV firm.b. Equityc. Efficiency: An externality arises because secondhand smoke harms nonsmokers.d. Efficiency: The market failure occurs because of Standard Oil's monopoly power.e. Equityf. Efficiency: There is an externality because of accidents caused by drunk drivers.12. a. If everyone were guaranteed the best health care possible, much more of our nation'soutput would be devoted to medical care than is now the case. Would that be efficient?If you think that currently doctors form a monopoly and restrict health care to keep theirincomes high, you might think efficiency would increase by providing more health care.But more likely, if the government mandated increased spending on health care, theeconomy would be less efficient because it would give people more health care than theywould choose to pay for. From the point of view of equity, if poor people are less likelyto have adequate health care, providing more health care would represent animprovement. Each person would have a more even slice of the economic pie, thoughthe pie would consist of more health care and less of other goods.b. When workers are laid off, equity considerations argue for the unemployment benefitssystem to provide them with some income until they can find new jobs. After all, no oneplans to be laid off, so unemployment benefits are a form of insurance. But there’s anefficiency problem why work if you can get income for doing nothing? The economyisn’t operating efficiently if people remain unemployed for a long time, andunemployment benefits encourage unemployment. Thus, there’s a tradeoff betweenequity and efficiency. The more generous are unemployment benefits, the less income islost by an unemployed person, but the more that person is encouraged to remainunemployed. So greater equity reduces efficiency.13. Since average income in the United States has roughly doubled every 35 years, we are likely tohave a better standard of living than our parents, and a much better standard of living than our grandparents. This is mainly the result of increased productivity, so that an hour of workproduces more goods and services than it used to. Thus incomes have continuously risen overtime, as has the standard of living.14. If Americans save more and it leads to more spending on factories, there will be an increase inproduction and productivity, since the same number of workers will have more equipment towork with. The benefits from higher productivity will go to both the workers, who will get paidmore since they're producing more, and the factory owners, who will get a return on theirinvestments. There is no such thing as a free lunch, however, because when people save more, they are giving up spending. They get higher incomes at the cost of buying fewer goods.15. a. If people have more money, they are probably going to spend more on goods andservices.b. If prices are sticky, and people spend more on goods and services, then output mayincrease, as producers increase output to meet the higher demand rather than raisingprices.c. If prices can adjust, then the higher spending of consumers will be matched withincreased prices and output won't rise.16. To make an intelligent decision about whether to reduce inflation, a policymaker would need toknow what causes inflation and unemployment, as well as what determines the tradeoff between them. Any attempt to reduce inflation will likely lead to higher unemployment in the short run. A policymaker thus faces a tradeoff between the benefits of lower inflation compared to the cost of higher unemployment.。
曼昆宏观经济经济学第九版英文原版答案

曼昆宏观经济经济学第九版英文原版答案3(总13页)--本页仅作为文档封面,使用时请直接删除即可----内页可以根据需求调整合适字体及大小--Answers to Textbook Questions and ProblemsCHAPTER3?National Income: Where It Comes From and Where It Goes Questions for Review1. The factors of production and the production technology determine theamount of output an economy can produce. The factors of production are the inputs used to produce goods and services: the most important factors are capital and labor. The production technology determines how much output can be produced from any given amounts of theseinputs. An increase in one of the factors of production or animprovement in technology leads to an increase in the economy’soutput.2. When a firm decides how much of a factor of production to hire ordemand, it considers how this decision affects profits. For example, hiring an extra unit of labor increases output and thereforeincreases revenue; the firm compares this additional revenue to the additional cost from the higher wage bill. The additional revenue the firm receives depends on the marginal product of labor (MPL) and the price of the good produced (P). An additional unit of labor produces MPL units of additional output, which sells for P dollars per unit.Therefore, the additional revenue to the firm is P ? MPL. The cost of hiring the additional unit of labor is the wage W. Thus, this hiring decision has the following effect on profits:ΔProfit= ΔRevenue –ΔCost= (P ? MPL) –W.If the additional revenue, P ? MPL, exceeds the cost (W) of hiring the additional unit of labor, then profit increases. The firm will hire labor until it is no longer profitable to do so—that is, until the MPL falls to the point where the change in profit is zero. In the equation abov e, the firm hires labor until ΔP rofit = 0, which is when (P ? MPL) = W.This condition can be rewritten as:MPL = W/P.Therefore, a competitive profit-maximizing firm hires labor until the marginal product of labor equals the real wage. The same logicapplies to the firm’s decision regarding how much capital to hire:the firm will hire capital until the marginal product of capitalequals the real rental price.3. A production function has constant returns to scale if an equalpercentage increase in all factors of production causes an increase in output of the same percentage. For example, if a firm increases its use of capital and labor by 50 percent, and output increases by50 percent, then the production function has constant returns toscale.If the production function has constant returns to scale, then total income (or equivalently, total output) in an economy ofcompetitive profit-maximizing firms is divided between the return to labor, MPL ? L, and the return to capital, MPK ? K. That is, under constant returns to scale, economic profit is zero.4. A Cobb–Douglas production function has the form F(K,L) = AKαL1–α.The text showed that the parameter αgives capital’s share ofincome. So if capital earns one-fourth of total income, then ? = .Hence, F(K,L) = Consumption depends positively on disposable income—. the amount of income after all taxes have been paid. Higher disposable income means higher consumption.The quantity of investment goods demanded depends negatively on the real interest rate. For an investment to be profitable, itsreturn must be greater than its cost. Because the real interest rate measures the cost of funds, a higher real interest rate makes it more costly to invest, so the demand for investment goods falls.6. Government purchases are a measure of the value of goods and servicespurchased directly by the government. For example, the government buys missiles and tanks, builds roads, and provides services such as air traffic control. All of these activities are part of GDP.Transfer payments are government payments to individuals that are not in exchange for goods or services. They are the opposite of taxes: taxes reduce household disposable income, whereas transfer payments increase it. Examples of transfer payments include Social Security payments to the elderly, unemployment insurance, and veterans’benefits.7. Consumption, investment, and government purchases determine demandfor the economy’s output, whereas the factors of production and the production function determine the supply of output. The real interest rate adjusts to ensure that the deman d for the economy’s goodsequals the supply. At the equilibrium interest rate, the demand for goods and services equals the supply.8. When the government increases taxes, disposable income falls, andtherefore consumption falls as well. The decrease in consumptionequals the amount that taxes increase multiplied by the marginalpropensity to consume (MPC). The higher the MPC is, the greater is the negative effect of the tax increase on consumption. Becauseoutput is fixed by the factors of production and the productiontechnology, and government purchases have not changed, the decrease in consumption must be offset by an increase in investment. Forinvestment to rise, the real interest rate must fall. Therefore, a tax increase leads to a decrease in consumption, an increase ininvestment, and a fall in the real interest rate.Problems and Applications1. a. According to the neoclassical theory of distribution, the realwage equals the marginal product of labor. Because of diminishing returns to labor, an increase in the labor force causes themarginal product of labor to fall. Hence, the real wage falls.Given a Cobb–Douglas production function, the increase in the labor force will increase the marginal product of capital and will increase the real rental price of capital. With more workers, the capital will be used more intensively and will be more productive.b. The real rental price equals the marginal product of capital. Ifan earthquake destroys some of the capital stock (yet miraculously does not kill anyone and lower the labor force), the marginalproduct of capital rises and, hence, the real rental price rises.Given a Cobb–Douglas production function, the decrease in the capital stock will decrease the marginal product of labor and will decrease the real wage. With less capital, each worker becomesless productive.c. If a technological advance improves the production function, thisis likely to increase the marginal products of both capital andlabor. Hence, the real wage and the real rental price bothincrease.d. High inflation that doubles the nominal wage and the price levelwill have no impact on the real wage. Similarly, high inflationthat doubles the nominal rental price of capital and the pricelevel will have no impact on the real rental price of capital.2. a. To find the amount of output produced, substitute the given valuesfor labor and land into the production function:Y = = 100.b. According to the text, the formulas for the marginal product oflabor and the marginal product of capital (land) are:MPL = (1 –α)AKαL–α.MPK = αAKα–1L1–α.In this problem, α is and A is 1. Substitute in the given values for labor and land to find the marginal product of labor is andmarginal product of capital (land) is . We know that the real wage equals the marginal product of labor and the real rental price of land equals the marginal product of capital (land).c. Labor’s share of the output is given by the marginal product oflabor times the quantity of labor, or 50.d. The new level of output is .e. The new wage is . The new rental price of land is .f. Labor now receives .3. A production function has decreasing returns to scale if an equalpercentage increase in all factors of production leads to a smaller percentage increase in output. For example, if we double the amounts of capital and labor output increases by less than double, then the production function has decreasing returns to scale. This may happen if there is a fixed factor such as land in the production function, and this fixed factor becomes scarce as the economy grows larger.A production function has increasing returns to scale if an equalpercentage increase in all factors of production leads to a larger percentage increase in output. For example, if doubling the amount of capital and labor increases the output by more than double, then the production function has increasing returns to scale. This may happen if specialization of labor becomes greater as the population grows.For example, if only one worker builds a car, then it takes him a long time because he has to learn many different skills, and he must constantly change tasks and tools. But if many workers build a car, then each one can specialize in a particular task and become more productive.4. a. A Cobb–Douglas production function has the form Y = AKαL1–α. Thetext showed that the marginal products for the Cobb–Douglasproduction function are:MPL = (1 –α)Y/L.MPK = αY/K.Competitive profit-maximizing firms hire labor until its marginal product equals the real wage, and hire capital until its marginal product equals the real rental rate. Using these factsand the above marginal products for the Cobb–Douglas productionfunction, we find:W/P = MPL = (1 –α)Y/L.R/P = MPK = αY/K.Rewriting this:(W/P)L = MPL ? L = (1 –α)Y.(R/P)K = MPK ? K = αY.Note that the terms (W/P)L and (R/P)K are the wage bill and total return to capital, respectively. Given that the value of α = ,then the above formulas indicate that labor receives 70 percent of total output (or income) and capital receives 30 percent of total output (or income).b. To determine what happens to total output when the labor forceincreases by 10 percent, consider the formula for the Cobb–Douglas production function:Y = AKαL1–α.Let Y1 equal the initial value of output and Y2 equal final output.We know that α = . We also know that labor L increases by 10percent:Y 1 = Y 2 = .Note that we multiplied L by to reflect the 10-percent increase in the labor force.To calculate the percentage change in output, divide Y 2 by Y 1:Y 2Y 1=AK 0.31.1L ()0.7AK 0.3L 0.7=1.1()0.7=1.069.That is, output increases by percent. To determine how the increase in the labor force affects therental price of capital, consider the formula for the real rental price of capital R/P :R/P = MPK = αAK α–1L 1–α.We know that α = . We also know that labor (L ) increases by 10percent. Let (R/P )1 equal the initial value of the rental price ofcapital, and let (R/P )2 equal the final rental price of capitalafter the labor force increases by 10 percent. To find (R/P )2,multiply L by to reflect the 10-percent increase in the laborforce:(R/P )1 = – (R/P )2 = –.The rental price increases by the ratioR /P ()2R /P ()1=0.3AK -0.71.1L ()0.70.3AK -0.7L 0.7=1.1()0.7=1.069So the rental price increases by percent. To determine how the increase in the labor forceaffects the real wage, consider the formula for the real wage W/P :W/P = MPL = (1 – α)AK αL –α.We know that α = . We also know that labor (L ) increases by 10percent. Let (W/P )1 equal the initial value of the real wage, andlet (W/P )2 equal the final value of the real wage. To find (W/P )2, multiply L by to reflect the 10-percent increase in the laborforce:(W/P )1 = (1 – –. (W/P )2 = (1 – –.To calculate the percentage change in the real wage, divide (W/P )2 by (W/P )1:W /P ()2W /P ()1=1-0.3()AK 0.31.1L ()-0.31-0.3()AK 0.3L -0.3=1.1()-0.3=0.972That is, the real wage falls by percent.c. We can use the same logic as in part (b) to setY 1 = Y 2 = A Therefore, we have:Y 2Y 1=A 1.1K ()0.3L 0.7AK 0.3L 0.7=1.1()0.3=1.029This equation shows that output increases by about 3 percent. Notice that α < means that proportional increases to capital will increase output by less than the same proportional increase to labor.Again using the same logic as in part (b) for the change in the real rental price of capital:R /P ()2R /P ()1=0.3A 1.1K ()-0.7L 0.70.3AK -0.7L 0.7=1.1()-0.7=0.935The real rental price of capital falls by percent because there are diminishing returns to capital; that is, when capital increases, its marginal product falls.Finally, the change in the real wage is:W /P ()2W /P ()1=0.7A 1.1K ()0.3L -0.30.7AK 0.3L -0.3=1.1()0.3=1.029Hence, real wages increase by percent because the added capitalincreases the marginal productivity of the existing workers.(Notice that the wage and output have both increased by the same amount, leaving the labor share unchanged —a feature of Cobb –Douglas technologies.)d. Using the same formula, we find that the change in output is:Y 2Y 1= 1.1A ()K 0.3L 0.7AK 0.3L 0.7=1.1This equation shows that output increases by 10 percent. Similarly,the rental price of capital and the real wage also increase by 10 percent:R /P ()2R /P ()1=0.31.1A ()K -0.7L 0.70.3AK -0.7L 0.7=1.1W /P ()2W /P ()1=0.71.1A ()K 0.3L -0.30.7AK 0.3L -0.3=1.15. Labor income is defined asW P ´L =WL PLabor’s share of income is defined asWL P æèççöø÷÷/Y =WL PYFor example, if this ratio is about constant at a value of , then the value of W/P = *Y/L. This means that the real wage is roughlyproportional to labor productivity. Hence, any trend in laborproductivity must be matched by an equal trend in real wages.O therwise, labor’s share would deviate from . T hus, the first fact(a constant labor share) implies the second fact (the trend in realwages closely tracks the trend in labor productivity).6. a. Nominal wages are measured as dollars per hour worked. Prices aremeasured as dollars per unit produced (either a haircut or a unit of farm output). Marginal productivity is measured as units ofoutput produced per hour worked.b. According to the neoclassical theory, technical progress thatincreases the marginal product of farmers causes their real wageto rise. The real wage for farmers is measured as units of farmoutput per hour worked. The real wage is W/P F, and this is equalto ($/hour worked)/($/unit of farm output).c. If the marginal productivity of barbers is unchanged, then theirreal wage is unchanged. The real wage for barbers is measured ashaircuts per hour worked. The real wage is W/P B, and this is equal to ($/hour worked)/($/haircut).d.If workers can move freely between being farmers and being barbers,then they must be paid the same wage W in each sector.e. If the nominal wage W is the same in both sectors, but the realwage in terms of farm goods is greater than the real wage in terms of haircuts, then the price of haircuts must have risen relativeto the price of farm goods. We know that W/P = MPL so that W = P ?MPL. This means that PF MPLF= P H MPL B, given that the nominal wagesare the same. Since the marginal product of labor for barbers has not changed and the marginal product of labor for farmers hasrisen, the price of a haircut must have risen relative to theprice of the farm output. If we express this in growth rate terms, then the growth of the farm price + the growth of the marginalproduct of the farm labor = the growth of the haircut price.f. The farmers and the barbers are equally well off after the technological progress in farming, giventhe assumption that labor is freely mobile between the two sectorsand both types of people consume the same basket of goods. Given that the nominal wage ends up equal for each type of worker andthat they pay the same prices for final goods, they are equallywell off in terms of what they can buy with their nominal income.The real wage is a measure of how many units of output areproduced per worker. Technological progress in farming increased the units of farm output produced per hour worked. Movement oflabor between sectors then equalized the nominal wage.7. a. The marginal product of labor (MPL)is found by differentiatingthe production function with respect to labor:MPL=dY dL=13K1/3H1/3L-2/3An increase in human capital will increase the marginal product of labor because more human capital makes all the existing labor more productive.b. The marginal product of human capital (MPH)is found bydifferentiating the production function with respect to humancapital:MPH=dY dH=13K1/3L1/3H-2/3An increase in human capital will decrease the marginal product of human capital because there are diminishing returns.c. The labor share of output is the proportion of output that goes tolabor. The total amount of output that goes to labor is the real wage (which, under perfect competition, equals the marginalproduct of labor) times the quantity of labor. This quantity is divided by the total amount of output to compute the labor share:Labor Share=(13K1/3H1/3L-2/3)LK1/3H1/3L1/3=1 3We can use the same logic to find the human capital share:Human Capital Share=(13K1/3L1/3H-2/3)HK1/3H1/3L1/3=1 3so labor gets one-third of the output, and human capital gets one-third of the output. Since workers own their human capital (we hope!), it will appear that labor gets two-thirds of output.d. The ratio of the skilled wage to the unskilled wage is:Wskilled Wunskilled =MPL+MPHMPL=13K1/3L-2/3H1/3+13K1/3L1/3H-2/313K1/3L-2/3H1/3=1+LHNotice that the ratio is always greater than 1 because skilledworkers get paid more than unskilled workers. Also, when Hincreases this ratio falls because the diminishing returns tohuman capital lower its return, while at the same time increasing the marginal product of unskilled workers.e. If more colleges provide scholarships, it will increase H, and itdoes lead to a more egalitarian society. The policy lowers thereturns to education, decreasing the gap between the wages of more and less educated workers. More importantly, the policy evenraises the absolute wage of unskilled workers because theirmarginal product rises when the number of skilled workers rises.8. The effect of a government tax increase of $100 billion on (a) publicsaving, (b) private saving, and (c) national saving can be analyzed by using the following relationships:National Saving = [Private Saving] + [Public Saving]= [Y –T –C(Y –T)] + [T –G]= Y –C(Y –T) –G.a. Public Saving—The tax increase causes a 1-for-1 increase inpublic saving. T increases by $100 billion and, therefore, publicsaving increases by $100 billion.b.Private Saving—The increase in taxes decreases disposable income,Y –T, by $100 billion. Since the marginal propensity to consume (MPC) is , consumption falls by ? $100 billion, or $60 billion.Hence,ΔPrivate Saving = –$100b – (–$100b) = –$40b.Private saving falls $40 billion.c. National Saving—Because national saving is the sum of privateand public saving, we can conclude that the $100 billion taxincrease leads to a $60 billion increase in national saving.Another way to see this is by using the third equation for national saving expressed above, that national saving equals Y –C(Y –T) –G. The $100 billion tax increase reduces disposable income and causes consumption to fall by $60 billion. Sinceneither G nor Y changes, national saving thus rises by $60 billion.d. Investment—To determine the effect of the tax increase oninvestment, recall the national accounts identity:Y = C(Y –T) + I(r) + G.Rearranging, we findY –C(Y –T) –G = I(r).The left side of this equation is national saving, so the equation just says that national saving equals investment. Since national saving increases by $60 billion, investment must also increase by $60 billion.How does this increase in investment take place We know that investment depends on the real interest rate. For investment to rise, the real interest rate must fall. Figure 3-1 illustrates saving and investment as a function of the real interest rate.The tax increase causes national saving to rise, so the supply curve for loanable funds shifts to the right. The equilibrium real interest rate falls, and investment rises.9. If consumers increase the amount that they consume today, thenprivate saving and, therefore, national saving will fall. We know this from the definition of national saving:National Saving = [Private Saving] + [Public Saving]= [Y –T –C(Y –T)] + [T –G].An increase in consumption decreases private saving, so national saving falls.Figure 3-2 illustrates saving and investment as a function of the real interest rate. If national saving decreases, the supply curve for loanable funds shifts to the left, thereby raising the realinterest rate and reducing investment.10. a. Private saving is the amount of disposable income, Y – T,that is not consumed:S private= Y – T – C= 8,000 – 2,000 – [1,000 + (2/3)(8,000 –2,000)]= 1,000.Public saving is the amount of taxes the government has left over after it makes its purchases:S public= T – G= 2,000 – 2,500= –500.National saving is the sum of private saving and public saving:S national= S private+ S public= 1,000 + (500)= 500.b. The equilibrium interest rate is the value of r that clears themarket for loanable funds. We already know that national saving is 500, so we just need to set it equal to investment:S national= I500 = 1,200 – 100rSolving this equation for r, we find:r = or 7%.c. When the government increases its spending, private saving remainsthe same as before (notice that G does not appear in the S privateequation above) while government saving decreases. Putting the newG into the equations above:S private= 1,000S public= T – G= 2,000 – 2,000= 0.Thus,S national= S private+ S public= 1,000 + (0)= 1,000.d. Once again the equilibrium interest rate clears the market for loanable funds:S national= I1,000 = 1,200 – 100rSolving this equation for r, we find:r = or 2%.11. To determine the effect on investment of an equal increase in bothtaxes and government spending, consider the national income accounts identity for national saving:National Saving = [Private Saving] + [Public Saving]= [Y –T –C(Y –T)] + [T –G].We know that Y is fixed by the factors of production. We also know that the change in consumption equals the marginal propensity toconsume (MPC) times the change in disposable income. This tells us thatΔNational Saving = {–ΔT – [MPC ? (–ΔT)]} + [ΔT –ΔG]= [–ΔT + (MPC ? ΔT)] + 0= (MPC –1) ΔT.The above expression tells us that the impact on national saving of an equal increase in T and G depends on the size of the marginal propensity to consume. The closer the MPC is to 1, the smaller is the fall in saving. For example, if the MPC equals 1, then the fall in consumption equals the rise in government purchases, so nationalsaving [Y –C(Y –T) –G] is unchanged. The closer the MPC is to 0 (and therefore the larger is the amount saved rather than spent for a one-dollar change in disposable income), the greater is the impact on saving. Because we assume that the MPC is less than 1, we expect that national saving falls in response to an equal increase in taxes and government spending.The reduction in saving means that the supply of loanable funds curve will shift to the left in Figure 3-3. The real interest rate rises, and investment falls.12. a. The demand curve for business investment shifts out to theright because the subsidy increases the number of profitableinvestment opportunities for any given interest rate. The demandcurve for residential investment remains unchanged.b. The total demand curve for investment in the economy shifts out tothe right since it represents the sum of business investment,which shifts out to the right, and residential investment, whichis unchanged. As a result the real interest rate rises as inFigure 3-4.c. The total quantity of investment does not change because it isconstrained by the inelastic supply of savings. The investment tax credit leads to a rise in business investment, but an offsettingfall in residential investment. That is, the higher interest rate means that residential investment falls (a movement along thecurve), whereas the rightward shift of the business investmentcurve leads business investment to rise by an equal amount. Figure3-5 shows this change. Note thatI 1B +I 1R +I 2B +I 2R =S .13. In this chapter, we concluded that an increase in governmentexpenditures reduces national saving and raises the interest rate. The increase in government expenditure therefore crowds outinvestment by the full amount of the increase. Similarly, a tax cut increases disposable income and hence consumption. This increase in consumption translates into a fall in national saving, and theincrease in consumption crowds out investment by the full amount of the increase.If consumption depends on the interest rate, then saving will also depend on it. The higher the interest rate, the greater the return to saving. Hence, it seems reasonable to think that an increase in the interest rate might increase saving and reduce consumption. Figure 3-6 shows saving as an increasing function of the interest rate.Consider what happens when government purchases increase. At anygiven level of the interest rate, national saving falls by the change in government purchases, as shown in Figure 3-7. The figure shows that if the saving function slopes upward, investment falls by less than the amount that government purchases rises by. This happens because consumption falls and saving increases in response to the higher interest rate. Hence, the more responsive consumption is tothe interest rate, the less investment is crowded out by government purchases.14. a. Figure 3-8 shows the case where the demand for loanablefunds is stable but the supply of funds (the saving schedule)fluctuates perhaps reflecting temporary shocks to income, changes in government spending, or changes in consumer confidence. In this case, when interest rates fall, investment rises; when interestrates rise, investment falls. We would expect a negativecorrelation between investment and interest rates.b. Figure 3-9 shows the case where the supply of loanable funds(saving) is stable, whereas the demand for loanable fundsfluctuates, perhaps reflecting changes in firms’ expectationsabout the marginal product of capital. We would now find apositive correlation between investment and the interest rate—when demand for funds rises, it pushes up the interest rate, so we observe that investment and the real interest rate increase at the same time.c. If both curves shift, we might generate a scatter plot as inFigure 3-10, where the economy fluctuates among points A, B, C, and D. Depending on how often the economy is at each of thesepoints, we might find little clear relationship between investment and interest rates.d. Situation (c) seems fairly reasonable—as both the supply of anddemand for loanable funds fluctuate over time in response tochanges in the economy.。
曼昆微观经济学教材第六章练习英文答案
104WHAT’S NEW IN THE SIXTH EDITION:There is a new In the News feature on “Should Unpaid Internships Be Allowed?”LEARNING OBJECTIVES :By the end of this chapter , students should understand :➢ the effects of government policies that place a ceiling on prices.➢ the effects of government policies that put a floor under prices.➢ how a tax on a good affects the price of the good and the quantity sold 。
➢ that taxes levied on sellers and taxes levied on buyers are equivalent.➢ how the burden of a tax is split between buyers and sellers.CONTEXT AND PURPOSE:Chapter 6 is the third chapter in a three —chapter sequence that deals with supply and demand and how markets work 。
Chapter 4 developed the model of supply and demand 。
Chapter 5 added precision to the model of supply and demand by developing the concept of elasticity —the sensitivity of the quantity supplied and quantity demanded to changes in economic conditions. Chapter 6 addresses the impact of government policies on competitive markets using the tools of supply and demand that you learned in Chapters 4 and 5。
曼昆微观经济学课后标准答案

曼昆微观经济学课后答案作者: 日期:1 .C on sider the market for DVD movies,TV scree ns,a nd ticket at movie theaters.A •对每一对物品,确定它们是互补品还是替代品・DVD和电视・DVD和电影票・电视和电影票As: compleme nts substitutes substitutesB •假设技术进步降低了制造电视机的成本。
画一个图说明电视机市场会发生什么变动。
As: dema nd curve不娈supply curve向右移:技术进步降低了制造电视机的成本,使电视机的供给曲线向右移动。
电视机的需求曲线不变。
电视机的均衡价格下降,均衡价格上升。
C .再画两个图说明电视机市场的变动如何影响DVD市场和电影票市场。
答:DVD : dema nd curve不变supply curve向右移。
由于电视机和DVD是互补品,电视机价格的下降使DVD的需求增加。
需求增加引起DVD均衡价格上升,均衡数量增加。
Movie tickets : supply curve不变dema nd curve向左移。
由于电视机和电影票是替代品,电视机价格的下降使电影票需求减少。
需求的减少使电影票的均衡价格下降,均衡数量减少。
2.Over the past 20 years,tech no logical adva nee reduces the cost of computer chips.How do you think this affected the market for computers?For computer software?For typewriters?As: computer: supply curve 向右彳多price 卜降3.Consider total cost and total revenue given in the following table:产量01234567总成本89101113192737总收益08162432404856computer software: supply curve 向右彳多price 卜•降软件厂、・i) o _—八j IX2I uWhen MR=MC profit maximum 即Q=6 TC=27B・计算每种产量时的边际收益和边际成本。
曼昆微观经济学课后练习英文答案

✍ how to define and measure consumer surplus.✍ the link between sellers’ costs of producing a good and the supply curve.✍ how to define and measure producer surplus.✍ that the equilibrium of supply and demand maximizes total surplus in a market. CONTEXT AND PURPOSE:Chapter 7 is the first chapter in a three-chapter sequence on welfare economics and market efficiency. Chapter 7 employs the supply and demand model to develop consumer surplus and producer surplus as a measure of welfare and market efficiency. These concepts are then utilized in Chapters 8 and 9 to determine the winners and losers from taxation and restrictions on international trade.The purpose of Chapter 7 is to develop welfare economics—the study of how the allocation of resources affects economic well-being. Chapters 4 through 6 employed supply and demand in a positive framework, which focused on the question, “What is the equilibrium price and quantity in a market?” This chapter now addresses the normative question, “Is the equilibrium price and quantity in a market the best possible solution to the resource allocation problem, or is it simply the price and quantity that balance supply and demand?” Students will discover that under most circumstances the equilibrium price and quantity is also the one that maximizes welfare.KEY POINTS:? Consumer surplus equals buyers’ willingness to pay for a good minus the amount they actually pay for it, and it measures the benefit buyers get from participating in a market.Consumer surplus can be computed by finding the area below the demand curve and above the price.? Producer surplus equals the amount sellers receive for their goods minus their costs of production, and it measures the benefit sellers get from participating in a market. Producer surplus can be computed by finding the area below the price and above the supply curve.? An allocation of resources that maximizes the sum of consumer and producer surplus is said to be efficient. Policymakers are often concerned with the efficiency, as well as the equality, of economic outcomes.? The equilibrium of supply and demand maximizes the sum of consumer and producer surplus.That is, the invisible hand of the marketplace leads buyers and sellers to allocate resources efficiently.? Markets do not allocate resources efficiently in the presence of market failures such as market power or externalities.CHAPTER OUTLINE:I. Definition of welfare economics: the study of how the allocation of resources affects economic well-being.A. Willingness to Pay1. Definition of willingness to pay: the maximum amount that a buyer will pay for a good.2. Example: You are auctioning a mint-condition recording of Elvis Presley’s first album. Four buyers show up. Their willingness to pay is as follows:for John. Because John is willing to pay more than he has to for the album,he derives some benefit from participating in the market.3. Definition of consumer surplus: the amount a buyer is willing to pay for a good minus the amount the buyer actually pays for it.4. Note that if you had more than one copy of the album, the price in the auction would end up being lower (a little over $70 in the case of two albums) and both John and Paul would gain consumer surplus.B. Using the Demand Curve to Measure Consumer Surplus1. We can use the information on willingness to pay to derive a demand curve for the rare2. . Because the demand curve shows the buyers’ willingness to pay, we can use the demand curve to measure consumer surplus.C. How a Lower Price Raises Consumer Surplusare paying less for the product than before (area A on the graph).b. Because the price is now lower, some new buyers will enter the market and receive consumer surplus on these additional units of output purchased (area B on the graph).D. What Does Consumer Surplus Measure?1. Remember that consumer surplus is the difference between the amount that buyers are willing to pay for a good and the price that they actually pay.2. Thus, it measures the benefit that consumers receive from the good as the buyers themselves perceive it.III. Producer SurplusA. Cost and the Willingness to Sell1. Definition of cost: the value of everything a seller must give up to produce a good .2. Example: You want to hire someone to paint your house. You accept bids for the work from four sellers. Each painter is willing to work if the price you will pay exceeds her opportunity cost. (Note that this opportunity cost thus represents willingness to sell.) The costs are: ALTERNATIVE CLASSROOM EXAMPLE:Review the material on price ceilings from Chapter 6. Redraw the market for two-bedroom apartments in your town. Draw in a price ceiling below the equilibriumprice.Then go through:✍ consumer surplus before the price ceiling is put into place.✍ consumer surplus after the price ceiling is put into place.You will need to take some time to explain the relationship between the producers’ willingness to sell and the cost of producing the good. The relationship between cost and the supply curve is not as apparent as the relationship between the demand curve and willingness to pay. It is important to stress that consumer surplus is measured in monetary terms. Consumer surplus gives us a way to place a monetary cost on inefficient market outcomes (due to government involvement or market failure).except for Grandma. Because Grandma receives more than she would require to paint the house, she derives some benefit from producing in the market.4.Definition of producer surplus: the amount a seller is paid for a good minus the seller’s cost of providing it.5. Note that if you had more than one house to paint, the price in the auction would end up being higher (a little under $800 in the case of two houses) and both Grandma and Georgia would gain producer surplus.B. Using the Supply Curve to Measure Producer Surplus1. We can use the information on cost (willingness to sell) to derive a supply curve for2. marginal seller . Because the supply curve shows the sellers’ cost (willingness to sell), we can use the supply curve to measure producer surplus.are receiving more for the product than before (area C on the graph).b. Because the price is now higher, some new sellers will enter the market and receive producer surplus on these additional units of output sold (area D on the graph).D. Producer surplus is used to measure the economic well-being of producers, much like consumer surplus is used to measure the economic well-being of consumers.ALTERNATIVE CLASSROOM EXAMPLE:Review the material on price floors from Chapter 6. Redraw the market for anagricultural product such as corn. Draw in a price support above the equilibriumprice.Then go through:✍ producer surplus before the price support is put in place.✍ producer surplus after the price support is put in place.Make sure that you discuss the cost of the price support to taxpayers.IV.Market EfficiencyA. The Benevolent Social Planner1. The economic well-being of everyone in society can be measured by total surplus, which is the sum of consumer surplus and producer surplus:Total Surplus = Consumer Surplus + Producer SurplusTotal Surplus = (Value to Buyers – Amount Paid by Buyers) +(Amount Received by Sellers – Cost to Sellers)Because the Amount Paid by Buyers = Amount Received bySellers:2. Definition of efficiency: the property of a resource allocation of maximizing the total surplus received by all members of society .3. Definition of equality: the property of distributing economic prosperity uniformly the members of society .a. Buyers who value the product more than the equilibrium price will purchase the product; those who do not, will not purchase the product. In other words, the free market allocates the supply of a good to the buyers who value it most highly, as measured by their willingness to pay.b. Sellers whose costs are lower than the equilibrium price will produce the product; those whose costs are higher, will not produce the product. In other words, the free market allocates the demand for goods to the sellers who can produce it at the lowest cost.to the marginal buyer is greater than the cost to the marginal seller so total surplus would rise if output increases.b. At any quantity of output greater than the equilibrium quantity, the value of the product to the marginal buyer is less than the cost to the marginal seller so total surplus would rise if output decreases.3. Note that this is one of the reasons that economists believe Principle #6: Markets are usually a good way to organize economic activity.It would be a good idea to remind students that there are circumstances whenthe market process does not lead to the most efficient outcome. Examplesinclude situations such as when a firm (or buyer) has market power over priceor when there are externalities present. These situations will be discussed inlater chapters.Pretty Woman, Chapter 6. Vivien (Julia Roberts) and Edward (Richard Gere)negotiate a price. Afterward, Vivien reveals she would have accepted a lowerprice, while Edward admits he would have paid more. If you have done a goodjob of introducing consumer and producer surplus, you will see the light bulbsgo off above your students’ heads as they watch this clip.C. In the News: Ticket Scalping1. Ticket scalping is an example of how markets work to achieve an efficient outcome.2. This article from The Boston Globe de scribes economist Chip Case’s experience with ticket scalping.D. Case Study: Should There Be a Market in Organs?1. As a matter of public policy, people are not allowed to sell their organs.a. In essence, this means that there is a price ceiling on organs of $0.b. This has led to a shortage of organs.2. The creation of a market for organs would lead to a more efficient allocation of resources, but critics worry about the equity of a market system for organs.V. Market Efficiency and Market FailureA. To conclude that markets are efficient, we made several assumptions about how markets worked.1. Perfectly competitive markets.2. No externalities.B. When these assumptions do not hold, the market equilibrium may not be efficient.C. When markets fail, public policy can potentially remedy the situation. SOLUTIONS TO TEXT PROBLEMS:Quick Quizzes1. Figure 1 shows the demand curve for turkey. The price of turkey is P1 and the consumer surplus that results from that price is denoted CS. Consumer surplus is the amount a buyer is willing to pay for a good minus the amount the buyer actually pays for it. It measures the benefit to buyers of participating in a market.Figure 1 Figure 22. Figure 2 shows the supply curve for turkey. The price of turkey is P1 and the producer surplus that results from that price is denoted PS. Producer surplus is the amount sellers are paid for a good minus the sellers’ cost of providing it (measured by the supply curve). It measures the benefit to sellers of participating in a market.Figure 33. Figure 3 shows the supply and demand for turkey. The price of turkey is P1, consumer surplus is CS, and producer surplus is PS. Producing more turkeys than the equilibrium quantity would lower total surplus because the value to the marginal buyer would be lower than the cost to the marginal seller on those additional units.Questions for Review1. The price a buyer is willing to pay, consumer surplus, and the demand curve are all closely related. The height of the demand curve represents the willingness to pay of the buyers. Consumer surplus is the area below the demand curve and above the price, which equals the price that each buyer is willing to pay minus the price actually paid.2. Sellers' costs, producer surplus, and the supply curve are all closely related. The height of the supply curve represents the costs of the sellers. Producer surplus is the area below the price and above the supply curve, which equals the price received minus each seller's costs of producing the good.Figure 43. Figure 4 shows producer and consumer surplus in a supply-and-demand diagram.4. An allocation of resources is efficient if it maximizes total surplus, the sum of consumer surplus and producer surplus. But efficiency may not be the only goal of economic policymakers; they may also be concerned about equity the fairness of the distribution of well-being.5. The invisible hand of the marketplace guides the self-interest of buyers and sellers into promoting general economic well-being. Despite decentralized decision making and self-interested decision makers, free markets often lead to an efficient outcome.6. Two types of market failure are market power and externalities. Market power may cause market outcomes to be inefficient because firms may cause price and quantity to differ from the levels they would be under perfect competition, which keeps total surplus from being maximized. Externalities are side effects that are not taken into account by buyers and sellers. As a result, the free market does not maximize total surplus.Problems and Applications1. a. Consumer surplus is equal to willingness to pay minus the price paid. Therefore, Melissa’s willingness to pay must be $200 ($120 + $80).b. Her consumer surplus at a price of $90 would be $200 ? $90 = $110.c. If the price of an iPod was $250, Melissa would not have purchased one because the price is greater than her willingness to pay. Therefore, she would receive no consumer surplus.2. If an early freeze in California sours the lemon crop, the supply curve for lemons shifts to the left, as shown in Figure 5. The result is a rise in the price of lemons and a decline in consumer surplus from A + B + C to just A. So consumer surplus declines by the amount B + C.Figure 5 Figure 6In the market for lemonade, the higher cost of lemons reduces the supply of lemonade, as shown in Figure 6. The result is a rise in the price of lemonade and a decline in consumer surplus from D + E + F to just D, a loss of E + F. Note that an event that affects consumer surplus in one market often has effects on consumer surplus in other markets.3. A rise in the demand for French bread leads to an increase in producer surplus in the market for French bread, as shown in Figure 7. The shift of the demand curve leads to an increased price, which increases producer surplus from area A to area A + B + C.Figure 7The increased quantity of French bread being sold increases the demand for flour, as shown in Figure 8. As a result, the price of flour rises, increasing producer surplus from area Dto D + E + F. Note that an event that affects producer surplus in one market leads to effects on producer surplus in related markets.Figure 84. a.Figure 9b. When the price of a bottle of water is $4, Bert buys two bottles of water. His consumer surplus is shown as area A in the figure. He values his first bottle of water at $7, but pays only $4 for it, so has consumer surplus of $3. He values his second bottle of water at $5, but pays only $4for it, so has consumer surplus of $1. Thus Bert’s total consumer surplus is $3 + $1 = $4, which is the area of A in the figure.c. When the price of a bottle of water falls from $4 to $2, Bert buys three bottles of water, an increase of one. His consumer surplus consists of both areas A and B in the figure, an increase in the amount of area B. He gets consumer surplus of $5 from the first bottle ($7 value minus $2 price), $3 from the second bottle ($5 value minus $2 price), and $1 from the third bottle ($3 value minus $2 price), for a total consumer surplus of $9. Thus consumer surplus rises by $5 (which is the size of area B) when the price of a bottle of water falls from $4 to $2.5. a.Figure 10b. When the price of a bottle of water is $4, Ernie sells two bottles of water. His producer surplus is shown as area A in the figure. He receives $4 for his first bottle of water, but it costs only $1 to produce, so Ernie has producer surplus of $3. He also receives $4 for his second bottle of water, which costs $3 to produce, so he has producer surplus of $1. Thus Ernie’s total producer surplus is $3 + $1 = $4, which is the area of A in the figure.c. When the price of a bottle of water rises from $4 to $6, Ernie sells three bottles of water, an increase of one. His producer surplus consists of both areas A and B in the figure, an increase by the amount of area B. He gets producer surplus of $5 from the first bottle ($6 price minus $1 cost), $3 from the second bottle ($6 price minus $3 cost), and $1 from the third bottle ($6 price minus $5 price), for a total producer surplus of $9. Thus producer surplus rises by $5 (which is the size of area B) when the price of a bottle of water rises from $4 to $6.6. a. From Ernie’s supply schedule and Bert’s demand schedule, the quantityequilibrium quantity of two.b. At a price of $4, consumer surplus is $4 and producer surplus is $4, as shown in Problems 3 and 4 above. Total surplus is $4 + $4 = $8.c. If Ernie produced one less bottle, his producer surplus would decline to $3, as shown in Problem 4 above. If Bert consumed one less bottle, his consumer surplus would decline to $3, as shown in Problem 3 above. So total surplus would decline to $3 + $3 = $6.d. If Ernie produced one additional bottle of water, his cost would be $5, but the price is only $4, so his producer surplus would decline by $1. If Bert consumed one additional bottle of water, his value would be $3, but the price is $4, so his consumer surplus would decline by $1. So total surplus declines by $1 + $1 = $2.7. a. The effect of falling production costs in the market for stereos results in a shift to the right in the supply curve, as shown in Figure 11. As a result, the equilibrium price of stereos declines and the equilibrium quantity increases.Figure 11b. The decline in the price of stereos increases consumer surplus from area A to A + B + C + D, an increase in the amount B + C + D. Prior to the shift in supply, producer surplus was areas B + E (the area above the supply curve and below the price). After the shift in supply, producer surplus is areas E + F + G. So producer surplus changes by the amount F + G – B, which may be positive or negative. The increase in quantity increases producer surplus, while the decline in the price reduces producer surplus. Because consumer surplus rises by B + C + D and producer surplus rises by F + G – B, total surplus rises by C + D + F + G.c. If the supply of stereos is very elastic, then the shift of the supply curve benefits consumers most. To take the most dramatic case, suppose the supply curve were horizontal, as shown in Figure 12. Then there is no producer surplus at all. Consumers capture all the benefits of falling production costs, with consumer surplus rising from area A to area A + B.Figure 128. Figure 13 shows supply and demand curves for haircuts. Supply equals demand at a quantity of three haircuts and a price between $4 and $5. Firms A, C, and D should cut the hair of Ellen, Jerry, and Phil. Oprah’s willingness to pay is too low and firm B’s costs are too high, so they do not participate. The maximum total surplus is the area between the demand and supply curves, which totals $11 ($8 value minus $2 cost for the first haircut, plus $7 value minus $3 cost for the second, plus $5 value minus $4 cost for the third).Figure 139. a. The effect of falling production costs in the market for computers results in a shift to the right in the supply curve, as shown in Figure 14. As a result, the equilibrium price of computers declines and the equilibrium quantity increases. The decline in the price of computers increases consumer surplus from area A to A + B + C + D, an increase in the amount B + C + D.Figure 14 Figure 15Prior to the shift in supply, producer surplus was areas B + E (the area above thesupply curve and below the price). After the shift in supply, producer surplus isareas E + F + G. So producer surplus changes by the amount F + G – B, whichmay be positive or negative. The increase in quantity increases producer surplus,while the decline in the price reduces producer surplus. Because consumer surplusrises by B + C + D and producer surplus rises by F + G – B, total surplus rises byC +D + F + G.b. Because typewriters are substitutes for computers, the decline in the price of computers means that people substitute computers for typewriters, shifting the demand for typewriters to the left, as shown in Figure 15. The result is a decline in both the equilibrium price and equilibrium quantity of typewriters. Consumer surplus in the typewriter market changes from area A + B to A + C, a net change of C – B. Producer surplus changes from area C + D + E to area E, a net loss of C + D. Typewriter producers are sad about technological advances in computers because their producer surplus declines.c. Because software and computers are complements, the decline in the price and increase in the quantity of computers means that the demand for software increases, shifting the demand for software to the right, as shown in Figure 16. The result is an increase in both the price and quantity of software. Consumer surplus in the software market changes from B + C to A + B, anet change of A – C. Producer surplus changes from E to C + D + E, an increase of C + D, so software producers should be happy about the technological progress in computers.Figure 16d. Yes, this analysis helps explain why Bill Gates is one the world’s richest people, because his company produces a lot of software that is a complement with computers and there has been tremendous technological advance in computers.10. a. With Provider A, the cost of an extra minute is $0. With Provider B, the cost of anextra minute is $1.b. With Provider A, my friend will purchase 150 minutes [= 150 – (50)(0)]. WithProvider B, my friend would purchase 100 minutes [= 150 – (50)(1)].c. With Provider A, he would pay $120. The cost would be $100 with Provider B.Figure 17d. Figure 17 shows the friend’s demand. With Provider A, he buys 150 minutes andhis consumer surplus is equal to (1/2)(3)(150) – 120 = 105. With Provider B, hisconsumer surplus is equal to (1/2)(2)(100) = 100.e. I would recommend Provider A because he receives greater consumer surplus.11. a. Figure 18 illustrates the demand for medical care. If each procedure has a price of $100, quantity demanded will be Q1 procedures.Figure 18b. If consumers pay only $20 per procedure, the quantity demanded will be Q2 procedures. Because the cost to society is $100, the number of procedures performed is too large to maximize total surplus. The quantity that maximizes total surplus is Q1 procedures, which is less than Q2.c. The use of medical care is excessive in the sense that consumers get procedures whose value is less than the cost of producing them. As a result, the economy’s total surplus is reduced.d. To prevent this excessive use, the consumer must bear the marginal cost of the procedure. But this would require eliminating insurance. Another possibility would be that the insurance company, which pays most of the marginal cost of the procedure ($80, in this case) could decide whether the procedure should be performed. But the insurance company does not get the benefits of the procedure, so its decisions may not reflect the value to the consumer.。
曼昆宏观经济学最新英文版参考答案第33章【精选】
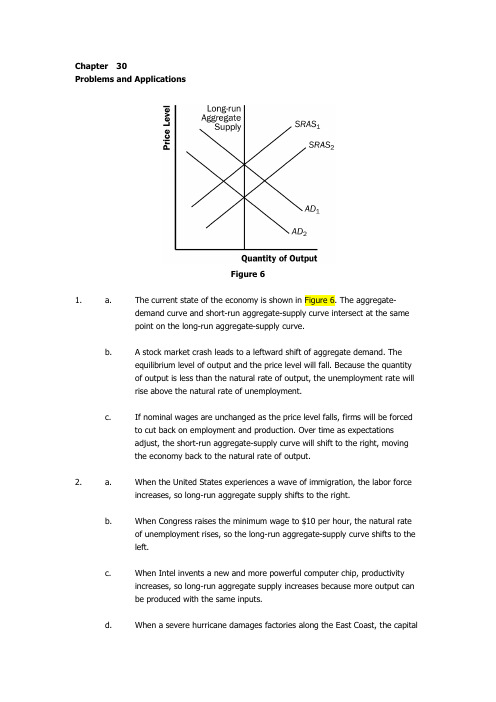
Chapter 30Problems and ApplicationsFigure 61.a.The current state of the economy is shown in Figure 6. The aggregate-demand curve and short-run aggregate-supply curve intersect at the same point on the long-run aggregate-supply curve.b.A stock market crash leads to a leftward shift of aggregate demand. The equilibrium level of output and the price level will fall. Because the quantity of output is less than the natural rate of output, the unemployment rate willrise above the natural rate of unemployment.c.If nominal wages are unchanged as the price level falls, firms will be forced to cut back on employment and production. Over time as expectations adjust, the short-run aggregate-supply curve will shift to the right, moving the economy back to the natural rate of output.2.a.When the United States experiences a wave of immigration, the labor force increases, so long-run aggregate supply shifts to the right.b.When Congress raises the minimum wage to $10 per hour, the natural rateof unemployment rises, so the long-run aggregate-supply curve shifts to theleft.c.When Intel invents a new and more powerful computer chip, productivityincreases, so long-run aggregate supply increases because more output canbe produced with the same inputs.d.When a severe hurricane damages factories along the East Coast, the capital两党员书记stock is smaller, so long-run aggregate supply declines.3.a.The current state of the economy is shown in Figure 7. The aggregate-demand curve and short-run aggregate-supply curve intersect at the samepoint on the long-run aggregate-supply curve.Figure 7b.If the central bank increases the money supply, aggregate demand shifts to the right (to point B). In the short run, there is an increase in output and theprice level.c.Over time, nominal wages, prices, and perceptions will adjust to this new price level. As a result, the short-run aggregate-supply curve will shift to the left. The economy will return to its natural rate of output (point C).d.According to the sticky-wage theory, nominal wages at points A and B are equal. However, nominal wages at point C are higher.e.According to the sticky-wage theory, real wages at point B are lower thanreal wages at point A. However, real wages at points A and C are equal.f.Yes, this analysis is consistent with long-run monetary neutrality. In the longrun, an increase in the money supply causes an increase in the nominalwage, but leaves the real wage unchanged.4.The idea of lengthening the shopping period between Thanksgiving and Christmas was to increase aggregate demand. As Figure 8 shows, this could increase outputback to its long-run equilibrium level.Figure 85.a.The statement that "the aggregate-demand curve slopes downward because it is the horizontal sum of the demand curves for individual goods" is false. The aggregate-demand curve slopes downward because a fall in the price level raises the overall quantity of goods and services demanded through thewealth effect, the interest-rate effect, and the exchange-rate effect.b.The statement that "the long-run aggregate-supply curve is vertical because economic forces do not affect long-run aggregate supply" is false. Economic forces of various kinds (such as population and productivity) do affect long-run aggregate supply. The long-run aggregate-supply curve is vertical because the price level does not affect long-run aggregate supply.c.The statement that "if firms adjusted their prices every day, then the short-run aggregate-supply curve would be horizontal" is false. If firms adjusted prices quickly and if sticky prices were the only possible cause for the upward slope of the short-run aggregate-supply curve, then the short-run aggregate-supply curve would be vertical, not horizontal. The short-run aggregate supply curve would be horizontal only if prices were completely fixed.d.The statement that "whenever the economy enters a recession, its long-run aggregate-supply curve shifts to the left" is false. An economy could enter a recession if either the aggregate-demand curve or the short-run aggregate-supply curve shifts to the left.6.a.According to the sticky-wage theory, the economy is in a recession becausethe price level has declined so that real wages are too high, thus labor demand is too low. Over time, as nominal wages are adjusted so that real wages decline, the economy returns to full employment.According to the sticky-price theory, the economy is in a recession because not all prices adjust quickly. Over time, firms are able to adjust their prices more fully, and the economy returns to the long-run aggregate-supply curve.According to the misperceptions theory, the economy is in a recession when the price level is below what was expected. Over time, as people observe thelower price level, their expectations adjust, and the economy returns to the long-run aggregate-supply curve.b.The speed of the recovery in each theory depends on how quickly priceexpectations, wages, and prices adjust.Figure 97.If the Fed increases the money supply and people expect a higher price level, the aggregate-demand curve shifts to the right and the short-run aggregate-supply curve shifts to the left, as shown in Figure 9. The economy moves from point A to point B, with no change in output and a rise in the price level (to P 2). If the public does not change its expectation of the price level, the short-run aggregate-supply curve does not shift, the economy ends up at point C, and output increases along with the pricelevel (to P 3).8.Figure 10 depicts an economy in a recession. The short-run aggregate-supply curve is AS 1 and the economy is at equilibrium at point A, which is to the left of the long-少组班校run aggregate-supply curve. If policymakers take no action, the economy will returnto the long-run aggregate-supply curve over time as the short-run aggregate-supplycurve shifts to the right to AS 2. The economy's new equilibrium is at point B.Figure 109.a.People will likely expect that the new chairman will not actively fight inflationso they will expect the price level to rise.b.If people believe that the price level will be higher over the next year, workers will want higher nominal wages. c.Higher labor costs lead to reduced profitability.d.The short-run aggregate-supply curve will shift to the left as shown in Figure11.“党员Figure 11e.A decline in short-run aggregate supply leads to reduced output and a higher price level.f.No, this choice was probably not wise. The end result is stagflation, whichprovides limited choices in terms of policies to remedy the situation.Figure 1210.a.If households decide to save a larger share of their income, they must spend less on consumer goods, so the aggregate-demand curve shifts to the left, asshown in Figure 12. The equilibrium changes from point A to point B, so the price level declines and output declines.b.If Florida orange groves suffer a prolonged period of below-freezing temperatures, the orange harvest will be reduced. This decline in the natural rate of output is represented in Figure 13 by a shift to the left in both the short-run and long-run aggregate-supply curves. The equilibrium changesfrom point A to point B, so the price level rises and output declines.施次主标于。
曼昆《微观经济学》答案(英文版)_Chapter_1~5[1]
![曼昆《微观经济学》答案(英文版)_Chapter_1~5[1]](https://img.taocdn.com/s3/m/c2b43437eefdc8d376ee3296.png)
Chapter 1Problems and Applications1. a. A family deciding whether to buy a new car faces a tradeoff between the cost of thecar and other things they might want to buy. For example, buying the car mightmean they must give up going on vacation for the next two years. So the real costof the car is the family's opportunity cost in terms of what they must give up.b. For a member of Congress deciding whether to increase spending on national parks,the tradeoff is between parks and other spending items or tax cuts. If more moneygoes into the park system, that may mean less spending on national defense or on thepolice force. Or, instead of spending more money on the park system, taxes couldbe reduced.c. When a company president decides whether to open a new factory, the decision isbased on whether the new factory will increase the firm's profits compared to otheralternatives. For example, the company could upgrade existing equipment orexpand existing factories. The bottom line is: Which method of expandingproduction will increase profit the most?d. In deciding how much to prepare for class, a professor faces a tradeoff between thevalue of improving the quality of the lecture compared to other things she could dowith her time, such as working on additional research.2. When the benefits of something are psychological, such as going on a vacation, it isn't easy tocompare benefits to costs to determine if it's worth doing. But there are two ways to think about the benefits. One is to compare the vacation with what you would do in its place. If you didn't go on vacation, would you buy something like a new set of golf clubs? Then you can decide if you'd rather have the new clubs or the vacation. A second way is to think about how much work you had to do to earn the money to pay for the vacation; then you can decide if the psychological benefits of the vacation were worth the psychological cost of working.3. If you are thinking of going skiing instead of working at your part-time job, the cost of skiingincludes its monetary and time costs, plus the opportunity cost of the wages you're giving up by not working. If the choice is between skiing and going to the library to study, then the cost of skiing is its monetary and time costs plus the cost to you of getting a lower grade in your course.4. If you spend $100 now instead of investing it for a year and earning 5 percent interest, youare giving up the opportunity to spend $105 a year from now. The idea that money has a time value is the basis for the field of finance, the subfield of economics that has to do with prices of financial instruments like stocks and bonds.5. The fact that you've already sunk $5 million isn't relevant to your decision anymore, sincethat money is gone. What matters now is the chance to earn profits at the margin. If you spend another $1 million and can generate sales of $3 million, you'll earn $2 million in marginal profit, so you should do so. You are right to think that the project has lost a total of $3 million ($6 million in costs and only $3 million in revenue) and you shouldn't have started it. That's true, but if you don't spend the additional $1 million, you won't have any sales and your losses will be $5 million. So what matters is not the total profit, but the profit you can earn at the margin. In fact, you'd pay up to $3 million to complete development; any more than that, and you won't be increasing profit at the margin.6. Harry suggests looking at whether productivity would rise or fall. Productivity is certainlyimportant, since the more productive workers are, the lower the cost per gallon of potion.Harry wants to look at average cost. But both Harry and Ron are missing the other side of the equation−revenue. A firm wants to maximize its profits, so it needs to examine both costs and revenues. Thus, Hermione is right−it’s best to examine whether the extra revenue would exceed the extra costs. In addition, Hermione is the only one who’s thinking at the margin.7. a. Since a person gets fewer after-tax Social Security benefits the greater is his or herincome, there's an incentive not to save for retirement. If you save a lot, yourincome will be higher, and you won't get as much after-tax Social Security income assomeone who didn't save as much. The unintended consequence of the taxation ofSocial Security benefits is to reduce saving; yet the Social Security system arosebecause of worries that people wouldn’t save enough for retirement.b. For the same reason, you'll tend not to work (or not work as much) after age 65.The more you work, the lower your after-tax Social Security benefits will be. Thusthe taxation of Social Security benefits discourages work effort after age 65.8. a. When welfare recipients who are able to work have their benefits cut off after twoyears, they have greater incentive to find jobs than if their benefits were to lastforever.b. The loss of benefits means that someone who can't find a job will get no income atall, so the distribution of income will become less equal. But the economy will bemore efficient, since welfare recipients have a greater incentive to find jobs. Thusthe change in the law is one that increases efficiency but reduces equity.9. By specializing in each task, you and your roommate can finish the chores more quickly. Ifyou divided each task equally, it would take you more time to cook than it would take your roommate, and it would take him more time to clean than it would take you. By specializing, you reduce the total time spent on chores.Similarly, countries can specialize and trade, making both better off. For example, suppose it takes Spanish workers less time to make clothes than French workers, and French workers can make wine more efficiently than Spanish workers. Then Spain and France can both benefit if Spanish workers produce all the clothes and French workers produce all the wine, and they exchange some wine for some clothes.10. a. Being a central planner is tough! To produce the right number of CDs by the rightartists and deliver them to the right people requires an enormous amount ofinformation. You need to know about production techniques and costs in the CDindustry. You need to know each person's musical tastes and which artists theywant to hear. If you make the wrong decisions, you'll be producing too many CDsby artists that people don't want to hear, and not enough by others.b. Your decisions about how many CDs to produce carry over to other decisions. Youhave to make the right number of CD players for people to use. If you make toomany CDs and not enough cassette tapes, people with cassette players will be stuckwith CDs they can't play. The probability of making mistakes is very high. Youwill also be faced with tough choices about the music industry compared to otherparts of the economy. If you produce more sports equipment, you'll have fewerresources for making CDs. So all decisions about the economy influence yourdecisions about CD production.11. a. Efficiency: The market failure comes from the monopoly by the cable TV firm.b. Equityc. Efficiency: An externality arises because secondhand smoke harms nonsmokers.d. Efficiency: The market failure occurs because of Standard Oil's monopoly power.e. Equityf. Efficiency: There's an externality because of accidents caused by drunk drivers.12. a. If everyone were guaranteed the best health care possible, much more of our nation'soutput would be devoted to medical care than is now the case. Would that beefficient? If you think that currently doctors form a monopoly and restrict healthcare to keep their incomes high, you might think efficiency would increase byproviding more health care. But more likely, if the government mandated increasedspending on health care, the economy would be less efficient because it would givepeople more health care than they would choose to pay for. From the point of viewof equity, if poor people are less likely to have adequate health care, providing morehealth care would represent an improvement. Each person would have a more evenslice of the economic pie, though the pie would consist of more health care and lessof other goods.b. When workers are laid off, equity considerations argue for the unemploymentbenefits system to provide them with some income until they can find new jobs.After all, no one plans to be laid off, so unemployment benefits are a form ofinsurance. But there’s an efficiency problem why work if you can get income fordoing nothing? The economy isn’t o perating efficiently if people remainunemployed for a long time, and unemployment benefits encourage unemployment.Thus, there’s a tradeoff between equity and efficiency. The more generous areunemployment benefits, the less income is lost by an unemployed person, but themore that person is encouraged to remain unemployed. So greater equity reducesefficiency.13. Since average income in the United States has roughly doubled every 35 years, we are likelyto have a better standard of living than our parents, and a much better standard of living than our grandparents. This is mainly the result of increased productivity, so that an hour of work produces more goods and services than it used to. Thus incomes have continuously risen over time, as has the standard of living.14. If Americans save more and it leads to more spending on factories, there will be an increasein production and productivity, since the same number of workers will have more equipment to work with. The benefits from higher productivity will go to both the workers, who will get paid more since they're producing more, and the factory owners, who will get a return on their investments. There's no such thing as a free lunch, though, because when people save more, they're giving up spending. They get higher incomes at the cost of buying fewer goods.15. a. If people have more money, they're probably going to spend more on goods andservices.b. If prices are sticky, and people spend more on goods and services, then output mayincrease, as producers increase output to meet the higher demand rather than raisingprices.c. If prices can adjust, then people's higher spending will be matched with increasedprices, and output won't rise.16. To make an intelligent decision about whether to reduce inflation, a policymaker would needto know what causes inflation and unemployment, as well as what determines the tradeoff between them. Because prices are sticky, an attempt to reduce inflation will lead to higher unemployment. A policymaker thus faces a tradeoff between the benefits of lower inflation compared to the cost of higher unemployment.Chapter 2Problems and Applications1. Many answers are possible.2. a. Steel is a fairly uniform commodity, though some firms produce steel of inferiorquality.b. Novels are each unique, so they are quite distinguishable.c. Wheat produced by one farmer is completely indistinguishable from wheat producedby another.d. Fast food is more distinguishable than steel or wheat, but certainly not as much asnovels.3. See Figure 2-5; the four transactions are shown.Figure 2-54. a. Figure 2-6 shows a production possibilities frontier between guns and butter. It isbowed out because when most of the economy’s resources are being used to pr oducebutter, the frontier is steep and when most of the economy’s resources are being usedto produce guns, the frontier is very flat. When the economy is producing a lot ofguns, workers and machines best suited to making butter are being used to makeguns, so each unit of guns given up yields a large increase in the production of butter;thus the production possibilities frontier is flat. When the economy is producing alot of butter, workers and machines best suited to making guns are being used tomake butter, so each unit of guns given up yields a small increase in the productionof butter; thus the production possibilities frontier is steep.b. Point A is impossible for the economy to achieve; it is outside the productionpossibilities frontier. Point B is feasible but inefficient because it’s inside theproduction possibilities frontier.Figure 2-6c. The Hawks might choose a point like H, with many guns and not much butter. TheDoves might choose a point like D, with a lot of butter and few guns.d. If both Hawks and Doves reduced their desired quantity of guns by the same amount,the Hawks would get a bigger peace dividend because the production possibilitiesfrontier is much steeper at point H than at point D. As a result, the reduction of agiven number of guns, starting at point H, leads to a much larger increase in thequantity of butter produced than when starting at point D.5. See Figure 2-7. The shape and position of the frontier depend on how costly it is to maintaina clean environment the productivity of the environmental industry. Gains inenvironmental productivity, such as the development of a no-emission auto engine, lead to shifts of the production-possibilities frontier, like the shift from PPF1 to PPF2 shown in the figure.Figure 2-76. a. A family’s decision about how much income to save is microeconomics.b. The effect of government regulations on auto emissions is microeconomics.c. The impact of higher saving on economic growth is macroeconomics.d. A f irm’s decision about how many workers to hire is microeconomics.e. The relationship between the inflation rate and changes in the quantity of money ismacroeconomics.7. a. The statement that society faces a short-run tradeoff between inflation andunemployment is a positive statement. It deals with how the economy is, not how itshould be. Since economists have examined data and found that there’s a short-runnegative relationship between inflation and unemployment, the statement is a fact,thus it’s a positive statement.b. The statement that a reduction in the rate of growth of money will reduce the rate ofinflation is a positive statement. Economists have found that money growth andinflation are very closely related. The statement thus tells how the world is, and soit is a positive statement.c. The statement that the Federal Reserve should reduce the rate of growth of money isa normative statement. It states an opinion about something that should be done,not how the world is.d. The statement that society ought to require welfare recipients to look for jobs is anormative statement. It doesn’t state a fact about how the world is. Instead, it is astatement of how the world should be and is thus a normative statement.e. The statement that lower tax rates encourage more work and more saving is apositive statement. Economists have studied the relationship between tax rates andwork, as well as the relationship between tax rates and saving. They’ve found anegative relationship in both cases. So the statement reflects how the world is, andis thus a positive statement.8. Two of the statements in Table 2-2 are clearly normative. They are: “5. If the federalbudget is to be balanced, it should be done over the business cycle rather th an yearly” and “9.The government should restructure the welfare system along the lines of a ‘negative income tax.’” Both are suggestions of changes that should be made, rather than statements of fact, so they are clearly normative statements.The other statements in the table are positive. All the statements concern how the world is, not how the world should be. Note that in all cases, even though they’re statements of fact, fewer than 100 percent of economists agree with them. You could say that positive statements are statements of fact about how the world is, but not everyone agrees about what the facts are.9. As the president, you’d be interested in both the positive and normative views of economists,but you’d probably be most interested in their positive views. Economists are on your staff to provide their expertise about how the economy works. They know many facts about the economy and the interaction of different sectors. So you’d be most likely to call on them about questions of fact posit ive analysis. Since you’re the president, you’re the one who has the make the normative statements as to what should be done, with an eye to the political consequences. The normative statements made by economists represent their views, not necessarily ei ther your’s or the electorate’s.10. There are many possible answers.11. As of this writing, the chairman of the Federal Reserve is Alan Greenspan, the chair of theCouncil of Economic Advisers is Martin N. Baily, and the secretary of the treasury is Larry Summers.12. There are many possible answers.13. As time goes on, you might expect economists to disagree less about public policy becausethey’ll have opportunities to observe different policies that are put into place. As new policies are tried, their results will become known, and they can be evaluated better. It’s likely that the disagreement about them will be reduced after they’ve been tried in practice.For example, many economists thought that wage and price controls would be a good idea for keeping inflation under control, while others thought it was a bad idea. But when the controls were tried in the early 1970s, the results were disastrous. The controls interfered with the invisible hand of the marketplace and shortages developed in many products. As a result, most economists are now convinced that wage and price controls are a bad idea for controlling inflation.But it’s unlikely that the differences between economists will ever be completely eliminated.Economists differ on too many aspects of how the world works. Plus, even as some policies get tried out and are either accepted or rejected, creative economists keep coming up with new ideas.Chapter 3Problems and Applications1. In the text example of the farmer and the rancher, the farmer’s opportunity cost of producingone pound of meat is two pounds of potatoes because for every 20 hours of work, he can produce one pound of meat or two pounds of potatoes. With limited time at his disposal, producing a pound of meat means he gives up the opportunity to produce two pounds of potatoes. Similarly, the rancher’s opportunity cost of producing one pound of meat is 1/8 pound of potatoes because for every hour of work, she can produce one pound of meat or 1/8 pound of potatoes. With limited time at her disposal, producing a pound of meat means she gives up the opportunity to produce 1/8 pound of potatoes.2. a. See Figure 3-2. If Maria spends all five hours studying economics, she can read100 pages, so that is the vertical intercept of the production possibilities frontier. Ifshe spends all five hours studying sociology, she can read 250 pages, so that is thehorizontal intercept. The time costs are constant, so the production possibilitiesfrontier is a straight line.Figure 3-2b. It takes Maria two hours to read 100 pages of sociology. In that time, she couldread 40 pages of economics. So the opportunity cost of 100 pages of sociology is40 pages of economics.3. a.Workers needed to make:One Car One Ton of GrainU.S. 1/4 1/10Japan 1/4 1/5b. See Figure 3-3. With 100 million workers and four cars per worker, if eithereconomy were devoted completely to cars, it could make 400 million cars. Since aU.S. worker can produce 10 tons of grain, if the U.S. produced only grain it wouldproduce 1,000 million tons. Since a Japanese worker can produce 5 tons of grain, ifJapan produced only grain it would produce 500 million tons. These are theintercepts of the production possibilities frontiers shown in the figure. Note thatsince the tradeoff between cars and grain is constant, the production possibilitiesfrontier is a straight line.Figure 3-3c. Since a U.S. worker produces either 4 cars or 10 tons of grain, the opportunity cost of1 car is 2½ tons of grain, which is 10 divided by 4. Since a Japanese workerproduces either 4 cars or 5 tons of grain, the opportunity cost of 1 car is1 1/4 tons of grain, which is 5 divided by 4. Similarly, the U.S. opportunity cost of1 ton of grain is 2/5 cars (4 divided by 10) and the Japanese opportunity cost of 1 tonof grain is 4/5 cars (4 divided by 5). This gives the following table:Opportunity Cost of:1 Car (in terms of tons ofgrain given up) 1 Ton of Grain (in terms ofcars given up)U.S. 2 1/2 2/5Japan 1 1/4 4/5d. Neither country has an absolute advantage in producing cars, since they’re equallyproductive (the same output per worker); the U.S. has an absolute advantage in producing grain, since it’s more productive (greater output per worker).e. Japan has a comparative advantage in producing cars, since it has a loweropportunity cost in terms of grain given up. The U.S. has a comparative advantage in producing grain, since it has a lower opportunity cost in terms of cars given up. f. With half the workers in each country producing each of the goods, the U.S. wouldproduce 200 million cars (that’s 50 million workers times 4 cars each) and 500 million tons of grain (50 million workers times 10 tons each). Japan would produce 200 million cars (50 million workers times 4 cars each) and 250 million tons of grain(50 million workers times 5 tons each).g. From any situation with no trade, in which each country is producing some cars andsome grain, suppose the U.S. changed 1 worker from producing cars to producinggrain. That worker would produce 4 fewer cars and 10 additional tons of grain.Then suppose the U.S. offers to trade 7 tons of grain to Japan for 4 cars. The U.S.will do this because it values 4 cars at 10 tons of grain, so it will be better off if thetrade goes through. Suppose Japan changes 1 worker from producing grain toproducing cars. That worker would produce 4 more cars and 5 fewer tons of grain.Japan will take the trade because it values 4 cars at 5 tons of grain, so it will be betteroff. With the trade and the change of 1 worker in both the U.S. and Japan, eachcountry gets the same amount of cars as before and both get additional tons of grain(3 for the U.S. and 2 for Japan). Thus by trading and changing their production,both countries are better off.4. a. Pat’s opportunity cost of making a pizza is 1/2 gallon of root beer, since she couldbrew 1/2 gallon in the time (2 hours) it takes her to make a pizza. Pat has anabsolute advantage in making pizza since she can make one in two hours, while ittakes Kris four hours. Kris’s opportunity cost of making a pizza is 2/3 gallons ofroot beer, since she could brew 2/3 of a gallon in the time (4 hours) it takes her tomake a pizza. Since Pa t’s opportunity cost of making pizza is less than Kris’s, Pathas a comparative advantage in making pizza.b. Since Pat has a comparative advantage in making pizza, she will make pizza andexchange it for root beer that Kris makes.c. The highest price of pizza in terms of root beer that will make both roommates betteroff is 2/3 gallons of root beer. If the price were higher than that, then Kris wouldprefer making her own pizza (at an opportunity cost of 2/3 gallons of root beer)rather than trading for pizza that Pat makes. The lowest price of pizza in terms ofroot beer that will make both roommates better off is 1/2 gallon of root beer. If theprice were lower than that, then Pat would prefer making her own root beer (she canmake 1/2 gallon of root beer instead of making a pizza) rather than trading for rootbeer that Kris makes.5. a. Since a Canadian worker can make either two cars a year or 30 bushels of wheat, theopportunity cost of a car is 15 bushels of wheat. Similarly, the opportunity cost of abushel of wheat is 1/15 of a car. The opportunity costs are the reciprocals of eachother.b. See Figure 3-4. If all 10 million workers produce two cars each, they produce atotal of 20 million cars, which is the vertical intercept of the production possibilitiesfrontier. If all 10 million workers produce 30 bushels of wheat each, they produce atotal of 300 million bushels, which is the horizontal intercept of the productionpossibilities frontier. Since the tradeoff between cars and wheat is always the same,the production possibilities frontier is a straight line.If Canada chooses to consume 10 million cars, it will need 5 million workers devotedto car production. That leaves 5 million workers to produce wheat, who willproduce a total of 150 million bushels (5 million workers times 30 bushels perworker). This is shown as point A on Figure 3-4.c. If the United States buys 10 million cars from Canada and Canada continues toconsume 10 million cars, then Canada will need to produce a total of 20 million cars.So Canada will be producing at the vertical intercept of the production possibilitiesfrontier. But if Canada gets 20 bushels of wheat per car, it will be able to consume200 million bushels of wheat, along with the 10 million cars. This is shown as pointB in the figure. Canada should accept the deal because it gets the same number ofcars and 50 million more bushes of wheat.Figure 3-46. Though the professor could do both writing and data collection faster than the student (that is,he has an absolute advantage in both), his time is limited. If the professor’s comparative advantage is in writing, it makes sense for him to pay a student to collect the data, since that’s the student’s comparative advantage.7. a. English workers have an absolute advantage over Scottish workers in producingscones, since English workers produce more scones per hour (50 vs. 40). Scottishworkers have an absolute advantage over English workers in producing sweaters,since Scottish workers produce more sweaters per hour (2 vs. 1). Comparativeadvantage runs the same way. English workers, who have an opportunity cost of1/50 sweaters per scone (1 sweater per hour divided by 50 scones per hour), have acomparative advantage in scone production over Scottish workers, who have anopportunity cost of 1/20 sweater per scone (2 sweaters per hour divided by 40 sconesper hour). Scottish workers, who have an opportunity cost of 20 scones per sweater(40 scones per hour divided by 2 sweaters per hour), have a comparative advantagein sweater production over English workers, who have an opportunity cost of 50scones per sweater (50 scones per hour divided by 1 sweater per hour).b. If England and Scotland decide to trade, Scotland will produce sweaters and tradethem for scones produced in England. A trade with a price between 20 and 50scones per sweater will benefit both countries, as they’ll be getting the traded good ata lower price than their opportunity cost of producing the good in their own country.c. Even if a Scottish worker produced just one sweater per hour, the countries wouldstill gain from trade, because Scotland would still have a comparative advantage inproducing sweaters. Its opportunity cost for sweaters would be higher than before(40 scones per sweater, instead of 20 scones per sweater before). But there are stillgains from trade since England has a higher opportunity cost (50 scones per sweater).。
曼昆经济学原理答案英文版
曼昆经济学原理答案英文版一、选择题1、在经济学中,什么是GDP?A.国内生产总值B.国民生产总值C.国内总收入D.国民总收入答案:A.国内生产总值(Gross Domestic Product,GDP)是指一个国家在一定时期内所有常住单位的生产活动的最终成果。
2、GDP的计算方法是什么?A.收入法B.支出法C.生产法D.混合法答案:B.支出法。
GDP可以通过对一国所有常住单位的商品和服务的最终消费支出、资本形成总额和货物与服务净出口进行计算,这种计算方法被称为支出法。
3、在经济学中,什么是通货膨胀?A.货币贬值B.物价上涨C.货币供应增加D.以上都不是答案:A.通货膨胀是指商品和服务的总体价格水平上升,导致货币购买力下降。
4、什么是货币政策?A.政府调节货币供应量的政策B.政府调节利率的政策C.政府调节汇率的政策D.以上都不是答案:A.货币政策是指中央银行通过控制货币供应量来调节利率和影响经济活动的政策。
二、简答题1、请简述GDP的概念及作用。
答案:GDP是指一个国家在一定时期内所有常住单位的生产活动的最终成果。
GDP是国民经济核算的核心指标,也是衡量一个国家经济状况和发展水平的重要指标。
它反映了整个国家经济运行的有效性,以及国民收入分配的公平性。
2、请简述通货膨胀的原因及影响。
答案:通货膨胀的原因有多种,包括货币供应量增加、需求拉动、成本推动等。
其中,货币供应量增加是最主要的原因。
当货币供应量增加时,物价上涨,导致货币购买力下降。
通货膨胀会对经济产生负面影响,包括降低消费者购买力、增加企业成本、扭曲价格信号等。
通货膨胀还会导致社会不稳定和政治风险。
曼昆的经济学原理课件是经济学教育中的重要资源,它以深入浅出的方式解释了经济学的基本原理和概念。
本文将对这些原理进行概述,并解释它们在现实生活中的应用。
曼昆的经济学原理主要包括微观经济学和宏观经济学两个部分。
微观经济学主要研究个体经济单位的行为和决策,如消费者、企业和政府。
经济学原理 曼昆课后答案 chapter 14

Problems and Applications1. A competitive market is one in which: (1) there are many buyers and many sellers inthe market; (2) the goods offered by the various sellers are largely the same; and (3) usually firms can freely enter or exit the market. Of these goods, bottled water isprobably the closest to a competitive market. Tap water is a natural monopolybecause there's only one seller. Cola and beer aren't perfectly competitive becauseevery brand is slightly different.2. Since a new customer is offering to pay $300 for one dose, marginal revenue between200 and 201 doses is $300. So we must find out if marginal cost is greater than orless than $300. To do this, calculate total cost for 200 doses and 201 doses, andcalculate the increase in total cost. Multiplying quantity by average total cost, we find that total cost rises from $40,000 to $40,401, so marginal cost is $401. So yourroommate should not make the additional dose.3. a. Remembering that price equals marginal cost in equilibrium, we know themarginal cost must be 30 cents, since that's the price.b. The industry is not in long-run equilibrium since price exceeds average totalcost.4. Once you've ordered the dinner, its cost is sunk, so it doesn't represent an opportunitycost. As a result, the cost of the dinner shouldn't influence your decision aboutstuffing yourself.5. Since Bob’s average total cost is $280/10= $28, which is greater than the price, he’llexit the industry in the long run. Since fixed cost is $30, average variable cost is($280 - $30)/10 = $25, which is less than price, so Bob won’t shut down in the short run.6. Here’s the table showing costs, revenues, and profits:a. The firm should produce 5 or 6 units to maximize profit.b. Marginal revenue and marginal cost are graphed in Figure 14-3. The curvescross at a quantity between 5 and 6 units, yielding the same answer as in part(a).c. This industry is competitive since marginal revenue is the same for eachquantity. The industry is not in long-run equilibrium, since profit is positive.Figure 14-37. a. Figure 14-4 shows the short-run effect of declining demand for beef. Theshift of the industry demand curve from D1 to D2 reduces the quantity from Q1to Q2 and reduces the price from P1 to P2. This affects the firm, reducing itsquantity from q1 to q2. Before the decline in the price, the firm was makingzero profits; afterwards, profits are negative, as average total cost exceedsprice.Figure 14-4b. Figure 14-5 shows the long-run effect of declining demand for beef. Sincefirms were losing money in the short run, some firms leave the industry. Thisshifts the supply curve from S1 to S3. The shift of the supply curve is justenough to increase the price back to its original level, P1. As a result, industryoutput falls still further, to Q3. For firms that remain in the industry, the risein the price to P1 returns them to their original situation, producing quantity q1and earning zero profits.Figure 14-58. Figure 14-6 shows that although high prices cause an industry to expand, entry into theindustry eventually returns prices to the point of minimum average total cost. In thefigure, the industry is originally in long-run equilibrium. The industry produces outputQ1, where supply curve S1 intersects demand curve D1, and the price is P1. At thispoint the typical firm produces output q1. Since price equals average total cost at thatpoint, the firm makes zero economic profit.Now suppose an increase in demand occurs, with the demand curve shifting to D2.This causes "high prices" in the industry, as the price rises to P2. It also causes theindustry to increase output to Q2. With the higher price, the typical firm increases its output from q1 to q2, and now makes positive profits, since price exceeds average total cost.However, the positive profits that firms earn encourage other firms to enter theindustry. Their entry, "an expansion in an industry," leads the supply curve to shift to S3. The new equilibrium reduces the price back to P1, "bringing an end to high prices and manufacturers' prosperity," since now firms produce q1 and earn zero profit again.The only long-lasting effect is that industry output is Q3, a higher level than originally.Figure 14-69. a. Figure 14-7 shows the typical firm in the industry, with average total cost ATC1,marginal cost MC1, and price P1.b. The new process reduces Hi-Tech’s marginal cost to MC2 and its average totalcost to ATC2, but the price remains at P1 since other firms ca n’t use the newprocess. Thus Hi-Tech earns positive profits.c. When the patent expires and other firms are free to use the technology, allfirms’ average-total-cost curves decline to ATC2, so the market price falls to P3and firms earn no profits.Figure 14-710. The rise in the price of petroleum increases production costs for individual firms and thusshifts the industry supply curve up, as shown in Figure 14-8. The typical firm's initial marginal-cost curve is MC1 and its average-total-cost curve is ATC1. In the initialequilibrium, the industry supply curve, S1, intersects the demand curve at price P1,which is equal to the minimum average total cost of the typical firm. Thus the typical firm earns no economic profit.The increase in the price of oil shifts the typical firm's cost curves up to MC2 and ATC2, and shifts the industry supply curve up to S2. The equilibrium price rises from P1 to P2, but the price doesn't increase by as much as the increase in marginal cost for the firm.As a result, price is less than average total cost for the firm, so profits are negative.In the long run, the negative profits lead some firms to exit the industry. As they do so, the industry supply curve shifts to the left. This continues until the price rises to equal the minimum point on the firm's average-total-cost curve. The long-runequilibrium occurs with supply curve S3, equilibrium price P3, industry output Q3, and firm's output q3. Thus, in the long run, profits are zero again and there are fewerfirms in the industry.Figure 14-811. a. Figure 14-9 illustrates the situation in the U.S. textile industry. With nointernational trade, the market is in long-run equilibrium. Supply intersectsdemand at quantity Q1 and price $30, with a typical firm producing output q1.Figure 14-9b. The effect of imports at $25 is that the market supply curve follows the oldsupply curve up to a price of $25, then becomes horizontal at that price. As aresult, demand exceeds domestic supply, so the country imports textiles fromother countries. The typical domestic firm now reduces its output from q1 toq2, incurring losses, since the large fixed costs imply that average total cost willbe much higher than the price.c. In the long run, domestic firms will be unable to compete with foreign firmsbecause their costs are too high. All the domestic firms will exit the industryand other countries will supply enough to satisfy the entire domestic demand.12. a. Figure 14-10 shows the current equilibrium in the market for pretzels. Thesupply curve, S1, intersects the demand curve at price P1. Each standproduces quantity q1 of pretzels, so the total number of pretzels produced is1,000 x q1. Stands earn zero profit, since price equals average total cost.b. If the city government restricts the number of pretzel stands to 800, theindustry supply curve shifts to S2. The market price rises to P2, and individualfirms produce output q2. Industry output is now 800 x q2. Now the priceexceeds average total cost, so each firm is making a positive profit. Withoutrestrictions on the market, this would induce other firms to enter the market,but they can't, since the government has limited the number of licenses.c. The city could charge a license fee for the licenses. Since it's a lump-sum feefor the license, not based on the quantity of sales, such a tax has no effect onmarginal cost, so won't affect the firm's output. It will, however, reduce thefirm's profits. As long as the firm is left with a zero or positive profit, it willcontinue to operate. So the license fee that brings the most money to the cityis to charge each firm the amount (P2 - ATC2)q2, the amount of the firm'sprofit.Figure 14-1013. a. Figure 14-11 illustrates the gold market (industry) and a representative goldmine (firm). The demand curve, D1, intersects the supply curve at industryquantity Q1 and price P1. Since the industry is in long-run equilibrium, theprice equals the minimum point on the representative firm's average total costcurve, so the firm produces output q1 and makes zero profit.b. The increase in jewelry demand leads to an increase in the demand for gold,shifting the demand curve to D2. In the short run, the price rises to P2,industry output rises to Q2, and the representative firm's output rises to q2.Since price now exceeds average total cost, the representative firm now earnspositive profits.c. Since gold mines are earning positive economic profits, over time other firmswill enter the industry. This will shift the supply curve to the right, reducingthe price below P2. But it's unlikely that the price will fall all the way back toP1, since gold is in short supply. Costs for new firms are likely to be higherthan for older firms, since they'll have to discover new gold sources. So it'slikely that the long-run supply curve in the gold industry is upward sloping.That means the long-run equilibrium price will be higher than it was initially.Figure 14-1114. a. Figure 14-12 shows cost curves for a California refiner and a non-Californiarefiner. Since the California refiner has access to lower-cost oil, its costs arelower.Figure 14-12b. In long-run equilibrium, the price is determined by the costs of non-Californiarefiners, since California refiners can't supply the entire market. The market price will equal the minimum average total cost of the other refiners; they will thus earn zero profits. Since California refiners have lower costs, they willearn positive profits, equal to (P* - ATC C) x Q C.c. Yes, there is a subsidy to California refiners that is not passed on to consumers.The subsidy accounts for the long-run profits of the California refiners. Itarises simply because the oil can't be exported.。
微观经济学曼昆 课后答案2
ECONOMICS 2010 ASSIGNMENT 2 – CHAPTERS 4 & 5NAME____________________________________________1. What is a market?A MARKET IS A GROUP OF BUYERS AND SELLERS OF A PARTICULAR GOOD OR SERVICE--- BUYERS AS A GROUP DETERMINE DEMAND FOR THE PRODUCT OR SERVICE AND THE SELLERS AS A GROUP DETERMINE THE SUPPLY OF THE PRODUCT OR SERVICE2. What are the characteristics of a perfectly competitive market? Explain.A COMPETITIVE MARKET IS A MARKET IN WHICH THERE ARE MANY BUYERS AND MANY SELLERS. EACH BUYER AND SELLER HAS A NEGLIGIBLE IMPACT ON THE MARKET PRICE AND THERE IS FULL INFORMATION AMONGST BUYERS AND SELLERS.3. Explain what is meant by a) quantity demanded; b) a demand schedule;and c) the law of demand.THE QUANTITY DEMANDED IS THE AMOUNT OF A GOOD THAT BUYERS ARE WILLING AND ABLE TO PURCHASE.THE DEMAND SCHEDULE IS A TABLE OR LISTING THAT SHOWS THE RELATIONSHIP BETWEEN THE PRICE OF A GOOD OR SERVICE AND THE QUANTITY OF THE GOOD OR SERVICE DEMANDED.THE LAW OF DEMAND IS A CLAIM THAT ,OTHER THINGS EQUAL, THE QUANTITY DEMAND OF A GOOD OR SERVICE FALLS WHEN THE PRICE OF THE GOOD OR SERVICE RISES.4. Graph the demand curve given the data from the demand schedule for slices of cherry pie at different prices in the table below.$14 85. Define or identify the economic factors that shift the demand curve. CHANGES IN INCOME, CHANGES IN THE PRICES OF SUBSTITUTE AND COMPLEMENTARYGOODS, TASTES AND PREFERENCES, CHANGES IN EXPECTATIONS, AND CHANGES IN THE NUMBER OF BUYERS,.6. Define what is meant by the “Law of Supply”.THE LAW OF SUPPLY CLAIMS THAT, OTHER THINGS BEING EQUAL, THE QUANTITY SUPPLIED OF A GOOD OR SERVICE INCREASES WHEN THE PRICE OF THE GOOD OR SERVICE INCREASES.7. Look at the figure below and then indicate what factors, or variables, wouldcause the supply curve for Pizza to shift back from supply curve S1 tosupply curve S2.INCREASES IN THE COSTS (PRICES) OF INPUTS SUCH AS LABOR, CAPTITAL, MATERIALS, ENERGY WILL SHIFT THE SUPPLY CURVE FROM S1 TO S2. SIMILARLY CHANGES IN TECHNOLOGY THAT INCREASE THE COST OF PRODUCTION WILL SHIFT THE SUPPLY CURVE BACK IN ADDITION OF THE DAMPENING OF EXPECTATIONS ON HOW MUCH CAN BE SOLD. IFTHE NUMBER OF SELLERS (PRODUCERS) DECREASES AND THEIRPRODUCTION DECREASES, THEN SUPPLY WILL SHIFT BACK AS WELL.8. The supply of canvas covers from the Cheung Company to the canvasmarket is 300 canvases if the price per canvas is RNB2,000. The supply of canvases from the Liu Company is 314 canvases if the price per canvas is RNB2,000. What is the market supply of canvases at a price of RNB2,000?MARKET SUPPLY OF CANVASES AT ANY GIVEN PRICE IS THE ADDITION OF THE SUPPLY OF EACH PRODUCER AT THAT GIVEN PRICE, WHICH IN THIS CASE WOULD BE 614CANVASES IF THERE ARE ONLY THE TWO SUPPLIERS IN THE MARKET.9. The demand function for a good, Q, is given by Q D = 12 – P, while thesupply function for Q is given by Q S = 4 + 3P, where P = price. Solve for the equilibrium quantity, Q, and price, P, in the market.SET Q D = Q S, OR 12 – P = 4 + 3P, OR 4P = 8, OR P = 8/4 = 2, SO P = 2SUBSTITUTE P = 2 INTO Q D = 12 – P, OR Q = 12 – 2 = 10, SO Q = 1010. Now suppose that the demand for good Q shifts out (same as shiftingupwards on the supply curve) and the demand curve under theseconditions now becomes Q D = 14 – P. In addition, because of a shortage in inputs used to produce good Q, the supply of Q shifts back and the supply function becomes Q S = 2 + 3P. Now solve for the new equilibrium price, P, and quantity, Q, in the market.AGAIN SET Q D = Q S UNDER THE NEW SUPPLY AND DEMANDCONDITIONS: 14 –P = 2 + 3P, OR 4P = 12, AND P = 3SUBSTITUTE P = 3 INTO Q = 14 – P = 14 – 3 = 11, SO PRICE = 3 ANDQUANTITY = 11 BECAUSE OF THESE SHIFTS IN DEMAND AND SUPPLY.11. Define the economic meaning of the term, “Price Elasticity of Demand” inwords and also in terms of percentage changes.)THE PRICE ELASTICITY OF DEMAND IS A MEASURE OF HOW MUCHQUANTITY DEMANDED OF A GOOD OR SERVICE RESPONDS TO ACHANGE IN PRICE OF THE GOOD OR SERVICE, AND IS COMPUTED AS THE PERCENTAGE IN QUANTITY DEMANDED DIVIDED BY THEPERCENTAGE CHANGE IN THE PRICE OF THE GOOD OR SERVICE.12. Derive the price elasticity of demand using the midpoint method if thequantity purchased of a good is 60 units at price $HK8,000 and changes to70 units purchased at a price of $HK6,000.THE MIDPOINT METHOD OF COMPUTING THE PRICE ELASTICITY OFDEMAND = ((Q2– Q1)/ (Q2 + Q1)/2) / ((P2– P1)/(P2 + P1)/2)((70 – 60) / (70 + 60)/2 ) / ((6000 – 8000)/ (6000 + 8000)/2) = -0.5384613. a) The quantity of Women’s purses (in some locations women call thesehandbags) purchased decreases 67 % as price is increased by 22%. What is the price elasticity of demand for women’s purses?IN THIS CASE, PRICE ELASTICITY OF DEMAND =- 76 PERCENT / 22 PERCENT = - 3. 45455b) Do women’s purses have an elastic demand elasticity or an inelasticdemand elasticity from your answer derived in part a) above? Explain. THE ABSOLUTE VALUE OF THE ELASTIITY HERE IS 3.45455 > 1, SO THE ELASTICITY OF WOMENS PURSES IS ELASTIC MEANING THAT AS PRICE DECREASES, THE QUANTITY DEMANDED INCREASES MORE THAN THE PERCENTAGE DECREASE IN PRICE. OR, SAID ANOTHER WAY, AS PRICE INCREASES, THE QUANTITY DEMANDED DECREASES GREATER THANTHE PECENTAGE PRICE INCREASE.14. You are the manager of a clothing store and you have information that thepric e elasticity of demand on men’s shirts is -1.568. What would you do to increase shirt revenues? (Choose from the choices below and explain your choice)a) Increase price?b) Initiate a sale from time to time by decreasing prices of men’s shirts?c) Only sell men’s cotton pants?THE PRICE ELASTICITY OF DEMAND HERE SUGGESTS THAT MEN’SSHIRTS HAVE ELASTIC DEMAND. SO A 10 PERCENTAGE DECREASE IN THE PRICE OF MEN’S SHIRTS INDUCES A GREATER THAN 10PERCENT INCREASE IN QUANTITY DEMANDED. SO THE STRATEGYWOULD BE TO DECREASE PRICES BY HAVING A SALE FROM TIME TO TIME IN ORDER TO INCREASE REVENUES ON THE SALE OF MEN’SSHIRTS, SINCE QUANTITY DEMANDED INCREASES GREATER THANPRICE DECLINE, THIS INCREASING REVENUE.15. The income elasticity of demand for watches in Hong Kong is 0.785. Whathappens to the demand for watches as incomes in Hong Kong increase?Explain.ONE SUCH SCENARIO WOULD BE THAT AS INCOMES INCREASE SAY BY10 PERCENT, THEN THE QUANTITY OF WATCHES DEMANDEDINCREASES BY 7.85 PERCENT. SO AS INCOMES INCREASE, THEDEMAND FOR WATCHES INCREASES. SUCH AN INCREASE IN INCOME CREATES AN OUTWARD SHIFT IN THE DEMAND FOR WATCHES.16. The cross-price elasticity of demand for oranges relative to the price ofpineapple is 0.286. Are oranges and pineapples complements orsubstitutes in consumption? Explain your answer.SINCE THE CROSS-PRICE ELASTICITY OF DEMAND IS POSITIVE, ANINCREASE IN THE PRICE OF PINEAPPLE INCREASES THE DEMAND FOR ORANGES, THAT IS THE DEMAND FOR ORANGES EXPERIENCES APOSITIVE (OUTWARD) SHIFT IN DEMAND. ORANGES AND PINEAPPLE ARE SUBSTITUTE GOODS ACCORDING TO THE CROSS-PRICEELASTICITY.17. Suppose the price of milk in the United States increases from $2.85 pergallon to $3.15 per gallon and the quantity supplied increases from 9,000 to 11,000 gallons per month. Derive the price elasticity of milk supply in the United States.USING THE MID-POINT METHOD OF CALCULATING THE SUPPLYELASCTITY WE OBTAIN,((11000 -9000)/(11000+9000)/2)/ ((3.15 – 2.85)/(3.15 + 2.85)/2) = 1.997AS THE PRICE ELASTICITY OF SUPPLY OF MILK.18. Both the demand for and supply of rice in Thailand are inelastic, but a newhybrid rice is developed that increases the yield of rice per hectare inThailand.a) Is this good news for Thai agriculture? Explain.YES, THIS IS GOOD NEWS FOR THAI AGRICULTURE, SINCE NOW MORE RICE CAN BE PRODUCED AND PRODUCED MORE EFFICIENTLY. THE SUPPLY CURVE OR FUNCTION FOR RICE SHIFTS OUTWARD. MORE RICE CAN NOW BE PRODUCED PER UNIT OF LAND IN THAILAND.b) Is this good revenue news for individual Thai rice farmers? ExplainTHE SUPPLY CURVE FOR RICE SHIFTS OUTWARD AND MORE RICE IS PRODUCED FROM THAI AGRICULTURE. IF THE DEMAND FOR RICE DOES NOT CHANGE, THEN THE PRICE FOR RICE IN THAILAND WILL FALL AND DEPENDING ON THE ELASTICITY OF DEMAND FOR RICE IN THAILAND, REVENUE TO THAI RICE FARMERS COULD DECREASE SINCE THEY ARE PRODUCING MORE RICE. IF THE DEMAND FOR RICE IS INELASTIC, THEN PRICE DECLINES ARE GREATER THAN INCREASES IN RICECONSUMPTION AND REVENUES TO THE FARMERS DECLINE.19. Explain the difference in prices changes in the short run relative to the longrun as a result in changes in demand and supply in the short run relative to the same changes over the long run.In the long run, both the price elasticities of supply and demand become less inelastic or more elastic and therefore more responsive to pricechanges relative to short run conditions of demand and supply. For any given shift of supply on a given demand, quantity increases or decreases are greater than price increases or decreases in the long run setting. In the long run there are more substitutes for any given product or servicemaking demand less inelastic or more elastic. On the supply side, smaller increases in price bring about greater increases in quantity suppliedrelative to the short run conditions of supply.20. Explain the factors or influences upon which the price elasticity of supplydepends.THE ELASTICITY OF SUPPLY DEPENDS ON THE FLEXIBILITY OFSELLERS TO CHANGE THE AMOUNT OF THE GOOD OR SERVICE THEY PRODUCE OR OFFER, ANDTHE TIME PERIOD BEING CONSIDERED, SUCH AS BEING MORE ELASTIC IN THE LONG RUN RELATIVE TO THE SHORT RUN.。
- 1、下载文档前请自行甄别文档内容的完整性,平台不提供额外的编辑、内容补充、找答案等附加服务。
- 2、"仅部分预览"的文档,不可在线预览部分如存在完整性等问题,可反馈申请退款(可完整预览的文档不适用该条件!)。
- 3、如文档侵犯您的权益,请联系客服反馈,我们会尽快为您处理(人工客服工作时间:9:00-18:30)。
✍ how to define and measure consumer surplus.✍ the link between sellers’ costs of producing a good and the supply curve.✍ how to define and measure producer surplus.✍ that the equilibrium of supply and demand maximizes total surplus in a market. CONTEXT AND PURPOSE:Chapter 7 is the first chapter in a three-chapter sequence on welfare economics and market efficiency. Chapter 7 employs the supply and demand model to develop consumer surplus and producer surplus as a measure of welfare and market efficiency. These concepts are then utilized in Chapters 8 and 9 to determine the winners and losers from taxation and restrictions on international trade.The purpose of Chapter 7 is to develop welfare economics—the study of how the allocation of resources affects economic well-being. Chapters 4 through 6 employed supply and demand in a positive framework, which focused on the question, “What is the equilibrium price and quantity in a market?” This chapter now addresses the normative question, “Is the equilibrium price and quantity in a market the best possible solution to the resource allocation problem, or is it simply the price and quantity that balance supply and demand?” Students will discover that under most circumstances the equilibrium price and quantity is also the one that maximizes welfare.KEY POINTS:? Consumer surplus equals buyers’ willingness to pay for a good minus the amount they actually pay for it, and it measures the benefit buyers get from participating in a market.Consumer surplus can be computed by finding the area below the demand curve and above the price.? Producer surplus equals the amount sellers receive for their goods minus their costs of production, and it measures the benefit sellers get from participating in a market. Producer surplus can be computed by finding the area below the price and above the supply curve.? An allocation of resources that maximizes the sum of consumer and producer surplus is said to be efficient. Policymakers are often concerned with the efficiency, as well as the equality, of economic outcomes.? The equilibrium of supply and demand maximizes the sum of consumer and producer surplus.That is, the invisible hand of the marketplace leads buyers and sellers to allocate resources efficiently.? Markets do not allocate resources efficiently in the presence of market failures such as market power or externalities.CHAPTER OUTLINE:I. Definition of welfare economics: the study of how the allocation of resources affects economic well-being.A. Willingness to Pay1. Definition of willingness to pay: the maximum amount that a buyer will pay for a good.2. Example: You are auctioning a mint-condition recording of Elvis Presley’s first album. Four buyers show up. Their willingness to pay is as follows:for John. Because John is willing to pay more than he has to for the album,he derives some benefit from participating in the market.3. Definition of consumer surplus: the amount a buyer is willing to pay for a good minus the amount the buyer actually pays for it.4. Note that if you had more than one copy of the album, the price in the auction would end up being lower (a little over $70 in the case of two albums) and both John and Paul would gain consumer surplus.B. Using the Demand Curve to Measure Consumer Surplus1. We can use the information on willingness to pay to derive a demand curve for the rare2. . Because the demand curve shows the buyers’ willingness to pay, we can use the demand curve to measure consumer surplus.C. How a Lower Price Raises Consumer Surplusare paying less for the product than before (area A on the graph).b. Because the price is now lower, some new buyers will enter the market and receive consumer surplus on these additional units of output purchased (area B on the graph).D. What Does Consumer Surplus Measure?1. Remember that consumer surplus is the difference between the amount that buyers are willing to pay for a good and the price that they actually pay.2. Thus, it measures the benefit that consumers receive from the good as the buyers themselves perceive it.III. Producer SurplusA. Cost and the Willingness to Sell1. Definition of cost: the value of everything a seller must give up to produce a good .2. Example: You want to hire someone to paint your house. You accept bids for the work from four sellers. Each painter is willing to work if the price you will pay exceeds her opportunity cost. (Note that this opportunity cost thus represents willingness to sell.) The costs are: ALTERNATIVE CLASSROOM EXAMPLE:Review the material on price ceilings from Chapter 6. Redraw the market for two-bedroom apartments in your town. Draw in a price ceiling below the equilibriumprice.Then go through:✍ consumer surplus before the price ceiling is put into place.✍ consumer surplus after the price ceiling is put into place.You will need to take some time to explain the relationship between the producers’ willingness to sell and the cost of producing the good. The relationship between cost and the supply curve is not as apparent as the relationship between the demand curve and willingness to pay. It is important to stress that consumer surplus is measured in monetary terms. Consumer surplus gives us a way to place a monetary cost on inefficient market outcomes (due to government involvement or market failure).except for Grandma. Because Grandma receives more than she would require to paint the house, she derives some benefit from producing in the market.4.Definition of producer surplus: the amount a seller is paid for a good minus the seller’s cost of providing it.5. Note that if you had more than one house to paint, the price in the auction would end up being higher (a little under $800 in the case of two houses) and both Grandma and Georgia would gain producer surplus.B. Using the Supply Curve to Measure Producer Surplus1. We can use the information on cost (willingness to sell) to derive a supply curve for2. marginal seller . Because the supply curve shows the sellers’ cost (willingness to sell), we can use the supply curve to measure producer surplus.are receiving more for the product than before (area C on the graph).b. Because the price is now higher, some new sellers will enter the market and receive producer surplus on these additional units of output sold (area D on the graph).D. Producer surplus is used to measure the economic well-being of producers, much like consumer surplus is used to measure the economic well-being of consumers.ALTERNATIVE CLASSROOM EXAMPLE:Review the material on price floors from Chapter 6. Redraw the market for anagricultural product such as corn. Draw in a price support above the equilibriumprice.Then go through:✍ producer surplus before the price support is put in place.✍ producer surplus after the price support is put in place.Make sure that you discuss the cost of the price support to taxpayers.IV.Market EfficiencyA. The Benevolent Social Planner1. The economic well-being of everyone in society can be measured by total surplus, which is the sum of consumer surplus and producer surplus:Total Surplus = Consumer Surplus + Producer SurplusTotal Surplus = (Value to Buyers – Amount Paid by Buyers) +(Amount Received by Sellers – Cost to Sellers)Because the Amount Paid by Buyers = Amount Received bySellers:2. Definition of efficiency: the property of a resource allocation of maximizing the total surplus received by all members of society .3. Definition of equality: the property of distributing economic prosperity uniformly the members of society .a. Buyers who value the product more than the equilibrium price will purchase the product; those who do not, will not purchase the product. In other words, the free market allocates the supply of a good to the buyers who value it most highly, as measured by their willingness to pay.b. Sellers whose costs are lower than the equilibrium price will produce the product; those whose costs are higher, will not produce the product. In other words, the free market allocates the demand for goods to the sellers who can produce it at the lowest cost.to the marginal buyer is greater than the cost to the marginal seller so total surplus would rise if output increases.b. At any quantity of output greater than the equilibrium quantity, the value of the product to the marginal buyer is less than the cost to the marginal seller so total surplus would rise if output decreases.3. Note that this is one of the reasons that economists believe Principle #6: Markets are usually a good way to organize economic activity.It would be a good idea to remind students that there are circumstances whenthe market process does not lead to the most efficient outcome. Examplesinclude situations such as when a firm (or buyer) has market power over priceor when there are externalities present. These situations will be discussed inlater chapters.Pretty Woman, Chapter 6. Vivien (Julia Roberts) and Edward (Richard Gere)negotiate a price. Afterward, Vivien reveals she would have accepted a lowerprice, while Edward admits he would have paid more. If you have done a goodjob of introducing consumer and producer surplus, you will see the light bulbsgo off above your students’ heads as they watch this clip.C. In the News: Ticket Scalping1. Ticket scalping is an example of how markets work to achieve an efficient outcome.2. This article from The Boston Globe de scribes economist Chip Case’s experience with ticket scalping.D. Case Study: Should There Be a Market in Organs?1. As a matter of public policy, people are not allowed to sell their organs.a. In essence, this means that there is a price ceiling on organs of $0.b. This has led to a shortage of organs.2. The creation of a market for organs would lead to a more efficient allocation of resources, but critics worry about the equity of a market system for organs.V. Market Efficiency and Market FailureA. To conclude that markets are efficient, we made several assumptions about how markets worked.1. Perfectly competitive markets.2. No externalities.B. When these assumptions do not hold, the market equilibrium may not be efficient.C. When markets fail, public policy can potentially remedy the situation. SOLUTIONS TO TEXT PROBLEMS:Quick Quizzes1. Figure 1 shows the demand curve for turkey. The price of turkey is P1 and the consumer surplus that results from that price is denoted CS. Consumer surplus is the amount a buyer is willing to pay for a good minus the amount the buyer actually pays for it. It measures the benefit to buyers of participating in a market.Figure 1 Figure 22. Figure 2 shows the supply curve for turkey. The price of turkey is P1 and the producer surplus that results from that price is denoted PS. Producer surplus is the amount sellers are paid for a good minus the sellers’ cost of providing it (measured by the supply curve). It measures the benefit to sellers of participating in a market.Figure 33. Figure 3 shows the supply and demand for turkey. The price of turkey is P1, consumer surplus is CS, and producer surplus is PS. Producing more turkeys than the equilibrium quantity would lower total surplus because the value to the marginal buyer would be lower than the cost to the marginal seller on those additional units.Questions for Review1. The price a buyer is willing to pay, consumer surplus, and the demand curve are all closely related. The height of the demand curve represents the willingness to pay of the buyers. Consumer surplus is the area below the demand curve and above the price, which equals the price that each buyer is willing to pay minus the price actually paid.2. Sellers' costs, producer surplus, and the supply curve are all closely related. The height of the supply curve represents the costs of the sellers. Producer surplus is the area below the price and above the supply curve, which equals the price received minus each seller's costs of producing the good.Figure 43. Figure 4 shows producer and consumer surplus in a supply-and-demand diagram.4. An allocation of resources is efficient if it maximizes total surplus, the sum of consumer surplus and producer surplus. But efficiency may not be the only goal of economic policymakers; they may also be concerned about equity the fairness of the distribution of well-being.5. The invisible hand of the marketplace guides the self-interest of buyers and sellers into promoting general economic well-being. Despite decentralized decision making and self-interested decision makers, free markets often lead to an efficient outcome.6. Two types of market failure are market power and externalities. Market power may cause market outcomes to be inefficient because firms may cause price and quantity to differ from the levels they would be under perfect competition, which keeps total surplus from being maximized. Externalities are side effects that are not taken into account by buyers and sellers. As a result, the free market does not maximize total surplus.Problems and Applications1. a. Consumer surplus is equal to willingness to pay minus the price paid. Therefore, Melissa’s willingness to pay must be $200 ($120 + $80).b. Her consumer surplus at a price of $90 would be $200 ? $90 = $110.c. If the price of an iPod was $250, Melissa would not have purchased one because the price is greater than her willingness to pay. Therefore, she would receive no consumer surplus.2. If an early freeze in California sours the lemon crop, the supply curve for lemons shifts to the left, as shown in Figure 5. The result is a rise in the price of lemons and a decline in consumer surplus from A + B + C to just A. So consumer surplus declines by the amount B + C.Figure 5 Figure 6In the market for lemonade, the higher cost of lemons reduces the supply of lemonade, as shown in Figure 6. The result is a rise in the price of lemonade and a decline in consumer surplus from D + E + F to just D, a loss of E + F. Note that an event that affects consumer surplus in one market often has effects on consumer surplus in other markets.3. A rise in the demand for French bread leads to an increase in producer surplus in the market for French bread, as shown in Figure 7. The shift of the demand curve leads to an increased price, which increases producer surplus from area A to area A + B + C.Figure 7The increased quantity of French bread being sold increases the demand for flour, as shown in Figure 8. As a result, the price of flour rises, increasing producer surplus from area Dto D + E + F. Note that an event that affects producer surplus in one market leads to effects on producer surplus in related markets.Figure 84. a.Figure 9b. When the price of a bottle of water is $4, Bert buys two bottles of water. His consumer surplus is shown as area A in the figure. He values his first bottle of water at $7, but pays only $4 for it, so has consumer surplus of $3. He values his second bottle of water at $5, but pays only $4for it, so has consumer surplus of $1. Thus Bert’s total consumer surplus is $3 + $1 = $4, which is the area of A in the figure.c. When the price of a bottle of water falls from $4 to $2, Bert buys three bottles of water, an increase of one. His consumer surplus consists of both areas A and B in the figure, an increase in the amount of area B. He gets consumer surplus of $5 from the first bottle ($7 value minus $2 price), $3 from the second bottle ($5 value minus $2 price), and $1 from the third bottle ($3 value minus $2 price), for a total consumer surplus of $9. Thus consumer surplus rises by $5 (which is the size of area B) when the price of a bottle of water falls from $4 to $2.5. a.Figure 10b. When the price of a bottle of water is $4, Ernie sells two bottles of water. His producer surplus is shown as area A in the figure. He receives $4 for his first bottle of water, but it costs only $1 to produce, so Ernie has producer surplus of $3. He also receives $4 for his second bottle of water, which costs $3 to produce, so he has producer surplus of $1. Thus Ernie’s total producer surplus is $3 + $1 = $4, which is the area of A in the figure.c. When the price of a bottle of water rises from $4 to $6, Ernie sells three bottles of water, an increase of one. His producer surplus consists of both areas A and B in the figure, an increase by the amount of area B. He gets producer surplus of $5 from the first bottle ($6 price minus $1 cost), $3 from the second bottle ($6 price minus $3 cost), and $1 from the third bottle ($6 price minus $5 price), for a total producer surplus of $9. Thus producer surplus rises by $5 (which is the size of area B) when the price of a bottle of water rises from $4 to $6.6. a. From Ernie’s supply schedule and Bert’s demand schedule, the quantityequilibrium quantity of two.b. At a price of $4, consumer surplus is $4 and producer surplus is $4, as shown in Problems 3 and 4 above. Total surplus is $4 + $4 = $8.c. If Ernie produced one less bottle, his producer surplus would decline to $3, as shown in Problem 4 above. If Bert consumed one less bottle, his consumer surplus would decline to $3, as shown in Problem 3 above. So total surplus would decline to $3 + $3 = $6.d. If Ernie produced one additional bottle of water, his cost would be $5, but the price is only $4, so his producer surplus would decline by $1. If Bert consumed one additional bottle of water, his value would be $3, but the price is $4, so his consumer surplus would decline by $1. So total surplus declines by $1 + $1 = $2.7. a. The effect of falling production costs in the market for stereos results in a shift to the right in the supply curve, as shown in Figure 11. As a result, the equilibrium price of stereos declines and the equilibrium quantity increases.Figure 11b. The decline in the price of stereos increases consumer surplus from area A to A + B + C + D, an increase in the amount B + C + D. Prior to the shift in supply, producer surplus was areas B + E (the area above the supply curve and below the price). After the shift in supply, producer surplus is areas E + F + G. So producer surplus changes by the amount F + G – B, which may be positive or negative. The increase in quantity increases producer surplus, while the decline in the price reduces producer surplus. Because consumer surplus rises by B + C + D and producer surplus rises by F + G – B, total surplus rises by C + D + F + G.c. If the supply of stereos is very elastic, then the shift of the supply curve benefits consumers most. To take the most dramatic case, suppose the supply curve were horizontal, as shown in Figure 12. Then there is no producer surplus at all. Consumers capture all the benefits of falling production costs, with consumer surplus rising from area A to area A + B.Figure 128. Figure 13 shows supply and demand curves for haircuts. Supply equals demand at a quantity of three haircuts and a price between $4 and $5. Firms A, C, and D should cut the hair of Ellen, Jerry, and Phil. Oprah’s willingness to pay is too low and firm B’s costs are too high, so they do not participate. The maximum total surplus is the area between the demand and supply curves, which totals $11 ($8 value minus $2 cost for the first haircut, plus $7 value minus $3 cost for the second, plus $5 value minus $4 cost for the third).Figure 139. a. The effect of falling production costs in the market for computers results in a shift to the right in the supply curve, as shown in Figure 14. As a result, the equilibrium price of computers declines and the equilibrium quantity increases. The decline in the price of computers increases consumer surplus from area A to A + B + C + D, an increase in the amount B + C + D.Figure 14 Figure 15Prior to the shift in supply, producer surplus was areas B + E (the area above thesupply curve and below the price). After the shift in supply, producer surplus isareas E + F + G. So producer surplus changes by the amount F + G – B, whichmay be positive or negative. The increase in quantity increases producer surplus,while the decline in the price reduces producer surplus. Because consumer surplusrises by B + C + D and producer surplus rises by F + G – B, total surplus rises byC +D + F + G.b. Because typewriters are substitutes for computers, the decline in the price of computers means that people substitute computers for typewriters, shifting the demand for typewriters to the left, as shown in Figure 15. The result is a decline in both the equilibrium price and equilibrium quantity of typewriters. Consumer surplus in the typewriter market changes from area A + B to A + C, a net change of C – B. Producer surplus changes from area C + D + E to area E, a net loss of C + D. Typewriter producers are sad about technological advances in computers because their producer surplus declines.c. Because software and computers are complements, the decline in the price and increase in the quantity of computers means that the demand for software increases, shifting the demand for software to the right, as shown in Figure 16. The result is an increase in both the price and quantity of software. Consumer surplus in the software market changes from B + C to A + B, anet change of A – C. Producer surplus changes from E to C + D + E, an increase of C + D, so software producers should be happy about the technological progress in computers.Figure 16d. Yes, this analysis helps explain why Bill Gates is one the world’s richest people, because his company produces a lot of software that is a complement with computers and there has been tremendous technological advance in computers.10. a. With Provider A, the cost of an extra minute is $0. With Provider B, the cost of anextra minute is $1.b. With Provider A, my friend will purchase 150 minutes [= 150 – (50)(0)]. WithProvider B, my friend would purchase 100 minutes [= 150 – (50)(1)].c. With Provider A, he would pay $120. The cost would be $100 with Provider B.Figure 17d. Figure 17 shows the friend’s demand. With Provider A, he buys 150 minutes andhis consumer surplus is equal to (1/2)(3)(150) – 120 = 105. With Provider B, hisconsumer surplus is equal to (1/2)(2)(100) = 100.e. I would recommend Provider A because he receives greater consumer surplus.11. a. Figure 18 illustrates the demand for medical care. If each procedure has a price of $100, quantity demanded will be Q1 procedures.Figure 18b. If consumers pay only $20 per procedure, the quantity demanded will be Q2 procedures. Because the cost to society is $100, the number of procedures performed is too large to maximize total surplus. The quantity that maximizes total surplus is Q1 procedures, which is less than Q2.c. The use of medical care is excessive in the sense that consumers get procedures whose value is less than the cost of producing them. As a result, the economy’s total surplus is reduced.d. To prevent this excessive use, the consumer must bear the marginal cost of the procedure. But this would require eliminating insurance. Another possibility would be that the insurance company, which pays most of the marginal cost of the procedure ($80, in this case) could decide whether the procedure should be performed. But the insurance company does not get the benefits of the procedure, so its decisions may not reflect the value to the consumer.。