Q_KCSSS0001-2019管道泄漏检测系统
管道疏通-tv检测技术

TV检测技术的优点
电视检测技术适用于各种类型的管道检测,如排水管道、供水管道、燃气管道等。通过高清摄像机捕捉管道内部的图像,可以全面了解管道内部的状况,发现潜在的问题和缺陷,为后续的维护和修复工作提供重要的参考依据。
电视检测技术还可以用于管道新建工程的验收和在役管道的定期检查,确保管道的正常运行和安全性。通过实时监测和数据分析,可以及时发现潜在的问题和缺陷,采取相应的措施进行处理,避免问题扩大或造成更严重的后果。
TV检测技术在管道内部状况评估中的应用
管道腐蚀程度评估
管道清洁度评估
04
案例分析
TV检测技术在某小区管道疏通中的应用
某小区建于20世纪90年代,管道系统老化,经常出现堵塞问题。
采用TV检测技术对小区排水管道进行检测,发现管道内存在大量沉积物和堵塞物。
根据TV检测结果,制定疏通方案,包括高压清洗和化学清洗等措施。
TV检测技术的适用范围
03
TV检测技术在管道疏通中的应用
通过TV检测技术,可以快速准确地定位管道堵塞的位置,为后续的疏通工作提供准确的指导。
堵塞定位
TV检测技术可以识别不同类型的堵塞,如硬物堵塞、油脂堵塞、毛发堵塞等,有助于选择合适的疏通方法。
堵塞类型识别
TV检测技术在管道堵塞定位中的应用
TV检测技术在管道破损检测中的应用
节约水资源
及时疏通堵塞的管道,可以避免因管道堵塞造成的水资源浪费,有助于节约水资源。
ห้องสมุดไป่ตู้
管道疏通技术的发展历程
手工疏通:早期的管道疏通主要依靠手工操作,如使用竹片、铁钩等工具进行疏通。
02
TV检测技术介绍
电视检测技术(TV检测)是一种利用闭路电视监控系统(CCTV)进行管道内部状况检测和诊断的技术。通过将高清摄像机放入管道中,可以实时传输管道内部的图像到监视器或计算机屏幕上,以便对管道进行全面检查和评估。
管道内检测方案
中海油海底管线内管检测方案中国石化集团胜利石油管理局海上石油工程技术检验中心2014年7月目录1、海检中心介绍 (1)2、管线内检测的必要性 (4)3、检测依据 (9)4、项目准备 (10)5、管线情况调查 (13)8、清管 (15)9、管道几何检测 (16)10、漏磁检测 (19)11、检测报告 (23)12、质量目标及保证措施 (27)13、应急预案 (31)附件一:海检中心主要资质 (32)附件二、卡球风险控制 (38)附件三、卡球应急程序流程图 (39)1、海检中心介绍1.1单位简介“中国石化集团海上石油工程技术检验中心”(简称“海检中心”)成立于1999年,业务上受中国石化集团公司安全环保局和科技开发部管理,具有国家安全生产监督管理总局颁发的“海洋石油生产设施(浅海)发证检验机构”资质、“海洋石油天然气专业设备检验检测机构”资质,与中国船级社(简称“CCS”)同为国内仅有的两家发证检验机构之一,也是石油石化行业唯一一家具有发证检验资质的单位。
同时具有国家质量监督检验检疫总局颁发的“无损检测机构A级”资质,国家建设部颁发的无损检测工程专业承包壹级资质,是中国石化集团唯一一家A级资质无损检测机构,迈入全国检测行业20强行列。
1.2资质介绍1.2.1发证检验资质2009年12月,海检中心顺利通过国家安监总局专家组审查,获得国家安监总局颁发的“海洋石油生产设施(浅海)发证检验机构”资质,从此海检中心资质业务范围由滩海陆岸延伸到浅海海洋。
业务范围包括:可以完成以下设施的设计审查、安全专篇审查、设计图纸和资料的审查校核、施工方案的审查,对以下设施的建设过程进行检验,对设施整个寿命周期进行作业中定期检验。
1)人工岛;2)滩海陆岸油气生产设施;3)固定平台;4)海底管线;5)海底电缆;6)海上作业设施油气工艺系统。
对用于以上设施上的工程材料、钻井和修井设备、采油设备、锅炉和压力容器、火灾和可燃气体探测装置、安全阀、消防器材、钢丝绳等系物及被系物、电器仪表等设备进行认可。
提高塘燕复线管道泄漏监测系统的定位准确性-天津处
提高塘燕复线管道泄漏监测系统的定位准确性管道输送具有成本低廉、运营稳定、节省能源和安全性高等特点,在油气运输领域中得到了广泛应用。
腐蚀、焊缝缺陷、打孔盗油等因素而引起的管道泄漏不仅影响了管输的安全运行,而且还对人身及环境造成巨大的威胁。
基于现代控制理论、信号处理的负压波检测法在管道泄漏检测领域应用广泛。
这种检测法不仅不用设置流量计,使用设备少,工作量小,价钱便宜,而且检测速度快(能在60s内指示出泄漏的发生),定位精度较高,灵敏度也较高。
负压波检测的原理是:在管道泄漏发生后,管道泄漏处立即因流体物质的损失而引起局部流体密度减小,从而导致瞬时压降和速度差,这个瞬时的压降作用在流体介质上,就形成一个负压波,其通过管道和介质向泄漏点上下游以声速传播。
设置在管道两端的压力传感器检测到压力波信号,根据信号变化程度以及变化的时间差,利用信号相关处理方法就可以进行泄漏判定及泄漏定位。
负压波检测法具有较强的抗干扰能力和低廉的设备费用,但是具有较高的误报警率。
本文主要探讨和验证了提高检测频率、建立单独通信通道以及缩短检测距离对于提高负压波法的定位精度和降低误报警率的效果。
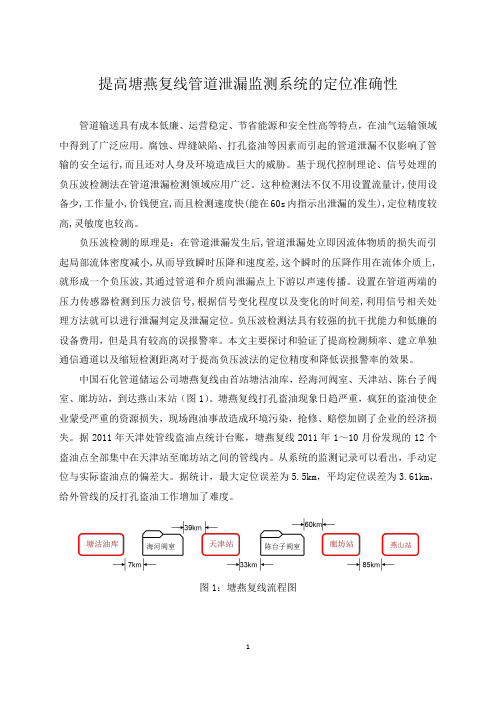
中国石化管道储运公司塘燕复线由首站塘沽油库,经海河阀室、天津站、陈台子阀室、廊坊站,到达燕山末站(图1)。
塘燕复线打孔盗油现象日趋严重,疯狂的盗油使企业蒙受严重的资源损失,现场跑油事故造成环境污染,抢修、赔偿加剧了企业的经济损失。
据2011年天津处管线盗油点统计台账,塘燕复线2011年1~10月份发现的12个盗油点全部集中在天津站至廊坊站之间的管线内。
从系统的监测记录可以看出,手动定位与实际盗油点的偏差大。
据统计,最大定位误差为5.5km,平均定位误差为3.61km,给外管线的反打孔盗油工作增加了难度。
图1:塘燕复线流程图由于管道存在摩阻损失,泄漏引起的负压波在向上下游传输过程中逐渐衰减,并且衰减随管道长度的增加而增大。
如图2所示,当泄漏发生在靠近中间的位置(J)时,负压波衰减较小,管道两端可检测泄漏率最小。
泄漏检测仪操作说明书JT-1A

JT-1A地下管线泄漏探测仪用户操作手册扬州捷通供水技术设备有限公司目录1.前言 (1)1.1概述 (2)1.2注意事项 (2)1.2.1警告事项 (3)1.2.2注意事项 (3)1.3技术参数 (4)1.4技术术语 (5)1.4.1滤波器 (5)1.4.2陷波器 (5)1.4.3最小值 (5)1.4.4水平柱状条 (6)1.4.5模式旋钮 (6)2.仪器组成 (7)2.1仪器部件组成 (7)2.2硬件组成部件 (8)2.2.1主机 (8)2.2.2控制手柄 (11)2.2.3传感器 (12)2.2.4耳机 (13)2.2.5电池组与充电器 (14)3.使用检测仪 (15)3.1仪器安装 (15)3.2使用前检查 (16)3.3开机流程 (17)3.4开机页面 (18)3.5等待页面 (18)3.6检测页面 (19)4.泄漏探测方法 (20)4.1沿管线探测 (20)4.2定位泄漏点 (22)4.3频散对泄漏定位的影响 (23)5.疑难解答 (24)1.前言非常感谢您选择使用JT-1A地下管线泄漏探测仪。
本说明书详细阐述了如何操作和使用JT-1A地下管线泄漏探测仪。
本说明书详细描述了JT-1A地下管线泄漏探测仪的组成、功能、操作方式、注意事项以及使用探测仪进行埋地管道泄漏探测的方法。
请您在操作或使用本仪器之前务必仔细阅读并完全理解本操作说明书中的内容。
如果您对JT-1A地下管线泄漏探测仪在操作和使用上有任何疑问,可随时拨打我公司电话(0514)87236231,我们会向您提供及时而热诚的技术支持和服务。
谢谢合作!请您妥善保管本说明书以便需要时使用,如有说明书遗失或损坏,请您立即联系我公司。
1.1概述JT-1A地下管线泄漏探测仪通过传感器拾取地下压力管道破损泄漏所产生的振动信号来准确定位泄漏点的位置。
本泄漏检测仪配置了适应不同检测环境的传感器,从而能有效地实现泄漏点的检测与定位。
通过选择该检测仪器中配置的16组频段组合中的任何一组频段来检测泄漏信号,以满足不同材质/管径管道、不同工作地段(埋层介质)的泄漏检测需要。
基于DSP的管道泄漏特征识别技术
倌息化应用 TION TECHNOLOGY APPLICATION |基于D S P 的管道泄漏特征识別技术贺诗瑶1刘钇池2魏赞1徐艳艳1李红1(1.中国石油天然气集团公司华北油田分公司第三采油厂河北河间062465;2■河北华北石油港华勘察规划设计有限公司河北任丘062465 }摘要:基于DSP (独特的微处理器)管道泄漏特征识别技术的研究与应用,改变了管道池漏报警系统通常所采取的 “三降一升”特征识别方式,采取可量化的极值识别的处理方式,通过对管道小流量泄漏监測的弱信号异常变化的量 化分析,实现了“管道泄漏报警定位”技术由笼统判断方式向精确识别方式的转变,解决了早期管线泄漏报警技术对 微小泄漏量不易识别、不能准确定位等问题。
关键字:微小泄漏量;嗓声千扰;泄漏特征;定位输油管道穿孔如果不能及时发现,会导致油品外泄、 环境污染、停输争-系列不良后果,抢险补漏时会造成大量 经_失。
单_D 人力、加强纖力度,虽纈_ 一定作用,纖果并不明显。
早期开发的管道泄漏报警系统,利 用负压力波法願,采取“三方麵进行特征识别判断,其识别过程需要人为参与,这不仅加大了管 道箱量泄漏定位的误差,而且,不符合管道麵报警系统警定位自动化的要求。
1基于DSP 的管道泄漏特征识别技术管道泄漏特征识别系统用于监测长输管线上某管段的 麵情况。
一旦某管雖生原油麵,该系统就会立即报警 并定位。
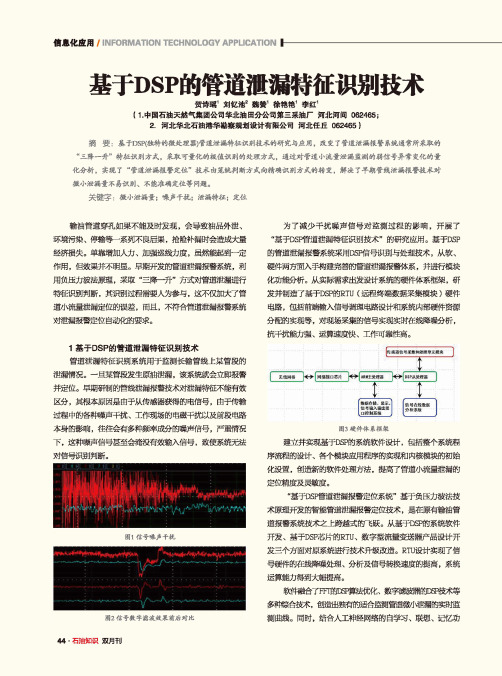
早期W 啲管线泄漏报雛术麵漏觀不能有效 区分,其根本原因是由于从传感器获得的电信号,由于传输 过涯中的各种矂声干扰、工作现场的电磁干扰以及前段电路 本身的影响,往往会有多种频率成分的曝声信号,严重情况 下,这种噪声信号甚至会淹没有效输入信号,致使系统无法 对信學只别判断。
图1信号噪声干扰为了减少干扰矂声信号对监测过程的影响,开展了 “基于DSPW 道泄漏特征识别技术,,的研究应用。
基于DSP 的管道麵报警系统采用D SP 信号识别与处理技术,从软、 硬件两方面入挪建完善的管道觀报雛系,并进行模块 化功會盼析。
建筑液压油管道物联网泄漏检测系统(IJEM-V9-N5-1)
I.J. Engineering and Manufacturing, 2019, 5, 1-21Published Online September 2019 in MECS ()DOI: 10.5815/ijem.2019.05.01Available online at /ijemIoT Leak Detection System for Building Hydronic PipesAudrius Urbonavicius a, Nagham Saeed aa School of Computing and Engineering, University of West London, W5 5RF, United KingdomReceived: 06 July 2019; Accepted: 10 August 2019; Published: 08 September 2019AbstractBuilding’s Air Conditioning systems require moving liquids for dweller comfort. Clogged pipes, system degradation can cause pressure buildups, leaks and other faults which leads to damage to the building. Most of the leaks in the commercial building occur due to poor maintenance and/or material degradation. Visual inspection is most predominantly used to solve this problem in the industry. This paper introduces the Internet of Things technology to detect leakage in building’s hydronic pipes with the support of sensors, fault detection method and mechanical control. The system consists of:Microcontroller, Windows application and website application. Internet of Things technology was used to monitor and control the hydronics using microcontroller’s capability of connecting to main server which is used to transmit the data to the cloud. The prototype was successfully built and tested. Promising results show that leaks above 2ml/s could be detected after 4 seconds specifically for the built small-scale system while control and monitor feature could be implemented with Internet of Things technology.Index Terms:Pipeline automation, Leak detection, Building services, Supervisory Control and Data Acquisition (SCADA) and Internet of Things (IoT), Industry IOT (IIOT).© 2019 Published by MECS Publisher. Selection and/or peer review under responsibility of the Research Association of Mode rn Education and Computer Science* Corresponding author.E-mail address: audriusurbo@2IoT Leak Detection System for Building Hydronic Pipes1.IntroductionBuilding design was always important engineering field, which embraces many different branches for great number of specialty engineers to work on. Mechanical, electrical and plumbing fields are the most important of them all. Fluid transportation, in this case – water, glycol, mineral oil or other coolant, is fault-sensitive section that needs attention. [1]Faults in the pipes result in leaks, which causes building damage and financial cost. In the older buildings and in some current infrastructure, leaks are being detected by visually inspecting the pipes, or noticing the apparent symptoms of leakage. These symptoms can range from higher energy usage, damaged walls, ceilings or higher water usage. Besides visual inspection, devices that shuts the water if it reaches the limit are used to detect the leaks too. [2]This paper proposes a system that could be used to monitor and control the building hydronic and other pipes. This aim requires several different objectives to be completed, which will be stated in the following section. In the building engineering field, this would closely relate to Building Management System (BMS) and Supervisory Control and Data Acquisition system (SCADA). This project was partially inspired by these systems and their current flaws. Connectivity is very important in these systems as BMS is critically important in managing energy usage. This can vary from lights left on, where no motion-detector switch is installed, to hot water leaks which would increase energy usage more substantially [3]. Current systems in market lack connectivity and automation, some systems are offering just supervisory monitoring, while others feature some automation. [4]The system proposed was designed to monitor and control the building pipelines and it also can be modified to use other sensors to save more energy and resources. The small-scale prototype was implemented to prove the methodology. IoT technology was used to create a monitor and control software. Interface with server alongside web application was developed to offer supervisory control features for remote and local users.The aim of this research is to create a solution for rapid control and monitoring of building hydronic pipelines. The system was required to be 4th generation of SCADA system. This means that Internet of Things technology needs to be integrated into the system, which improves interoperability [5]. The prototype (practical implementation) is to be done with these functions in mind:1. Demonstration of working leak detection techniquea. Receive data from sensors continuouslyb. Process datac. Send data to database2. Demonstration of control of the pipelinea. By processing data act by changing position of valves or other control componentsb. Act with user intervention by changing position of valves or other control components3. Demonstration of the state of the system in real-timea. Visualization:(1) Sensor activity(2) Control system states(3) Other component states and activitiesb. Create a graphical user interface in server supervisory and web applicationsThe three parts of the system will be designed to work together to create a software and hardware solution for hydronic pipe monitoring and control system. This system will be practically applied and tested.IoT Leak Detection System for Building Hydronic Pipes3 Aims and objectives are set to be completed by selecting best approach with aid of previous research. This will be discussed in the following section.The rest of the paper is organized as follows: section II dedicated for related work, section III presents the methodology behind the system. Detailed explanation for the system implementation was in section IV whereas section V showing the testing and calibration for the IoT Leak Detection System under normal conditions. Results were shown in section VI for uncontrolled and controlled leak. Section VII contains an analysis for the results achieved while section VIII summarize the finding. Finally, future work was provided in section IX.2.Literature reviewDetection of pipeline faults are also time-critical as most of the pipes in the buildings are in cavities hardly accessible. Leaks in such areas can cause great damage to the building, from damaged ceiling tiles, plasterboard, to other hydrophobic building materials such as wooden parts of the building. Furthermore, effects of leaks can cause illness as slow leaks cause humidity increase and it leads to mold formation. Also if the leak occurs in AC systems, it can cause higher energy consumption, especially in heating. All effects mentioned previously leads to higher maintenance cost [6]Most of the leaks in the commercial building occur due to poor maintenance and/or material degradation. Copper pipes are projected to last for 20-25 years [7], but failure can occur in the first years. Therefore, they require constant maintenance, but as some pipes are in hardly accessible places, it is hard to do so.Different pipelines in different industries require different solutions as one solution does not exist for all. Water Supply and Sewerage Utilities uses wider pipes than hydronic [8], but the principle is the same. Hitachi has developed the IoT gateway to control and monitor sewage pipes. [9]. A method uses optical fiber to transmit power and data to/from the sensors inside the pipes. This method is not applicable to hydronics as the pipe diameter is usually smaller than sewage and the high/low temperatures, tight bends not going to work inside the pipe. Sewage piping, on the other hand, has more area to work in. The cross-section diameters vary from 3 inches to 5 inches providing space to insert optical fiber without creating blockages or any other disruptions. This method can be adapted by using optical fiber instead of copper wires, inserted in the insulation (lagging) of the pipes, creating power and data links between the server and the sensors. This would increase reliability, since optical fiber is nonconductive and leaks/condensation in the lagging will not create right conditions to cause short circuit.One of the solutions for detecting leaks that could be applied in the building services is mass flowrate comparisons. [10] Not to be confused with volumetric flowrate comparison, mass flowrate is measured in units of mass per units of time. This method can be used for gas transportation as gases tend to expand when heated, meaning the volume increases while mass does not depend on pressure or temperature. Mass flow rate can be measured with Coriolis, thermal mass, and other flow meters. These sensors are generally expensive, meaning they are not suitable for the currently affordable practical experiments. Volumetric flow meters can be used as liquid in hydronic pipes changing temperature predictably. If the AC works as the district heating/cooling (cold/hot water is being pumped from outside facilities) temperature inlet and outlet of coil unit depends on the liquid temperature and room temperature. The temperature difference can be predicted and flow meter sensors calibrated to take this difference in account if it is high enough.Other field worth mentioning is oil/gas industry. It has been around for over a hundred years and the research on it promised big financial gains. Therefore, huge amounts of research on all aspects have been conducted. One of the subfields is oil pipelines, where Z. Jia and et al. [11] proposed a novel hoop strain based negative pressure wave (NPW) approach was used to detect and localize pipeline leakages in a 180 ft PVC pipeline equipped with five manually controllable leakage points. By having pressure and tank volumes4 IoT Leak Detection System for Building Hydronic Pipessensors can over time compared to identify the leak [12]. This method can be implemented in many areas where system medium is travelling between tanksOne of the monitoring system’s purpose is to identify the state of the flow. Many ways of acknowledging the flow has been researched and invented, one of them is vibration sensor [13]. Cracks in the operating pipe, therefore leak, causes vibration waves travelling through the pipe and surrounding medium. These mechanical vibrations are very small power signals requiring high signal-to-noise ratio hydrophones, acoustic emission or other sensors [14]. This method is preferably used in underground pipes as the medium (gravel, sand, concrete) between the sensor and the pipe helps the vibrations reach sensor in ground level and even pinpoint the exact location of the vibration source. This method is advanced, but hydronic pipes in the building create huge amounts of noise from compressors, valves and other AC components [15]IoT technology was discussed and developed as early as 1982 with vending machine being first physical every-day appliance connected to the internet. [16] Since then, IoT technology was broadly researched and expanded. As of 2019 it is common to have home appliances with internet connectivity feature such as fridges, toasters and doorbells. IoT technology is applied to numerous engineering fields: automotive, commercial devices, infrastructure, industrial etc. It is also constantly expanding as the costs are decreasing and the research of improvement is still rising. By 2020 Korean government made plan implies that more than 10000 plants to be optimized with the help of IoT and other information technology software.[17] Several issues rise due to the rapid development on IoT technology. Security flaws let the IoT devices to be controlled without authorization due to lack of encryption in communication. [18,19] General device safety is also concern as software bugs can cause unexpected results. If the sensor of the smart-door entry system malfunctions, it can enable access, creating dangerous situations. [20]3. MethodologyTechnique based on mass balance concept offers solution that can be implemented and calibrated to work on most of the systems where total quantity of fluid entering and leaving a network is the same [21]. Mass flowrate is great method as the liquid or gas inside expands and contracts due to the temperature change, meaning it will change in volume. On the other hand, it is complicated and expensive to implement mass flowrate in the system. Instead of this, volumetric flowrate was used instead, as the sensors are widely available and easy to implement. This, however, creates a problem if the liquid temperature in the pipeline is varying substantially. This Volumetric flow comparison method compares the flowrate and multiple points and checks invariances over the time. These invariances can be liquid slow drift which happens naturally or a leak between the sensors. Equation 1 illustrates the relationship between the inlet and outlet volume differences over time (flowrates) in theory. Variable Total Leak is the leakage amount in volume over time. It is defined by the difference of inlet and outlet flowrate. If the system is balanced (inlet flowrate is same as outlet flowrate under normal conditions), Total Leak will be zero. But the reality does not represent the theory and this equation can not be taken for granted, but it can be relied upon for future work.()()()21 0t t Total Leak t flowrate t flowrate t ==-⎡⎤⎣⎦∑ (1)Creating a viable system ready to be fitted commercially requires careful research and testing. A prototype was chosen to be built with most commonly used pipe in AC industry – 15mm copper pipe. As this is the most widely used transfer pipe, the results are to be expected to reflect the real-world situations. The methodology section contains theory and practical aspects of leak detection, mechanical control and software implementation. Multiple tests were done, proving the sensor validity and software functionality.SCADA systems uses wide range of components to unify and monitor and control the physical infrastructures or buildings. Sensors and controls are first level of physical layer. Sensors at the monitor pointIoT Leak Detection System for Building Hydronic Pipes 5sends the signal to specific devices, where signal is processed and control signal is either sent or not depending on the monitor point signal. Those specific devices can be Remote Terminal Unit (RTU), Programmable Logic Controller (PLC), Intelligent Endpoint Device (IED), and all of those devices have common function: to send, receive signals and use control components. These controllers are connected in network which unifies the system via Master Terminal Unit (MTU). MTU acts as the server and receives all data and sends it to databases or the last layer: interface. Interface is the layer connecting user and the system. Figure 1 shows the layout of SCADA system.For PLC/RTU/IED microcontroller was used. It is less expensive, easier to use, but less robust, not designed for SCADA systems. MTU, Interface and Database was used on one device, therefore simplifying the system.Fig. 1. SCADA system layout4. ImplementationPrototype was built to reassemble building district heating/cooling system, where main flow and return pipes are common. These systems work by supplying building with chilled/heated water and running it through Fan Coil Units (FCU) which consist of coil where heat is exchanged and a fan. Prototype does not consist of FCU, but the piping is similar to commonly found layout. Figure 2 shows the physical layer of the system with bottom pipe as flow and top as return with bypass pipe for emergencies in the middle.Fig. 2. Physical system layout6IoT Leak Detection System for Building Hydronic Pipes4.1 Leak detection.Leak detection was achieved by employing volumetric flow comparison technique to compare the flow at two or more different points in the pipeline. Simple line flow imbalances or average imbalances in pipe content over period of time can aid to detect a leak. By having two flow meters in series, a constant or repeated variance of flow means a possible leak. This technique does not detect the leak immediately as the flow meters have slight variances constantly and this needs to be averaged out and computed by cancelling out other parameters.The sensor itself was chosen to be turbine sensor due to low cost and easy operation as the prototype needs to be made within a set budget. Models of the flow sensors are YF-S201 [22] and YF-B1 [23]. They operate in the same principle, but calibration indices are different: 7 and 11 respectively.The flow was measured in liters per minute and later converted to milliliters per second (ml/s). Due to invariances in different flow meter calibration factors, normalized values were used for visual representation. Normalization was done by calibrating the sensors in the no-leak condition and taking the average value as normal, following sensor measurements were compiled as difference in ratio between normal and real time value from the average calibrated value.Initial testing concluded that, further calibration is required. Several following experiments were conducted, and calibration values got changed in trial and error method. After each test, calibration indices were changed to represent theoretical values as close as possible.4.2 Mechanical controlMechanical control was achieved by placing SOVs into the pipeline. These valves can be normally-open (NO) or normally-closed (NC), the usage of them depends on the usage of the pipe. For example, if pipe is constantly used, it is recommended to use NO valve to save energy and vice versa. It is important to have multiple SOVs to isolate the leak as the pressure affects the water from incoming and outgoing pipe directions. When leak occurs, the pressure affects the water from inlet and outlet, therefore, to minimize the leak amount, both directions need to be cut-off.DC pump was used to move the liquid across the system. The 2.5W pump reached maximum of 8L/min was proven to be within acceptable range. The real-world implementation would be more sophisticated. District heating uses primary pumps, secondary and set of boosters for bigger buildings.4.3 Monitoring and Control softwareThe software for monitoring and control consist of three parts: Microcontroller, Web application, Server and server interface. Microcontroller is used for signal processing and transmission between main server and the prototype. The server is the main interface and control unit, while web application is a smaller version of the main server, hosted in the cloud accessible with internet connection. The following sections include further details about each part4.4MicrocontrollerMicrocontroller uses relays for switching component states and serial Universal Asynchronous Receiver/Transmitter (UART) communication protocol. Arduino Nano was used as microcontroller as it is adequate for this operation. It was used for communications between server and the prototype. The microcontroller reads analogue voltages and converts it to digital data; therefore, it can be stored as in the program as integers, double, string or other datatypes. The data then can be manipulated and sent via the serialIoT Leak Detection System for Building Hydronic Pipes7 communication to the server. The main functions of microcontroller are:∙Send current SOVs and pump states to the server∙Calculate the flow∙Send current flow meter readings∙Send signals to relay module in order to control the flowMicrocontroller was set up to count the negative edges of the pulses per each second which gives frequency of the waveform. The frequency was calculated by multiplying it by calibration factor which gives liters per minute. In the meantime, control data was read from the server and if it mismatched (current different than read), the states of the components (SOVs, Pump) were changed.Fig. 3. Microcontroller activity flowchartFigure 3 illustrate the Microcontroller process flow. The Begin condition simply turns the power to integrated circuits and sets starts running the code. The condition can be triggered by turning on the power. After all variables are initialized and pins set up correctly, it starts counting pulses from sensor signal. Moreprecisely it counts negative edges from square wave outputted from the sensors. These steps are considered asa set-up, before the loop. The loop consists of arguments which are to be executed once. In following steps,8IoT Leak Detection System for Building Hydronic Pipespulse counting function is stopped and flowrate is calculated by dividing frequency by calibration factor. After the calculation is completed, the pulse counting process is started again. This was disabled because the variables used in calculation can change at the same time the flowrate is being calculated, causing errors. Sensor data and current component states are sent to the server via serial port. Right after that, data retrieved from the server is processed while changing the component states if they are found to be different from current states. As this is the last function block in the loop, the process is starting again.Data was sent using serial communications with server. The component states were in integer datatype while sensor data was kept in double datatype, because it was real number. All this data was then converted to string datatype and packed together with space as the separator. The process is visualized in figure 4.Fig. 4. Data sent from microcontroller to server5.Server and Server InterfaceServer was developed for local monitoring and control features of the system. The system gathers data from the controller and visualizes it on the interface. It also stores the values in local and cloud databases, therefore enabling IoT technology to use its potential remotely. This server application and interface was developed to have user friendly way of gaining full control over the system.Application is to be executed once and should run as long as the pipeline is active. When launching the executable, the communication link must be established between the software and the microcontroller. Before starting feeding the information to the system, multithreading process is started. One thread reads/writes data from/to microcontroller and updates the graphs and databases while other thread waits for user input commands. Data is also being changed in the first thread, because of this some drawbacks are created. These drawbacks (bugs) which occur due to closing the program and changing component states. While one thread wants to change the values through serial port, other thread also uses the same values, creating exceptionswhile crashing the program. These needs more time to resolve since multithreading software is found to bedifficult to develop. This process is visualized in figure 5.IoT Leak Detection System for Building Hydronic Pipes9Fig. 5. Server-side interface flowchartThe program for the server and interface was written in C# using Microsoft’s Windows Forms Graphical User Interface (GUI) class library and Microsoft Visual Studio 2017 as Integrated Development Environment (IDE). One form was used in the program and the components list in the form includes “Labels”, “Graphs”, “Buttons” and “TextBoxes”.Data from microcontroller was read using serial communication, in string lines. Since the lines were read constantly, it is possible the line read will be not timed correctly and values incorrect, therefore string data was read correctly if the length of it fell between 18 and 20 characters. Since smallest possible string while everything is 0 is 18 and largest is 20. The string read was split with space as splitter symbol. String split values were converted to integer or double datatypes. This process was visualized in figure 6.Process of data sending to the microcontroller with component state commands differs from data reading pro-cess due to the code limitation. Function in the microcontroller can read string line data until specific symbol. That specific symbol was chosen to be ‘$’. Integer and double datatype values were converted to string and put together with space as separator and symbol ‘$’ was added to the end of the string that was about to be sent. Full string sent data includes component states to be changed to and symbol $’ at the end.10IoT Leak Detection System for Building Hydronic PipesFig. 6. Server reading data from microcontroller processFig.7. Snapshot of the server monitoring interfaceFigure 6 shows the snapshot of the server-side interface application. Values on the right of ‘Calibrate’ button shows the values sent from the controller and the bottom ones show what is to be sent back to the controller. This was done for debug purposes as real-time debug technique is more efficient than built-in to IDE debugger.Button ‘Calibrate’ is self-explanatory, it calibrates and normalizes values for third graph when the system is in no-leak condition. During the calibration, the values read are being taken as ‘normal’ values and any deviation from it are graphed as ratio between ‘normal’ and averaged out in second graph. This was done due to different pressures at those points which leads to different amount of flow at the same time, but because itis in no-leak condition, the total amount of the flow is technically the same.“Override Controls” tick box changes the feed where the commands are being taken from. If it is not ticked, is being controlled from cloud, else it will be controlled by the server.5.1 Web ApplicationWeb-application purpose is to control and monitor the system over long distances. The server features connection with database and can control the components from the database, while web-application has ability to change those values in the database from which components are controlled from. The web application also able to visualize the data just like the server does, except is not yet implemented to update the graphs with in real-time. Figure 8 shows the design of the web application and the snapshot was taken during one of the experiments.It was developed with WebForms class library and it was hosted in Microsoft Azure servers. Most of the written code was also C# with some web development languages for website design.Fig.8. Snapshot of the web application screen5.2 Prototype initial set-upThe practical prototype tests were conducted to simulate the system as close to real life scenarios as possible. The Table 1 consists of initial set-up parameters and components in which tests were completed.Distance between flow meters was measured to be 40cm and the total length of the prototype equals to 1m.Table 1. Initial set-up parameters and componentsFigure 9 shows the full layout of the prototype system. It consists of three parts: software (IoT), hardware (controls) and plumbing (piping). IoT aspect features local and cloud database for storing sensor data. Physical layer, most importantly plumbing includes tank, two routes, flowrate sensors, SOVs and manual valve for simulating leak. Normal route is longer and pressure drop is higher due to SOV physical properties. Bypass route was made for leak minimization. During normal operation, liquid is flowing through normal route while SOV1 is closed and SOV2 and SOV3 are open, and in leak conditions liquid is flowing through bypass route, where SOV1 is open and rest of the SOVs are closed.Fig.9. The built prototype schematics Component Parameters Medium Water at 20 °C Pipes Diameter: 15mm Material: Copper Pump Nominal power: 2.5WMaximum flow rate: 8000ml/min Maximum pressure: 10Bar Flowrate meters Operating voltage: 5V Pulse Duty: 50% ±10% Calibration factors: 11 (YF-B1)7 (YF-201) SOV Operating voltage: 12V Default position (at stand-by state): closed Pressure drop: not given。
天然气管道泄漏检测方法、系统、终端及其存储介质[发明专利]
![天然气管道泄漏检测方法、系统、终端及其存储介质[发明专利]](https://img.taocdn.com/s3/m/a9d5e0e5ab00b52acfc789eb172ded630b1c986c.png)
专利名称:天然气管道泄漏检测方法、系统、终端及其存储介质
专利类型:发明专利
发明人:李新罡
申请号:CN202010415383.4
申请日:20200515
公开号:CN111678050B
公开日:
20220419
专利内容由知识产权出版社提供
摘要:本发明涉及一种天然气管道泄漏检测方法、系统、终端及其存储介质,解决了天然气管道泄漏检测效率低下且耗时耗力的问题,其包括获取管道上所选定需进行检测的两个检测节点;根据两个检测节点所处的位置以获取对应位置的流量检测信息;将两个流量检测信息的差值作为判断信息;将判断信息与所预设的流量阈值信息进行比较,若判断信息所对应的数值大于流量阈值信息所对应的数值,则形成泄漏信息;若判断信息所对应的数值小于等于流量阈值信息所对应的数值,则形成正常信息。
本发明能够通过对应的大数据分析判断实现天然气管道是否泄漏,大大降低了检测过程中的人力与物力,同时提高检测的效率。
申请人:宁波市北仑精诚设备安装有限公司
地址:315800 浙江省宁波市北仑区春晓咸昶村沙塘15-3号2幢
国籍:CN
更多信息请下载全文后查看。
- 1、下载文档前请自行甄别文档内容的完整性,平台不提供额外的编辑、内容补充、找答案等附加服务。
- 2、"仅部分预览"的文档,不可在线预览部分如存在完整性等问题,可反馈申请退款(可完整预览的文档不适用该条件!)。
- 3、如文档侵犯您的权益,请联系客服反馈,我们会尽快为您处理(人工客服工作时间:9:00-18:30)。
蚀试验 GB 3836.1-2010 爆炸性环境 第1部分:设备 通用要求 GB 3836.4-2010 爆炸性环境 第4部分:由本质安全型“i”保护的设备 GB 4208-2008 外壳防护等级(IP代码) GB/T 4798.1-2005 电工电子产品应用环境条件 贮存 GB/T 5604-1985 负荷传感器试验方法 GB 8566-2007 计算机软件开发规范 GB 8567-2006 计算机软件产品开发文件编制指南 JB/T 7482-2008 压电式压力传感器 SJ 20721-1998 压力传感器总规范 SY/T 0091-2006 油气田及管道计算机控制系统设计规范 SY/T 6069-2011 油气管道仪表及自动化系统运行技术规范 SY/T 6276-2010 石油天然气工业 健康、安全与环境管理体系 3 术语和定义 3.1 主站系统 由一台高性能的服务器、专业的控制软件和信号处理软件、报警系统、供电系统、通信系统组 成。把多个远程终端分站系统通过网络连接起来,实现对管道运行状态的实时监视。 3.2 分站系统 沿管道安装,包括传感器、信号调理器、数据采集器、通讯模块、供电模块等,主要功能是通 过传感器将管道内的信号转换为电信号,经过信号调理器进行滤波放大,然后通过数据采集器将电 信号转换为数字信号,再通过通讯模块将数据传送到主站系统。 3.3 工控机
1 范围 本标准规定了管道泄漏检测系统(以下简称系统)中的系统结构、技术要求、硬件配置、软件
系统、试验方法、系统验收及标志、包装、运输和贮存。 本标准适用于管道泄漏检测系统的设计、测试和验收。管道输送的介质可以为空气、天然气、
水、原油、成品油等。 2 规范性引用文件
下列文件对于本文件的应用是必不可少的。凡是注日期的引用文件,仅所注日期的版本适用于 本文件。凡是不注日期的引用文件,其最新版本(包括所有的修改单)适用于本文件。
前言
Q/KCSS0001-2014
根据《中华人民共和国石油天然气行业标准》制定本标准。 本标准严格按照 GB/T1.1-2009《标准化工作导则第 1 部分:标准的结构和编写》的要求进行编写。 本标准由北京科创三思科技发展有限公司提出并起草。 本标准主要起草人:王良风。
I
管道泄漏检测系统
Q/KCSS0001-2014
Q/HD
北京科创三思科技发展有限公司企业标准
Q/KCSS0001-2019
管道泄漏检测系统
2019-11-12 发布
2019-12-12 实施
北京科创三思科技发展有限公司 发布
目次
前 言..................................................................................................................................................................... I 1 范围................................................................................................................................................................... 1 2 规范性引用文件............................................................................................................................................... 1 3 术语和定义....................................................................................................................................................... 1 4 系统结构........................................................................................................................................................... 2 5 技术要求........................................................................................................................................................... 3 6 试验方法........................................................................................................................................................... 4 7 检验规则............................................................................................................................................................. 5 8 标志、包装、运输与贮存...............................................................................................................................5
GB/T 191-2008 包装储运图示标志 GB 1526-1989 信息处理 数据流程图、程序流程图、系统流程图、程序网络图和系统资源图
的文件编制符号及约定 GB/T 2423.1-2008 电工电子产品环境试验 第2部分:试验方法 试验A:低温 GB/T 2423.2-2008 电工电子产品环境试验 第2部分:试验方法 试验B:高温 GB/T 2423.40-1997 电工电子产品环境试验 第2部分:试验方法 试验Cx:未饱和高压蒸汽