Matlab关于二值图像的最小外接矩形问题
MATLAB二维绘图技巧
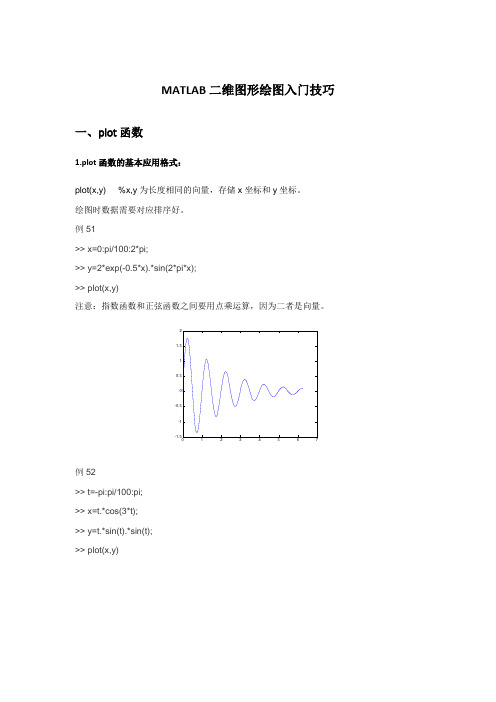
MATLAB二维图形绘图入门技巧一、plot函数1.plot函数的基本应用格式:2. 含多个输入参数的plot函数plot函数可以包含假设干组向量对,每一组可以绘制出一条曲线。
含多个输入参数的plot举例如下:>>X=linspace(5,100,20) % 产生从5到100范围内的20个等分数据X =5 10 15 20 25 30 35 40 45 50 55 60 65 70 75 80 85 90 95 100ps:这和X=[5 : 5 : 100]的效果是一样的。
3.plot函数画矩阵利用plot函数可以直接将矩阵的数据绘制在图形窗体中,此时plot函数将矩阵的每一列数据作为一条曲线绘制在窗体中。
如>> A=pascal(5)A =1 1 1 1 11 2 3 4 51 3 6 10 151 4 10 20 351 5 15 35 704. plot函数生成的图像设置Matlab提供了一些绘图选项,用于确定所绘曲线的线型、颜色和数据点标记符号。
这些选项如表所示:w 白色 h 六角星例 用不同的线型和颜色在同一坐标内绘制曲线 及其包络线。
>> x=(0:pi/100:2*pi)'; %撇号表示对矩阵进行转置 >> y1=2*exp(-0.5*x)*[1,-1]; >> y2=2*exp(-0.5*x).*sin(2*pi*x); >> x1=(0:12)/2;>> y3=2*exp(-0.5*x1).*sin(2*pi*x1); >> plot(x,y1,'k:',x,y2,'b--',x1,y3,'rp');在该plot 函数中包含了3组绘图参数,第一组用黑色虚线画出两条包络线,第二组用蓝色双划线画出曲线y ,第三组用红色五角星离散标出数据点。
matlab 最小内接矩形

matlab 最小内接矩形全文共四篇示例,供读者参考第一篇示例:MATLAB是一种非常强大的数学软件,拥有丰富的函数库和功能,可以用来处理各种复杂的数学问题。
在这篇文章中,我们将介绍MATLAB中如何计算最小内接矩形的算法和方法。
最小内接矩形是指一个矩形的内部包含某个给定形状(比如多边形、圆形等),并且该矩形的面积最小。
在实际应用中,最小内接矩形常常用来刻画图形的几何特征,计算图形的面积、周长等信息。
在MATLAB中,可以利用几何算法和优化算法来计算最小内接矩形。
我们首先来看一下如何计算给定形状的最小内接矩形。
假设我们有一个多边形,我们希望计算该多边形的最小内接矩形。
我们需要将多边形表示为顶点坐标的形式。
在MATLAB中,可以使用polyshape函数来创建一个多边形对象,并通过Vertices属性获取多边形的顶点坐标。
```matlab% 创建一个多边形对象poly = polyshape([0 1 1 0],[0 0 1 1]);% 获取多边形的顶点坐标vertices = poly.Vertices;```接下来,我们可以利用MATLAB中的凸包函数convhull函数来计算多边形的凸包。
凸包是将多边形包围得最紧密的凸多边形,其顶点坐标即为多边形最小内接矩形的四个顶点。
```matlab% 计算多边形的凸包k = convhull(vertices);convex_vertices = vertices(k,:);```得到凸包的顶点坐标后,我们可以进一步计算最小内接矩形的顶点坐标。
在MATLAB中,可以利用最小二乘拟合函数polyfit函数来拟合一个矩形对角线的直线,然后根据拟合直线与凸包的交点来得到最小内接矩形的顶点坐标。
```matlab% 拟合对角线直线p = polyfit(convex_vertices(:,1),convex_vertices(:,2),1);x_intersect = sum(convex_vertices(:,2) - p(2))/p(1)/4;y_intersect = conv_par(1)*x_intersect + conv_par(2)/4;```通过计算,我们可以得到最小内接矩形的四个顶点坐标,并且可以计算该矩形的面积和周长。
数字图像处理及应用(MATLAB)第6章习题答案

第六章习题与思考题参考答案1. 简述飞机红外图像识别中用到的五个红外特征量各自的作用?1)长宽比:反应了目标的几何形状;2)复杂度:反应了红外目标轮廓的情况;3)紧凑度:反应了红外目标在其所在最小外接矩形中所占比重;4)均值对比度:反映了目标的物理特性与背景的物理特性之间的关系;5)部分最亮像素点数与目标总像素数的比值:反应了目标的明暗变化情况;2. 可视密码共享中,如果实现(4 , 5)门限的可视密码分享,程序将做如何编写?clear allclose allM=imread('0.jpg');ss=rgb2gray(M);figureimshow(ss);[m n]=size(ss);for i=1:m*nif ss(i)>250ss(i)=250;endends=double(ss)+1;x=[1 2 3 4 5];g1=zeros(m,n);g2=zeros(m,n);g3=zeros(m,n);g4=zeros(m,n);g5=zeros(m,n);yy1=zeros(m,n);yy2=zeros(m,n);yy3=zeros(m,n);yy4=zeros(m,n);yy5=zeros(m,n);y1=zeros(m,n);y2=zeros(m,n);y3=zeros(m,n);y4=zeros(m,n);y5=zeros(m,n);for j=1:m*na1=mod(2*j,251);a2=mod(3*j,251);a3=mod(5*j,251);f=[a1 a2 a3 s(j)];g1(j)=polyval(f,x(1));yy1(j)=mod(g1(j),251);g2(j)=polyval(f,x(2));yy2(j)=mod(g2(j),251);g3(j)=polyval(f,x(3));yy3(j)=mod(g3(j),251);g4(j)=polyval(f,x(4));yy4(j)=mod(g4(j),251);g5(j)=polyval(f,x(5));yy5(j)=mod(g5(j),251);endy1=uint8(yy1-1)y2=uint8(yy2-1);y3=uint8(yy3-1);y4=uint8(yy3-1);y5=uint8(yy3-1);figure,imshow(y1);figure,imshow(y2)figure,imshow(y3);figure,imshow(y4);figure,imshow(y5);l1=(x(2)*x(3)*x(4)*x(5))/[(x(1)-x(2))*(x(1)-x(3))*(x(1)-x(4))*(x(1)-x(5))];l2=(x(1)*x(3)*x(4)*x(5))/[(x(2)-x(1))*(x(2)-x(3))*(x(2)-x(4))*(x(2)-x(5))];l3=(x(1)*x(2)*x(4)*x(5))/[(x(3)-x(1))*(x(3)-x(2))*(x(3)-x(4))*(x(3)-x(5))];l4=(x(1)*x(2)*x(3)*x(5))/[(x(4)-x(1))*(x(4)-x(2))*(x(4)-x(3))*(x(4)-x(5))];l5=(x(1)*x(2)*x(3)*x(4))/[(x(5)-x(1))*(x(5)-x(2))*(x(5)-x(3))*(x(5)-x(4))];rr1=zeros(m,n);r=zeros(m,n);for j=1:m*nrr1(j)=mod(yy1(j)*l1+yy2(j)*l2+yy3(j)*l3+yy4(j)*l4+yy5(j)*l5,251);endr=uint8(rr1-1);figure,imshow(r);3. 已知图像⎥⎥⎥⎥⎦⎤⎢⎢⎢⎢⎣⎡=805020016821024015010017018013070901262068M 。
matlab计算两个区域的最小距离函数

一、概述MATLAB是一种流行的数学软件,用于进行数值计算和数据可视化。
在许多科学和工程领域,MATLAB都被广泛地应用。
其中一个非常有用的功能就是计算两个区域的最小距离函数。
这个功能在图像处理、计算几何学和机器人学等领域都有着广泛的应用。
二、MATLAB中的最小距离函数在MATLAB中,可以使用内置函数或编写自定义函数来计算两个区域的最小距离。
下面我们将介绍MATLAB中计算最小距离的几种常见方法。
1. 使用内置函数MATLAB提供了一些内置函数来计算两个区域之间的最小距离,比如pdist2函数和bwdist函数。
pdist2函数可以用来计算两个不同数据集之间的距离,而bwdist函数则可以计算二进制图像中每个像素到最近的非零像素的距离。
这两个函数都是非常高效、准确的计算最小距离的工具。
2. 编写自定义函数除了使用内置函数,我们还可以编写自定义函数来计算两个区域的最小距离。
这种方法可以根据具体的问题需求进行灵活的定制,但是需要一定的编程能力。
通常可以使用广度优先搜索、最短路径算法或者动态规划等方法来编写自定义函数。
三、最小距离函数的应用最小距离函数在许多领域都有着重要的应用。
下面将介绍一些常见的应用场景。
1. 图像处理在图像处理中,最小距离函数可以用来计算图像中不同物体或区域之间的距离。
比如在医学图像中,可以用最小距离函数来计算肿瘤与周围组织的距离,以辅助医生进行诊断。
2. 计算几何学在计算几何学中,最小距离函数可以用来计算两个几何体之间的最短距离,比如计算两个多边形之间的最小距离。
这对于设计和制造工程师来说是非常重要的。
3. 机器人学在机器人学中,最小距离函数可以用来规划机器人的路径,以避免障碍物或与其他机器人发生碰撞。
这对于自动驾驶车辆和工业机器人来说有着重要的意义。
四、总结在MATLAB中,计算两个区域的最小距离函数是非常有用的功能,它可以用来解决许多现实生活中的问题。
通过内置函数或编写自定义函数,我们可以轻松地实现这一功能。
利用cvMinAreaRect2求取轮廓最小外接矩形
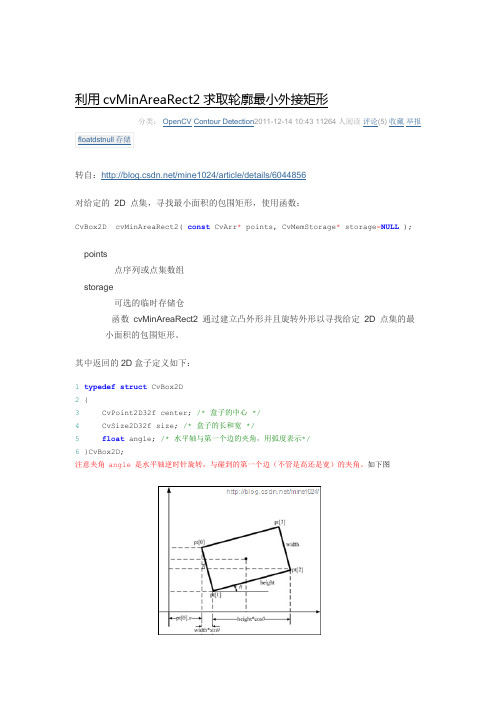
其中返回的2D盒子定义如下:1 typedef struct CvBox2D2 {3 CvPoint2D32f center; /* 盒子的中心 */4 CvSize2D32f size; /* 盒子的长和宽 */5 float angle; /* 水平轴与第一个边的夹角,用弧度表示*/6 }CvBox2D;注意夹角 angle 是水平轴逆时针旋转,与碰到的第一个边(不管是高还是宽)的夹角。
如下图可用函数cvBoxPoints(box[count], point); 寻找盒子的顶点1 void cvBoxPoints( CvBox2D box, CvPoint2D32f pt[4] )2 {3 double angle = box.angle*CV_PI/180.4 float a = (float)cos(angle)*0.5f;5 float b = (float)sin(angle)*0.5f;67 pt[0].x = box.center.x - a*box.size.height - b*box.size.width;8 pt[0].y = box.center.y + b*box.size.height - a*box.size.width;9 pt[1].x = box.center.x + a*box.size.height - b*box.size.width;10 pt[1].y = box.center.y - b*box.size.height - a*box.size.width;11 pt[2].x =2*box.center.x - pt[0].x;12 pt[2].y =2*box.center.y - pt[0].y;13 pt[3].x =2*box.center.x - pt[1].x;14 pt[3].y =2*box.center.y - pt[1].y;15 }简单证明此函数的计算公式:计算x,由图可得到三个方程式:pt[1].x - pt[0].x = width*sin(angle)pt[2].x - pt[1].x = height*cos(angle)pt[2].x - pt[0].x =2(box.center.x - pt[0].x)联立方程可解得函数里的计算式,算 y 略。
matlab 最小内接矩形-概述说明以及解释
matlab 最小内接矩形-概述说明以及解释1.引言1.1 概述:在计算机视觉和图像处理领域,内接矩形是一种常用的形状描述方法,用于描述一个物体或图像的最小边界矩形。
在MATLAB中,我们可以利用一些算法和函数来计算一个物体或图像的最小内接矩形,从而实现对其形状的描述和分析。
本文将从MATLAB简介开始,介绍MATLAB在计算机视觉和图像处理中的应用,然后详细讨论内接矩形的概念及其在MATLAB中的计算方法。
通过本文的学习,读者将能够掌握如何利用MATLAB来计算一个物体或图像的最小内接矩形,从而实现对其形状的描述和分析。
1.2文章结构"1.2 文章结构"部分旨在指导读者了解本文的结构和内容安排。
本文分为引言、正文和结论三部分。
在“引言”部分中,将会对文章的主题进行简要介绍,说明本文的研究目的和意义。
在“正文”部分中,将首先介绍MATLAB的基本概念和相关知识,以帮助读者更好地理解本文的内容。
接着,将详细解释内接矩形的概念,包括其定义和特点等内容。
最后,重点介绍MATLAB中最小内接矩形的计算方法,包括具体的算法和实现步骤。
在“结论”部分中,将对整篇文章进行总结,强调MATLAB最小内接矩形的计算方法的重要性和实用性。
并展望未来在该领域的研究和应用方向。
通过对文章结构的明确说明,读者可以更好地理解本文的逻辑脉络,加深对MATLAB最小内接矩形的认识。
1.3 目的研究MATLAB中最小内接矩形的计算方法的目的是为了探索一种有效的算法,能够在给定一组点的情况下,自动计算出能够完全包围这组点的最小矩形。
这个问题在计算机视觉、图形学等领域具有重要的应用意义,比如在目标检测、图像处理、模式识别等方面都会涉及到最小内接矩形的计算。
通过研究和实践,我们希望能够深入理解内接矩形的概念和计算方法,为解决实际问题提供有效的工具和思路。
同时,通过MATLAB的应用实践,也能够进一步加深对MATLAB编程和图形处理功能的了解和掌握。
一种获取图像区域最小外接矩形的算法及实现

的位置(每个子图的左边,用表示)可以记录下来,那么根据
每种位置所对应的6种映射关系,总可以得到每行走一步
后,新的当前像素点位置(每个子图的右边,用表示,坐标
变化也已标出),这样一直循环下去,当行走完一圈时,就
可以把行走的路线以像素点集(每个图中用表示的点)的方式
记录下来,就完成了对区域边界进行自动标定的工作。
2.Dept. of Science and Engineering,Shanxi Radio & TV University, Taiyuan 030027) 【Abstract】In this paper,a new kind of algorithm for obtaining minimum exterior rectangle of digital image region is presented. It sets up the basic graphs
如图5所示,经过多次的实验表明,此算法是有效的、切实
可行的。
(下转第142页)
—125—
渐变,用直方图区分大运动; 方 法 2 : 解压后利用基于像素的镜头探测方法;
方 法 3 : 压缩域下用DI(I帧间的差)区分噪声,用B帧宏块信息探 测突变,用CI(常量图)算法区分渐变;
方 法 4 :压缩域下用DI区分噪声,用基于概率的方法探测突 变,用CI区分渐变。
下面具体分析一下,当沿边界运动时,当前位置区域边 界单元格的相互位置关系有24种,由于总是选择一种行走方 向,故只需考虑其中的4种位置关系,如图2所示。图中表示 光标的当前位置,箭头(←↑→↓)表示前一时刻光标的位 置,箭头方向表示行走的方向(逆时针方向),序号1 ,2 , 3,4是位置关系的编号。
matlab图像处理小结
1.function [center, r] = solve_circle(pt1, pt2, pt3)2.%Effect: solve the circle which across points 'pt1', 'pt2' and 'pt3'3.%Inputs:4.%pt1, pt2, pt3: [x, y]5.%center: the circle center [x0; y0]6.%r: the radius of the circle7.%Author: Su dongcai at 2012/1/28. A = zeros(2, 2); B = zeros(2, 1);9.[A(1, :), B(1)] = circle2line(pt1, pt2);10.[A(2, :), B(2)] = circle2line(pt2, pt3);11.center = A\B;12.r = norm(pt1' - center);13.14.function [A, B] = circle2line(pt1, pt2)15.%Effect: cast 2 circles equation into 1 linear equation:16.%(a-x1)^2 + (b-y1)^2 = r^2 |17.% |==> 2(x1-x2)a + 2(y1-y2)b = (x1^2 + y1^2) - (y2^2 + y2^2)18.%(a-x2)^2 + (b-y2)^2 = r^2 |19.%Inputs:20.%pt1, pt2: [x1, y1], [x2, y2]21.%Outputs:22.%A: 2[x1-x2, y1-y2]23.%B: (x1^2 + y1^2) - (x2^2 + y2^2)24.%Author: Su dongcai at 2012/1/225.A = 2*(pt1 - pt2);26.B = norm(pt1)^2 - norm(pt2)^2;close all;clear;clc;>> i=imread('rice.png');%>> imshow(i);>> background=imopen(i,strel('disk',15));>> i2=imsubtract(i,background);%>> figure,imshow(i2);>> i3=imadjust(i2,stretchlim(i2),[0 1]);%>> figure,imshow(i3);>> level=graythresh(i3);>> bw=im2bw(i3,level);%>> figure,imshow(bw);>> [labeled,numobjects]=bwlabel(bw,4);graindata=regionprops(labeled,'all');close all;clear;clc;i=imread('rice.png');background=imopen(i,strel('disk',15));i2=imsubtract(i,background);i3=imadjust(i2,stretchlim(i2),[0 1]);level=graythresh(i3);bw=im2bw(i3,level);[labeled,numobjects]=bwlabel(bw,4);data=regionprops(labeled,'all');%%%%%%%%%%%%%%%%%%%%%%%%%%%%%%%%%%%%%% %%%%%%%%%%%%%%%%%%%2006.6.2close all;clear;clc;>> i=imread('r.jpg');%>> figure,imshow(i);>> imgray=rgb2gray(i);>> figure,imshow(imgray)>> background=imopen(imgray,strel('disk',15));>> i2=imsubtract(imgray,background);%>> figure,imshow(i2);>> i3=imadjust(i2,stretchlim(i2),[0 1]);%>> figure,imshow(i3);>> level=graythresh(i3);>> bw=im2bw(i3,level);%>> figure,imshow(bw);>> imnobord=imclearborder(bw,4);%>> figure,imshow(imnobord);>> [labeled,numobjects]=bwlabel(bw,4);>> rgb_label=label2rgb(labeled,@spring,'c','shuffle');>> figure,imshow(rgb_label);>> graindata=regionprops(labeled,'all');hold on;for k=1:numobjectslab=sprintf('%d',k);text(graindata(k).Centroid(1),graindata(k).Centroid(2),lab,'Color','k'); endhold off;%剔除碎米粒>> idxdown=find([graindata.Area]<150); %剔除碎米粒little=ismember(labeled,idxdown);figure,imshow(little);[lab_little,num_little]=bwlabel(little,4);rgb_little=label2rgb(lab_little,@spring,'c','shuffle');figure,imshow(rgb_little);little_data=regionprops(lab_little,'all');hold on;for k=1:num_littlelab=sprintf('%d',k);text(little_data(k).Centroid(1),little_data(k).Centroid(2),lab,'Color','k'); endhold off;%>> graindata(idxdown,:)=[];%剔除碎米粒%剔除连接米粒>> idxup=find([graindata.Area]>250); %剔除连接米粒big=ismember(labeled,idxup);figure,imshow(big);[lab_big,num_big]=bwlabel(big,4);rgb_big=label2rgb(lab_big,@spring,'c','shuffle');figure,imshow(rgb_big);big_data=regionprops(lab_big,'all');hold on;for k=1:num_biglab=sprintf('%d',k);text(big_data(k).Centroid(1),big_data(k).Centroid(2),lab,'Color','k');endhold off;%>> graindata(numup,:)=[];%剔除连接米粒%获取完整米粒idxsuit=find([graindata.Area]>=150&[graindata.Area]<=250);suit=ismember(labeled,idxsuit);figure,imshow(suit); %获取完整米粒[lab_suit,num_suit]=bwlabel(suit,4);suit_data=regionprops(lab_suit,'all');hold on;for k=1:num_suitsignature=sprintf('%d',k);text(suit_data(k).Centroid(1),suit_data(k).Centroid(2),signature,'Color','r'); endhold off;%获取完整米粒whos graindatawhos little_datawhos big_datawhos suit_data>> graindata>> mean([graindata.Area])>> mean([graindata.Eccentricity])>> mean([graindata.MajorAxisLength])>> mean([graindata.MinorAxisLength])>> mean([graindata.EquivDiameter])>> figure,hist([graindata.Area],20);>> figure,hist([graindata.Eccentricity],20);>> figure,hist([graindata.MajorAxisLength],20);>> figure,hist([graindata.MinorAxisLength],20);>> figure,hist([graindata.EquivDiameter],20);data=[graindata.Area]data=[graindata.Centroid]data=[graindata.BoundingBox]data=[graindata.SubarrayIdx]data=[graindata.MajorAxisLength]data=[graindata.MinorAxisLength]data=[graindata.Eccentricity]data=[graindata.Orientation]data=[graindata.ConvexHull]data=[graindata.ConvexImage]data=[graindata.ConvexArea]data=[graindata.Image]data=[graindata.FilledImage]data=[graindata.FilledArea]data=[graindata.EulerNumber]data=[graindata.Extrema]data=[graindata.EquivDiameter]data=[graindata.Solidity]data=[graindata.Extent]data=[graindata.PixelIdxList]data=[graindata.PixelList]Area 计算各个连通区域中的象素总数BoundingBox 包含相应区域的最小矩形Centroid 给出每个区域的质心MajorAxisLength 与区域具有相同标准二阶中心矩(又叫标准差)的椭圆的长轴长度MinorAxisLength 与区域具有相同标准二阶中心矩的椭圆的短轴长度Eccentricity 与区域具有相同标准二阶中心矩的椭圆的离心率Orientation 与区域具有相同标准二阶中心矩的椭圆的长轴与x轴的交角Image 二值图像,与某区域具有相同大小的逻辑矩阵。
Matlab图像几何操作
subplot(1,2,1),imshow(I)
subplot(1,2,2),imshow(nI)
2.2 图像的几何变换
投影变换的矩阵表达
a11 a12 a13 [xc,yc,wc][x,y,1]a21 a22 a23
a a a
在进行乘法计算之后,通常齐次元素 齐次除法,即每个元素都除以 wc :
2.3.1 邻域操作
【例】对小狮子图像进行邻域操作,使小狮子图像的轮廓变得清晰。 I = imread('shizi.bmp'); I = double(rgb2gray(I)); figure(1),subplot(1,2,1),imshow(I,[]) [m,n] = size(I); nI = zeros(m,n) C = [ -1 -1 -1; -1 8 -1; -1 -1 -1]; for i=2:m-1 for j=2:n-1 L = I(i-1:i+1, j-1:j+1) .* C; nI(i,j) = sum(sum(L)); end end figure(1),subplot(1,2,2),imshow(nI,[])
2.2 图像的几何变换
在函数maketform(P,……)中,参数P可以是以下形式:
‘affine’
仿射变换形式
‘projective’ 投影变换形式
‘custom’
自定义函数进行变换
‘box’
依靠函数中的另外参数产生仿射变换结构
‘composite’ 该参数实现多次调用tformfwd功能
2.2 图像的几何变换
本节主要介绍图像的二维空间变换。
2.2 图像的几何变换
图像二维空间变换 – Matlab使用imtransform函数完成图像二维空间变换。 – imtransform函数的调用形式为: imtransform(I,T) – 参数I:要变换的图像 – 参数T:由maketform函数产生的变换结构。根据变换结构的不同,可以实现不同的空间变 换。例如: 二维仿射变换 投影变换
opencv-python最小外接矩形_转载
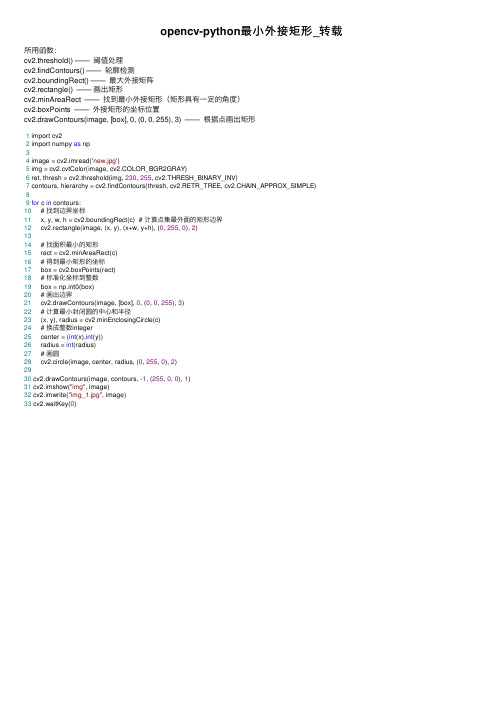
opencv-python最⼩外接矩形_转载所⽤函数:cv2.threshold() —— 阈值处理cv2.findContours() —— 轮廓检测cv2.boundingRect() —— 最⼤外接矩阵cv2.rectangle() —— 画出矩形cv2.minAreaRect —— 找到最⼩外接矩形(矩形具有⼀定的⾓度)cv2.boxPoints —— 外接矩形的坐标位置cv2.drawContours(image, [box], 0, (0, 0, 255), 3) —— 根据点画出矩形1 import cv22 import numpy as np34 image = cv2.imread('new.jpg')5 img = cv2.cvtColor(image, cv2.COLOR_BGR2GRAY)6 ret, thresh = cv2.threshold(img, 230, 255, cv2.THRESH_BINARY_INV)7 contours, hierarchy = cv2.findContours(thresh, cv2.RETR_TREE, cv2.CHAIN_APPROX_SIMPLE)89for c in contours:10 # 找到边界坐标11 x, y, w, h = cv2.boundingRect(c) # 计算点集最外⾯的矩形边界12 cv2.rectangle(image, (x, y), (x+w, y+h), (0, 255, 0), 2)1314 # 找⾯积最⼩的矩形15 rect = cv2.minAreaRect(c)16 # 得到最⼩矩形的坐标17 box = cv2.boxPoints(rect)18 # 标准化坐标到整数19 box = np.int0(box)20 # 画出边界21 cv2.drawContours(image, [box], 0, (0, 0, 255), 3)22 # 计算最⼩封闭圆的中⼼和半径23 (x, y), radius = cv2.minEnclosingCircle(c)24 # 换成整数integer25 center = (int(x),int(y))26 radius = int(radius)27 # 画圆28 cv2.circle(image, center, radius, (0, 255, 0), 2)2930 cv2.drawContours(image, contours, -1, (255, 0, 0), 1)31 cv2.imshow("img", image)32 cv2.imwrite("img_1.jpg", image)33 cv2.waitKey(0)。
opencv 点集的最小外接矩形
opencv 点集的最小外接矩形摘要:一、OpenCV简介1.OpenCV的发展历程2.OpenCV的主要功能二、点集的概念1.点集的定义2.点集的应用场景三、最小外接矩形1.最小外接矩形的定义2.最小外接矩形的作用3.求解最小外接矩形的方法四、OpenCV求解最小外接矩形1.OpenCV中处理点集的函数2.使用OpenCV求解最小外接矩形的方法五、实例演示1.安装OpenCV2.读取图像并提取点集3.求解最小外接矩形六、总结1.OpenCV在点集处理方面的优势2.最小外接矩形在实际应用中的意义正文:一、OpenCV简介OpenCV(Open Source Computer Vision Library,开源计算机视觉库)是一个开源的计算机视觉和机器学习软件库。
它由一系列图像处理、视频分析和计算机视觉方面的函数组成,广泛应用于学术研究、工业生产和日常生活等多个领域。
二、点集的概念点集是由一组离散的点组成的集合。
在计算机视觉中,点集常用于表示图像中的特征点,如角点、边缘点等。
点集在图像匹配、目标检测和跟踪等方面具有广泛应用。
三、最小外接矩形最小外接矩形是一种用于描述点集的矩形,它包含所有点且面积最小。
求解最小外接矩形有助于简化点集,便于后续的图像处理和分析。
四、OpenCV求解最小外接矩形OpenCV提供了丰富的函数来处理点集,可以很容易地实现求解最小外接矩形的功能。
具体方法如下:1.首先,使用OpenCV的函数如`cv2.findContours`或`cv2.goodFeaturesToTrack`提取图像中的点集。
2.然后,对提取出的点集进行排序,以方便后续计算。
3.接着,计算点集的中心点,并计算中心点与每个点的距离。
4.根据中心点和点之间的距离,计算矩形的长和宽,从而得到最小外接矩形。
五、实例演示以下是一个使用OpenCV求解最小外接矩形的简单实例:1.安装OpenCV:请参考OpenCV官方文档进行安装。
matlab两平面矩形距离计算
matlab两平面矩形距离计算在数学和计算机领域,矩形距离计算是一个常见且重要的问题。
在matlab中,我们可以使用一系列函数和方法来进行矩形距离计算,从而实现各种实际应用。
在本文中,我将针对matlab中的两平面矩形距离计算问题展开讨论,探索其深度和广度,并提供有价值的观点和理解。
1. 矩形距离计算的基本概念在开始具体讨论matlab中的矩形距离计算之前,我们先来了解一下矩形距离计算的基本概念。
矩形距离计算指的是在两个矩形之间计算最短的直线距离。
这个问题在实际生活和工程应用中经常出现,比如在地图应用中计算两个地理位置之间的最短距离,或者在计算机图形学中计算两个矩形之间的最短距离等等。
2. matlab中的矩形距离计算函数在matlab中,我们可以使用内置函数和工具包来实现矩形距离的计算。
其中,最常用的函数之一就是`pdist2`函数,该函数可以计算两组点之间的距离。
我们可以通过合理的数据处理和参数设置,将矩形的四个顶点作为输入,从而实现两个矩形之间距离的快速计算。
另外,matlab还提供了`rectint`函数,该函数可以用于计算两个矩形的交集面积。
通过计算两个矩形的交集面积,我们可以进一步推导出它们之间的距离关系。
这些函数的灵活使用可以帮助我们在实际问题中更高效地解决矩形距离计算的挑战。
3. 实际应用与案例分析除了使用内置函数,我们还可以结合实际应用场景来分析矩形距离计算的问题。
在地理信息系统中,我们经常需要计算两个地理位置之间的最短距离,这可以看作是一个平面矩形距离计算的特例。
通过实际数据的处理和分析,我们可以将matlab中的函数和方法与实际应用相结合,进一步提高矩形距离计算的准确性和效率。
4. 个人观点与总结从我个人的观点来看,矩形距禿计算是一个具有挑战性但又十分重要的问题。
在matlab这样的强大工具的支持下,我们可以更灵活地探索和解决这个问题。
通过深入理解矩形距禿计算的基本原理和matlab中的相关函数,我们可以更好地应用这些知识到实际工程和科研项目中去。
最小包络矩形的算法和代码
最小包络矩形的算法和代码最小包络矩形(Minimum Bounding Rectangle)是指能够紧密包围一组点集的最小面积矩形。
这个问题在计算几何学、图像处理、模式识别等领域都具有重要的应用。
下面是一个简单的算法来计算最小包络矩形。
算法步骤:1.输入一个点集。
2.找到最左边的点(即,X坐标最小的点),标记为最左点。
3.找到最右边的点(即,X坐标最大的点),标记为最右点。
4.找到最上边的点(即,Y坐标最大的点),标记为最上点。
5.找到最下边的点(即,Y坐标最小的点),标记为最下点。
6.以最左点为基准,计算其他点到该点的极角。
7.根据极角排序所有点。
8.初始化一个栈,将最左、最上和第二个点(按极角排序后)依次放入栈中。
9.遍历除最左、最上和第二个点以外的其余点,将点依次放入栈中。
10.对栈中的点,依次计算最小包络矩形的面积。
11.输出最小的面积和对应的顶点坐标。
以下是使用Python实现的代码:```pythonimport mathclass Point:def __init__(self, x, y):self.x = xself.y = ydef get_distance(p1, p2):return math.sqrt((p2.x - p1.x) ** 2 + (p2.y - p1.y) ** 2) def get_angle(p1, p2):return math.atan2(p2.y - p1.y, p2.x - p1.x)def get_area(points):distance = get_distance(points[0], points[1])width = distanceheight = 0for i in range(1, len(points)):distance = get_distance(points[i], points[(i + 1) %len(points)])angle = get_angle(points[i - 1], points[i])height = max(height, distance * math.sin(angle))return width * heightdef minimum_bounding_rectangle(points):leftmost_point = min(points, key=lambda p: p.x)rightmost_point = max(points, key=lambda p: p.x)topmost_point = max(points, key=lambda p: p.y)bottommost_point = min(points, key=lambda p: p.y)base_point = leftmost_pointfor point in points:angle = get_angle(base_point, point)point.angle = anglesorted_points = sorted(points, key=lambda p: p.angle)stack = [sorted_points[0], topmost_point, sorted_points[1]] for point in sorted_points[2:]:while len(stack) > 1 and get_angle(stack[-2], stack[-1]) >= get_angle(stack[-1], point):stack.popstack.append(point)min_area = float('inf')min_points = []for i in range(len(stack)):rectangle_points = stack[i:] + stack[:i] + [stack[i]]area = get_area(rectangle_points)if area < min_area:min_area = areamin_points = rectangle_pointsreturn min_area, [(p.x, p.y) for p in min_points]#测试points = [Point(1, 1), Point(1, 2), Point(2, 2), Point(2, 1), Point(1.5, 1.5)]min_area, min_points = minimum_bounding_rectangle(points)print("最小包络矩形的面积:", min_area)print("最小包络矩形的顶点坐标:", min_points)```以上代码实现了一个简单的最小包络矩形算法,能够计算给定一组点集的最小包络矩形的面积和对应的顶点坐标。
OpenCV实现最小外接正矩形
OpenCV实现最⼩外接正矩形本⽂实例为⼤家分享了OpenCV实现最⼩外接正矩形的具体代码,供⼤家参考,具体内容如下#include "stdafx.h"#include "cv.h"#include "highgui.h"#include "cxcore.h"#include "math.h"#include <iostream.h>int main(int argc, char* argv[]){IplImage *src;IplImage *dst;IplImage *ROI;CvMemStorage* storage=cvCreateMemStorage(0);CvSeq* contour=0;src=cvLoadImage("I:\\test.jpg",0);cvNamedWindow("image0",1);cvShowImage("image0",src);int hei=src->height;int wid=src->width;uchar *data;data=(uchar*)src->imageData;int widstep=src->widthStep;int channel=src->nChannels;dst=cvCreateImage(cvSize(wid,hei),IPL_DEPTH_8U,3);ROI=cvCreateImage(cvSize(wid,hei),IPL_DEPTH_8U,3);for (int i=0;i<hei;i++){for(int j=0;j<wid;j++){if (data[i*widstep+j*channel]>120){data[i*widstep+j*channel]=0;}else{data[i*widstep+j*channel]=255;}}}cvNamedWindow("image",0);cvShowImage("image",src);printf("图像的⾼为:%d,宽为:%d\n\n",hei,wid);cvCvtColor(src, dst, CV_GRAY2BGR);;cvFindContours(src,storage,&contour,sizeof(CvContour),CV_RETR_CCOMP,CV_CHAIN_APPROX_SIMPLE); for(;contour!=0;contour=contour->h_next){double length =cvArcLength(contour);double area =fabs(cvContourArea(contour));CvRect rect = cvBoundingRect(contour,1);cout<<"Length="<<length<<" Area="<<area<<endl;CvPoint p1;CvPoint p2;p1.x=rect.x;p1.y=rect.y;p2.x=rect.x+rect.width;p2.y=rect.y+rect.height;cout<<"p1=("<<p1.x<<","<<p1.y<<")";cout<<"p2=("<<p2.x<<","<<p2.y<<")"<<endl;cvRectangle(dst,p1,p2,CV_RGB(255,0,0),1,8,0); }cvNamedWindow("dst",1);cvShowImage("dst",dst);cvWaitKey(0);return 0;}原图:⼆值化反⾊图:最⼩正矩形图:最⼩正矩形信息:以上就是本⽂的全部内容,希望对⼤家的学习有所帮助,也希望⼤家多多⽀持。
matlab 二值图像 求白色区域最小外接矩阵 长宽

Matlab关于二值图像的最小外接矩形问题借用minboundrect 现有函数。
function [rectx,recty,area,perimeter] = minboundrect(x,y,metric)% minboundrect: Compute the minimal bounding rectangle of points in the plane% usage: [rectx,recty,area,perimeter] = minboundrect(x,y,metric)%% arguments: (input)% x,y - vectors of points, describing points in the plane as% (x,y) pairs. x and y must be the same lengths.%% metric - (OPTIONAL) - single letter character flag which% denotes the use of minimal area or perimeter as the% metric to be minimized. metric may be either 'a' or 'p',% capitalization is ignored. Any other contraction of 'area'% or 'perimeter' is also accepted.%% DEFAULT: 'a' ('area')%% arguments: (output)% rectx,recty - 5x1 vectors of points that define the minimal% bounding rectangle.%% area - (scalar) area of the minimal rect itself.%% perimeter - (scalar) perimeter of the minimal rect as found%%% Note: For those individuals who would prefer the rect with minimum% perimeter or area, careful testing convinces me that the minimum area % rect was generally also the minimum perimeter rect on most problems % (with one class of exceptions). This same testing appeared to verify my% assumption that the minimum area rect must always contain at least% one edge of the convex hull. The exception I refer to above is for% problems when the convex hull is composed of only a few points,% most likely exactly 3. Here one may see differences between the% two metrics. My thanks to Roger Stafford for pointing out this% class of counter-examples.%% Thanks are also due to Roger for pointing out a proof that the% bounding rect must always contain an edge of the convex hull, in% both the minimal perimeter and area cases.%%% See also: minboundcircle, minboundtri, minboundsphere%%% default for metricif (nargin<3) || isempty(metric)metric = 'a';elseif ~ischar(metric)error 'metric must be a character flag if it is supplied.'else% check for 'a' or 'p'metric = lower(metric(:)');ind = strmatch(metric,{'area','perimeter'});if isempty(ind)error 'metric does not match either ''area'' or ''perimeter''' end% just keep the first letter.metric = metric(1);end% preprocess datax=x(:);y=y(:);% not many error checks to worry aboutn = length(x);if n~=length(y)error 'x and y must be the same sizes'end% start out with the convex hull of the points to% reduce the problem dramatically. Note that any% points in the interior of the convex hull are% never needed, so we drop them.if n>3edges = convhull(x,y); % 'Pp' will silence the warnings% exclude those points inside the hull as not relevant% also sorts the points into their convex hull as a% closed polygonx = x(edges);y = y(edges);% probably fewer points now, unless the points are fully convex nedges = length(x) - 1;elseif n>1% n must be 2 or 3nedges = n;x(end+1) = x(1);y(end+1) = y(1);else% n must be 0 or 1nedges = n;end% now we must find the bounding rectangle of those% that remain.% special case small numbers of points. If we trip any% of these cases, then we are done, so return.switch nedgescase 0% empty begets emptyrectx = [];recty = [];area = [];perimeter = [];returncase 1% with one point, the rect is simple.rectx = repmat(x,1,5);recty = repmat(y,1,5);area = 0;perimeter = 0;returncase 2% only two points. also simple.rectx = x([1 2 2 1 1]);recty = y([1 2 2 1 1]);area = 0;perimeter = 2*sqrt(diff(x).^2 + diff(y).^2);returnend% 3 or more points.% will need a 2x2 rotation matrix through an angle thetaRmat = @(theta) [cos(theta) sin(theta);-sin(theta) cos(theta)];% get the angle of each edge of the hull polygon.ind = 1:(length(x)-1);edgeangles = atan2(y(ind+1) - y(ind),x(ind+1) - x(ind));% move the angle into the first quadrant.edgeangles = unique(mod(edgeangles,pi/2));% now just check each edge of the hullnang = length(edgeangles);area = inf;perimeter = inf;met = inf;xy = [x,y];for i = 1:nang% rotate the data through -thetarot = Rmat(-edgeangles(i));xyr = xy*rot;xymin = min(xyr,[],1);xymax = max(xyr,[],1);% The area is simple, as is the perimeterA_i = prod(xymax - xymin);P_i = 2*sum(xymax-xymin);if metric=='a'M_i = A_i;elseM_i = P_i;end% new metric value for the current interval. Is it better?if M_i<met% keep this onemet = M_i;area = A_i;perimeter = P_i;rect = [xymin;[xymax(1),xymin(2)];xymax;[xymin(1),xymax(2)];xymin]; rect = rect*rot';rectx = rect(:,1);recty = rect(:,2);endend% get the final rect% all doneend% mainline end求长宽:4.计算最小外接矩形的长宽时。
python3+openCV获取图片中文本区域的最小外接矩形实例
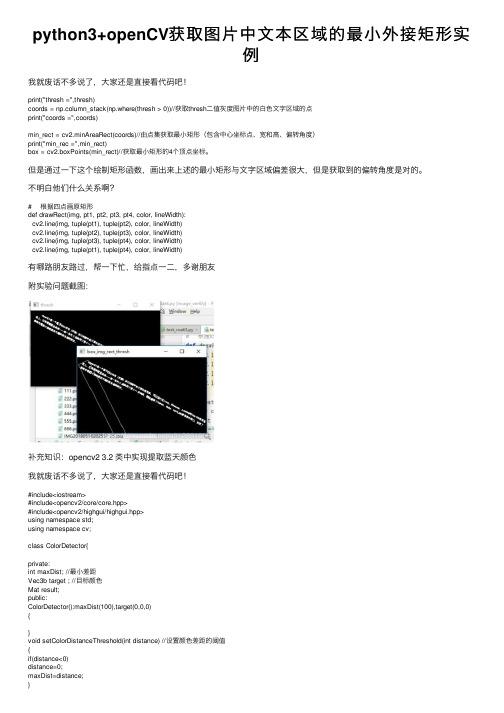
python3+openCV获取图⽚中⽂本区域的最⼩外接矩形实例我就废话不多说了,⼤家还是直接看代码吧!print("thresh =",thresh)coords = np.column_stack(np.where(thresh > 0))//获取thresh⼆值灰度图⽚中的⽩⾊⽂字区域的点print("coords =",coords)min_rect = cv2.minAreaRect(coords)//由点集获取最⼩矩形(包含中⼼坐标点、宽和⾼、偏转⾓度)print("min_rec =",min_rect)box = cv2.boxPoints(min_rect)//获取最⼩矩形的4个顶点坐标。
但是通过⼀下这个绘制矩形函数,画出来上述的最⼩矩形与⽂字区域偏差很⼤,但是获取到的偏转⾓度是对的。
不明⽩他们什么关系啊?# 根据四点画原矩形def drawRect(img, pt1, pt2, pt3, pt4, color, lineWidth):cv2.line(img, tuple(pt1), tuple(pt2), color, lineWidth)cv2.line(img, tuple(pt2), tuple(pt3), color, lineWidth)cv2.line(img, tuple(pt3), tuple(pt4), color, lineWidth)cv2.line(img, tuple(pt1), tuple(pt4), color, lineWidth)有哪路朋友路过,帮⼀下忙,给指点⼀⼆,多谢朋友附实验问题截图:补充知识:opencv2 3.2 类中实现提取蓝天颜⾊我就废话不多说了,⼤家还是直接看代码吧!#include<iostream>#include<opencv2/core/core.hpp>#include<opencv2/highgui/highgui.hpp>using namespace std;using namespace cv;class ColorDetector{private:int maxDist; //最⼩差距Vec3b target ; //⽬标颜⾊Mat result;public:ColorDetector():maxDist(100),target(0,0,0){}void setColorDistanceThreshold(int distance) //设置颜⾊差距的阈值{if(distance<0)distance=0;maxDist=distance;}int getColorDistanceThreshold() const //取得颜⾊差距的阈值{return maxDist;}void setTargetColor(uchar blue,uchar green,uchar red) //设置需要检测的颜⾊{target=Vec3b(blue,green,red);}void setTargetColor(Vec3b color){target=color;}Vec3b getTargetColor() const{return target;}Mat process(const cv::Mat &image) ;int getDistance(const Vec3b &color) ;};Mat ColorDetector::process(const cv::Mat &image){result.create(image.rows,image.cols,CV_8U);Mat_<Vec3b>::const_iterator it=image.begin<Vec3b>();Mat_<Vec3b>::const_iterator itend=image.end<Vec3b>();Mat_<uchar>::iterator itout=result.begin<uchar>();for ( ; it!= itend; ++it, ++itout){if (getDistance(*it)<maxDist){*itout=255;}else{*itout=0;}}return result;}int ColorDetector::getDistance(const Vec3b &color){return abs(color[0]-target[0])+abs(color[1]-target[1])+abs(color[2]-target[2]);}void main(){ColorDetector cdetect;Mat img=imread("C:\\Users\\Administrator\\Desktop\\⼯作\\testp\\boldt.jpg");if(img.empty())return;cdetect.setTargetColor(230,190,130);imshow("original",img);imshow("result",cdetect.process(img));waitKey(0);}以上这篇python3+openCV 获取图⽚中⽂本区域的最⼩外接矩形实例就是⼩编分享给⼤家的全部内容了,希望能给⼤家⼀个参考,也希望⼤家多多⽀持。
Matlab中保存图像时,图形窗口大小的控制
Matlab中保存图像时,图形窗口大小的控制zz首先要了解的是Matlab是面向对象的。
最高等级的对象是screen,它定义了figure可以用的最大szie。
screen下面是figure。
figue就是你画图的时候跳出来的那个新的对话窗口。
如果figure变化,screen是不会跟着变化的。
但screen变化的话,figure就要跟着变化了。
figure下面是axes。
axes是那个窗口里面你要画的东西。
axes的大小和位置取决于figure,如果你放大缩小figure的大小的话,里面的图线也会跟着变化的。
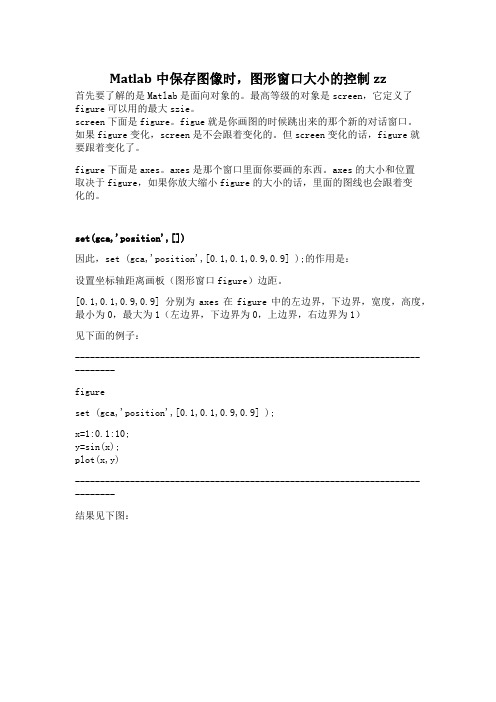
set(gca,'position',[])因此,set (gca,'position',[0.1,0.1,0.9,0.9] );的作用是:设置坐标轴距离画板(图形窗口figure)边距。
[0.1,0.1,0.9,0.9] 分别为axes在figure中的左边界,下边界,宽度,高度,最小为0,最大为1(左边界,下边界为0,上边界,右边界为1)见下面的例子:-----------------------------------------------------------------------------figureset (gca,'position',[0.1,0.1,0.9,0.9] );x=1:0.1:10;y=sin(x);plot(x,y)-----------------------------------------------------------------------------结果见下图:set(gcf,'position',[])一般matlab绘出来图的框架(图形窗口)大都是正方形或者近似正方形的矩形,能不能画一些扁的矩形呢?使用图形的position属性可以做到。
如set(gcf,'unit','normalized','position',[0.2,0.2,0.64,0.32]);的意思是:对gcf的position进行设置。
opencv之求各连通区域内目标的最小外接矩形及其长、宽

10、最小外接矩形及长宽的求法liuqingjie2@#include "cv.h"#include "highgui.h"#include <stdio.h>#include <math.h>#include "otsu.h"int main(int argc,char** argv){IplImage *src,*gray,*bw,*dst;CvMemStorage* storage=cvCreateMemStorage(0);CvSeq* contour=0;char* filename=argc==2?argv[1]:"5.jpg";if(!filename)printf("can't open the file:%d\n",filename);src=cvLoadImage(filename,1);cvNamedWindow("image",1);cvShowImage("image",src);gray=cvCreateImage(cvSize(src->width,src->height),src->depth,1);cvCvtColor(src,gray,CV_BGR2GRAY);hei=gray->height;//注意此处是gray,otsu中要用到hei,wid,已在otsu.h中全局定义;wid=gray->width;printf("图像的高为:%d,宽为:%d\n\n",hei,wid);cvNamedWindow("image2",1);cvShowImage("image2",gray);bw=cvCreateImage(cvGetSize(src),IPL_DEPTH_8U,1);otsu(gray,bw);cvNamedWindow("image4",1);cvShowImage("image4",bw);// wb=cvCloneImage(bw);// cvNot(bw,wb); 只有当目标区域为黑色背景时候,才对其取反。
- 1、下载文档前请自行甄别文档内容的完整性,平台不提供额外的编辑、内容补充、找答案等附加服务。
- 2、"仅部分预览"的文档,不可在线预览部分如存在完整性等问题,可反馈申请退款(可完整预览的文档不适用该条件!)。
- 3、如文档侵犯您的权益,请联系客服反馈,我们会尽快为您处理(人工客服工作时间:9:00-18:30)。
Matlab关于二值图像的最小外接矩形问题。
当物体的边界已知时,用其外接矩形的尺寸来刻画它的长宽是最简单的方法。对任意朝向的物体, 水平和垂直并非是我们感兴趣的方向。这时,就有必要确定物体的主轴, 然后计算反映物体形状特征的主轴方向上的长度和与之垂直方向上的宽度,这样的外接矩形是物体的最小外接矩形(Minimum Enclosing Rectangle, MER)。
由于纸币新旧不一,四角可能会有磨损,所以通过得到四角坐标的方式截取纸币图案会损失一定细节。
先用外接矩形找到坐标,得到倾斜角度并旋转,再找一次外接矩形得到坐标。。。然后裁剪。于二值化图像如何实现倾斜最小外接矩形
url='/attachments/month_0905/20090510_ddce069b5d33d97300e19oalKuZDHKrX.jpg';
I=imread(ቤተ መጻሕፍቲ ባይዱrl);
bw=im2bw(I);
[r c]=find(bw==1);
[rectx,recty,area,perimeter] = minboundrect(c,r,'a'); % 'a'是按面积算的最小矩形,如果按边长用'p'
imshow(bw);hold on
line(rectx,recty);
计算MER的一种方法是,将物体的边界以每次3°左右的增量在90°范围内旋转。每旋转一次记录一次其坐标系方向上的外接矩形边界点的最大和最小x、y值。旋转到某一个角度后,外接矩形的面积达到最小。取面积最小的外接矩形的参数为主轴意义下的长度和宽度。
rectx,recty分别是矩形的几个顶点的x,y坐标,从这里就可以求出长和宽了
