高考英语图表作文
(完整)高考英语写作图表说明文模板范文
高考英语指导写作专题:图表说明文一,图表说明1,分类:数字表、函数关系图、曲线图(graph);表格(table);几何图形(figure);图形表、饼状图(pie chart);条状图、柱状图(bar chart);平面图、示意图、外形图(diagram)。
2,一般可分三个层次来写:按照题目要求描述图表反映的总情况,即概括大意。
对数字进行仔细的比较,抓住特点进行分析、归纳并找出产生变化的原因。
读图表后的想法、结论、评论或针对反映出的问题采取的解决措施。
二.表达方式:1,常用的描述句型The table/chart/diagram/graph shows that ...According to the table/chart/diagram/graph...As is shown in the table/chart/diagram/graph...As can be seen from the table/chart/diagram/graph/figures...We can see from the figures/statistics...It is clear/ apparent from the figures/statistics...2.图表中数据(data)的具体表达法数据(data)在某一个时间段固定不变:fixed in time在一系列的时间段中转变:changes over time增加:increase/raise/rise/...减少:decrease/grow down/drop/fall/decline稳定:remain stable3.描写变化的形容词及副词rapid/rapidly,dramatic/dramatically,significant/significantly,sharp/sharplysteep/steeply,steady/steadily,gradual/gradually,slow/slowly,slight/slightly三、写作模板As (is) shown/indicated by the figure/in the table/graph/pie chart/chart,_____ has been increased/decreased significantly/steadily from _____ to_____. From the sharp decline/rise in the chart,it goes without saying that_____.There are at least two reasons accounting for / contributing to ____. On the one hand, _____ On the other hand, _____. _____is due to the fact that_____. In addition,_____is responsible for_____. Maybe there are other reasons to show. But it is generally believed that the above mentioned reasons are commonlyconvincing/persuasive.As far as I am concerned,I hold the view that_____. I am sure my opinion is both sound and well-grounded.四,作文范例1,最近你校对中学生的消费情况进行了调查。
高考英语图表作文
高考英语图表作文In the first graph, we can see a steady increase in the number of people using smartphones over the past decade. This is hardly surprising, given the rapid advancements in technology and the increasing availability of affordable smartphones. It seems that almost everyone has a smartphone these days, and it has become an essential tool for communication, entertainment, and even work.Moving on to the second graph, we can observe a similar trend in the use of social media. The number of active social media users has been steadily rising, with no signs of slowing down. This is indicative of the growing importance of social media in our daily lives, as it has become a primary platform for communication, information sharing, and even advertising.Looking at the third graph, we can see a significant increase in online shopping activities. This is not surprising, given the convenience and accessibility ofonline shopping platforms. With just a few clicks, people can purchase almost anything they need, and have it delivered right to their doorstep. It's no wonder that traditional brick-and-mortar stores are facing increasing competition from online retailers.In summary, these graphs paint a picture of a society that is increasingly reliant on technology for communication, social interaction, and consumption. It's clear that smartphones, social media, and online shopping have become integral parts of our daily lives, and their influence will only continue to grow in the future.。
高考英语考书面表达练习——图表作文(格式与范例) 试

高考英语书面表达练习——图表作文(格式与范例)作文一假如你是李华,在最近的研究性学习当中,受《21世纪中学生英语报》 (The 21st Century )之邀,你对你所在的班60名同学(男女各半)进行了上网目的的调查。
现将调查结果(如下表所示)用英语给报社的编辑写一封信,报道此事,以引起舆论的关注,并提出你的观点和建议。
0%5%10%15%20%25%30%35%40%read newssend e-mailschatstudyplay games注意:1、报道应包括图表所示全部内容,可适度发挥。
2、文章的开头与结尾已给出,不计入总词数。
3、词数: 1504、参考词汇:调查: make a surveyDear editor ,I have recently made a survey among 30 boys and 30 girls in my class about their purpose of getting on the Internet. ______________________________________________[思路点拨]1. 题材:书信; 说明+议论 2. 时态:一般现在时 3. 人称:第三人称 4. 要点提示:(1)上网的目的;(2)读新闻; (3)发送邮件;(4)聊天;(5)学习;(6)玩游戏;(7)评语 5. 篇章结构:文章可分两段[文采修饰]1. 连接词的选用:but, both …, and, moreover, otherwise2. 高级词汇的选用:keep in touch with, as for …, use … as …, benefit from, pay attentionto, altogether, in one ’s opinion.3. 复杂句型的选用:what …most 引导的主语从句;as 引导的让步状语从句;倒装语序等。
高考英语作文图表分析类经典范文
图表分析类受某英文报的委托,你最近对高中生的英语阅读兴趣做了一次调查。
请根据以下信息,用英语为该报写一篇100词左右的短文。
短文的标题及首句已为你写好。
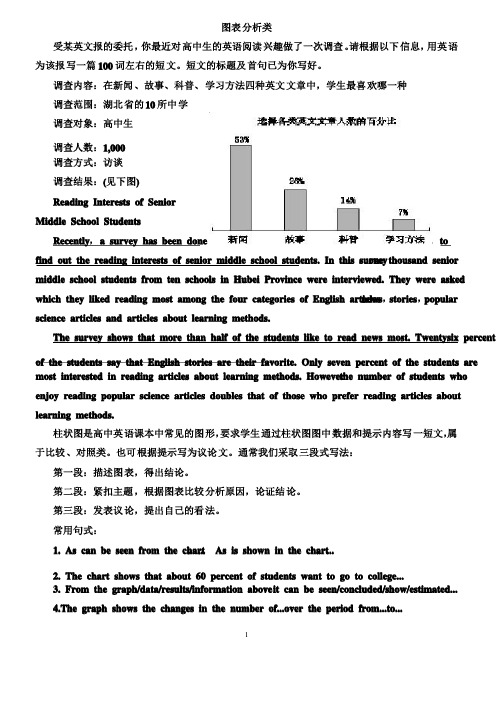
调查内容:在新闻、故事、科普、学习方法四种英文文章中,学生最喜欢哪一种调查范围:湖北省的10所中学调查对象:高中生调查人数:1,000调查方式:访谈调查结果:(见下图)Reading Interests of SeniorMiddle School StudentsRecently,a survey has been done tofind out the reading interests of senior middle school students. In this survey,one thousand senior middle school students from ten schools in Hubei Province were interviewed. They were asked which they liked reading most among the four categories of English articles,news,stories,popular science articles and articles about learning methods.The survey shows that more than half of the students like to read news most. Twentysix percent of the students say that English stories are their favorite. Only seven percent of the students are most interested in reading articles about learning methods. However,the number of students who enjoy reading popular science articles doubles that of those who prefer reading articles about learning methods.柱状图是高中英语课本中常见的图形,要求学生通过柱状图图中数据和提示内容写一短文,属于比较、对照类。
英语作文图表作文(五篇范文)

英语作文图表作文(五篇范文)第一篇:英语作文图表作文图表分析作文1As is clearly shown in the table/ figure/ graph / chart, 图表总体描述 between 年代 and 年代.Especially, 突出的数据变化.There are three reasons for 具体表示急剧上升、下降或特殊现象的词.To begin with, 原因一.In addition / Moreover, 原因二.For example, 具体例证.Last but no least, 原因三.In short,总结上文.As far as I am concerned, / For my part, / As for me,作者自己的观点.On the one hand, 理由一.On the other hand, 理由二.In brief,总结上文.图表分析作文2The table / figure / graph / chart shows that 图表总述from 年代to年代.It is self-evident that突出的数据变化.Three possible reasons contribute to 具体表示急剧上升、下降或特殊现象的词或代词代替上文内容.One reason is that原因一.Another reason is that 原因二.For instance,举例证.What’s more原因三.As a result, 重述上文之趋势.However, in my opinion 作者观点.For one thing,理由一.For another, 理由二.T o sum up,总结上文.图表分析作文3It can be seen from the table / figure / graph / chart that图表总述between年代and年代.Especially,突出的数据变化.Why are there such great changes during 图表涉及的年头数years? There are mainly two reasons explaining具体表示急剧上升、下降或特殊现象的词或代词代替上文内容.First,原因一.In the old days,比较法说明过去的情况.But now,说明现在的情况.Second,原因二.As a result,总结上文.In my viewpoint,作者自己的观点.On the one hand,论点一.On the other hand,论点二.图表分析作文4As the table / figure / graph / chart shows,图表总述in the past years年代.Obviously,突出的数据变化.Why are there suchsharp contrasts during 图表涉及的年头 years?Two main factors contribute to具体表示急剧上升、下降或特殊现象的词或代词代替上文内容.First of all,原因一.In the past,比较法说明过去的情况.But now 说明现在的情况.Moreover,原因二.Therefore,总结上文.As I see it,作者自己的观点.For one thing,论点一.For another,论点二.图表作文补充句型• As is shown in the graph…如图所示…•The graph shows that…图表显示…•As can be seen from the table,…从表格中可以看出…•From the chart, we know that…从这张表中,我们可知…• All these data clearly prove the fact that… 所有这些数据明显证明这一事实,即…• The increase of ….In the ci ty has reached to 20%.….在这个城市的增长已达到20%.• In 1985, the number remained the same.1985年,这个数字保持不变.• There was a gradual decline in 1989.1989年,出现了逐渐下降的情况.第二篇:英语图表作文图表描述专题训练(一)这类作文时,注意以下几点:第一,审题时,除了要把握好图表的表层信息外,还要分析图标的深层含义,如原因、根源、可能的发展趋势等。
英语高考作文图表类

英语高考作文图表类In the chart, we can see that the number of people using smartphones has been increasing steadily over the past decade. This trend is not surprising, considering the convenience and versatility that smartphones offer in our daily lives.Looking at the data, it is clear that the younger generation is the most avid users of smartphones. This is understandable, as they have grown up in a digital age where smartphones are an integral part of communication and social interaction.Interestingly, the chart also shows that the use of smartphones varies among different regions. While urban areas tend to have higher smartphone usage rates, rural areas are catching up as technology becomes more accessible and affordable.One striking point to note is the impact of smartphoneusage on traditional forms of communication. With the riseof messaging apps and social media platforms, people are increasingly relying on their smartphones to stay connected, leading to a decline in face-to-face interactions and phone calls.Despite the concerns about smartphone addiction and its negative effects on mental health, it is undeniable that smartphones have revolutionized the way we communicate and access information. As technology continues to advance, it will be fascinating to see how our relationship with smartphones evolves in the future.。
英语图表作文模板及范文(通用12篇)

英语图表作文模板及范文(通用12篇)(经典版)编制人:__________________审核人:__________________审批人:__________________编制单位:__________________编制时间:____年____月____日序言下载提示:该文档是本店铺精心编制而成的,希望大家下载后,能够帮助大家解决实际问题。
文档下载后可定制修改,请根据实际需要进行调整和使用,谢谢!并且,本店铺为大家提供各种类型的经典范文,如工作总结、工作计划、合同协议、条据文书、策划方案、句子大全、作文大全、诗词歌赋、教案资料、其他范文等等,想了解不同范文格式和写法,敬请关注!Download tips: This document is carefully compiled by this editor. I hope that after you download it, it can help you solve practical problems. The document can be customized and modified after downloading, please adjust and use it according to actual needs, thank you!Moreover, our store provides various types of classic sample essays for everyone, such as work summaries, work plans, contract agreements, doctrinal documents, planning plans, complete sentences, complete compositions, poems, songs, teaching materials, and other sample essays. If you want to learn about different sample formats and writing methods, please stay tuned!英语图表作文模板及范文(通用12篇)英语图表作文模板及范文第1篇The table/chart diagram/graph shows (that)According to the table/chart diagram/graphAs (is)shown in the table/chart diagram/graphAs can be seen from the table/chart/diagram/graph/figures,figures/statistics shows (that)……It can be seen from the figures/statisticsWe can see from the figures/statisticsIt is clear from the figures/statisticsIt is apparent from the figures/statisticstable/chart/diagram/graph figures (that)……table/chart/diagram/graph shows/describes/illustrates图表类英语作文范文The past years have witnessed a mounting number of Chinese scholars returning from overseas.As is lively illustrated by the column chart, the number of returnees climbed from a mere thousand in 20XX to over thousand in 20XX, at an annual increase rate of around 50%.A multitude of factors may have led to the tendency revealed by the chart, but the following are the critical ones from my perspective.First and foremost, along with the development ofChinese economy and society, the number of Chinese studying abroad has been soaring in the past years, which has provided an eXpanding base for the number of returnees.In the second place, the government has enacted a series of preferential policies to attract overseas Chinese scholars back st but not least, the booming economy, science and technology in this country have generated more attative job opportunites for scholars returning from overseas.The waves of returnees will definitely contribute to this nation’s development, since they have brought back not only advanced science and technology but also pioneering concepts of education and management.With more scholars coming back from overseas, and with the concerted efforts of the whole nation,we have reasons to eXpect a faster rejuvenation of this country.更多培训课程:苏州个人提升英语更多学校信息:苏州虎丘区朗阁教育机构咨询电话:英语图表作文模板及范文第2篇Students tend to use computers more and more frequently nowadays.Reading this chart, we can find that the average number of hours a student spends on the computer per week has increased sharply.In 1990, it was less than 2 hours; and in 1995, it increased to almost 4 hours, and in 2000, the numbersoared to 20 hours.Obviously computers are becoming increasingly popular.There are several reasons for this change.First,computers facilitate us in more aspects of life.Also, the fast development of the Internet enlarges our demands for using computers.We can easily contact with friends in remote places through the Internet.Besides, the prices of computers are getting lower and lower,which enables more students to purchase them.However, there still eXist some problems, such as poor quality, out-of-date designs and so on.And how to balance the time between using computers and studying is also a serious problem.Anyhow, we will benefit a lot from computers as long as we use them properly.英语图表作文模板及范文第3篇As can be clearly seen from the graph/table/chart (As is shown in the table/figure), great changed have taken place in_______,The_________have/has skyrocketed/jumped from _____to _____.When it comes to the reasons for the changes,different people give different eXplanations.Here I shall just give a begin with, ______What’s more,___________, Last but not least, ________.While it is desirable that ___________,there are still some problems and difficulties for __________Firstly, __________,In addition, __________,In a word, __________.以上就是为大家整理的英语专四图表作文范文模板,希望能够对大家有所帮助。
高考英语写作分类训练:图表作文

图表作文1.假定你是李华,学校英文报正在开展以The Advantages and Disadvantages of Using iPads注意:1.词数100左右;2.短文的题目和首句已为你写好。
The Advantages and Disadvantages of Using iPadsIt is well known that there are advantages and disadvantages of using iPads._______________________________________________________________________________ _______________________________________________________________________________ _______________________________________________________________________________ _______________________________________________________________________________ _______________________________________________________________________________ _______________________________________________________________________________ ______________________________________________________________2.学校英文报正在开展以“Protecting our eyes to enjoy a bright world”为题的讨论。
- 1、下载文档前请自行甄别文档内容的完整性,平台不提供额外的编辑、内容补充、找答案等附加服务。
- 2、"仅部分预览"的文档,不可在线预览部分如存在完整性等问题,可反馈申请退款(可完整预览的文档不适用该条件!)。
- 3、如文档侵犯您的权益,请联系客服反馈,我们会尽快为您处理(人工客服工作时间:9:00-18:30)。
People’s Diet的短文。注意:1、尽可能少引用数据;2、词数100左
右。
1998 1999 2000 2001 2002
Grain 43% 42% 41% 41% 40%
Milk 13% 14% 14.5% 14.5% 15%
Meat 25% 25% 26% 26.5% 27.5%
Fruit 19% 19% 18.5% 18% 17.5% Vegetables
图表作文的框架 As is shown / indicated / illustrated by the figure/
percentage in the table (graph / picture/ pie/ chart), ___________ (作文题目的议题) has been on rise/ decrease (goes up/ increases/ drops/ decreases ), significantly / dramatically/ steadily rising / decreasing from ________ in _______to _______in _________. From the sharp/ marked decline/ rise in the chart, it goes without saying that________.(描写趋势)
2、分析数据间的主要差异及趋势,然后描写(在描写数据间变化 及总趋势特征时,可采用分类式或对比式以支持主题,并阐明必 要的理由)。注意层次。常用词汇:
rise, increase, reduce, drop, decrease, fall, while, but, however, on the contrary, in contrast to, compare…to/with…, as…as, the same as, similar to, different from, difference between, among, more than, less than等等。
图表式作文
图表式作文写作要求学生通过对数据和文字内容进行分析与讨论, 系统准确地表达内容,并得出令人心服的结论。
图表式作文形式:
1、以表格形式,将统计的数据或被说明的事物直接用表格形式 体现出来,即统计表。
2、以图形形式,可分为: a) 以曲线形式表示数据变化的线形图; b) 以条形方式表示数据的大小或数量之间的差异; c) 以圆内扇形的大小表示总体内部结构变化的圆形图。
In a word, the changes are the signs of the improvement in people’s lives. There is no doubt that there will be greater changes in people’s die in the future.
Total 100% 100% 100% 100% 100%
分析:本统计表描述中国人民从1998年至2002年饮食结构的变化。
短文可分为三小节:
1) state the changes in people’s diet in the past five years; 2) give possible reasons for the changes; 3) draw your own conclusions.
第一步:点明主题。
There have been some changes in the diet of the Chinese people.
第二步:观察图表中数据的增减总趋势,分类式阐明,并说明原因。
Grain, the main food of the most people in China, is now playing a less important role. The amount of fruit and vegetables in the average person’s diet has also dropped by 1.5 percent from 1998 to 2002. The amount of milk and meat has increased.
There are at least two good reasons accounting for ________.(给出原因) On the one hand, __________, on the other hand, _______ is due to the fact that_________. In addition, ________ is responsible for ____________. Maybe there are some other reasons to show ________. But it is generally believed that the above mentioned reasons are commonly convincing.
3、归纳总结或发表评论。常用词汇:
in a word, in short, generally speaking, It’s clear from the chart that…, We can draw the conclusion that…, We can learn/know…等等。
例题1:请你根据下表提供的信息写一篇题为:Changes in Chinese
The changes in diet can be explained by several reasons. For one thing, with the development of the economy, people can afford to buy better food. For another, people have realized the importance of a balanced diet. 第三步:归纳总结并得出结论。
第一季度 第二季度 第三季度 第四季度
100 80
60 40
20 0 第一季度
第二季度
第三季度
第四季度东部 西部 北部来自图表式作文三步骤:1、开门见山:点明图表所反映的主题。常用词汇: table, chart, graph, figure, describe, tell, show, represent 等等。