大学英语四级图表作文讲解与训练
英语四级图表作文参考范文PPT课件

2021/6/7
11
2021/6/7
12
2021/6/7
13
2021/6/7
14
修辞语
2021/6/7
15
在运动范畴中存在着如下的8种运动趋向:
• 1. 保持平稳:
•
可以使用的套用结构有: stay stable / remain steady
•
举例:表示“人口数量保持平稳”的时候可以写: the
息发表自己的看法。
2021/6/7
2
二、图表作文的写作步骤•写图源自作文时,要注意遵循以下步骤:•
1)认真分析图表的含义,弄清图表中所含的信息及不
同信息间的关系;
•
2)确定文章的主题思想,构思出文章的基本框架,筛
选出能说明图表主题思想的典型数据;
•
3)编列文章的提纲;
•
4)根据文章的提纲,将各段的提纲内容扩展成段落,
的个性特征
2021/6/7
8
• E. 流程图 • 1. 首先说明:做什么工作的过程,目的是什么 • 2. 准备工作 • 3. 按时间/过程先后描述 • 4. 结果 • 5. 简单总结(可有可无)
• 说明:注意流程图里的“因果关系”或每一流程的“承前 启后”关系;表达每一流程的主体内容,阐明这种关系; 揭示其内在联系或规律;最后,给予简要归纳和总结。
最小值,对比时要总结出数据对比最悬殊的和最小的 • 说明:考察例举数字的能力和方法。注意怎样通过举一些
有代表性的数据来有效地说明问题。
2021/6/7
6
B. 曲线图
• 1极点说明: 对图表当中最高的,最低的点要单独进行说 明
• 2趋势说明: 对图表当中曲线的连续变化进行说明,如上 升,下降,波动,持平
英语四级图表+图画作文讲解及参考范文

英语四级图表和图画作文讲解及参考范文一、图表作文图表作文也是四(六)级考试中常见,而且被认为是一种较难的作文形式。
图表作文就是把非文字信息(通常为各种图表表示的数字信息等)转换成文字信息的一种作文。
它要求我们用文字来描述非文字性的图表或对图表显示的关系作解释说明。
第一节图表作文的出题形式和写作要领一、图表作文常见出题形式图表作文一般在题目中给出作文的标题和一个或几个统计表格、圆形图、曲线图或条形图,有时还用英文或中文提纲的形式给出提示,要求我们:1)用文字描述图表,客观解释图表中所传递的信息,并找出某种规律或趋势;2)就图表中所反映的某种趋势或问题分析其原因或后果。
图表作文着重说明事实,常常是通过对图表中所反映的具体数据的说明、分析、比拟,对某种事物或现象的事实或变化情况等加以说明,并提出结论或看法。
因此,图表作文常常采用议论文体的写作方法。
写好图表作文,关键在于能否读懂图表中所提供的信息,把握各信息间的联系,用准确流畅的语言把这一信息表达出来,并就这一信息发表自己的看法。
二、图表作文的写作步骤写图表作文时,要注意遵循以下步骤:1)认真分析图表的含义,弄清图表中所含的信息及不同信息间的关系;2)确定文章的主题思想,构思出文章的根本框架,筛选出能说明图表主题思想的典型数据;3)编列文章的提纲;4)根据文章的提纲,将各段的提纲内容扩展成段落,然后将各个段落组成文章,注意段与段之间的衔接与过渡;5)检查与修改。
三、图表作文的篇章结构写图表作文时,常采用三段式的陈述方式。
文章的第一段往往分析图表中的数据变化反映什么问题或趋势,概述图表所揭示的信息。
第二段分析造成这一问题或趋势的原因。
第三段那么展望未来的情况或提出解决问题的方法或建议。
这一结构可以简单地表述为:第一段:概述图表反映的主题思想〔总趋势+极端值+特点,时态〕第二段:分析产生的原因第三段:展望未来或提出方法或建议模板一①总的趋势②图表具体描述③剖析图表所揭示的含义④理由一⑤理由二⑥理由三⑦理由四⑧总结⑨前景预测As can be seen from the table, the past decade has witnessed dramatic changes in①______. While ②_______. It is obvious from the table that③_________.What contributed to these changes? I think the reasons are as follows. To start with,④______. Secondly, ⑤______ . What’s more, ⑥ _______. Last but not lease, ⑦________. In conclusion, ⑧_________. Moreover, ⑨ ________.模板二①描述图表②分三方面解释原因③下结论1) During the period from _______to _______, ________rose from ________to _______, while _______ decreased from _______ to _______.2) We believe that three reasons can account for this phenomenon. First,____. Second, ____. Third, _____.3) ___.We are happy to see that things are becoming better and better nowadays. We can imagine that ___.模板三①描述图表②解释图表③补充解释1) During the period between _______ and ________, ________ declined abruptly from_______ to ________, while ________ increased sharply from ________ to _______.2) Several reasons can account for this phenomenon. Compared with _________ is much cheaper and more convenient__________ . Apart from that, _________.3) However, there are still a number of people who _________, generally for two reasons. On the one hand,________. On the other hand, ________.1.图表类型:table 表格; chart 图表; diagram图表或图解,示意图; graph图表, 曲线图; column/ bar chart柱状图; pie graph饼图2. 描述:show; describe; illustrate; can be seen from; clear; apparent; reveal 显示; represent表现,描绘3.内容:figure数字; statistic统计值; statistics [用作复]统计, 统计数字[资料], 统计表number; percentage; proportion● 表示数据上升:increase, rise, ascend, core, surge, go up, climb, mount, level up下降: decrease, fall, drop, descend, decline, reduce ,lessen, level, down平稳: stable, steady, remain steady/stable; /maintain/keep/be the same as/similarto ; little/hardly any /no change波动: fluctuate, fluctuation, rise and falls, up and down占: occupy,take up,account for, gain而: while, however, whereas , on the other hand, actually/in fact相比: by contract, on the contrary, likewise, compared with最高点: the highest, the top, the summit, the peak, the most最低点: bottom, less, least, rock bottom最低点例句Prices have hit rock bottom. 价格已达最低水平平均: mean平均值, average趋势: tendency, trend, inclination预见: prediction到达顶峰: mount to比例:20 per cent , 20%one in three, 1/3one out of every four,1/4有一个稳定的过程: a stable period can be seen表示变化程度的词:sudden/suddenly 突然的,意外的rapid/rapidly 迅速的,飞快的,险峻的dramatic/dramatically 戏剧性的,生动的significant/significantly 有意义的,重大的,重要的sharp/sharply 明显的,急剧的steep/steeply 急剧升降的steady/steadily 稳固的,坚决不移的gradual/gradually 渐进的,逐渐的slow/slowly 缓慢的,不活泼的slight/slightly 轻微的、略微地stable/stably 稳定的表示范围:from…to… between…and… for …to …多长时间直到表示程度:almost adv. 几乎,差不多nearly adv. 几乎,密切地approximately adv. 近似的,大约just over 刚超过exactly adv. 正确地,严密地precisely adv. 正好精确地;清晰地●常用词和短语significant changes 图中一些较大变化noticeable trend 明显趋势during the same period 在同一时期grow/grew 增长distribute 分布,区别unequally 不相等地pronounced 明显的average 平均no doubt 无疑地corresponding adj. 相应的,通讯的represent vt. 阐述,表现overall 体上讲except 除外in the case of adv. 在…的情况下in contrast 相反,大不相同in conclusion adv. 最后,总之in comparison 相比之下inversely adv. 相反地,倒转地in general 通常,大体上,一般而言rang from…to 从…到…不等excessive adj. 过多的,过分的,额外lower v. 降低,跌落elapse vi. 〔时间〕过去,消逝category n. 种类government policy 政府政策market forces 市场规律measure n. 尺寸,方法,措施v.估量,调节forecast n. 先见,预见四、图表作文常用的句型(1)常用的开篇句型(即概述图表内容时常用的表达法)①According to the table/pie chart/line graph/bar graph, we can see/conclude that … 根据该表/图,我们可知……②The table/graph reveals (shows/indicates/illustrates/ represents/points out) that … 该表/图说明……③As we can see from the table …As can be seen from the line/bar graph …As is shown (illustrated/indicated) in the pie chart …如表/图所示,……(2) 描述增减变化常用的句型①Compared with … is still increased by …②The number of … grew/rose from … to …③An increase is shown in …; then came a sharp increase of …④In … the number remains the same/drops to …⑤ There was a very slight (small/slow/gradual) rise/increase in 1990.⑥ There was a very steady (marked/sharp/rapid/sudden/ dramatic) drop(decrease/decline/fall/reduction) in 1998/ compared with that of last year).来看一篇范文:⑴ From the graph, we can see that the number of car accidents in Walton city fluctuated during the year of 1990. ⑵ The first two months of 1990 showed an increasing trend. ⑶ The rate rose to 32 in March but fell to 26 in June. ⑷ From June on, the rate was rising again and reached the peak point 39 in August. ⑸ After August the rate began to decline remarkably, and eventually dropped to the lowest point 16 at the end of the year. ⑹Therefore, it’s obvious that car a ccident in Walton city declined in 1990.⑴主题句/概述表格反映的内容⑵—(5)反映交通事故的变化情况(6)小结:总结表格数据反映的总趋势⑺There are several reasons for the decline. ⑻ First, a new traffic law was made and came into force. ⑼ It provided that in summer every car must be air-conditioned. ⑽ As a result, the highest rate in August, when humidity and high temperature make drivers impatient and easily lead to car accidents, dropped steadily. ⑾ Second, new roads were built and some narrow streets were widened, which quickened the flow of traffic. ⑿ Finally, the city administration made great efforts to heighten people’s awareness of observing traffic rules.⑺主题句⑻原因/措施一⑼解释措施一/次要辅助⑽采取措施一后的结果⑾原因/措施二⑿原因/措施三⒀With all these new measures, I’m sure the rate of car accidents in Walton city will go on falling this year.⒀总结:展望未来的情况第二节图表作文样题与样文举例样题一:Directions: For this part, you are allowed 30 minutes to write a composition on the topic How People Spend Their Holidays. You should write at least 120 words, and base your composition on the table and the outline given below:1、根据上表,简要描述1990年、1995年、2000年某城市人们度假方式的情况及其变化;2、请说明发生这些变化的原因;3、得出结论。
英语专业四级写作备考四-图表作文
易犯错误&解决方法
盲目地把图表中所有数据都描写出来,不管是否和主题有 关。
解决方法:可以在描写和引用数字前,先把这些数据要反 映的问题用一句话写出来。这样就把数据看成是一种用来 说明问题的具体数据材料 (statistical evidence) 。选用的数 据必须和论述有关。
例2
Rising Divorce Rates in China
12%
58%
30%
1992
1
2
3
上图1、2 、3分别表示: 1:Graduates who continue to study 2:Graduates who take jobs irrelevant to their majors 3:Graduates who hold jobs in their majors
1. The rapid growth of divorce rates from 1987 to 1992 results from two obvious facts. The new marriage law simplifies the procedures of divorce. Besides, the improvement of women social status makes divorce a common thing.
2023最新整理收集 do something
Writing a Composition According
to Tables and Graphs
By Lara
Table of Contents
图表作文和一般作文的区别 看懂图表要领(1) 看懂图表要领(2) 图一、图二分析
易犯错误&解决方法 常用数字表达法 Basic Writing Structure etc. More Exercises
英语四级图表作文讲解及参考范文

英语四级图表作文讲解及参考范文一. 教学内容:书面表达讲解与训练——图表类写作[如何写图表作文]图表作文要求考生根据所给的图表、数据及标题进行分析、研究,阅读其中的文字和说明,弄清各种信息之间的关系,提炼和确定出文章的中心思想。
然后进行分析、概括和归纳。
注意:1)图表和数据内容不必全部描述。
2)善于抓住总的规律,趋势,归纳增减率。
3)时态:特定时间用过去时。
经常出现的情况或自己的评述用一般现在时。
[图表作文形式有]数字表:曲线图(line graph) 表格(table) 图形表:饼状图(pie chart) 条状图(bar char)?[常见的表达用语]短语:1上升go up to/ climb to/ increase to/ rise to/ jump toThe population of this city has been increasing so rapidly that it has now amounted to 250 million.There was a rapid increase between 1993 and 1994, and the number then jumped to five million in 1995.2 保持没变remain; not changeThe number of fires in each month remained the same.3下降fall to; go down to; decrease; drop to; decline;%In comparison with that in 1988, the percentage of peak points decreased by 30%.The number of South American travelers increased slightly and the number of visitors from Europe declined slightly.句式:The table shows (indicates) that a great number of people spent their holidays traveling abroad.As we can see from the graph that the rate dropped slightly from 38% in 1993 to 31% in 2003.…From the table we can find out that only 35% of the people have taken in physical activities.…According to Chart I,the number was ten times as many as in 1995.Compared with the boys, the girls show more interested in chatting.|The number of the boys playing games is much larger than that of the girls....is equal to that of...It doubled the number of last year.结束语As can be seen from the chart that, only 10% of the time is taken up with sports activities.…As is shown in the chart, the production last month rose so significantly…As is described in the chart, the total number of visitors to the United States had nearly doubled to million person by 1974.After giving a careful consideration to the problem, I think I will be able to select the one who best fits the position.;It is clear from the chart that as incomes increase people can afford to live more comfortably and eat well.Therefore, we need to educate our children, warning them of the dangers of playing with matches.In conclusion, the upward trends suggest that more and more computer users will have access to Internet in the future.In summary, smoking increased three different times and declined twice, with the last downward trend still continuing.[常用连接词]To move to the next major point: what’s more, in addition, besides, furthermore.To contrast a point: on the contrary, on the other hand, nevertheless, however, yet.#To conclude a point: consequently, as a result, in other words, in short, accordingly.To emphasize a point: without doubt, chiefly, as a matter of fact, in fac模板一①总的趋势②图表具体描述③剖析图表所揭示的含义④理由一⑤理由二⑥理由三⑦理由四⑧总结⑨前景预测As can be seen from the table, the past decade has witnessed dramatic changes in①______.While ②_______. It is obvious from the table that③_________.What contributed to these changes I think the reasons are as follows. To start with, ④______. Secondly, ⑤______ . What’s more, ⑥_______. Last but not lease, ⑦________.、In conclusion, ⑧_________. Moreover, ⑨________.模板二①描述图表②分三方面解释原因③下结论1) During the period from _______to _______, ________rose from ________to _______, while _______ decreased from_______ to _______.2) We believe that three reasons can account for this phenomenon. First,____. Second, ____. Third, _____.3) are happy to see that things are becoming better and better nowadays. We can imagine that ___.模板三①描述图表②解释图表③补充解释*1) During the period between _______ and ________, ________ declined abruptly from _______ to ________, while________ increased sharply from ________ to _______.2) Several reasons can account for this phenomenon. Compared with _________ is much cheaper and moreconvenient__________ . Apart from that, _________.3) However, there are still a number of people who _________, generally for two reasons. On the one hand,________. On the other hand, ________.范文:Film Is Giving Way to TV1. 电影观众越来越少2. 电视观众越来越多,因为……3. 然而,还是有人喜欢看电影,因为……1.图表类型:《table 表格; chart 图表; diagram图表或图解,示意图; graph图表, 曲线图; column/ bar chart柱状图; pie graph饼图2. 描述:show; describe; illustrate; can be seen from; clear; apparent; reveal 显示; represent表现, 描绘3.内容:figure数字; statistic统计值; statistics [用作复]统计, 统计数字[资料], 统计表number; percentage; proportion●表示数据上升:increase, rise, ascend, core, surge, go up, climb, mount, level up下降: decrease, fall, drop, descend, decline, reduce ,lessen, level, down平稳: stable, steady, remain steady/stable; /maintain/keep/be the same as/similar to ; little/hardly any /no change 波动: fluctuate, fluctuation, rise and falls, up and down、占: occupy,take up,account for, gain make up而: while, however, whereas , on the other hand, actually/in fact相比: by contract, on the contrary, likewise, compared with最高点: the highest, the top, the summit, the peak, the most最低点: bottom, less, least, rock bottom最低点例句Prices have hit rock bottom. 价格已达最低水平平均: mean平均值, average趋势: tendency, trend, inclination、预见: prediction达到顶峰: mount to比例:20 per cent , 20%one in three, 1/3one out of every four,1/4有一个稳定的过程: a stable period can be seen表示变化程度的词:sudden/suddenly 突然的,意外的rapid/rapidly 迅速的,飞快的,险峻的¥dramatic/dramatically 戏剧性的,生动的significant/significantly 有意义的,重要的sharp/sharply 明显的,急剧的steep/steeply 急剧升降的steady/steadily 稳固的,坚定不移的gradual/gradually 渐进的,逐渐的slow/slowly 缓慢的,不活跃的slight/slightly轻微的、略微地stable/stably 稳定的表示范围:from…to…between…and…for …to …多长时间直到表示程度:almost adv. 几乎,差不多nearly adv 几乎,密切地approximately adv. 近似的,大约just over 刚超过exactly adv. 正确地,严密地|precisely adv. 正好精确地;清晰地●常用词和短语significant changes 图中一些较大变化noticeable trend 明显趋势during the same period 在同一时期grow/grew 增长distribute 分布,区别unequally 不相等地corresponding adj. 相应的,通讯的pronounced 明显average 平均no doubt 无疑地rang from…to 从…到…不等represent vt. 阐述,表现overall 体上讲except 除外in the case of adv. 在…的情况下in contrast 相反,大不相同$in conclusion adv. 最后,总之in comparison 相比之下inversely adv. 相反地,倒转地in general 通常,大体上,一般而言excessive adj. 过多的,过分的,额外lower v. 降低,跌落elapse vi. (时间)过去,消逝category n. 种类government policy 政府政的category n. 种类market forces 市场规律measure n. 尺寸,方法,措施v.估量,调节forecast n. 先见,预见表示程度的副词:1.)程度较大:considerably dramatically greatly markedly obviously quickly rapidly sharply significantly suddenly2)程度较小:slightly gradually slowly steadily#四、图表作文常用的句型(1)常用的开篇句型(即概述图表内容时常用的表达法)①According to the table/pie chart/line graph/bar graph, we can see/conclude that …根据该表/图,我们可知……②The table/graph reveals (shows/indicates/illustrates/ represents/points out) that …该表/图表明……③As we can see from the table …As can be seen from the line/bar graph …As is shown (illustrated/indicated) in the pie chart …如表/图所示,……(2) 描述增减变化常用的句型①Compared with …is still increased by …②The number of …grew/rose from …to …③An increase is shown in …; then came a sharp increase of …④In …the number remains the same/drops to …⑤There was a very slight (small/slow/gradual) rise/increase in 1990.⑥There was a very steady (marked/sharp/rapid/sudden/ dramatic) drop (decrease/decline/fall/reduction) in 1998/ compared with that of last year).来看一篇范文:`⑴From the graph, we can see that the number of car accidents in Walton city fluctuated during the year of 1990. ⑵The first two months of 1990 showed an increasing trend. ⑶The rate rose to 32 in March but fell to 26 in June. ⑷From June on, the rate was rising again and reached the peak point 39 in August. ⑸After August the rate began to decline remarkably, and eventually dropped to the lowest point 16 at the end of the year. ⑹Therefore, it’s obvious that car accident in Walton city declined in 1990.⑴主题句/概述表格反映的内容⑵—(5)反映交通事故的变化情况(6)小结:总结表格数据反映的总趋势⑺There are several reasons for the decline. ⑻First, a new traffic law was made and came into force. ⑼It provided that in summer every car must be air-conditioned. ⑽As a result, the highest rate in August, when humidity and high temperature make drivers impatient and easily lead to car accidents, dropped steadily. ⑾Second, new roads were built and some narrow streets were widened, which quickened the flow of traffic. ⑿Finally, the city administration made great efforts to heighten people’s awareness of observing traffic rules.⑺主题句⑻原因/措施一⑼解释措施一/次要辅助⑽采取措施一后的结果⑾原因/措施二⑿原因/措施三⒀With all these new measures, I’m sure the rate of car accidents in Walton city will go on falling this ye ar.⒀总结:展望未来的情况第二节图表作文样题与样文举例样题一:Directions: For this part, you are allowed 30 minutes to write a composition on the topic How People Spend Their Holidays. You should write at least 120 words, and base your composition on the table and the outline given below:1、根据上表,简要描述1990年、1995年、2000年某城市人们度假方式的情况及其变化;《2、请说明发生这些变化的原因3、得出结论。
四级考试图表作文写作技巧

饼状图
特点
用于展示整体中各部分的占比关系。
重点
关注各部分占比大小和变化,以及占比与整体的关系。
分析
比较不同时间段或不同群体之间的占比差异,探究占 比变化的原因和影响。
表格
特点
用于展示多维度数据,包括数值和文字信息。
重点
关注数据的全面性和细节,注意数据的准确 性和可信度。
分析
对表格中的数据进行分类、筛选、计算和对 比,挖掘数据背后的信息和意义。
03
特点
用于比较不同类别之间的 数找 出最大值、最小值和变化 趋势。
分析
比较不同时间段或不同群 体之间的数据,探究数据 背后的原因和影响。
折线图
特点
01
用于展示数据随时间变化的趋势。
重点
02
关注数据变化的规律和趋势,以及峰值和谷值出现的时间点。
分析
03
探究数据变化的内在原因,预测未来趋势,并给出相应建议。
05 实例分析
优秀范文展示
文章结构清晰
优秀范文通常具有明确的文章结 构,包括开头、主体和结尾,层 次分明,逻辑性强。
语言准确流畅
范文的语言表达准确,语法和拼 写错误较少,同时流畅自然,易 于阅读。
图表描述细致
范文能够准确描述图表中的信息, 对数据和趋势进行恰当的分析和 解释。
学生常见错误分析
文章结构混乱
描述图表内容
01
按照题目要求,准确描述图表中的数据和信息,注意使用合 适的单位和表述方式。
02
突出图表中的关键信息和趋势,并解释其含义和影响。
03
可以适当进行图表数据的分析和比较,以支持文章观点。
总结与启示
总结图表所反映的问题或趋势,以及 可能的原因和影响。
英语四级写作万能之主题作文及图画作文
英语四级写作万能之主题作文及图画作文英语四级写作万能模板之主题作文及图画作文一、主题作文及图画作文的模板:These days 现象 often hits the headlines of newspapers and has been brought into focus of the public. Just as the picture shown that… (如果是图画作文可以写出具体的现象或问题,也可以一句话描述图画:As is vividly illustrated above, in the +地方 +动词(be, come, run, walk, jump, sit, stand, lie, crouch, float等)+主题词,非谓语动词/非限制性定语从句,独立主格/非限制性定语从句。
) Indeed, it is widely accepted / acknowledged that it has gained increasing popularity among people in all walks of life/ college students.Those who are in favor of 现象 maintain that 描述观点1. In their view, 阐释观点1. On the contrary, those who are against 现象 hold/ point out that 描述观点2. Besides, 阐释证实观点2 . (第二段可以根据文章来分析原因,影响,优点或缺点等。
)It is high time we put an end to the undesirable phenomenon of… (虚拟语气的句子) 然后再分条来说明措施。
On the one hand, … on the other hand, … I believe we humans c an overcome this difficulty and we will have a brighter future.改革之后,图画作文考的比较多,无论是图画作文还是主题作文,上面的结构是可以通用的,考生可以重点记下图画作文与主题作文的.句型。
四级英语写作:应用文写作(图表,漫画)

常用句式、词汇
• • • • • • • • • • • 1) 总括性描述 As can be seen from the table, great changes have been taking place in ... From the above table it can be seen that... As it is shown in the table,... According to the graph, ... It is clear from the table that ... The survey shows/suggests that ... According to the figures given in the table ... A study showed ... As you may see from the diagram,... The two charts above tell us something about ...
图表、图片作文写作步骤
Introduction
第一步 尽量用一句话把图表反映的问题或现象或趋势归 纳出来,放在开头表达清楚。 第二步 挑选有代表意义的数据点进行详细描述 第三步 回归传统作文
图表作文写作方法
开头写法
1. 对比分析,寻找数据的变化规律 图表作文通常要论述某个论点,因此,所提供的数据资料一 般都是有规律的.但这些数据是一些零散的信息,需要我们总结 和归纳.关键就是对比数据之间的关系,包括横向和纵向的比较 :从横向看,同一类(如事物A)数据随时间变化是升还是降,升降 的幅度多大;从纵向看,不同类别(如事物A、B、C)的变化是相 似还是相反,从中寻找规律. 以91.6 CET-4: Changes in People's Diet in China 为例( 表1).
2023年英语四级图表作文的类型及参考范文

您目前旳位置: 首页 > 英语四级 > 英语四级作文 > 英语四级作文综合辅导 > 正文英语四级图表作文旳类型及参照范文图表作文也是四(六)级考试中常见, 并且被认为是一种较难旳作文形式。
图表作文就是把非文字信息(一般为多种图表表达旳数字信息等)转换成文字信息旳一种作文。
它规定我们用文字来描述非文字性旳图表或对图表显示旳关系作解释阐明。
下面我们先来看一看图表作文旳类型。
第一节图表作文旳类型图表作文可分为两大类: 表作文和图作文。
表作文表格(Table)可以使大量数据系统化, 便于阅读、比较。
表格常由标题(Title)、表头(Boxhead)(表格旳第一行)、侧目(Stub)(表格左边旳第一列)和主体(Body)部分(表格旳其他部分)等部分构成。
如下表:用表格体现旳信息详细精确, 并且表格中旳各项均按一定规律排列。
阅读表格时要注意找出表格中各个项目旳互相关系, 表格中各个项目旳变化规律。
例如, 上面旳表格中旳数字阐明, 和1978年相比, 1983年大学入学旳人数在增长, 而小学旳入学人数在减少。
弄清晰这些变化规律也就读懂了表格旳内容。
图作文图作文又可分为三种: 圆形图作文、曲线图作文和条状图作文。
(1) 圆形图作文圆形图(Pie chart)也称为饼状图或圆面分割图。
圆形图由于比较形象和直观, 各部分空间大小差异轻易辨别, 因此常用来表达总量和各分量之间旳比例关系。
整个圆表达总量, 楔形块表达分量。
有时圆形图尚有数值表, 两者结合可把各分量表达得更精确、清晰。
例如:Thi.i..pi.char.o.th.averag.weekl.expenditur.o..famil.i.Grea.Britain.A.ca.b.se.fr o.th.chart.th.mai.expenditur.o.a.averag.Britis.famil.i.spen.o.food.whic.account. fo.25.o.it.tota.expenditure.Th.nex.tw.significan.expendin.item.ar.transpor.an.ho using.whic.ar.15.an.12.respectively.I.w.tak.int.accoun.clothin.an.footwear.whic. make.u.10%.th.fou.essential.o.life.tha.is.food.transport.housing.an.clothin.an.f ootwear.amoun.t.62.o.th.tota.expenditure.(2) 曲线图作文曲线图(Line graph)也称为线性图或坐标图。
新大学英语四级作文专题(图表作文和应用文)(含答案)

图表作文图表作文提示部分包括图表和文字要点提示两部分。
图表的类型主要有:圆形(饼型)图(pie chart)、柱形图(直型图)(graph)、曲线图(chart)和数据统计表(表格)(table)。
图表作文的写作容包括综合理解、客观详述和主观表达。
模板一①总的趋势②图表具体描述③剖析图表所揭示的含义④理由一⑤理由二⑥理由三⑦理由四⑧总结⑨前景预测As can be seen from the table, the past decade has witnessed dramatic changes in ①______. While②_______. It is obvious from the table that③_________.What contributed to these changes?I think the reasons are as follows.To start with,④______. Secondly,⑤______ . What’s more,⑥ _______. Last but not least,⑦________.In conclusion,⑧_________. Moreover,⑨ ________.文: How People Spent Their HolidaysYear 1990 1995 2000Traveling 37% 51% 76%Staying at home 63% 49% 24%1.上图所示为1990、1995、2000年某城市人们度假方式的情况,请描述其变化:2.请说明发生这些变化的原因。
3.得出结论。
How People Spent Their HolidaysAs can be seen from the table,the past decade have witnessed dramatic changes in the way people spent their holiday between 1990 and 2000.In 1990, 63% of people spent their holidays at home,while the figure dropped considerably to24%in2000.It is obvious from the table that people tended to be more and more mobile,and they wanted to get entertainment in the outside world.What contributed to these changes?I think the reasons are as follows.To start with,with the rapid development of economy,people earn by far more money than they used to.Thus,people are able to afford traveling expenses.Secondly,people thinkit important to get well-informed about the outside world in this new era when everything is on the move.Traveling,of course,is a sure way to achieve this goal. What's more, in this competitive society, people are usually under great stress. However,it is not difficult to find traveling an effective way to relieve people's stress and get st but not least,by traveling outside,people are closeto nature, which is not only beneficial to both their health and peace of mind.In conclusion, people prefer to go traveling rather than stay at home during holidays for a combination of reasons.Moreover,it seems that this trend will lastin the foreseeable future.模板二①描述图表②分三方面解释原因③下结论1)During the period from_______to_______,________rose from________to_______,while _______ decreased from _______ to _______.2)We believe that three reasons can account for this phenomenon.First,____.Second,____. Third, _____.3) ___.We are happy to see that things are becoming better and better nowadays. We can imagine that ___.文: Health Gains in Developing Countries1.以下图为依据描述发展中国家的期望寿命(1ife expectancy)和婴儿死亡率(infant mortality)的变化情况2.说明引起变化的各种原因Health Gains in Developing CountriesDuring the period from1960to1990,the life expectancy of developing countries rose from 40 years to nearly 60 years, while infant mortality decreased from 200 deaths per 1000 births to around 100.We believe that three reasons can account for this phenomenon. First, economy develops quickly in developing countries during this period, and living quality improves significantly as a result.Second,people's health conditions also become better and better with the development of national health care systems. When they become richer and richer, they care more about personal health conditions. Third, medical sciences also develop at a fantastic speed,and it is much safer for mothersto give birth.We are happy to see that things are becoming better and better nowadays.We can imagine that people will live longer and the infant mortality will again fall. [1996.6. CET-6]模板三①描述图表②解释图表③补充解释1)During the period between_______and________,________declined abruptly from_______ to ________, while ________ increased sharply from ________ to _______. 2)Several reasons can account for this pared with_________is much cheaper and more convenient__________ . Apart from that, _________.3) However, there are still a number of people who _________, generally for two reasons. On one hand,________. On the other hand, ________.文: Film Is Giving Way to TV1.电影观众越来越少2.电视观众越来越多,因为……3.然而,还是有人喜欢看电影,因为……Film Is Giving Way to TVDuring the period between1975and1985,film-goers declined abruptly from85,000to about12,000,while TV-watchers increased sharply from5,000to more than100,000.Several reasons can account for this phenomenon. Compared with a film, TV is much cheaper and more convenient--you don't have to leave your house at all.Apart from that, you have many choices while watching TV, but a film concentrates on a certain topic.However, there are still a number of people who enjoy going to the cinema,generally for two reasons. On the one hand, the audio-visual effect of a cinema is much better. On the other hand, in a quiet and comfortable place such as a cinema,you can concentrate on what you are watching and get the most of the film.作业:2002年06月英语四级写作试题Directions: For this part, you are allowed thirty minutes to write a composition on the topic Student Use of Computers.You should write at least 120words,and base your composition on the chart and the outline given below:181614121086420三维柱形图 11990199520001.上图所示为1990年、1995年、2002年某校大学生使用计算机的情况,请描述其变化;2.请说明发生这些变化的原因(可从计算机的用途、价格或社会发展等方面加以说明);3.你认为目前大学生在计算机使用中有什么困难或问题。
大学英语四级图表写作

大学英语四级图表写作大学英语四级图表写作:如何准确传达数据信息在大学英语四级考试中,图表写作是必考题型之一。
考生需要具备良好的图表解读能力和语言表达能力,才能准确传达数据信息。
本文将为大家分享大学英语四级图表写作的技巧和注意事项,帮助大家提高图表写作水平。
一、理解图表类型在开始写作之前,考生需要了解不同的图表类型。
大学英语四级考试中常见的图表类型包括柱状图、饼图、曲线图和表格等。
每一种图表类型都有其特点和适用范围,考生需要根据题目要求选择合适的图表类型进行写作。
二、明确图表主题在开始写作之前,考生需要先明确图表的主题是关于什么的。
只有准确理解图表的主题,才能确定文章的中心思想。
在写作过程中,考生需要紧紧围绕主题展开论述,确保文章内容与主题密切相关。
三、关注数据变化图表中的数据变化是文章的重点。
考生需要认真观察数据变化,找出趋势和规律,然后对这些趋势和规律进行分析和解释。
在描述数据时,考生需要注意数据的准确性和语言的简洁性,避免夸大或歪曲事实。
四、注意语言表达在大学英语四级图表写作中,语言表达是非常重要的。
考生需要使用准确、简洁的语言描述图表中的数据信息。
在写作过程中,考生可以适当地使用一些连接词和过渡句,使文章更加流畅。
此外,考生还需要注意语法、拼写和标点等方面的错误,确保文章质量。
五、练习与总结最后,考生需要进行大量的练习,熟悉各种图表类型和写作技巧。
在练习过程中,考生可以发现自己存在的问题和不足,然后及时进行总结和改进。
只有通过不断的实践和反思,才能提高自己的图表写作能力。
总之,大学英语四级图表写作需要考生具备良好的图表解读能力和语言表达能力。
在写作过程中,考生需要准确理解图表类型、明确主题、关注数据变化、注意语言表达等方面的技巧和注意事项。
通过大量的练习和总结,相信大家一定可以写出优秀的图表作文。
大学英语四级图表作文写作大学英语四级图表作文写作在大学英语四级考试中,图表作文是一个重要的考点。
四级作文看图写作-四级图表作文的写作方法
四级作文看图写作|四级图表作文的写作方法【--考试祝福语】四级的考试路数越来越向雅思靠拢了,万一考到十年间只出现过两次的图表类作文该怎么办?没关系,现在就教你搞定四级图表作文的方法。
一、柱状图写作技巧1. 柱状图写作注重比较和对比,也就是说需要横向总结所有柱状图表的共性特征,也要分别描写各个柱子的个性特征。
2. 有两种写作方式:其一是对不同时间段内的数据进行比较,适合于数据代表的物体较少且时间界限明确的情况。
另外是对单独数据的全程描述,适合于描述数据对象很多且时间划定不清晰的情况。
柱状图数据描述句型举例:1) the bar chart shows the changes in the numberofover the period fromto该柱状图描述了在年之年间数量的变化。
2) the bar chart provides some interesting dataregarding该柱状图为我们提供了有关有趣数据。
3) this is a bar chart which describes the trend of该柱状图描述了的趋势。
4) As can be seen from the diagram,great changes have takenplace in从柱状图中可以看出,发生了巨大变化。
二、曲线图写作技巧1. 曲线图是动态图,解题的切入点在于描述趋势;2. 在开头部分对整个曲线进行一个阶段式的总分类;3. 趋势说明。
即,对曲线的连续变化进行说明,如上升、下降、波动、持平。
以时间为比较基础的应抓住“变化”:上升、下降、或是波动;4. 极点说明。
即对图表中最高的、最低的点单独进行说明。
不以时间为比较基础的应注意对极点的描述。
曲线图数据描述句型举例:1) The line chart depicts the changes in the number of……over the period from 2010 to 2013.该曲线图描述了从2010年到2013年……数量的变化。
四级作文万能模板图表类

四级作文万能模板图表类
口语化图表解读。
哇,看这图表,简直就像一座过山车!忽高忽低,这就是咱们的数据走势啊!
这左边一溜儿往上冲,说明啥?说明这几年某事儿可是越来越火,大家都抢着干呢!右边这儿,虽然有点波折,但总体上还是往上涨的,就是说虽然中间出了点小插曲,但大方向没错,咱们还是一路向前。
话说回来,为啥会这样呢?我猜啊,可能是因为现在的科技太发达了,大家都愿意尝试新事物。
再加上政府也给力,给了不少好政策,这不是双剑合璧,让这事儿越来越火吗?
总的来说啊,这图表告诉我们,某事儿现在火得很,未来也肯定差不了!大家一起加油干,准没错!。
大学英语四级考试---图表作文写作方法
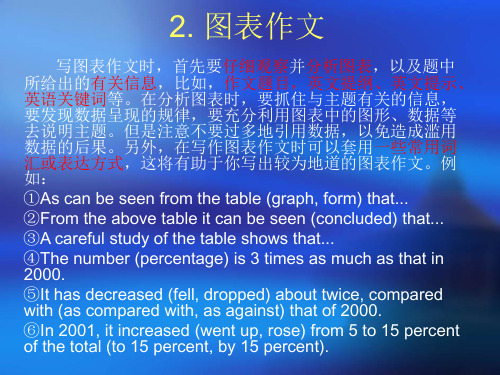
写图表作文时,首先要仔细观察并分析图表,以及题中 所给出的有关信息,比如,作文题目,英文提纲、英文提示、 英语关键词等。在分析图表时,要抓住与主题有关的信息, 要发现数据呈现的规律,要充分利用图表中的图形、数据等 去说明主题。但是注意不要过多地引用数据,以免造成滥用 数据的后果。另外,在写作图表作文时可以套用一些常用词 汇或表达方式,这将有助于你写出较为地道的图表作文。例 如: ①As can be seen from the table (graph, form) that... ②From the above table it can be seen (concluded) that... ③A careful study of the table shows that... ④The number (percentage) is 3 times as much as that in 2000. ⑤It has decreased (fell, dropped) about twice, compared with (as compared with, as against) that of 2000. ⑥In 2001, it increased (went up, rose) from 5 to 15 percent of the total (to 15 percent, by 15 percent).
(b)
段落一:The chart gives us an overall picture of the
____________(图表主题). The first thing we notice is
that_______________(图表最大特点). This means that as __________,
英语四级作文图表描述写作技巧初探
英语四级作文图表描述写作技巧初探一. 柱状图写作技巧1柱状图是动态图表,切入点是描述趋势。
2柱状图写作注重“比较”(找出similarity)和“对比”(找出difference),也就是说需要横向总结所有柱状图表的共性特征,也要分别描写各个柱子的个性特征。
3有两种写作方式:其一是对不同时间段内的数据进行比较,适合于数据代表的物体较少且时间界限明确的情况。
另外是对单独数据的全程描述,适合于描述数据对象很多且时间划定不清晰的情况。
柱状图数据描述句型举例:1).the bar chart shows the changes in thenumber of……over the period from……to……该柱状图描述了在……年之……年间……数量的变化。
2).the bar chart illustrates that……该柱状图展示了……3).the bar chart provides some interesting dataregarding……该柱状图为我们提供了有关……有趣数据。
4).this is a bar chart which describes thetrend o f……该柱状图描述了……的趋势。
5). As can be seen from the diagram,great changes have taken place in……从柱状图中可以看出,……发生了巨大变化。
二.曲线图写作技巧1.曲线图是动态图,解题的切入点在于描述趋势。
2.在开头部分对整个曲线进行一个阶段式的总分类,使写作层次清晰,同时也方便考官阅卷。
接下来再分类描述每个阶段的specific trend,同时导入数据作为分类的依据。
3.趋势说明。
即,对曲线的连续变化进行说明,如上升、下降、波动、持平。
以时间为比较基础的应抓住“变化”:上升、下降、或是波动。
题中对两个或两个以上的变量进行描述时应在此基础上进行比较,如变量多于两个应进行分类或有侧重的比较。
大学英语四级考试图表作文及范文

1.table(表)/graph(图表,曲线图)/diagram(图表)/chart(图表)Pie chart(饼状图)/bar graph(柱状图)/line graph(曲线图)2.开头的常用表达⑴It can be seen from the diagram that...⑵It has been shown from the figures that...⑶It is clear/ apparent from the figures/statistics that…⑷It is clear/ apparent from the table/chart/diagram/graph figures that…⑸The table/chart/diagram/graph shows that…⑹The table/chart/diagram/graph shows/describes/illustrates how…⑺According to the table/chart/diagram/graph,⑻As is shown in the table/chart/diagram/graph,⑼As is vividly betrayed in the table/chart/diagram/graph above,⑽As can be seen from the table/chart/diagram/graph that…⑾From the table/chart/diagram/graph, we can find that…⑿We can see from the chart (table/graph/figures/statistics) that...For example:⑴As is shown by the graph, there has been a rapid increase in the population of the country in the past five years.⑵It can be concluded from the graph that there has been a great decline in birth rates in China in the past five years.⑶From the statistics given in the table it can be seen that the average personal income of the Chinese people increased(grew 、rose) rapidly from 1985 to 1990.This bar chart describes significant changes in the ownership of houses in a big city in China. It can be seen from the chart that a very noticeable trend from 1990 to 2000 was the dramatic increase in the private ownership of houses as opposed to the huge drop in the state ownership of houses. In 1990, three out of four houses were state-owned. However, by 2000, the percentage of the ownership of private houses has soared to 80%.The above chart reveals that the huge expansion in the private house ownership has been accompanied by a corresponding fall in the state ownership of houses in a span of a decade. (1990-2000)As is suggested ( unfolded / demonstrated / illustrated / mirrored ) in the above chart, with the sharp rise in the private ownership of houses, the state ownership of houses has dramatically ( substantially / alarmingly ) dropped in a passage of a decade. (1990-2000)According to the above chart, there has been a drastic growth in the private ownership of houses, while the state ownership of houses has shrunk steeply over the past decade. ( 1990-2000)From the above chart, we can see distinctly that the private ownership of houses has witnessed an huge rise as distinct from ( as opposed to / in contrast to / in comparison with ) the drastic decrease in the state ownership of houses in a matter of a decade. (1990-2000)2.图表数据描述的常用表达1.上升趋势⑴The number of …has increased/rose slightly/slowly/gradually/steadily/significantly/rapidly/dramatically/steeply/suddenly…from…year to…year/ between…year and…year.⑵The number of …has soared/rocketed to/over…in …year/in the year of…⑶There was a very sudden/rapid/dramatic/significant/sharp/steady gradual/slow/slight increase/rise in the numberof …from…year to…year/ between…year and…year.For example:⑴The number of teaching staff members in this school has decreased to 700 persons.⑵The number of paticipants grew up to 300000 persons.⑶The number of colour TV sets produced by the factory increased (rose , grew , climbed) from 5000 in 1986 to 21000 in 1990.2.下降趋势The number of …has decreased/fallen/d ropped slightly/slowly/gradually/steadily/significantly/rapidly/dramatically/steeply/suddenly…from…year to…year/ between…year and…year.There was a very sudden/steep/rapid/dramatic/significant/sharp/steady gradual/slow/slight decrease /decline/reduction/fall/drop in the number of …from…year to…year/ between…year and…year.3.先上升后下降的句型:...... increased slowly during…… and …… but fell sharply in …….A steady increase in …… during …… and …… followed the sharp fall in …….4.先下降后上升的句型:…… fell before …… began to make a recovery ………… continue the recovery, climbing to ………… dropped during …… but increased again in ………… fell and then pick up during ………… collapsed before rising to ……at the end of ……5.波动There was a minor fluctuation between……remained fairly steady fluctuating between…and ……… fluctuated sharply all through ……6.稳定The number of …remained steady/stable from…year to…year/ between…year and…year.The number of…stayed the same from…year to…year/ between…year and…year.There was little change/hardly any change/no change in the number of…from…year to…year/ between…year and…year.… hardly changed through the period between ……and …3.结尾的常用表达As the report indicates…One of the most surprising finds was…Overall, the chart demonstrate that…From the diagram it can be safely concluded that…In conclusion, …In summary, we c an see that…I. 上图所示为某校大学生平均每周使用计算机的时间: 1990年(2 hours)、1995年(4 hours)、2002年(14 hours),请描述其变化;II. 请说明发生这些变化的原因(可从计算机的用途、价格或社会发展等方面加以说明);III. 你认为目前大学生在计算机使用中有什么困难或问题。
英语四级漫画式作文写作攻略
英语四级漫画式作文写作攻略近年来英语四级考试中作文多为漫画作文及图表作文,令很多考生猝不及防,顿时乱了阵脚。
本文拟从审题、布局和主体段的论证方法三个角度提出四级漫画作文的写作攻略,以帮助考生应对这种比较特殊的写作题型。
第一、读图审题四级漫画作文中的漫画通常反映一个社会现象或生活哲理,要求考生根据自己对漫画的理解来写作。
因此,要写好四级漫画作文,审题格外重要。
考生在下笔之前要仔细看漫画,弄清漫画的寓意,这是文章切题的保证。
此外,在本次四级考试的三道写作题中,Directions部分都给出了写作内容的大致方向,这也为考生把握漫画寓意提供了帮助。
下面就来逐一梳理2021年6月四级作文的三幅漫画及其传达的寓意。
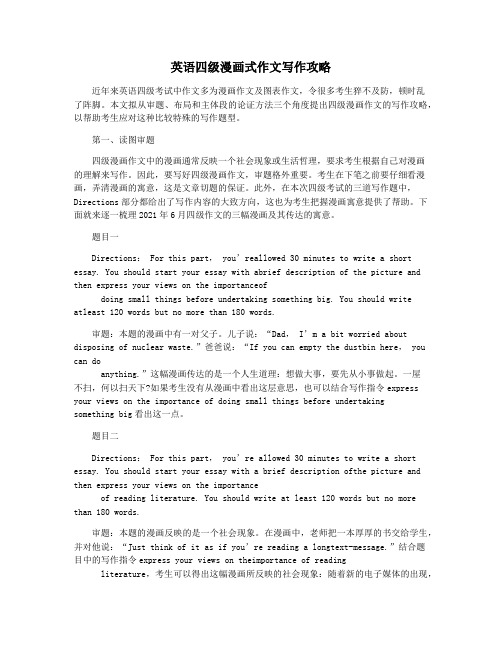
题目一Directions: For this part,you’reallowed 30 minute s to write a short essay. You should start your essay with abrief description of the picture and then express your views on the importanceofdoing small things before undertaking something big. You should write atleast 120 words but no more than 180 words.审题:本题的漫画中有一对父子。
儿子说:“Dad,I’m a bit worried about disposing of nuclear waste.”爸爸说:“If you can empty the dustbin here, you can doanything.”这幅漫画传达的是一个人生道理:想做大事,要先从小事做起。
一屋不扫,何以扫天下?如果考生没有从漫画中看出这层意思,也可以结合写作指令express your views on the importance of doing small things before undertakingsomething big看出这一点。
英语四级作文分项讲解-图表作文.docx

大学英语四级写作专项精讲常用的句型开头Recently, the problem of •…has aroused people's concern・最近,…问题已引起人们的关注.Nowadays, ________ has become a problem we have to face.如今,已成为我们不得不面对的问题了.It is commonly believed that... / It is a common belief that...人们一般认为…Many people insist that.・•很多人坚持认为…With the development of science and tech no logy, more and more people believe that...随着科技的发展,越来越多的人认为…A lot of people seem to think that...很多人似乎认为…引出不同观点:Peopled views on.・・ vary from person to person. Some hold that.…・ However,others believe that... •人们对…的观点因人而异•有些人认为..…然而其他人却认为.・.People may have different opinions on...人们对…可能会有不同的见解.Attitudes towards ____ vary from person to person.人们对待….的态度因人而异.There are different opinions among people as to...关于.…人们的观点大不相同.Different people hold different attitudes toward ____ .对..…人们的态度各不相同.结尾Taking all these factors into consideration, we naturally come to the conclusion that...把所有这些因素加以考虑,我们自然会得11!结论…Taking into account all these factors, we may reasonably come to the conclusion that… 考虑所有这些因素,我们可能会得ns合理的结论…Hence/Therefore, we'd better come to the conclusion that...因此,我们最好得出这样的结论…There is no doubt that ____ has its drawbacks as well as merits.毫无疑问,.....有优点也有缺点.All in all, we cannot live without... But at the same time we must try to find out new ways to cope with the problems that would arise.总之,我们没有…是无法生活的•但同时,我们必须寻求新的解决办法来对付可能出现的新问题.提出建议:It is high time that we put an end to the (trend).该是我们停止这一趋势的时候了.It is time to take the advice of •…and to put special emphasis on the improvement of... 该是采纳…的建议,并对…的进展给予特殊重视的时候了.There is no doubt that enough concern must be paid to the problem of …毫无疑问,对…问题应予以足够的重视.Obviously, If we want to do something..., it is essential that...显然,如果我们想做某事,很重要的是…Only in this way can we...只有这样,我们才能…It must be realized that...我们必须意识到…预示后果:Obviously, if we don't control the problem, the chances are that... will lead us in dange匚很明显,如果我们不能控制这一问题,很有可能我们会陷入危险.No doubt, unless we take effective measures, it is very likely that…毫无疑问,除非我们采取有效措施,很可能会…It is urgent that immediate measures should be taken to stop the situation.很紧迫的是,应立即采取措施阻止这一事态的发展.论证:From my point of view, it is more reasonable to support the first opinion rather than the second ・在我看來,支持第一种观点比支持第二种观点更有道理.I cannot entirely agree with the idea that...我无法完全同意这一观点•…Personally, I am standing on the side of ...就个人而言,我站在…的一边.I sincerely believe that...我真诚地相信…In my opinion, it is more advisable to do ... than to do....在我个人看來,做…比做…更明智.Fin ally, to speak frankly, there is also a more practical reason why ・.・给出原因:This phenomenon exists for a number of reasons. First,.…Second, ... Third, •…这一现象的存在是有许多原因的.首先,…第二,…第三,…Why did... ? For one thing... For another.... Perhaps the primary reason is...为什么会…?一个原因是…令一个原因是… 或许其主要原因是.…I quite agree with the statement that... the reasons are chiefly as follows.我十分赞同这一论述,即…,其主要原因如下:列出解决办法:Here are some suggestions for handling...这是如何处理某事的一些建议.The best way to solve the troubles is...解决这些麻烦的最好办法是…People have figured out many ways to solve this problem.人们己找出许多办法来解决这个问题.批判错误观点和做法:As far as something is concerned, ....就某事而言,…It was obvious that._ 很显然,•…It may be true that..., but it doesn^t mean that…可能…是对的,但这并不意味着…It is natural to believe that... , but we shouldn^ ignore that...认为….是很白然的,但我们不应忽视.…There is no evidence to suggest that… 没有证据表明…阐释图表:As is shown in the graph...如图所示...The graph shows/suggests/indicates/illustrates that... 图表显示…As can be seen from the table,...从表格中可以看出…From the chart, we know that...从这张表中,我们可知…All these data clearly prove the fact that...所有这些数据明显证明这一事实,即…The increase of .... In the city has reached to 20% ....... 在这个城市的增长已达到20%.In 1985, the number remained the same. 1985 年,这个数字保持不变.There was a gradual decline in 1989. 1989 年,出现了逐渐下降的情况.五、各类作文结构四级作文主要涉及两个方面:一是与学生学习、生活相关的话题;二是与人们生活息息相关以及有关社会发展变化的热点话题。
- 1、下载文档前请自行甄别文档内容的完整性,平台不提供额外的编辑、内容补充、找答案等附加服务。
- 2、"仅部分预览"的文档,不可在线预览部分如存在完整性等问题,可反馈申请退款(可完整预览的文档不适用该条件!)。
- 3、如文档侵犯您的权益,请联系客服反馈,我们会尽快为您处理(人工客服工作时间:9:00-18:30)。
四级图表作文讲解与训练一、图表作文的类型二、图表作文的出题形式三、图表作文的写作要领四、图表作文常用词汇与表达方式五、图表作文练习及其参考范文图表作文也是四(六)级考试中常见,而且被认为是一种较难的作文形式。
图表作文就是把非文字信息(通常为各种图表表示的数字信息等)转换成文字信息的一种作文。
它要求我们用文字来描述非文字性的图表或对图表显示的关系作解释说明。
下面我们先来看一看图表作文的类型。
第一节 图表作文的类型图表作文可分为两大类:表作文和图作文。
●图表作文表格(Table )可以使大量数据系统化,便于阅读、比较。
用表格表达的信息具体准确,而且表格中的各项均按一定规律排列。
阅读表格时要注意找出表格中各个项目的相互关系,表格中各个项目的变化规律。
●图作文图作文又可分为三种:圆形图作文、曲线图作文和条状图作文。
(1)圆形图作文圆形图(Pie chart)也称为饼状图或圆面分割图。
圆形图因为比较形象和直观,各部分空间大小差别容易分辨,所以常用来表示总量和各分量之间的百分比关系。
整个圆表示总量,楔形块表示分量。
有时圆形图还有数值表,两者结合可把各分量表示得更准确、清楚。
例如:(2)曲线图作文曲线图(Line graph)也称为线性图或坐标图。
曲线图最适合表示两个变量之间关系的发展过程和趋势。
一般来说,曲线所呈现的形状比某一点所代表的变量的值更有意义。
曲线图有横轴和纵轴。
一般先看横轴所代表的数量或时间等,然后再看纵轴所显示的意义。
同时必须找出线条所反映的最高或最低的变化。
例如:(3)条形图作文条形图(Bar graph)也称为立柱图或圆柱图。
条形图由宽度相同但长度不同的条块代表不同的量。
当要比较几个项目或量时,常用不同颜色来区分。
条形图主要用来表示:1)同一项目在不同时间的量;2)同一时间不同项目的量。
阅读条形图时,要先看图例,再看横轴、纵横各代表什么量,每一个刻度所代表的值是多少,最后找出图中各长条所表示的数据及各长条间的相互关系。
例如:第二节图表作文的出题形式我们先来看几个四(六)级考试中的图表作文的例子。
例11991年6月四级作文题Directions: For this part, you are allowed 30 minutes to write a composition of no less than 100 words on Changes in People's Diet. Study the following table carefully and your composition must be based on the information given in the table. Write three paragraphs to:1.state the changes in people's diet (饮食) in the past five years;2.give possible reasons for the changes3. draw your own conclusions.4. you should quote as few figures as possible.Kinds 1986 1987 1988 1989 1990 Grain 49% 47% 46.5% 45% 45% Milk 10% 11% 11% 12% 13% Meat 17% 20% 22.5% 23% 21% Fruit and Vegetable 24% 22% 20% 20% 21% Total 100% 100% 100% 100% 100%例2 2002 年6月四级作文题Directions: For this part, you are allowed thirty minutes to write a composition on the topic Student Use of Computers. You should write at least 120 words, and base your composition on the chart and the outline given below:1. 上图所示为1990年、1995年、2002年某校大学生使用计算机的情况,请描述其变化;2. 请说明发生这些变化的原因(可从计算机的用途、价格或社会发展等方面加以说明);3. 你认为目前大学生在计算机使用中有什么困20 __ 18 __16 __ 14 __12 __ 10 __8 __ 6 __4 __ 2 __ 1990 1995 2002Average number of hours a student spends on the computer per week难或问题。
例3:Car Accidents Declining in Walton City (1991年6月6级试题)Remember that your composition must be written according to the following outline;1. Rise and fall of the rate of car accidents as indicated by the graph;2. Possible reason(s) for the decline of car accidents in the city;3. Your predictions of what will happen this year. Your composition should be no less than 120 words and you should quote as few figures as possible.从以上例子可见,图表作文一般在题目中给出作文的标题和一个或几个统计表格、圆形图、曲线图或条形图,有时还用英文或中文提纲的形式给出提示,要求我们:1)用文字描述图表,客观解释图表中所传递的信息,并找出某种规律或趋势;2)就图表中所反映的某种趋势或问题分析其原因或后果。
第三节 图表作文的写作要领图表作文着重说明事实,常常是通过对图表中所反映的具体数据的说明、分析、比较,对某种事物或现象的事实或变化情况等加以说明,并提出结论或看法。
因此,图表作文常常采用议论文体的写作方法。
写好图表作文,关键在于能否读懂图表中所提供的信息,把握各信息间的联系,用准确流畅的语言把这一信息表达出来,并就这一信息发表自己的看法。
●图表作文的写作步骤写图表作文时,要注意遵循以下步骤:1)在写作图表作文时,首先要仔细观察并认真分析图表的含义,以及题中所给出的有关信息,比如,作文标题,英文提纲、英文提示、英语关键词等,弄清图表中所含的信息及不同信息间的关系;2)确定文章的主题思想,构思出文章的基本框架,筛选出能说明图表主题思想的典型数据;在分析图表时,要抓住与主题有关的信息,要发现数据呈现的规律,要充分利用图表中的图形、数据等来说明主题。
但是注意不要过多地引用数据3)编列文章的提纲;4)根据文章的提纲,将各段的提纲内容扩展成段落,然后将各个段落组成文章,注意段与段之间的衔接与过渡;5)检查与修改。
原则:A .关键是要写清楚。
B .不要罗列所有数据,找出主要点;要归纳总结;C. 概括一些内在关联性或原因推测作为总结第四节 图表作文常用词汇与表达方式●文章开头常用词汇1.图表类型:table 表格; chart 图表; diagram 图表或图解,示意图; graph 图表, 曲线图; column/ bar chart 柱状图; pie graph 饼图2. 描述:show; describe; illustrate; can be seen from; clear; appear; reveal 显示; represent 表现, 描绘3.内容:figure 数字; statistics [用作复] 统计数字[资料];number; percentage; proportion (the ~ of A to B) ● 表示数据上升:increase, rise, ascend, soar, surge (激增), go up, climb, mount, level up下降: decrease, fall, drop, descend, decline, reduce ,lessen, level down平稳: stable, steady, remain steady/stable; /maintain/keep/be the same as/similar to ; little/hardly any /no change波动: fluctuate, fluctuation, rise and fall, up and down占: occupy , take up , account for而: while, however, whereas , on the other hand 相比: by/in contrast, on the contrary, likewise, compared with 最高点: the highest, the top, the summit, the peak最低点: bottom, least, rock bottom 最低点例句:Prices have hit rock bottom. (价格已达最低水平。
)平均值: average趋势: tendency, trend, inclination预见: prediction比例:20 per cent , 20%one in three, 1/3one out of every four , 1/4有一个稳定的过程: a stable period can be seen◆ 表示变化程度的词:sudden/suddenly 突然的,意外的rapid/rapidly 迅速的,飞快的,险峻的 dramatic/dramatically 戏剧性的,生动的significant/significantly 有意义的,重大的,重要的 sharp/sharply 明显的,急剧的steep/steeply 急剧升降的steady/steadily 稳固的,坚定不移的 gradual/gradually 渐进的,逐渐的slow/slowly 缓慢的,不活跃的slight/slightly 轻微的、略微地stable/stably 稳定的◆ 表示程度:almost adv.几乎,差不多nearly adv.几乎,密切地approximately adv.近似的,大约just over 刚超过exactly adv.正确地,严密地precisely adv.正好 精确地;清晰地 ● 常用词和短语significant changes 图中一些较大变化 noticeable trend 明显趋势during the same period 在同一时期grow/grew 增长distribute 分布,区别unequally 不相等地pronounced 明显的,显著的average 平均no doubt 无疑地corresponding adj. 相应的represent vt. 阐述,表现overall 总体上讲in the case of 在…的情况下in/by contrast 相反,大不相同in conclusion adv. 最后,总之in comparison 相比之下inversely/reversely adv. 相反地,倒转地in general 通常,大体上,一般而言 range from…to 从…到…不等excessive adj. 过多的,过分的,额外 lower v. 降低,跌落elapse vi. (时间)过去,消逝 category n. 种类government policy 政府政策market forces 市场规律measure n. 尺寸,方法,措施 v.估量,调节 forecast n. 先见,预见 v. 预见 表示程度的副词:1)程度较大:considerably;dramatically;greatly; markedly;obvious ly; quickly;rapidly; sharply; significantly;suddenly2)程度较小:slightly ;gradually ;slowly ;steadily●常用句型与例句句型1:As is shown by the graph/in the tabl e …(概述图表时用)例句:As is shown by the graph, there has been a rapid increase in the population of the country in the past five years. (正如曲线所示,最近5年来该国人口飞速增长。