超声相控阵检测教材-填充焊缝操作说明
HS620焊缝超声检测操作程序

HS620超声数字仪焊缝超声检测操作程序1、检测对象和检测条件试件编号:U1XXXX 厚度:XXmm仪器型号:HS620 探头型号:2.5Pxx×xxK2试块:CSKⅠA、CSKⅢA 灵敏度:φ1×6-xxdB2、操作程序⑴、开机:按“ON/OFF”键2秒,直至电源指示灯亮。
⑵、选择通道:按“通道”,再按键,选择任意斜探头通道。
⑶、调节扫描速度和零点:①、按“自动调校”键,进入自动校准功能。
②、将探头放置在CSK-ⅠA试块上,对准R50和R100的弧面,如图:③、前后移动探头找出R100弧面反射回波,若R100弧面反射回波高度超过示波屏高度100%,按“自动增益”键使之降低到示波屏高度80%。
如图:④、按”波峰记忆”键记录最高回波,移动探头使R100圆弧回波最大。
向R50弧面平移探头,使R50圆弧回波达到示波屏高度的20%以上,然后按“确认”。
此时仪器将自动调校,直到R50和R100的反射波分别与50mm和100mm对齐,仪器校准结束,并自动弹出提示:“自动校准完毕!”“请拿钢尺测量前沿0.0 mm”⑷、测量探头前沿距离:①、固定探头不动,用直尺量出探头前端到R100圆弧面端头的距离X,如图:②、前沿距离L0=100-X。
按输入前沿,按“确认”,仪器将自动将前沿值存入参数中。
“入射点校准完毕!”仪器下方提示“是否重校?”按“确认”键重校,按其它任意键不重校。
⑸、测量探头K值:①、自动校准完毕按K值对应的三角键进入K值测试。
②、将探头放置在CSK-ⅠA试块上,对准φ50mm圆孔,移动探头使φ50圆弧反射波最大。
(若回波低于20%高度或超出屏幕,按“自动增益”将波形调整到80%高度。
③、按“闸口移位”下方的键,再按键移动闸门锁定回波,按“确认”,仪器下方显示所测K值。
按“确认”键K值测试完毕,仪器底部显示“是否重校?”,按“确认”键可重新校准K值,按其它键退出!⑹、制作距离波幅曲线:①、按“曲线”,再按制作下方的,仪器出现提示:“请使用闸门锁定测试点!”屏幕右上角出现“测试点01”,并闪烁,如图:②、将探头放置在CSK-ⅢA试块上,对准10mm深的ф1×6孔,移动探头。
超声相控阵检测教材-第七章-ISONIC相控阵操作说明

ISONIC相控阵设备操作指南焊缝高级检测软件功能一、进入检测界面1、根据所使用的仪器进入相控阵检测模式,在相控阵界面下点击,见图1所示。
图12、点击进入选项模式,见图2所示。
图23、点击进入焊缝检测模式。
见图3所示。
图34、相控阵探头选择根据检测选用的相控阵探头选择相应的探头型号,如图4所示,图4右上角所显示的即为探头楔块及探头的参数。
如果在“选择探头”的下拉选项中无检测所用的探头型号,则点击手动输入探头及楔块的参数进行保存。
然后点击。
图45、点击进入相控阵扇形扫描参数设置界面,如图5所示。
图5二、检测参数设置:1、基础参数设置:●增益:根据检测对象所需的检测灵敏度进行设置。
●声程:根据检测对象设置声程范围。
●声速:设置为横波声速(例如:钢中横波声速为3230m/s)。
●显示延迟:就是常说的“零偏”设置。
点击(如图6所示),通过点击左键或右键,将“表面补偿”设置为激活状态(如图7、图8所示),点击,仪器将自动校准“零偏”。
自动校准后的显示延迟将会自动修正为探头延迟,如图6所示。
注:此处“表面补偿”为调节检测参数时所选用的入射角度(“激发设置”中所选取的调节检测参数的入射角度)在探头楔块中传播的延时,及探头延时,仪器自动校准“表面补偿”,即零偏后,显示延迟与“测量参数”中的探头延迟相同。
“测量参数”中的探头延迟,当选定入射角度后,仪器自动计算生成,所以是不可修改的,调节的左键右键为灰色图标。
如图9、图10所示。
本次示例选择的入射角度为55°,探头延时为13.45us。
图6图7图8图9图10●抑制:设置为0%2、激发参数设置:●增益:根据检测对象所需的检测灵敏度进行设置。
●激发模式:设置为单晶。
●脉冲宽度:主要用于优化脉冲回波信号。
初始设置为探头频率周期的一半,将探头置于放置在被检工件或标准试块上,根据脉冲回波的信号质量,点击左键或右键进行微调。
如图11所示。
注:调节依据准则为:脉冲回波信号脉宽最窄且相对回波高度最高。
【特种设备高级考试】焊缝超声检测实操讲解
焊缝超声波检测实操讲解李杰天津石化压力容器检验研究中心焊缝超声波检测的过程:一.检测准备二.仪器的调整三.声能传输损耗差的测定四.检测面的准备五.工件的扫查六.缺陷的评定七.非缺陷回波的辨别八.记录与报告一.检测准备检测前应认真阅读工艺卡,熟悉检测工作情况。
包括:⑴检测对象: 规格尺寸、材料牌号、焊接方法、坡口形式、表面状态等;⑵检测技术要求: 检测标准、检测技术等级、检测比例、检测部位、验收标准、合格级别等;一.检测准备⑶检测设备与材料: 仪器型号、探头规格参数、试块种类、耦合剂等;⑷检测工艺参数: 检测方法、仪器时基线比例、检测灵敏度、检测面、表面补偿等;⑸检测环境: 安全、检测空间、亮度等。
二.仪器的调整1.调整步骤2.调整方法二.仪器的调整 1.调整步骤(1)距离校准(2)探头测试(3)制作距离-波幅曲线(4)确定探伤灵敏度(5)确定检测范围(6)校验距离-波幅曲线二.仪器的调整(1).距离校准(扫描速度调节)距离校准分为声程、水平、深度三种调节方法:二.仪器的调整(1)距离校准1)声程调节法将探头置于CSK-ⅠA试块上,扫查R100圆弧,找到最高反射回波,向R50圆弧侧平移探头,在R100圆弧反射回波前出现R50圆弧反射回波。
调节仪器使R50圆弧反射回波对准50,R100圆弧反射回波对准100,时基线按声程距离1:1调整完成。
LSH½,L2=K100/(1+K2)½平距离L1、L2。
调节准L1,R100圆弧反射回整完成。
½,L2=100/(1+K2)½计距离L1、L2。
调节仪L1,R100圆弧反射回整完成。
二.仪器的调整(1)距离校准以上方法也可用其它类型试块完成,只是上述计算式中的半径不同。
数字式超声波探伤仪在调整好扫描速度后,在三种方法间可以互换,扫描比例可随时(任意)调整。
二.仪器的调整2.调整方法(2)探头测试1)前沿校准探头置于CSK-ⅠA试块上,对准R100mm圆弧面,平行移动探头,找到最高回波,这时试块上R100mm圆心正对的楔块底面上的点就是入射点,用尺量出试块最前端到探头前端的距离,用100减掉此距离得到的差值既为探头前沿。
相控阵检测环焊缝操作流程

相控阵检测环焊缝操作流程下载温馨提示:该文档是我店铺精心编制而成,希望大家下载以后,能够帮助大家解决实际的问题。
文档下载后可定制随意修改,请根据实际需要进行相应的调整和使用,谢谢!并且,本店铺为大家提供各种各样类型的实用资料,如教育随笔、日记赏析、句子摘抄、古诗大全、经典美文、话题作文、工作总结、词语解析、文案摘录、其他资料等等,如想了解不同资料格式和写法,敬请关注!Download tips: This document is carefully compiled by theeditor. I hope that after you download them,they can help yousolve practical problems. The document can be customized andmodified after downloading,please adjust and use it according toactual needs, thank you!In addition, our shop provides you with various types ofpractical materials,such as educational essays, diaryappreciation,sentence excerpts,ancient poems,classic articles,topic composition,work summary,word parsing,copy excerpts,other materials and so on,want to know different data formats andwriting methods,please pay attention!相控阵检测环焊缝操作流程如下:1. 检测前准备确定检测区域和检测要求,包括焊缝类型、尺寸、材质等。
手动相控阵超声波焊接技术的说明书

Manual Phased Array Ultrasonic Techniquefor Weld ApplicationS. AnandamuruganGE Inspection Technologies, JFWTC, Bangalore, IndiaAbstractConventional ultrasonic technique has been used as a technique for weld inspection since 1960’s. In the early 1990’s the concept of phased array ultrasonic inspection started being applied for industrial applications. This paper deals with the manual phased array inspection of welds and how it helps in improving productivity and probability of detection in weld applications. Manual phased array technique can interpret the weld specimen with the imaging of B-Scan, S-scan and C-scan. The impact of weld overlay, origin line and leg line on the phased array image will help the inspector in ease of interpretation of defects and in the analysis of the nature of weld defects like toe crack, root crack, side wall lack of fusion, incomplete root penetration etc., It also helps in identifying the location of weld defects with great precision. This paper discusses in detail, the use of manual phased array technique for weld applications, procedure for sector scanning of welds and the results obtained.Keywords: Phased Array, Ultrasound, Ultrasonic, Inspection, Weld, Testing, Sector Scan1.IntroductionIn the field of ultrasonic testing A-scan signal acquisition is the basis for flaw detection and interpretation. The A-scan signal is used as the raw data for the imaging of volumetric inspection called B-scan and C-Scan. But it needs mechanical scanning systems to acquire the A-scan data at multiple locations. The B-Scan and C-scan in industrial applications are mostly implemented in the automated ultrasonic inspections. With the recent improvement in the technology and software the portable instruments are upgraded with imaging facility which can be used for the manual inspection.Phased Array ultrasound is used in medical systems for the imaging of human tissues. This technology has been transferred to industrial application but the technique followed in medical systems cannot be transferred as it is, because of the wide range of materials used in industrial application. Hence the complexity of implementing the phased ultrasonic testing is higher for the industrial applications. In the earlier days phased array ultrasonic testing was implemented in automated ultrasonic inspection system. After successful outcome of automated phased array ultrasonic inspection the technology has been migrated to manual phased array inspection.Usage of phased array probes lead to drastic change by reducing the number of probes and inspection time rapidly. The multiple focusing and beam steering capability of phased array probes increases:Overall sensitivityProbability of detectionCoverage of bigger volume at single position of probe 2.Manual Phased Array TechniqueThe usage of manual phased array inspection will be more helpful for the inspectors who does manual weld inspection with conventional A-scan ultrasonic testing. Because manual phased array inspection would be more user friendly than automated UT. The mode of scanning is as same as conventional A-scan, hence this would help the field inspectors to transit from conventional A-scan to phased array imaging in the conventional manner. Manual phased array inspection has relatively lesser mechanical investment cost than automated ultrasonic testing and avoids the mechanical complexity of automated ultrasonic testing.2.1Phased Array ImagingFor generating phased array ultrasound, composite piezo-electric elements are wired with the electronic circuit. Each and every element is configured by the software algorithm called delay law or focal laws. The delay law will define the time delay for each element according to the beam steering and beam focusing. The set of A-scan data is processed as a image to form the S-scan and angle corrected B-scan.Phased array ultrasound can steer the beam from -89° to 89° and focus the beams at different depths. The phased array ultrasound is categorized into two types: i) Linear Scan and ii) Sector Scan. Linear scan is the movement of beam according to the element step with the fixed beam angle. Sector scan is the steering of angle with multiple beams with the fixed virtual probe (i.e., set of elements grouped together to form the virtual probe aperture). So without moving the probe, we can configure the scan plan such that the distance282Proceedings of the National Seminar & Exhibitionon Non-Destructive EvaluationNDE 2009, December 10-12, 2009 Moreinfoaboutthisarticle:https://www.ndt.net/id=9863between the element start and element stop is covering the volumetric distance with beam steering. The representation of linear scan and sector scan image on side drilled hole (SDH) is shown in the Figs. 2.1 and 2.2.The phased array ultrasonic images are captured using the GEIT portable phased array ultrasonic instrument called Phasor XS and the Phasor XS post analysis software called Rhythm UT viewer. This paper describes about the weld inspection using sector scan. Section 2.2 and 2.3 describes the significance and advantages of sector scan.2.2Beam CoveragePhased array sector scan will cover the wide range of volume from single point. By placing the probe at a singlepoint , wider volume of part will be covered. Hence the productivity of phased array ultrasonic inspection is relatively higher than manual conventional ultrasonic testing. The side drilled holes located at different depth and at different horizontal offset is capture from a single probe position is shown in the Fig. 2.4.2.3Beam FocusingBy focusing a sound beam we can achieve a higher sensitivity and resolution. The term “focus” is a concentration of the beam to a size of focal point diameter.In phased array we can define the focal depth according to the area of interest. Hence the sensitivity and resolution of the inspection will be increased. Figures 2.6 and 2.7 depicts283NDE 2009, December 10-12,2009Fig. 2.1:Linear Scan on SDH & Image Fig. 2.2:Sector scan image on SDH & ImageFig. 2.3:AL block for angle beam calibrationFig. 2.4:Sector scan image on SDHFig. 2.5:Sensitivity Cal Block Fig. 2.7:Focused sectorFig. 2.6:Unfocused sector284Anandamurugan : Proceedings of the National Seminar & Exhibition on Non-Destructive Evaluationthe sensitivity and resolution of SDH at various focal depth.The sensitivity and the resolution of the side drilled hole at 30 mm is highest at the focal depth = 60 mm.3.Scan Setup for Weld InspectionIn conventional ultrasonic testing generally we use the probe with the angle of 30°, 45°, 60° and 70° as a standard UT probes. Based on the weld geometry the ½ skip and full skip distance will be marked on part. Inspector move the probe between ½ skip to full skip distance in the raster scan format.In manual phased array ultrasonic testing the probe has to be mounted on the prefixed angular wedge, hence it transmits shear wave inside the material for weld inspection.The ultrasonic beam can be steered from 35° to 80° for the entire weld coverage. Based on the weld geometry the scan plan has to be configured in the phased array instrument.The coverage of weld can be assured with the software tool called ray tracing.The scan plan has to be defined in such a manner that the optimum distance has to be calculated from the weld centre line (WCL) to the wedge front. With the fixed optimum distance the scan plan has to be designed on the ray tracing tool such that the lower angle hits at the top edge of heat affected zone (HAZ) with the full skip. Each beam will be steered at different angle and hit at the different depth of the weld specimen.By keeping the probe with reference to optimum distance moving the probe with line scanning will cover the entire weld. Hence it improves the scanning speed when compare to conventional A-scan inspection by line scanning instead of doing raster scanning. Based on the scan plan, the parameters of part, probe and scanning pattern has to be configured in the instrument. The weld dimensions has to be configured as weld overlay. The weld overlay will draw the profile of the weld on the sector image. This will be useful for the inspector to spot the weld location immediately, whenthere is a defect indication. Origin line will be used to locate the weld centre line. The leg lines and measurements will make the user to easily the interpret the depth of defect from the scanning surface and horizontal location of the defect from weld centre line. The advantage of sector scan inspection of weld is the scanning speed and easier differentiation of weld defects from the root and the weld cap. Whenever the defect occurs the user has to spot the location and evaluate the defect.3.1Procedure for Manual Phased Array Inspection of WeldsChoose the probe frequency based on the thickness of the weldThe probe should be positioned such that the angle start should hit the overcap heat affected zone at full skip and the angle stop should hit at the root of the weld. If the angle hitting at root of the weld is greater than 60° then weld has to inspected with additional line scanning at new probe position. Probe should be positioned such that the angle hitting at root is lesser than 60.Fix the optimum distance between the weld centre line and wedge front by using ray tracing tool or mathematical calculation.Set up the scan plan by fixing the angle start and angle stop to cover the entire weldPlot time corrected gain (TCG) by using reference block of same material and same thickness with the artificially induced defects (SDH) at ¼th, ½th and ¾ th of depth from scan surface.Draw the optimum line from weld centre line on the weld to be scannedPlace the probe on the weld specimen and move the probe on straight line to scanThe weld should be scanned on both left and right sidefrom weld centre lineFig. 3.1:Raster Scanning Fig. 3.2:Sector scan setup ig 3.3: Line ScanningFig. 3.4:PL 11414Fig. 3.6:PL 11416Fig. 3.5:PL 11415285NDE 2009, December 10-12, 2009Mark the region where the indication comes on sector scan image and analyze the region with conventional A-scan by 6 dB or 20 dB drop method to find the length of the defect3.2Equipments Used16x64 Phasor XS with top view enabledGEIT 16 element linear flat 4 MHz probe – 115-500-015 GEIT shear wave wedge – 115-350-024Aluminum test block for depicting defects in sector scanCarbon steel reference block with SDH4.Interpretation of DefectsThis section depicts the representation of different type of weld defects on sector scan. The material depth and surface projection measurement will ease the user to spot the location of the scan. PPA – Minimum surface projection distance of all beamsthat are currently captured by Gate A PDA – Minimum material depth of all beams in scan thatcurrently captured by Gate A 4.1Weld PL 11414 – Centre Line CrackTable 1:Weld SpecimenWeld Serial Manufacturer Weld Type Weld Material Weld ThicknessLength Number PL 11414Sonaspection Single V Carbon Steel 6 mm 300 mm PL 11415Sonaspection Single V Carbon Steel 12 mm 300 mm PL 11416SonaspectionSingle VCarbon Steel25 mm300 mmTable 2:Scan Setup for Weld SpecimenPL 11414PL 11415PL 11416Scan Type Sector Sector Sector Angle Start 50°40°35°Angle Step 1°1°1°Angle Stop75°75°70°Distance: WCL to Wedge Front9 mm20 mm40 mmFig. 4.2:Scan setup of weld 11414Fig. 4.1:Centre line crack indication [Phasor XS screenshot]PPA = -0.59 mm shows that the defect is located at 0.59mm from weld centre line towards the scan side.PDA = 4.31mm shows that the defect is located at the depth of 4.31 mm from scan surface.4.2Weld PL 11414 – Incomplete Root PenetrationPPA = -0.34 mm shows that defect is located at 0.34 mmfrom weld centre linePDA = 5.11 mm shows that defect is located at depth of 5.11 mm from scan surfaceFig. 4.4:Scan setup of weld 11414Fig. 4.3:Incomplete Root Penetration Indication [Phasor XSScreenshot]286Anandamurugan : Proceedings of the National Seminar & Exhibition on Non-Destructive Evaluation4.3Weld PL 11414 – Lack of Root Fusion 4.5Weld PL 11415 – Side Wall Lack of FusionPPA = 1.20 mm shows that defect is located at 1.20 mm from weld centre linePDA = 5.63 mm shows that the defect is located at the depth of 5.63 mm from scan surface (i.e., Root of the weld)4.4Weld PL 11415 –Toe CrackFig. 4.5:Lack of root fusion indication [Phasor XS screenshot]PPA = -7.44 mm shows that defect is located at 7.44 mm from weld centre linePDA = 0.18 mm shows that the defect is located at the depth of 0.18 mm from scan surface (which is the cap of the weld)Fig. 4.6:Scan setup of weld 11414Fig. 4.8:Scan setup of weld 11415Fig. 4.7:Toe crack indication [Phasor XS screenshot] PPA = -7.53 mm shows that the defect is horizontally located at 7.53 mm from weld centre linePDA = 2.15 mm shows that the defect is located at thedepth of 2.15 mm from scan surfaceFig. 4.10:Scan setup of weld 11415Fig. 4.9:Side wall lack of fusion indication [Phasor XSscreenshot]4.6 Weld PL 11416 – Root CrackPPA = 2.31 mm shows that defect is located at 2.31 mm from weld centre linePDA = 22.06 mm shows that the defect is located at the depth of 22.06 mm from scan surface (i.e., Root of the weld)Fig. 4.11:Root crack indication [Phasor XS screenshot]Fig. 4.12:Scan setup of weld 11416287NDE 2009, December 10-12, 20094.7. Weld PL 11416 – Side Wall Lack of FusionPPA = -10.23 mm shows that defect is located at 10.23mm from weld centre linePDA = 10.43 mm shows that the defect is located at 10.43 mm from scan surface4.8. Representation of weld 11416 and its C-scanThe given below Fig. 4.15 shows the schematic representation of weld plate specimen 11416. The plate has 3 defects as shown in the Fig. 4.15 Defect 1 – Root Crack Defect 2 – Side Wall Lack of Fusion Defect 3 – PorosityFig. 4.13:Side wall lack of fusion indication [Phasor XSscreenshot]Fig. 4.14:Scan setup of weld 11416With the sector scan of 35 degree to 70 degrees: Defect 1 has been capture with the scanning on left sideof weld centre line Defect 2 has been captured with the scanning on rightside of weld centre line Defect 3 has to be captured by normal beam inspectionon weld overcap using 0 degree linear scan For the volumetric inspection data encoded top view can be done. The uncorrected top view is plotted as beam index versus scan index. The encoder movement is plotted as abscissa and the beam index is plotted as ordinate. Phasor XS captures the gate A and gate B data and it will be plotted as beam index versus scan index based on the Amplitude or Time of Flight for color mapping. Figure 4.23 shows the top view of weld scan on left side of the weld centre line. Side wall lack of fusion starts from 140 mm in the top view. Figure 4.24 shows the top view of weld scan on right side of the weld centre line. Root crack starts from 22 mm to 40 mm in the top view.5.Codes and Standards for Phased ArrayInspectionCodes and standards are evolving for the industrial phased array ultrasonic inspection. the existing codes and standards for phased array ultrasonic inspectionASTM E2491-06 – “Standard guide for evaluatingcharacteristics of phased array ultrasonic examination instruments and Systems”ASTM E2700-09 – “Standard Practice for Contact Ultrasonic Testing of Welds Using Phased Arrays”ASME Code Case 2235-9 - “Use of Ultrasonic Examination in Lieu of Radiography”Fig. 4.15:Representation of weld 11416288Anandamurugan : Proceedings of the National Seminar & Exhibition on Non-Destructive Evaluationcenter line will make the inspector to easily mark the defect location from post analysis, which assists for decision making. The GEIT software suite called Rhythm UT can be used for the post analysis of Phasor XS data and defect sizing, dimensioning of defects and advance reporting of the weld scanning. With the advancement in software technologies and imaging capabilities the entire inspection is upgraded with the ease of use and increase in productivity and probability of detection.7.AcknowledgementTed Ballenger, Phased Array Product Manager (Retired),GE Inspection Technologies, Lewistown, United States Jerome POIRIER, Senior Application Leader / Engineering Team, GE Inspection Technologies, Limonest, FranceMT Shyamsunder, Principal Scientist, WTC Material Systems Technologies, GE Global Research Centre,Bangalore, IndiaSmita Taneja, CoE Manager, GE Inspection Technologies,Bangalore, IndiaReferences1.Michael BERKE and Johannes BUECHLER, Practical Experiences in Manual Phased Array Inspections, 17th World conference on Non Destructive Testing, (25-28 oct 2008),Shanghai, China2.Jerome POIRIER and Robert WARD, Qualification of Manual Phased Array Ultrasonic Technique for Pipe Weld Inspections in Nuclear Power Plant, 17th World conference on Non Destructive Testing, (25-28 oct 2008), Shanghai, China3.ASTM E2491-06 – Standard guide for evaluating characteristics of phased array ultrasonic examination instruments and Systems4.ASME Code Case 2235-9 – Use of ultrasonic examination in lieu of radiography.5.Krautkramer J and Krautkramer Hf, Ultrasonic Testing of Materials, 4th fully revised edition, (2003)6.Phasor XS user manual,Revision 7, (2008)ASME Code Case 2558 – “Case of ASME Boiler Pressure V essel Code. Use of Manual Phased Array E-scan Ultrasonic Examination per Article 4 Section V”6.ConclusionWith the manual phased array inspection on weld we can save more time with line scanning than raster scanning,henceforth the productivity can be increased. The defect oriented at any angle can be easily detected and represented in the image with the electronic steering capability, henceforth the probability of detection is increased. With the advancement in software to draw the weld overlay on the image; the depth measurements with respect to scanning surface and the surface measurement with respect to weldFig. 4.17:Top view of weld 11416 Rhythm UT screenshotFig. 4.16:Top view of weld 11416 Rhythm UT screenshot。
相控阵焊缝检测操作规程
焊缝相控阵超声检测操作规程1、插好CF卡,开机,选择进入omniscan系统2、参数设置➢进入向导菜单在组菜单中,设置工件形状/尺寸/材质;设置探头参数,对于RD探头,可以选择自动探测;设置楔块,选择和探头相应型号。
在聚焦法则菜单中,选择扇扫/线扫;选择波形;选择晶片数量和第一晶片编号(晶片数量一般选择16,为减少杂波,第一晶片一般从中间编号开始选取);设置角度,一般初步设置偏转角度为38~70°,选择聚焦深度,一次波探伤时,聚焦深度设定为焊缝深度,二次波探伤时,聚焦深度设定为两倍焊缝深度(常规超声检测小径管会用到三次波,相控阵探伤最多用到二次波,如用到三次波,则横波与纵波发生波型转换,波束较多较乱,可能产生伪缺陷);生成聚焦法则。
➢进入UT菜单脉冲发生器选择脉冲回波模式,电压选择与能量有关,板厚大于十几mm的选择80V 高电压;接收器滤波器选择和探头中心频率相同频率滤波,检波选择全检波,视频滤波器开启。
➢进入显示菜单在覆盖菜单中,选择光标开启,覆盖开启。
3、确定扫查轴➢用端角回波法确定探头前沿:将探头置于工件端角,找到一次底面波和一次上表面波,测量探头前沿距工件边缘距离d,保证距离d大于焊缝宽度的一半(为防止探头放置到楔块上),在距焊缝中心d位置画出扫查轴。
➢根据扫描图形,精确调整扫查角度和扫查范围:扫查起始范围小于壁厚一半,最大范围小于三倍壁厚;返回聚焦法则菜单,精确调整扫查角度。
4、校准灵敏度➢返回向导菜单,进入校准菜单,类型选择超声,模式选择灵敏度,参考波幅缺省设置80%,误差缺省设置5,可以自行更改。
➢找到标定孔回波,用闸门锁定回波;移动探头(探头移动过程中保证中心波束对准标准孔),调整增益和补偿增益,得到覆盖所有角度的平滑包络线,按校准键校准,确定校准。
薄板衰减小,只需要进行灵敏度校准;厚板(大于40mm)检测需要做TCG曲线进行深度能量补偿。
5、扫查和分析➢表面补偿3~8dB,沿扫查轴扫查焊缝,按冻结键保存疑似回波;➢缺陷定位:进入向导菜单,在测量菜单中选择S扫,利用飞梭将角度线调至缺陷图像上,在A扫窗口显示缺陷波形,移动红色参考线和绿色定位线进行位置测量。
反应堆压力容器厚壁焊缝的相控阵超声检测
核电厂的反应堆压力容器(RPV)属放射性介质的第二道防线,用来包容和固定反应堆堆芯和堆内构件,全寿期均工作在高温、高压、高辐照等极端复杂条件下,是保障核电厂安全运行的重要设备。
核电厂在役检查规范和检查大纲中,RPV焊缝的超声检测是强制性要求,其检测结果是评定RPV结构完整性,进而评估核电设备运行寿命的重要依据。
目前国内通常采用常规超声检测技术进行RPV焊缝检测,该技术需采用多达上百个探头进行组合检测。
前期准备工作(参数设置、探头标定、探头校准等)和现场实施过程(探头安装、更换等)所需时间达到整条焊缝检测总工作量的30%以上,同时大幅度增加了人员受辐照时间和异物引入风险。
随着材料、微加工、电子和计算机技术的飞速发展,相控阵(PA)超声检测技术逐渐广泛应用在无损检测领域,PA超声检测技术在缩短作业人员受辐照时间、提高检测效率、提高检测稳定性等方面具有明显的优势,应用前景巨大。
检测对象RPV筒体对接焊缝(图1中①②)的基体材料通常为6MnD5或SA508-3低合金钢,焊接方式为埋弧自动焊,填充形式为多层多道焊,坡口形式为U形坡口,焊缝厚度常为130~260 mm,如图2所示,同时考虑到耐腐蚀、耐辐照的特殊要求,内壁有约7 mm厚的不锈钢堆焊层。
如何在减少盲区的同时具备足够的穿透力,实现近表面缺陷和远程缺陷的超声检测能力,是RPV超声检测技术的关键。
图1 RPV筒体对接焊缝结构示意图2 RPV筒体对接焊缝坡口结构示意技术分析常规超声检测常规RPV筒体对接焊缝的超声检测工艺通常采用多种探头组合的检测方式,缺陷探测和尺寸定量分别进行。
由于其需采用多个常规超声探头进行组合扫查,故其操作灵活度较差、检测工作量大、零散部件易损坏掉落;尤其是在发现不同深度的超标显示时,需要更换不同聚焦深度的定量探头进行分层检测,极大降低了检测工作的安全性、稳定性和效率性。
相控阵超声检测与常规超声探头采用一个压电晶片产生超声波不同,相控阵超声检测技术基于惠更斯原理,其探头由多个小的压电晶片按照一定序列组成,通过电子控制,按照预定的规则和时序激发部分或全部晶片,能实现各波阵面叠加,达到声束聚焦、声束偏转、声束位移等效果。
【优质文档】超声相控阵检测教材ISONIC相控阵操作说明

块及探头的参数。如果在“选择探头”的下拉选项中无检测所用的探头型号,则点击
手动输
入探头及楔块的参数进行保存。然后点击
。
图4
5、点击
进入相控阵扇形扫描参数设置界面,如图 5 所示。
图5
二、 检测参数设置:
1、基础参数设置:
增益: 根据检测对象所需的检测灵敏度进行设置。 声程: 根据检测对象设置声程范围。 声速: 设置为横波声速(例如:钢中横波声速为 3230m/s)。
显示延迟: 就是常说的“零偏”设置。点击
(如图 6 所示),通过点击左键
或
右键
,将“表面补偿”设置为激活状态(如图 7、图 8 所示),点击
,
ቤተ መጻሕፍቲ ባይዱ
仪器将自动校准“零偏” 。自动校准后的显示延迟将会自动修正为探头延迟,如图 6 所示。
注:
此处“表面补偿”为调节检测参数时所选用的入射角度( “激发设置”中所选取的调
节检测参数的入射角度)在探头楔块中传播的延时,及探头延时,仪器自动校准“表面补
偿”,即零偏后,显示延迟与“测量参数”中的探头延迟相同。
“测量参数”中的探头延
迟,当选定入射角度后,仪器自动计算生成,所以是不可修改的,调节的左键右键为灰色
图标。如图 9、图 10 所示。
本次示例选择的入射角度为 55°,探头延时为 13.45us 。
最大声程 = 工件厚度 /cos (检测所有到的最大入射角度) 3、接收参数设置:
增益: 根据检测对象所需的检测灵敏度进行设置。
滤波器:主要用于优化脉冲回波信号,提高信噪比 。设置为
的状态。
如图 12 所示。 低通滤波: 初始设置为探头中心频率的 0.5 倍,将探头置于放置在被检工件或标准试块
对接焊缝中超声相控阵的检测
Abstract: In the paper, butt welds with varies of defects tested by new technology of ultrasonic phased array was discussed. Through calculating ultrasonic phased array probe position and choosing the detecting parameter such as beam angle, focal distance, focus size and focus length and so on to calibrate the instrument. And then the butt weld sample was tested by the instrument. The experiment results and its analyses showed the detecting ability of ultrasonic phased array was powerful and could detect difference kind of flaw. The detecting results could be shown visually. The experiment results also provided the good references for detecting defects in welds.
38.03
3
100 % 2 1
53.00
位置 1
15.62 5
62 % 03
4
56.00
55
50
50
位置 2
焊缝超声波实操步骤47013
焊缝实操步骤一、开机:长按‘电源'键,按两次‘确定'键,按'1'选择模拟探伤模式。
二、初始化仪器按‘功能'键,按’9'确认。
三、调试1、测零点前沿、K值将斜探头放在CSKTA试块上,按‘范围'键调整声程,查找RIoO的回波并移动探头找到最高回波。
此时用钢尺量出探头最前端至100mm弧顶的距离L,前沿=100-L。
将斜探头放在CSKTA试块上移动,查找①50孔的最高回波。
此时量出探头至试块边的距离a,K=(a+前沿-35)/30O2、调整扫描比例:将斜探头放在CSK-IIA-I试块上,找到深度20mm的最高回波并衰减到屏幕的80%o 按'范围'键,把20mm的回波移动到屏幕的第2格,这时移动探头找到深度40mm的最高回波并衰减到屏幕的80%并留意观看此时波与屏幕的第4格相差多少距离,按‘范围'键,将40mm回波移动到第4格之后的相同距离,按‘移位'键,再把40mm回波移动到第4格处,这时重新找到20mm的最高回波,看是否处于第2格,若不在则重复步骤,直到20mm处于屏幕的其次格且40mm处于屏幕的第4格,此时深度1:1调好。
3、制作面板曲线:将斜探头放在CSK-HAT试块上,查找IOmm深孔的最高回波,按‘衰减'键调整使回波达到80%,按'曲线/调校',按‘确定'键开头制作。
按'键锁定回波,按‘确定'键完成第一点制作;按上述步骤依次采定测试点(2OmiIb30mm,40mm,50mm……)各点采集完成后按‘确定'完成曲线并存储数据,面板曲线生成。
设测得:前沿L=12mm,板厚T=24mm,探头K=2。
(10-48,20-58,30-88,40~98,50-118mm)o (1)做出面板曲线,假设母线为56dB,则判废线为:母线-4-4=48dB,定量线为:母线-12-4=40dB,评定线为:母线-18-4=34dB;(2)通过仪器衰减按钮,衰减16dB到40dB,此时为定量线灵敏度,把定量线灵敏度定为扫查灵敏度,锯齿形扫查钢板;(3)发觉缺陷后,若缺陷波超群出显示屏,通过衰减按钮使缺陷波高降低到屏幕的80%;(4)左右移动探头找出最大波高,读出水平显示,若为27,因27大于板厚,则缺陷深度为2T-27=2x24-27=21,即“缺陷距焊缝表面深度mm”:21。
焊缝超声波探伤(第二节平板对接焊缝的超声波探伤方法)
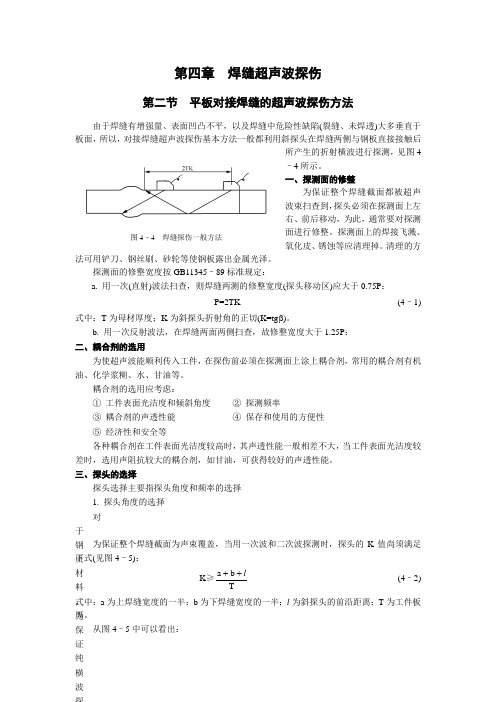
第四章 焊缝超声波探伤第二节 平板对接焊缝的超声波探伤方法由于焊缝有增强量、表面凹凸不平,以及焊缝中危险性缺陷(裂缝、未焊透)大多垂直于板面,所以,对接焊缝超声波探伤基本方法一般都利用斜探头在焊缝两侧与钢板直接接触后所产生的折射横波进行探测,见图4–4所示。
一、探测面的修整为保证整个焊缝截面都被超声波束扫查到,探头必须在探测面上左右、前后移动,为此,通常要对探测面进行修整。
探测面上的焊接飞溅、氧化皮、锈蚀等应清理掉。
清理的方法可用铲刀、钢丝刷、砂轮等使钢板露出金属光泽。
探测面的修整宽度按GB11345–89标准规定:a. 用一次(直射)波法扫查,则焊缝两测的修整宽度(探头移动区)应大于0.75P :P=2TK (4–1)式中:T 为母材厚度;K 为斜探头折射角的正切(K=tg β)。
b. 用一次反射波法,在焊缝两面两侧扫查,故修整宽度大于1.25P : 二、耦合剂的选用为使超声波能顺利传入工件,在探伤前必须在探测面上涂上耦合剂,常用的耦合剂有机油、化学浆糊、水、甘油等。
耦合剂的选用应考虑:① 工件表面光洁度和倾斜角度 ② 探测频率③ 耦合剂的声透性能④ 保存和使用的方便性⑤ 经济性和安全等各种耦合剂在工件表面光洁度较高时,其声透性能一般相差不大,当工件表面光洁度较差时,选用声阻抗较大的耦合剂,如甘油,可获得较好的声透性能。
三、探头的选择探头选择主要指探头角度和频率的选择 1. 探头角度的选择对于钢质材料,为保证纯横波探测,探头的入射角应在第一临界角(27.5°)和第二临界角(57°)之间,即27.5°<α<57°。
国内过去使用的探头均以入射角标称,如、30°、40°、45°、50°、55°等。
近年来,考虑到为使缺陷定位计算方便,故均改用K 值探头(K=tg β)如K=0.8、K=1、K=1.5、K=2、K=2.5、K=3等。
焊缝超声波探伤操作步骤
焊缝超声波探伤操作步骤探头前沿长度的测量。
将探头放置在CSK —I A试块上,将入射点对准R100处,找出反射波达到最高时探头到R100端部的距离。
然后用其所长100减去此段距离。
此时所得的数据就是探头的前沿距离。
按此方法连测三次,求出平均值。
测量探头的K值利用CSK —I A试块上的© 50孔的反射角测出并用反三角函数计算出K值。
将探头对准试块上© 50横孔,找到最高回波:则有K=tg B =( L+I-35) /30。
扫描速度的调节水平调节法:将探头对准R50、R100,调节仪器使B1、B2分别对准不平刻度,此时计算出I l、12。
I i=KR50/ 1+K, l2= KR100/ 1 + K将计算出的数据在示波屏上将B1和B2调至相对应的位置,此1、时水平距离扫描速度为1:1。
2、深度调节法利用CSK- I A试块调节,先计算R50、R100圆弧反射波B1、B2对应的纵深di、d2: d i=R50/ 1+K, d2= R100/1+K,然后调节仪器使Bi、B2分别对准水平刻度值d1、d2。
如K=2时,经计算d1二、d2=。
1、将探头置于CSK-皿A试块上,衰减48dB,调增益使深度为10mm的© 1 X 6孔的最高回波达基准60%,记录此时的衰减器读数和孔深,然后分别探测其它不同深度的© 1X6孔,增益不动,调节衰减器将各孔的最高回波调至60%高,记下相应的dB 值和孔深填入表中。
2、以孔深为横坐标,以分贝值为纵坐标,在坐标纸上描点绘出定量线、判废线和评定线,标出I区、H区、皿区,并注明所用探头的频率、晶片尺寸和K值。
3、现以T=30mm举例说明0 1 x 6(dB)52 50 47 44 41 38 0 1 x 6+5(dB)判废线57 55 52 49 46 43 0 1 x 6-3(dB)定量线49 47 44 41 38 35 0 1X 6-9(dB)评定线434138353229|]_1一1 ______ I _________ |_1 02 03 04 050五、调节探伤灵敏度调节探伤灵敏度时,探伤灵敏度不得低于评定线,一般以2倍的壁厚处所对应的评定线dB 值,也就是说在工件60mm 处评 定线所对应的分贝值。
超声波焊缝探伤操作简述课件

PPT学习交流
返回
11
仪器的调校
4、 DAC曲线的制作
缺陷回波的波高与缺陷大 小及距离有关,DAC曲线 就是描述某一确定反射体 回波高度随距离变化的关 系的曲线。
1)、设置[DAC]菜单中[DAC曲线]=on,开始制作曲线。
2)、用斜探头扫射RB-2试块上深度为10mm的φ3孔,找到最 高
回波,使用闸门套住该回波,调节回波高度为80%,选中
折射角β的正切值tanβ=3
探伤前应根据被检对象的形状、衰减和技术要求来选 择探头。探头的选择包括探头型式、频率、晶片尺寸和
斜探头K值的选择等 , K值一般情况会按下表选择。
板厚mm 8~25 25~46
>46
K值
3.0~2.0 2.5~1.5 2.0~1.0
PPT学习交流
返回
7
所用试块 (GB11345-89)
PPT学习交流
返回
15
对焊缝情况的了解
• 在探伤前要对焊缝及探伤处的外观状况进行了解,如焊 缝坡口的形状、尺寸,焊缝余高,焊缝内侧成型情况, 板材表面粗糙程度等,对有影响检验结果评定的表面形 状突变应进行适当的修磨,并做圆滑过渡,这样有利于 在探伤过程中对缺陷的情况准确判定!
PPT学习交流
返回
16
Ⅳ级。
4)、反射波幅位于Ⅰ区的非裂纹性缺陷,均评为Ⅰ级。
5)、反射波幅位于Ⅲ区的缺陷,无论其指示长度如何,均
评定为Ⅳ级。
6)、不合格的缺陷,应予返修,返修后,应对返修部位及补
焊受影响的区域,应按原PP探T学习伤交流条件进行复验
返回
21
探伤操作及缺陷的判定
• 记录 检验记录主要内容:工件名称、编号、焊缝编号、坡口
超声相控阵检测教材 填充焊缝操作说明
ISONIC相控阵设备操作指南填充焊缝检测软件功能Israel(以色列) - Sonotron NDT北京邹展麓城科技有限公司一、进入检测界面1、根据所使用的仪器进入相控阵检测模式,在相控阵界面下点击,见图1所示。
图12、点击进入选项模式,见图2所示。
图23、点击进入填充焊缝检测模式。
见图3所示。
图3二、A超参数设置、DAC曲线制作、角度增益补偿曲线及耦合监控设置方法参见“焊缝高级检测”软件功能操作说明书进行设置。
三、焊缝几何形状设置1、在扫查设置界面,点击几何尺寸设置栏的,进入焊缝几何参数设置界面。
见图4所示。
图42、进入到焊缝几何参数设置界面后,输入焊缝的几何参数。
选择扫查面,输入角度、法兰厚度、梁腹厚度及焊接位置尺寸。
见图5、图6所示。
本次示例所检测的焊缝几何参数如图5、图6所示。
图5图6四、扇形扫查范围及探头位置设置1、点击焊缝几何形状设置界面的,返回至扫查设置界面,进行检测扇形扫查范围设置。
2、在扫查参数栏通过调节检测所需的最小角度、最大角度及角度步进。
角度步进有0.2°、0.5°、1°、2°和5°工五种选项。
检测所需的最大最小角度的选择主要依据能否全部覆盖或者最大程度覆盖检测焊缝区域的宗旨来进行调节,在满足覆盖要求的前提下,一次波声束与二次波声束的重叠部分尽可能的少。
角度步进越小声束覆盖焊缝区域越密集,但同时检测数据量越大,采集速度及保存速度越慢(建议在检测中选择0.5°的角度步进足以满足检测要求)。
3、在焊缝参数设置界面,通过调节。
通过探头位置的调节,可以在示意图中看出已设定的扇形扫查范围是否满足声束覆盖要求,从而找到适合的探头位置。
在探头位置满足声束覆盖范围时,探头位置越小越好,以减少声波的衰减。
注:探头位置代表探头距焊缝根部的的距离。
本次示例选择的扇形扫查范围为40°~76°,扫查步进为0.2°,选择在梁腹右侧检测,探头位置为0mm。
PXUT-320C超声波探伤仪操作规程(焊缝)
PXUT-320C型全数字智能超声波探伤仪操作规程(焊缝超声检测)1、开机:开启仪器电源开关,将探头与仪器连接,仪器处于正常工作状态。
2、参数清零:按<功能>键,选择“1”,清除当前通道。
3、设置参数:在<设置>菜单中,设置探头方式、探头 K 值、晶片尺寸、探头前沿、探头频率为、工件声速、检波方式,在<选项>菜单中,设置判废偏移、定量偏移、评定偏移、表面补偿。
按<确定>键保存并退出设置。
4、调零:按<零点/调校> 键两次,进入测试菜单,按“1”测<零点声速>。
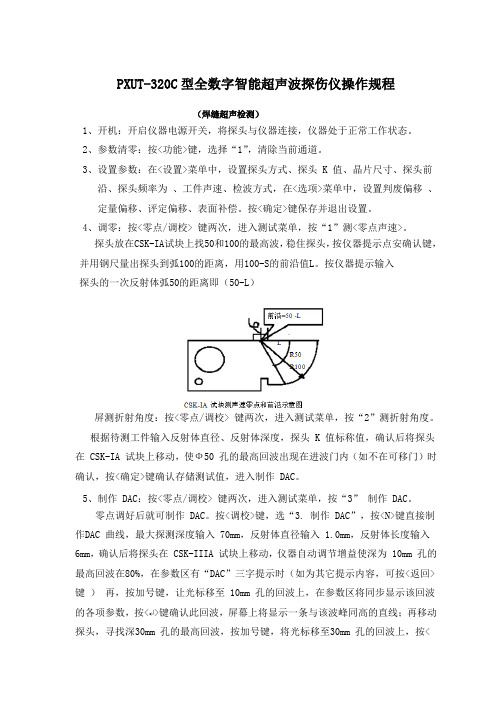
探头放在CSK-IA试块上找50和100的最高波,稳住探头,按仪器提示点安确认键,并用钢尺量出探头到弧100的距离,用100-S的前沿值L。
按仪器提示输入探头的一次反射体弧50的距离即(50-L)屏测折射角度:按<零点/调校> 键两次,进入测试菜单,按“2”测折射角度。
根据待测工件输入反射体直径、反射体深度,探头 K 值标称值,确认后将探头在 CSK-IA 试块上移动,使Ф50 孔的最高回波出现在进波门内(如不在可移门)时确认,按<确定>键确认存储测试值,进入制作 DAC。
5、制作 DAC:按<零点/调校> 键两次,进入测试菜单,按“3”制作 DAC。
零点调好后就可制作 DAC。
按<调校>键,选“3. 制作 DAC”,按<N>键直接制作DAC 曲线,最大探测深度输入 70mm,反射体直径输入 1.0mm,反射体长度输入6mm,确认后将探头在 CSK-IIIA 试块上移动,仪器自动调节增益使深为 10mm 孔的最高回波在80%,在参数区有“DAC”三字提示时(如为其它提示内容,可按<返回>键)再,按加号键,让光标移至 10mm 孔的回波上,在参数区将同步显示该回波的各项参数,按<↵>键确认此回波,屏幕上将显示一条与该波峰同高的直线;再移动探头,寻找深30mm 孔的最高回波,按加号键,将光标移至30mm 孔的回波上,按<确定>键确认;再移动探头,寻找深50mm 孔的最高回波,按加号键,将光标移至50mm 孔的回波上,按<确定>键确认;屏幕上显示由 10mm、 30 mm 和 50mm 三孔所得的DAC 母线,点采集完成且经确认存储后,DAC 母线即制作完成。
超声波钢板对接焊缝探伤教程-范
超声波钢板对接焊缝探伤教程(CTS-22型探伤仪)UT试件探伤操作程序(CTS22型超声波探伤仪)一、开机:接通面板左下方电源开关,电源接通,仪器发出轻微的啸叫声,电源指示器中的黑线移到红色区域。
(如黑线到不了红色区,说明电压不足,需要充电)。
二、检测前的准备1.选择探头1)K值的选择探头K值的选择应从以下三个方面考虑:(1)使声束能扫查到整个焊缝截面;(2)使声束中心线尽量与主要危险性缺陷垂直;(3)保证有足够的探伤灵敏度设工件厚度为T,焊缝上下宽度的一半分别为a和b,探头K 值为K,探头前沿长度为L0,则有:K (a+b+L0)/T一般斜探头K值可根据工件厚度来选择,较薄厚度采用较大K 值,如8~14厚度可选K3.0~K2.0探头,以便避免近场区探伤,提高定位定量精度;较厚工件采用较小K值,以便缩短声程,减小衰减,提高探伤灵敏度。
如15~46厚度可选K2.0~K1.5探头,同时还可减少打磨宽度。
在条件允许的情况下,应尽量采用大K值探头。
探头K值常因工件中的声速变化和探头的磨损而产生变化,所以探伤前必须在试块上实测K值,并在以后的探伤中经常校验。
2)频率选择焊缝的晶粒比较细小,可选用比较高的频率探伤,一般为2.5~5.0MHz。
对于板厚较小的焊缝,可采用较高的频率;对于板厚较大,衰减明显的焊缝,应选用较低的频率。
2. 探头移动区宽度焊缝两侧探测面探头移动区的宽度P一般根据母材厚度而定。
图1 探头移动区和检测区厚度为8 ~46mm的焊缝采用单面两侧二次波探伤,探头移动区宽度为:P ≥ 2KT+50 (mm)厚度为大于46mm的焊缝采用双面两侧一次波探伤,探头移动区宽度为:P ≥ KT+50 (mm)式中K----探头的K值;T-----工件厚度。
工件表面的粗糙度直接影响探伤结果,一般要求表面粗糙度不大于6.3μm,否则应予以修整3. 耦合剂的选择在焊缝探伤中,常用的耦合剂有机油、甘油、浆糊、润滑脂和水等,实际探伤中用的最多的是浆糊和机油。
焊缝超声波实操步骤47013-友联
焊缝实操步骤一、开机:长按‘电源’键,按两次‘确定’键,按‘1’选择模拟探伤模式。
二、初始化仪器按‘功能’键,按‘9’确认。
三、调试1、测零点前沿、K值将斜探头放在CSK-IA试块上,按‘范围’键调节声程,寻找R100的回波并移动探头找到最高回波。
此时用钢尺量出探头最前端至100mm弧顶的距离L,前沿=100-L。
将斜探头放在CSK-IA试块上移动,寻找Φ50孔的最高回波。
此时量出探头至试块边的距离a,K=(a+前沿-35)/30。
2、调节扫描比例:将斜探头放在CSK-IIA-1试块上,找到深度20mm的最高回波并衰减到屏幕的80%。
按‘范围’键,把20mm的回波移动到屏幕的第2格,这时移动探头找到深度40mm的最高回波并衰减到屏幕的80%并注意观察此时波与屏幕的第4格相差多少距离,按‘范围’键,将40mm回波移动到第4格之后的相同距离,按‘移位’键,再把40mm回波移动到第4格处,这时重新找到20mm 的最高回波,看是否处于第2格,若不在则重复步骤,直到20mm处于屏幕的第二格且40mm处于屏幕的第4格,此时深度1:1调好。
3、制作面板曲线:将斜探头放在CSK-IIA-1试块上,寻找10mm深孔的最高回波,按‘衰减’键调节使回波达到80%,按‘曲线/调校’,按‘确定’键开始制作。
按‘+’键锁定回波,按‘确定’键完成第一点制作;按上述步骤依次采定测试点(20mm,30mm,40mm,50mm……)各点采集完成后按‘确定’完成曲线并存储数据,面板曲线生成。
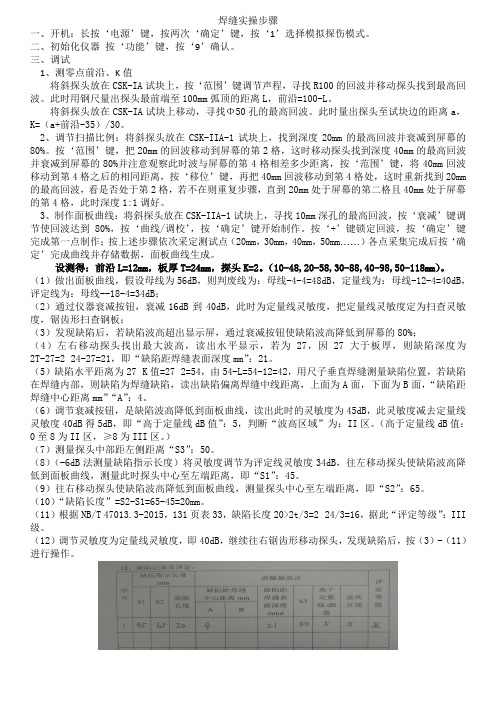
设测得:前沿L=12mm,板厚T=24mm,探头K=2。
(10-48,20-58,30-88,40-98,50-118mm)。
(1)做出面板曲线,假设母线为56dB,则判废线为:母线-4-4=48dB,定量线为:母线-12-4=40dB,评定线为:母线--18-4=34dB;(2)通过仪器衰减按钮,衰减16dB到40dB,此时为定量线灵敏度,把定量线灵敏度定为扫查灵敏度,锯齿形扫查钢板;(3)发现缺陷后,若缺陷波高超出显示屏,通过衰减按钮使缺陷波高降低到屏幕的80%;(4)左右移动探头找出最大波高,读出水平显示,若为27,因27大于板厚,则缺陷深度为2T-27=2×24-27=21,即“缺陷距焊缝表面深度mm”:21。
超声相控阵检测教材ISONIC相控阵操作说明

ISONIC相控阵设备操作指南焊缝高级检测软件功能一、进入检测界面1、根据所使用的仪器进入相控阵检测模式,在相控阵界面下点击,见图1所示。
图12、点击进入选项模式,见图2所示。
图23、点击进入焊缝检测模式。
见图3所示。
图34、相控阵探头选择根据检测选用的相控阵探头选择相应的探头型号,如图4所示,图4右上角所显示的即为探头楔块及探头的参数。
如果在“选择探头”的下拉选项中无检测所用的探头型号,则点击手动输入探头及楔块的参数进行保存。
然后点击。
图45、点击进入相控阵扇形扫描参数设置界面,如图5所示。
图5二、检测参数设置:1、基础参数设置:●增益:根据检测对象所需的检测灵敏度进行设置。
●声程:根据检测对象设置声程范围。
●声速:设置为横波声速(例如:钢中横波声速为3230m/s)。
●显示延迟:就是常说的“零偏”设置。
点击(如图6所示),通过点击左键或右键,将“表面补偿”设置为激活状态(如图7、图8所示),点击,仪器将自动校准“零偏”。
自动校准后的显示延迟将会自动修正为探头延迟,如图6所示。
注:此处“表面补偿”为调节检测参数时所选用的入射角度(“激发设置”中所选取的调节检测参数的入射角度)在探头楔块中传播的延时,及探头延时,仪器自动校准“表面补偿”,即零偏后,显示延迟与“测量参数”中的探头延迟相同。
“测量参数”中的探头延迟,当选定入射角度后,仪器自动计算生成,所以是不可修改的,调节的左键右键为灰色图标。
如图9、图10所示。
本次示例选择的入射角度为55°,探头延时为13.45us。
图6图7图8图9图10●抑制:设置为0%2、激发参数设置:●增益:根据检测对象所需的检测灵敏度进行设置。
●激发模式:设置为单晶。
●脉冲宽度:主要用于优化脉冲回波信号。
初始设置为探头频率周期的一半,将探头置于放置在被检工件或标准试块上,根据脉冲回波的信号质量,点击左键或右键进行微调。
如图11所示。
注:调节依据准则为:脉冲回波信号脉宽最窄且相对回波高度最高。
- 1、下载文档前请自行甄别文档内容的完整性,平台不提供额外的编辑、内容补充、找答案等附加服务。
- 2、"仅部分预览"的文档,不可在线预览部分如存在完整性等问题,可反馈申请退款(可完整预览的文档不适用该条件!)。
- 3、如文档侵犯您的权益,请联系客服反馈,我们会尽快为您处理(人工客服工作时间:9:00-18:30)。
ISONIC相控阵设备操作指南填充焊缝检测软件功能Israel(以色列)- Sonotron NDT北京邹展麓城科技有限公司一、进入检测界面1、根据所使用的仪器进入相控阵检测模式,在相控阵界面下点击,见图1所示。
图12、点击进入选项模式,见图2所示。
图23、点击进入填充焊缝检测模式。
见图3所示。
图3二、A超参数设置、DAC曲线制作、角度增益补偿曲线及耦合监控设置方法参见“焊缝高级检测”软件功能操作说明书进行设置。
三、焊缝几何形状设置1、在扫查设置界面,点击几何尺寸设置栏的,进入焊缝几何参数设置界面。
见图4所示。
图42、进入到焊缝几何参数设置界面后,输入焊缝的几何参数。
选择扫查面,输入角度、法兰厚度、梁腹厚度及焊接位置尺寸。
见图5、图6所示。
本次示例所检测的焊缝几何参数如图5、图6所示。
图5图6四、扇形扫查范围及探头位置设置1、点击焊缝几何形状设置界面的,返回至扫查设置界面,进行检测扇形扫查范围设置。
2、在扫查参数栏通过调节检测所需的最小角度、最大角度及角度步进。
角度步进有0.2°、0.5°、1°、2°和5°工五种选项。
检测所需的最大最小角度的选择主要依据能否全部覆盖或者最大程度覆盖检测焊缝区域的宗旨来进行调节,在满足覆盖要求的前提下,一次波声束与二次波声束的重叠部分尽可能的少。
角度步进越小声束覆盖焊缝区域越密集,但同时检测数据量越大,采集速度及保存速度越慢(建议在检测中选择0.5°的角度步进足以满足检测要求)。
3、在焊缝参数设置界面,通过调节。
通过探头位置的调节,可以在示意图中看出已设定的扇形扫查范围是否满足声束覆盖要求,从而找到适合的探头位置。
在探头位置满足声束覆盖范围时,探头位置越小越好,以减少声波的衰减。
注:探头位置代表探头距焊缝根部的的距离。
本次示例选择的扇形扫查范围为40°~76°,扫查步进为0.2°,选择在梁腹右侧检测,探头位置为0mm。
见图5,图7所示。
图7五、焊缝检测1、设置完成后,在扫查设置界面点击,进入扇形扫描界面,见图7所示。
2、在扇形扫描界面,激活闸门,设置门位、门宽及门高。
超过闸门高度,并在闸门覆盖范围内的检测信息将会进行成像显示。
但闸门外的信息(A超信号)都将被100%记录,只是不做成像。
见图8所示。
注:闸门高度一般建议设置为20%。
闸门门位一般设置为检测时所需成像的起始位置,闸门宽度一般设置为检测时所需成像的最大声程值。
图83、扇形扫描界面的增益为扫查灵敏度。
根据工件表面状态,扫查灵敏度一般在起始灵敏度之上进行补偿。
补偿的范围,一般根据相关检测标准要求进行补偿。
(本次示例没有加表面补偿)4、点击进入C扫描界面进行检测。
见图9所示。
图95、在C扫描界面设置扫查长度、选择记录方式为编码器。
6、编码器校准:●将相控阵编码器接入主机。
●返回至开机检测界面,见图10所示。
点击。
图10●点击,见图11所示。
图11●点击,见图12所示。
图12●将相控阵编码器装入探头。
见图13所示。
图13●将编码器放置在直尺上,点击,沿着直尺或者工件表面将编码器推行300mm。
见图14,图15所示。
注:相控阵编码器前行方向必须与检测时方向一致,否则将不进行成像记录。
图14图15●编码器推行时,图14中的红色箭头会一直闪动,直至编码器行走完300m。
点击步骤二,进入编码器测试界面,验证编码器是否校准。
对编码器进行正行、逆行验证,查看显示结果,误差范围不能超过1%。
见图16,图17,图18所示。
图16图17图18●测试完成后,点击,对编码器进行命名(可自行命名),点击。
见图19所示。
图197、扫查(以下扫查示例因为扫查条件有限,就没有添加耦合监控)●进入到C扫描界面,选择以校准好的编码器,查看耦合状态。
如果耦合状态良好,则C扫描界面中耦合状况指示为,如果耦合状态不好,则C扫描界面中耦合状况指示为。
见图20所示。
图20●点击,进行扫查。
扫查结束后,点击,将会生成扫查结果。
见图21所示。
图21●点击,并保存数据。
文件后缀名为.esc,文件名可自行录入,并记住文件的存放路径,便于后续进行数据分析。
六、数据分析1、采用离线数据分析软件或者相控阵仪器中的数据分析功能对所采集到的检测而数据进行分析。
2、双击数据文件名或选中文件点击,进入该数据分析模式。
见图22、图23所示。
图22图233、点击视图菜单,选择图像后处理,开始数据分析。
见图24所示。
图244、点击视图菜单中的基本信息子菜单,查看检测过程中的设置参数、探头参数、增益修正(即角度增益补偿曲线)。
查看完毕点击确认或关闭。
见图25、图26、图27所示。
图25图26图275、点击浏览菜单中的L.X-浏览和Y1浏览子菜单,对扫查结果进行侧视图(焊缝厚度方向)及俯视图(焊缝宽度方向)的切片浏览。
浏览完毕点击浏览菜单中的关闭。
见图28、图29所示。
图28图296、点击标记菜单中的C扫描子菜单,选择激活。
此时可浏览俯视图上整个扫查长度的扇形扫描(即P扫描图),在浏览的过程中,对整个长度的某一点图像感兴趣,点击鼠标左键,在扇形扫描图上将对应的出现该点的P扫描图。
点击标记菜单中的B扫描子菜单,选择激活。
此时可浏览P扫描图中任意一点的A超波形,点击鼠标左键,单一查看所感兴趣的某一点的A超波形。
用鼠标双击A超窗口,则弹出某一点A超信号的信息。
查看完毕后点击关闭。
见图30所示。
图307、如果在此次检测中,扫查灵敏度设置过高或过低,不符合相关标准要求,可点击视图菜单中的,增益变化子菜单,通过调节增益值。
增益可调范围为-6dB~+6dB。
点击应用,相应的图像信息就会发生改变,即图像颜色变浅或变深(图像颜色代表当量值的大小),图像面积增大或减小。
见图31、图32所示。
图31图328、如果在数据分析的过程中,发现成像的位置不正确(即闸门设置错误),可通过闸门修正菜单进行修改。
修改后,点击应用,图像将会按照新的闸门设置改变。
见图33、图34、图35所示。
注:闸门修正菜单必须是在标记菜单中的C扫描和B扫描激活的状态下才可以使用。
门宽不可调节,门宽随着门位位置改变自动变化。
图33检测前闸门设置图34图359、点击滤波菜单,选择激活,可滤除一些无用的的图像信息。
滤波一共有3种滤波方式,见图36所示。
选择滤波后.点击应用,图像信息将根据设置发生改变。
所有已选择的滤波信息,将在C扫描数据后处理界面的左侧滤波信息中给出,见图示。
如想恢复原始图像,点击滤波菜单,选择关闭。
●设置幅度滤波:图像中不同的颜色代表不同的当量(dB值),选择此滤波方式可滤除一些颜色的图像,即小于滤波器选择的当量值的图像会被滤除。
见图37、图38所示。
●设置表面切片深度滤波:选择此滤波方式可滤除工件上表面以下xx mm的图像。
主要体现在侧视图上的图像变化。
见图39、图40所示。
●设置底面切片深度滤波:选择此滤波方式可滤除工件下表面以上xx mm的图像。
主要体现在侧视图上的图像变化。
见图41、图42所示。
图36图37图38图39图40图41图4210、缺陷分析:●点击视图菜单中的按曲线修正子菜单,选择激活。
●点击滤波菜单,激活滤波器。
选择设置幅度滤波方式,按照相关标准,选择需要评定的等级,点击应用。
所显示的图像都将按照标准要求需要进行评定。
(本次示例并无依据任何标准,只是做一个演示,因为并无绘制DAC曲线,也无做对比试块进行对比。
假设下图所为已按照DAC曲线或者对比试块滤波后的结果)见图43所示。
DAC评定方法详见焊缝高级检测软件功能操作说明。
图43●缺陷测量:点击测量功能菜单,即可激活测量定量线。
测量读数可在视窗左下角读取。
见图44、图45、图46所示。
测量功能可对缺陷的投影长度、投影宽度及投影高度进行测量。
①L-坐标,投影长度:长度测量△L:长度 Lr:起点 Lg:结束点②X-坐标,投影宽度:宽度测量△X:宽度 Xr:起点 Xr:结束点③Y-坐标,投影高度:高度测量△Y:高度 Yr:起点 Yr:结束点图44图45图46●缺陷最大点A超信息读取:点击标记菜单,激活C扫描,移动C扫描指针在俯视图及侧视图中寻找整个缺陷中成像面积当量的最大点,点击鼠标左键。
激活B扫描,移动B 扫描指针在P扫描图(即扇扫图)中寻找该点的当量最大点,通过A超窗口进行幅值大小判断。
双击A超窗口,读取缺陷最大点A超信息。
见图47所示。
图47●3D成像显示:点击3D显示菜单,选择全部,即可把俯视图、侧视图和端视图合成为一个完整的三维图像。
见图48所示。
选择部分,可选择部分扫查区域进行三维成像。
见图49所示。
图48图49●生成检测报告:点击文件菜单,选择打印成word文件,可以选择只有图形,也可以选择完整报告。
选择只有图形,仪器自动生成的检测报告中只有图像,无检测所设置参数等其他信息。
选择完整报告,仪器自动生成的检测报告中有图像,亦有检测所设置的参数信息等完整信息。
注:仪器自动生成的报告为word格式,可自行命名文件,自行选择存储路径。
仪器自动生成的报告可进行后期编辑,如复制、粘贴等处理。
