经济学英文(复旦大学 周翼)PPT课件
合集下载
Economy教师课堂教学课件

案例二:中国的经济发展模式
总结词
中国经济发展模式的特征和优缺点
详细描述
中国的经济发展模式是以出口导向型经济和投资驱动型经济为主的模式。这种模式的特 征是高储蓄、高投资、高出口和高增长。中国经济发展模式的优点包括实现了经济的高 速增长、创造了大量的就业机会、提高了人民的生活水平等。但是,这种模式也存在一
economy教师课堂教学课件
contents
目录
• 引言 • 经济学概述 • 微观经济学 • 宏观经济学 • 国际经济学 • 经济学案例分析 • 结论
01 引言
主题简介
主题名称
Economy(经济)
主题内容
介绍经济的基本概念、原理和现象,包括宏观经济学和微观经济学 的主要知识点。
主题目标
帮助学生了解经济的基本概念和原理,掌握分析经济现象的方法, 培养学生对经济问题的思考和判断能力。
06 经济学案例分析
案例一:全球金融危机
总结词
全球金融危机的背景、原因和影响
详细描述
全球金融危机是指2008年发生的全球性经济危机,其背景是长期的金融自由化和监管不足,导致房地产市场过度 投机和金融衍生品泛滥。危机的原因包括过度借贷、不良资产、高杠杆率等。全球金融危机对世界经济造成了严 重的影响,包括经济衰退、失业率上升、银行破产和信贷紧缩等。
促进经济发展
经济学有助于推动经济发 展,提高人民生活水平和 社会福利。
经济学的发展历程
重商主义
重商主义主张国家应该通过贸 易保护和鼓励出口来增加财富
。
古典经济学
古典经济学家如亚当·斯密和大卫· 李嘉图提出了自由放任和比较优 势理论,强调市场机制的作用。
新古典经济学
新古典经济学家如马歇尔和费雪 提出了边际效用和供需理论,强 调个体选择和供需关系。
经济学原理英文课件 (14)
4 of 34
TABLE 20.1 United States Balance of Payments, 2009
All transactions that bring foreign exchange into the United States are credited (+) to the current account; all transactions that cause the United States to lose foreign exchange are debited (−) to the current account Current Account Goods exports Goods imports (1) Net export of goods Exports of services Imports of services (2) Net export of services Income received on investments Income payments on investments (3) Net investment income (4) Net transfer payments (5) Balance on current account (1 + 2 + 3 + 4) Capital Account (6) Change in private U.S. assets abroad (increase is –) (7) Change in foreign private assets in the United States (8) Change in U.S. government assets abroad (increase is –) (9) Change in foreign government assets in the United States (10) Balance on capital account (6 + 7 + 8 + 9) (11) Net capital account transactions (12) Statistical discrepancy (13) Balance of payments (5 + 10 + 11 + 12) Billions of dollars 1,045.5 –1,562.6 –517.1 509.2 –370.8 138.4 561.2 –472.2 89.0 –130.2 –419.9 –727.0 –12.3 489.6 447.6 197.9 –2.9 224.9 0
复旦国际经济学课件ch5HO模型

图 11:资源与产出
4 贸易对两国经济的影响
4.1 相对价格和贸易模式
另外, 值得注意的是, 7/6 这个价格的确低于我们最开始任意假定的世界价格 1.5 (非均衡价格) 。
说明: 在这个例子中, 自己自足时, 中国的衣服价格为 3/4, 美国的衣服价格为 2。 自由贸易时, 衣服和粮食的市场是统一的, 衣服的世界价格为 7/6 (均衡价格) , 这个价格介于 3/4 和 2 之间。
表格 2:中国和美国的资源禀赋
劳动 资本
要素密集度:某种产品的生产对不同要素的需要程度。 充裕要素:一国(相对于外国)供给相对较多的要素。比如表格 2 中,中国的充裕要素是劳 动。 稀缺要素:一国(相对于外国)供给相对较少的要素。
几个问题: 问题 1:在上面的要素资源和技术下,中国的生产可能性曲线是什么样子的?中国将选择生 产可能性曲线上的哪一点?这个选择依赖于衣服的相对价格么?美国呢? 问题 2:封闭经济下,中国的消费点在哪里,产品的相对价格是多少?美国呢? 问题 3:封闭经济下,中国的工资和租金率为多少?美国呢?哪个国家的工资(相对)高? 问题 4:开放经济下,若衣服价格为 1.5,中国出口什么,进口什么?美国呢?国际贸易平 衡吗?衣服价格会怎样变动? 问题 5:开放经济下,均衡的衣服价格是多少?中国均衡的工资和利率各是多少?美国呢? 中国和美国的工资差异消除了么?
1 模型描述
1.1 模型假定
(1). 两个国家(中国和美国) ,都用两种要素(资本和劳动)生产两种产品(衣服和粮食) 。 (2). 两国代表消费者的偏好相同。 (3). 两国的生产技术相同, 技术具有规模报酬不变和边际产出递减的特征, 无要素密集度逆 转。 (4). 要素不能在国家之间流动,但可以在一国内的不同部门自由流动;产品可以自由贸易。 (5). 所有市场都是完全竞争的。 (6). 相对要素禀赋差异很小。
【复旦大学本科讲义-平狄克微观经济学PPT】lecture07-英文版

of purchasers: h Dh(pX ; nX)
where nX gives the number of consumers who purchase X. Note: • We suppressed other prices and income. • Could also depend on who consumes the good. Circularity: • Market demand is sum of individual demands which in turn depend on
h Dh(pX ; pY, Ih) where consumers/households indexed by h=1,…,N
HORIZONTAL SUMMATION
Consumer Surplus
• Consumers buy goods because it makes them better off
MARKET DEMAND
WITH NETWORK EFFECTS
Demand dependence: • The utility of a good derived by a consumer depends on how many other
consumers buy/use the good • Consequently individual and market demand depends on aggregate number
market demand. • Key role of expectations: expected popularity of a “network good” critical in
ensuring its popularity. • “Chicken and egg” problem: how to sell the first unit when it has little/no
Ch06 The Theory of Consumer Choice(经济学,英文版-复旦,周翼)

Preferred region
d a
Dominated region
c
b
e
Quantity of meals
6.4
Modelling consumer preferences (3)
U2
An indifference curve like U2U2 shows all the consumption bundles that yield the same utility to the consumer
C E
H BL1
U2
U1 BL0
Meals
6.14
The substitution effect
H
Films
U2 U1 D
The SUBSTITUTION
EFFECT is from C to D
C E
H BL1
along U2U2.
U2
U1 BL0
Meals
– –
It is always negative a price increase leads
Four key elements in consumer choice
Consumer’s income
Prices of goods Consumer preferences The assumption that consumers maximize utility6.1源自The budget line
6.12
Response to a price change
The response to a price change comprises two effects: The SUBSTITUTION EFFECT
【复旦大学本科讲义-平狄克微观经济学PPT】Lecture 15 16 2.16.06student-英文版

Public utilities
apparently believing they’re natural monopolies, governments grant monopoly rights for essential good or service “public utilities” • water • gas • electric power • mail delivery
discourage other firms from entering market
Sources of cost advantages
• firm controFra biblioteks a key input: • essential facility: scarce resource that rival
needs to use to survive
Economies of scale
• natural monopolies: most electric companies operated in regions of substantial economies of scale
• Newport Electric produced 0.5 billion kWh/year • Iowa Southern Utilities: 1.3 billion kWh/year
• because monopoly wants to maximize , it chooses same profit-maximizing solution whether it sets p or Q
Profit maximization
Maximizing Profit
Monopoly optimum
【复旦大学本科讲义-平狄克微观经济学PPT】lecture02-英文版
There is no "Law of Supply"
market supply curve may be upward sloping, vertical, horizontal, or downward sloping
Supply effects of other variables
shift in a variable other than price of pork causes the entire supply curve to shift
curves: Q1 = D1(P) Q2 = D2(P) • total quantity demanded = horizontal sum of quantity each consumer demands at each given price: Q = Q1 + Q2 = D1(P) + D2(P)
General supply function
Summing supply curves
total supply curve • horizontal summation of individual supply
curves • shows total quantity produced by all
• which affects foreign supply and total Japanese supply curve
Answer
1. show what the ban does to the foreign supply: ban prevents imports new foreign supply curve, Sf, lies on the vertical axis
Ch09 Perfect Competition and Pure Monopoly(经济学,英文版-复旦,周翼)

Perfect competition
Characteristics of a perfectly competition market
many buyers and sellers
–
so no individual believes that their own action can affect market price so face a horizontal demand curve
firms take price as given
–
the product is homogeneous perfect customer information free entry and exit of firms
9.1
The supply curve under perfect competition (1)
If the expansion of the industry pushes up input prices (e.g. wages) then the long-run supply curve will not be horizontal, but upward-sloping.
9.8
q*
Adjustment to an increase in market demand: the short run Suppose a perfectly competitive market starts in equilibrium at P0Q0.
9.11
Profit maximization by a monopolist
Profits are maximized where MC = MR at Q1P1. In this position, AR is greater than AC AC so the firm makes profits above the opportunity cost of capital
复旦大学 高级微观经济学课件7

7
lottery is evaluated according to the expected value of u.
1.2 Axioms on preferences over gambles
1. Completeness. 2. Transitivity. 3. Given Axioms 1 and 2, we can rank all outcomes in A. (ai can be viewed as a degenerate gamble that yields outcome 1 with probability one.) Without loss of generality, we assume a1 a2... an.
jectively defined. 3. A compound gamble is a gamble whose prizes are gambles (simple or compound). For any compound gambles, we can calculate the probability of each outcome. (I use the term “prize” to refer to what one may receive from a gamble. A prize may be another gamble or an outcome in A.) 4. Example: suppose A = {+1, −1}. g1 = (p1 ◦ 1, (1 − p1) ◦ −1) g2 = (p2 ◦ 1, (1 − p2) ◦ −1) g3 = (q ◦ g1, (1 − q ) ◦ g2)
9
to x is also better than x . 5. The Independence Axiom. For any gambles g , g , g , and α ∈ (0, 1), g g ⇔ αg + (1 − α) g αg + (1 − α) g .
【复旦大学本科讲义-平狄克微观经济学PPT】lecture12-英文版
Applications & Problems
• Do competitive firms pass through 100% of cost increases to customers?
• Why are there mini-banks in grocery stores? • Why do unprofitable steel firms continue to
Solved problem
• specific tax of is collected from only one competitive firm
• how should that firm change its output level to maximize its profit
• how does its maximum profit change?
Maximizing Profit
3 equivalent output rules
Why output rules are equivalent
Interpreting output rules
Calculus
Shut-down rules
• apply to all firms in SR and LR
year • your opportunity cost is $25,000, • so you have an economic loss of $5,000
Profit function
Two steps to maximizing profit
to maximize its profit, any firm (not just competitive firms) must answer two questions: • output decision: if the firm produces, what output level, q*, maximizes its profit or minimizes its loss? • shut-down decision: is it more profitable to produce q* or to shut down and produce no output?
【复旦大学本科讲义-平狄克微观经济学PPT】General Equilibrium-英文版
• through demand • through supply
• because output in one market is an input in another
Partial vs. General Equilibrium
• study equilibrium in several—but not all— markets simultaneously
• shock in one market has spillover effect in another market
• general-equilibrium analysis takes account of spillover, unlike partial-equilibrium analysis
Is it possible to pay Peter without robbing Paul?
General Equilibrium
• Magnitude of spillover effects • General vs. partial equilibrium models
Pareto-Efficient Equilibrium
• doing so is OK for small markets (hoola hoops)
General-equilibrium analysis
• study of how equilibrium is determined in all markets simultaneously an event in one market may have a spillover effect on other markets may be linked
经济学专业英语 课件.ppt

ecnomic growth
• ecnomic growth refers to an increase in total output. Some ecnomists define economic growth as an increase in real GDP per capita.
the growth process
1)An advance in knowledge,or invention
2)Technological change can’t be measured directly. • Other advances in knowledge
Managerial knowledge,personnel management, accounting procedures, data management, etc.
• 1. How do the four wheels of growth contribute to economic growth? Give examples.
• 2. what is the most important factor in economic growth in modern society in your opininon?
• Gorwth can’t be explained by increases in the quantity of inputs can be explained only by an incease in the productivity of those inputs.
• Technological change
• 3.What do you think of Chinese economic growth ?
经济学原理英文版课件-金融体系

Y=C+I+G Solve for I:
national saving
I = Y – C – G = (Y – T – C) + (T – G)
Saving = investment in a closed economy
8
m use.
Budget Deficits and Surpluses
Budget surplus = an excess of tax revenue over govt spending = T–G = public saving
▪ Decline in confidence in financial institutions ▪ 2008–2009: Customers with uninsured deposits began pulling their funds out of financial institutions.
6
m use.
National Saving
National saving
= private saving + public saving
= (Y – T – C) + (T – G)
=
Y–C–G
= the portion of national income that is not used for consumption or government purchases
5
m use.
Different Kinds of Saving
Private saving = The portion of households’ income that is not used for consumption or paying taxes =Y–T–C
ChMonetaryandFiscalPolicyinaClosedEconomy经济学英文复旦周翼
and to look at simultaneous equilibrium in both.
25.0 第1页/共23页
Consumption revisited
Income is a key determinant of consumption but other factors shift the consumption function
AD1 AD0
at CC0, investment and equilibrium at
at Y0.
I0
CC1 A fall in interest rates
shifts the consumption
CC 0 function to CC1, and
leads to higher
Y0 Y1 Income
The LM schedule shows the different combinations of income and interest rates at which the money market is in equilibrium.
第15页/共23页
25.14
The LM schedule
If the government cut taxes today, but individuals realise this will have to be balanced by higher taxes in the future, then present consumption may not adjust.
25.9 第10页/共23页
Monetary policy
when aggregate demand depends upon the interest rate
Ch14 Capital and Land(经济学,英文版-复旦,周翼)

represents –(1 + r), where r is the real interest rate that balances the productivity of investment and the thriftiness of consumers.
14.7
Future consumption
The real rate of interest
–
The real rate of interest is the nominal rate minus the inflation rate.
14.5
The equilibrium real interest rate
AA' shows the production possibility frontier between current and future consumption: by devoting resources to investment, future consumption can be increased. The slope of the frontier has magnitude –(1 + i) A where i is the rate of return on investment. Current consumption
14.3
A flow
– –
Interest and present value
The present value of £1 at some future date is the sum that, if lent out today, would accumulate to £1 by that future date.
经济学原理英文课件 (11)
Equipment
Structures
1960 1970 1980 1990 2000 2008 Percentage change, 1960–2008 Annual rate
666.8 1,146.8 1,919.6 2,603.8 4,204.1 5,400.0 +709.8%
+4.4%
2,860.1 3,951.8 5,216.8 6,908.4 8,162.1 9,266.5 +224.0%
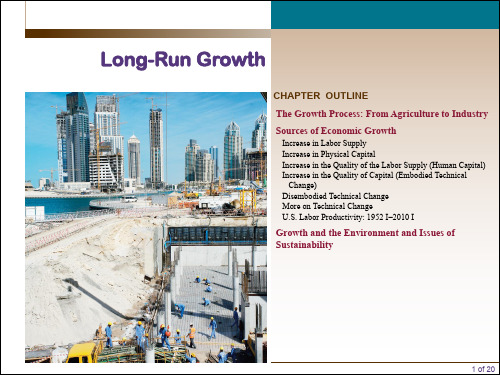
Change) Disembodied Technical Change More on Technical Change U.S. Labor Productivity: 1952 I–2010 I
Growth and the Environment and Issues of Sustainability
130
327
3.3
2.5
9 of 20
Sources of Economic Growth
Increase in Physical Capital
TABLE 17.5 Fixed Private Nonresidential Net Capital Stock, 1960–2008 (Billions of 2005 Dollars)
5 of 20
Sources of Economic Growth
aggregate production function A mathematical relationship stating that total GDP (output) depends on the total amount of labor used and the total amount of capital used.
- 1、下载文档前请自行甄别文档内容的完整性,平台不提供额外的编辑、内容补充、找答案等附加服务。
- 2、"仅部分预览"的文档,不可在线预览部分如存在完整性等问题,可反馈申请退款(可完整预览的文档不适用该条件!)。
- 3、如文档侵犯您的权益,请联系客服反馈,我们会尽快为您处理(人工客服工作时间:9:00-18:30)。
What to produce
– less oil-intensive products
How to produce
– less oil-intensive techniques
For whom to produce
– oil producers have more buying power, importers have less
Production possibility frontier
Film output
1.6
The operation of markets
Market
– a shorthand expression for the process by which
– households’ decisions about consumption of alternative goods
Models and data
Model
– a framework based on simplifying assumptions
– helps to organize our economic thinking
Opportunity cost a crucial concept in economic analysis the quantity of other goods that must be sacrificed to obtain another unit of a good
1.5
Food output
1.8
Market orientation
China Sweden
Hungary Cuba
UK
USA Hong Kong
Command economy
Free market economy
1.9
Normative and Positive Economics
Positive economics deals with objective explanation
The production possibility frontier
For each level of the output of one good, the production possibility frontier shows the maximum amount of the other good that can be produced.
1.10
Micro and Macro
Microeconomics
– offers a detailed treatment of individual economic decisions about particular commodities
Macroeconomics
– emphasizes the interactions in the economy as a whole
Tripled in 1973-74, and doubled again in 1979-80 … and affected people all over the world.
40 35 30 25 20 15 10 5 0
1.2
An increase in the price of oil affects
– firms’ decisions about what and how to produce
– and workers’ decisions about how much and for whom to work
are allnt of prices
1.7
Resource allocation
Resource allocation is crucial for a society and is handled in different ways in different societies, e.g.: – Command economy – Mixed economy – Free market
1.11
Chapter 2
The tools of economic analysis
David Begg, Stanley Fischer and Rudiger Dornbusch, Economics, 6th Edition, McGraw-Hill, 2000
Power Point presentation by Peter Smith
Chapter 1
Economics and the Economy
David Begg, Stanley Fischer and Rudiger Dornbusch, Economics, 6th Edition, McGraw-Hill, 2000
Power Point presentation by Peter Smith
1.3
The distribution of world population and GNP, 1998
100% 90% 80% 70% 60% 50% 40% 30% 20% 10% 0%
Population
LIC MIC HIC
GNP
1.4
Scarcity forces choices to be made
– e.g. if a tax is imposed on a good its price will tend to rise
Normative economics offers prescriptions based on value judgements
– e.g. a tax SHOULD be imposed on tobacco to discourage smoking
What is Economics?
ECONOMICS ... is the study of how society decides:
– What – For whom – How
to produce...
1.1
US$ per barrel
1965 1975 1985 1995
The price of oil