曼昆宏观经济学第七版英文课件第七章
曼昆《经济学原理》(宏观经济学分册)英文原版PPT课件
© 2007 Thomson South-Western
Table 2 Real and Nominal GDP
© 2007 Thomson South-Western
Table 2 Real and Nominal GDP
© 2007 Thomson South-Western
Table 2 Real and Nominal GDP
© 2007 Thomson South-Western
THE ECONOMY’S INCOME AND EXPENDITURE
• When judging whether the economy is doing well or poorly, it is natural to look at the total income that everyone in the economy is earning.
Y = C + I + G + NX
© 2007 Thomson South-Western
THE COMPONENTS OF GDP
• Consumption (C):
• The spending by households on goods and services, with the exception of purchases of new housing.
© 2007 Thomson South-Western
THE MEASUREMENT OF GROSS DOMESTIC PRODUCT
• The equality of income and expenditure can be illustrated with the circular-flow diagram.
布兰查德宏观经济学第七版第7版英文版chapter (7)
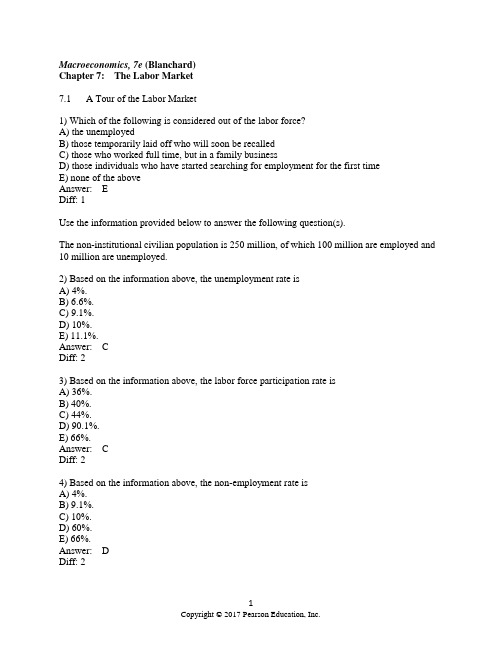
Macroeconomics, 7e (Blanchard)Chapter 7: The Labor Market7.1 A Tour of the Labor Market1) Which of the following is considered out of the labor force?A) the unemployedB) those temporarily laid off who will soon be recalledC) those who worked full time, but in a family businessD) those individuals who have started searching for employment for the first timeE) none of the aboveAnswer: EDiff: 1Use the information provided below to answer the following question(s).The non-institutional civilian population is 250 million, of which 100 million are employed and 10 million are unemployed.2) Based on the information above, the unemployment rate isA) 4%.B) 6.6%.C) 9.1%.D) 10%.E) 11.1%.Answer: CDiff: 23) Based on the information above, the labor force participation rate isA) 36%.B) 40%.C) 44%.D) 90.1%.E) 66%.Answer: CDiff: 24) Based on the information above, the non-employment rate isA) 4%.B) 9.1%.C) 10%.D) 60%.E) 66%.Answer: DDiff: 25) Which of the following individuals would be considered unemployed?A) an individual who works only part-timeB) an individual who works full-time in a family business, but is not paidC) an individual who is not working and is not looking for workD) all of the aboveE) none of the aboveAnswer: EDiff: 26) Based on the data provided in the chapter, which of the following represents the largest component of the labor force?A) discouraged workersB) retired individualsC) employedD) unemployedAnswer: CDiff: 17) The labor force is defined asA) the sum of the employed and unemployed.B) the total number employed.C) the total number of working age individuals in the population.D) the sum of the number of employed, unemployed and discouraged individuals. Answer: ADiff: 18) The participation rate in the United States in 2010 was approximately equal toA) 96%.B) 90%.C) 65%.D) 26%.E) 5%.Answer: CDiff: 19) Which of the following represents the participation rate?A) the ratio of the number employed to the size of the labor forceB) the ratio of the number employed to the civilian noninstitutional populationC) the ratio of the labor force to the civilian noninstitutional populationD) the ratio of the labor force to the total number of employed and unemployed workers Answer: CDiff: 110) The average amount of time people spend unemployed is approximatelyA) 1 month.B) 6 months .C) 12 months.D) none of the aboveAnswer: DDiff: 211) The Current Population Survey interviews approximately how many households each month?A) 5,000B) 10,000C) 60,000D) 100,000Answer: CDiff: 112) In the United States, how many workers become unemployed, on average, every day?A) 5,000B) 10,000C) 50,000D) 100,000Answer: CDiff: 113) In the United States, the average length of time people spend unemployed isA) approximately one month.B) between two and three months.C) between ten and eleven months.D) greater than twelve months.Answer: BDiff: 214) A reduction in the unemployment rate will tend to cause which of the following?A) an increase in the separation rateB) a reduction in the nominal wageC) a reduction in the duration that one is unemployedD) none of the aboveAnswer: CDiff: 215) When the unemployment rate is low, we would expect thatA) the probability of losing a job is high.B) the probability of losing a job is low.C) the probability an unemployed individual will find another job is low.D) the separation rate will increase.Answer: BDiff: 216) The participation rate in the U.S. has increased steadily over time. First, explain what the participation rate represents. Second, explain why the participation rate has increased. Answer: The participation rate is the ratio of the labor force to the working age population. One of the reasons for the significant increase in the participation rate is the increasing participation of women in the labor force.Diff: 217) What effect does the existence of discouraged workers have on the ability of the official unemployment rate to provide accurate information about the extent to which labor is employed? Answer: Discouraged workers are individuals who have stopped searching for employment because, for example, they have become "discouraged" with the prospects of finding employment. Once they stop searching (after 4 weeks), they are no longer counted as unemployed and, therefore, in the labor force. Such a dynamic would cause the official unemployment to fall. Alternatively, the existence of discouraged workers implies that the official unemployment rate underestimates the extent to which labor is being is not being used. This explains why the existence of discouraged workers can cause the unemployment rate to be an imperfect measure of the utilization of labor.Diff: 218) First, provide a brief explanation of what the unemployment rate measures. Second, explain how changes in each of the components of the unemployment rate can cause changes in the unemployment rate.Answer: The unemployment rate measures the percentage of the labor force that is unemployed. The unemployment rate is based on a monthly survey of households. Individuals are classified as employed, unemployed, or out of the labor force. Individuals employed or unemployed are in the labor force. Suppose individuals decide to enter the labor force for the first time. This increase in the size of the labor force, all else fixed, would cause an increase in the unemployment rate.On the other hand, if there were an increase in the number of individuals unemployed (caused by, for example, firms laying off workers as demand for their products falls), we would observe no change in the labor force but an increase in the unemployment rate.Diff: 27.2 Movements in Unemployment1) Data on labor-force flows show thatA) almost all separations are due to death.B) almost all separations are due to serious illness.C) almost all separations are quits.D) almost all separations are layoffs.E) none of the aboveAnswer: EDiff: 22) Data on labor-force flows show thatA) in any given month, almost none of the unemployed gets jobs.B) in any given month, almost all of the unemployed gets jobs.C) the average duration of unemployment is about 2 weeks.D) the average duration of unemployment is about 2 years.E) in any given month, about one-fourth of the unemployed get jobs.Answer: EDiff: 23) Which of the following variables is most directly determined in the labor market?A) stock pricesB) nominal wagesC) interest ratesD) all of the aboveE) none of the aboveAnswer: BDiff: 14) The two labor markets in the "dual labor market" areA) southern versus northern.B) western versus eastern.C) English speaking versus non-English speaking.D) domestic versus foreign.E) none of the aboveAnswer: EDiff: 15) When the Current Population Survey (CPS) was introduced in 1940, it was based on a survey of approximately 8,000 households. The CPS survey is now based on a survey of how many households?A) 8,000B) 10,000C) 12,000D) 20,000E) 60,000Answer: EDiff: 26) As the unemployment rate falls,A) the proportion of the unemployed finding a job increases.B) the separation rate increases.C) the young and unskilled experience larger-than-average decreases in unemployment.D) both A and C.E) all of the aboveAnswer: DDiff: 27.3 Wage Determination1) Which of the following statements about wage setting is true?A) most workers in the U.S. have their wages set by formal contracts.B) formal contracts play a more important role in Japan and Western Europe than in the United States.C) the minimum wage in the U.S. is about 75% of the average wage.D) all of the aboveAnswer: BDiff: 12) The reservation wage isA) the wage that an employer must pay workers to reduce turnover to a reasonable level.B) the wage that ensures a laid-off individual will wait for re-hire, rather than find another job.C) the lowest wage firms are allowed by law to pay workers.D) the wage offer that will end a labor-strike.E) none of the aboveAnswer: EDiff: 13) Efficiency wage theory suggests thatA) workers will be paid less than their reservation wage.B) productivity might drop if the wage rate is too low.C) the government can only set tax rates so high before people will prefer not to work.D) unskilled workers will have a lower turnover rate than skilled workers.E) firms will be more resistant to wage increases as the labor market tightens. Answer: BDiff: 24) If efficiency wage theory is valid, we would expect a relatively low premium over the reservation wage whenA) the unemployment rate is low.B) the job requires very little training.C) workers can be easily monitored.D) workers have few other options for employment in the area.E) all of the aboveAnswer: CDiff: 25) Henry Ford's experiment with efficiency wages resulted inA) a dramatic drop in productivity.B) a dramatic increase in the turnover rate.C) a reduction in the layoff rate.D) new problems with the work force, like drunkenness and reckless driving.E) no noticeable effects.Answer: CDiff: 26) In the wage-setting relation, the nominal wage tends to decrease whenA) the price level increases.B) the unemployment rate decreases.C) unemployment benefits decrease.D) the minimum wage increases.E) all of the aboveAnswer: CDiff: 17) In the wage setting relation W = P e F(u,z), the variable z does not include which of the following variables?A) the minimum wageB) unemployment benefitsC) the extent to which firms mark up prices over their marginal costD) all of the aboveE) none of the aboveAnswer: CDiff: 18) Labor productivity is represented by which of the following?A) the ratio of output to employmentB) workers per unit of capitalC) capital per workerD) the ratio of output to populationE) the ratio of output to the labor forceAnswer: ADiff: 19) Today, about ________ of U.S. workers have their wages set by collective bargaining agreements.A) 10%B) 15%C) 20%D) 25%Answer: ADiff: 210) Explain several implications and characteristics of efficiency wage theories.Answer: The efficiency wage theory suggests that firms will pay workers a wage in excess of the workers' reservation wage to minimize quits and to increase productivity. The efficiency wage theory also suggests that nominal wages will be a function of labor market conditions. As the unemployment rate falls, the nominal wage will rise.Diff: 211) Explain how an increase in the unemployment rate will affect bargaining power and nominal wages.Answer: As the unemployment rate increases, it is more difficult for individuals to find employment at other firms. So, workers' bargaining power will fall. As bargaining power falls, the nominal wage will fall.Diff: 212) First, explain what the WS relation represents. Second, explain why it has its particular shape.Answer: The WS relation illustrates the effect of changes in the unemployment rate on the real wage implied by the wage-setting behavior of firms and workers. The WS curve (or relation) is downward sloping because as the unemployment rate increases, workers have less bargaining power so the nominal wage will decrease. This decrease in W, given P, implies that the real wage will also fall. Hence, the WS curve is downward sloping.Diff: 27.4 Price Determination1) The price setting equation is represented by the following: P = (1 + m)W. When there is perfect competition, we know that m will equalA) W.B) P.C) 1.D) W/P.E) none of the aboveAnswer: CDiff: 22) Explain why nominal wages are a function of the expected price level.Answer: Workers and firms care about the real wage. Nominal wages are typically set for a period of time by contracts. Individuals will, therefore, be concerned about what the future price level will be when determining the nominal wage. When setting the nominal wage, individuals will form expectations of what the future price level will be. They will use this to help determine the nominal wage.Diff: 27.5 The Natural Rate of Unemployment1) The natural rate of unemployment is the rate of unemploymentA) that occurs when the money market is in equilibrium.B) that occurs when the markup of prices over costs is zero.C) where the markup of prices over costs is equal to its historical value.D) that occurs when both the goods and financial markets are in equilibrium.E) none of the aboveAnswer: EDiff: 22) The natural level of output is the level of output that occurs whenA) the goods market and financial markets are in equilibrium.B) the economy is operating at the unemployment rate consistent with both the wage-setting and price-setting equations.C) the markup (m) is zero.D) the unemployment rate is zero.E) there are no discouraged workers in the economy.Answer: BDiff: 23) Suppose we wish to examine the determinants of the equilibrium real wage and equilibrium level of employment (N). In a graph with the real wage on the vertical axis, and the level of employment on the horizontal axis, the price-setting relation will now beA) a vertical line.B) a horizontal line.C) an upward sloping line.D) a downward sloping line.E) kinked at the natural rate of unemployment.Answer: BDiff: 24) Suppose we wish to examine the determinants of the equilibrium real wage and equilibrium level of employment (N). In a graph with the real wage on the vertical axis, and the level of employment on the horizontal axis, the wage-setting relation will now beA) a vertical line.B) a horizontal line.C) an upward sloping line.D) a downward sloping line.E) a curve that first slopes upward, then downward.Answer: CDiff: 25) The natural level of employment (N) will increase when which of the following occurs?A) an increase in the markup of prices over costsB) a reduction in unemployment benefitsC) an increase in the actual unemployment rateD) all of the aboveE) none of the aboveAnswer: BDiff: 26) Suppose workers and firms expect the overall price level to increase by 5%. Given this information, we would expect thatA) the nominal wage will increase by less than 5%.B) the nominal wage will increase by exactly 5%.C) the nominal wage will increase by more than 5%.D) the real wage will increase by 5%.E) the real wage will increase by less than 5%.Answer: BDiff: 27) Suppose the actual unemployment rate decreases. This will causeA) an upward shift in the WS curve.B) a downward shift in the WS curve.C) an upward shift in the PS curve.D) a downward shift in the PS curve.E) none of the aboveAnswer: EDiff: 28) Suppose the actual unemployment rate increases. This will causeA) an upward shift in the WS curve.B) a downward shift in the WS curve.C) an upward shift in the PS curve.D) a movement along the WS and the PS curves.E) none of the aboveAnswer: DDiff: 29) With the real wage on the vertical axis and the unemployment rate on the horizontal axis, we know thatA) the WS curve is upward sloping.B) the WS curve is downward sloping.C) the PS curve is upward sloping.D) the PS curve is downward sloping.Answer: BDiff: 210) Based on wage setting behavior, we know that a reduction in the unemployment rate will causeA) no change in the real wage.B) a reduction in the real wage.C) an increase in the real wage.D) an upward shift of the WS curve.Answer: CDiff: 211) Based on price setting behavior, we know that a reduction in the unemployment rate will causeA) no change in the real wage.B) a reduction in the real wage.C) an increase in the real wage.D) an upward shift of the PS curve.Answer: ADiff: 212) Suppose the aggregate production function is given by the following: Y = AN. Given this information, we know that labor productivity is represented by which of the following?A) 1/AB) AC) 1/ND) N/YAnswer: BDiff: 213) Suppose the aggregate production function is given by the following: Y = N. Given this information, we know that labor productivity is represented by which of the following?A) 1/NB) NC) N/YD) 1Answer: DDiff: 214) A reduction in unemployment benefits will tend to cause which of the following?A) an upward shift in the WS curveB) a downward shift in the WS curveC) an upward shift in the PS curveD) a downward shift in the PS curveE) none of the aboveAnswer: BDiff: 215) An increase in the minimum wage will tend to cause which of the following?A) an upward shift in the WS curveB) a downward shift in the WS curveC) an upward shift in the PS curveD) a downward shift in the PS curveE) none of the aboveAnswer: ADiff: 216) Suppose that increased international trade makes product markets more competitive in the U.S. Given this information, we would expect to observe which of the following?A) an upward shift in the WS curveB) a downward shift in the WS curveC) an upward shift in the PS curveD) a downward shift in the PS curveE) none of the aboveAnswer: CDiff: 217) With the real wage on the vertical axis and employment (N) on the horizontal axis, we know thatA) the WS curve is upward sloping.B) the WS curve is downward sloping.C) the PS curve is upward sloping.D) the PS curve is downward sloping.Answer: ADiff: 218) Based on our understanding of the labor market model presented in Chapter 6, we know that an increase in the minimum wage will causeA) an increase in the equilibrium real wage.B) a reduction in the equilibrium real wage.C) a reduction in the natural rate of unemployment.D) both B and CAnswer: ADiff: 219) Based on our understanding of the labor market model presented in Chapter 6, we know that an increase in the markup will causeA) an increase in the equilibrium real wage.B) a reduction in the equilibrium real wage.C) a reduction in the natural rate of unemployment.D) both B and CAnswer: BDiff: 220) Based on our understanding of the labor market model presented in Chapter 6, we know thata reduction in the markup will causeA) an increase in the equilibrium real wage.B) a reduction in the equilibrium real wage.C) an increase in the natural rate of unemployment.D) a reduction in the natural rate of unemployment and no change in the real wage.Answer: ADiff: 221) For this question, assume that Y = N. Based on our understanding of the labor market model presented in Chapter 6, we know that an increase in the minimum wage will causeA) an increase in the natural level of output.B) a reduction in the natural level of output.C) no change in the natural level of output.D) an increase in the natural level of employment.Answer: BDiff: 222) For this question, assume that Y = N. Based on our understanding of the labor market model presented in Chapter 6, we know that a reduction in the markup will causeA) an increase in the natural level of output.B) a reduction in the natural level of output.C) no change in the natural level of output.D) a reduction in the natural level of employment.Answer: ADiff: 223) Based on wage setting behavior, we know that an increase in the unemployment rate will causeA) no change in the real wage.B) a reduction in the real wage.C) an increase in the real wage.D) an upward shift of the WS curve.Answer: BDiff: 224) Based on price setting behavior, we know that an increase in the unemployment rate will causeA) no change in the real wage.B) a reduction in the real wage.C) an increase in the real wage.D) an upward shift of the PS curve.Answer: ADiff: 225) An increase in unemployment benefits will tend to cause which of the following?A) a downward shift in the WS curveB) an upward shift in the PS curveC) an upward shift in the WS curveD) a downward shift in the PS curveE) none of the aboveAnswer: CDiff: 226) A reduction in the minimum wage will tend to cause which of the following?A) an upward shift in the WS curveB) a downward shift in the WS curveC) an upward shift in the PS curveD) a downward shift in the PS curveE) none of the aboveAnswer: BDiff: 227) Explain what effect a reduction in the unemployment rate will have on the real wage based on: (1) the WS relation; and (2) the PS relation.Answer: A reduction in the unemployment rate will increase bargaining power, increase the nominal wage, and therefore increase the real wage based on wage setting behavior. Changes in the unemployment rate have no effect on the real wage based on price setting behavior.Diff: 228) First, explain what the PS relation represents. Second, explain why it has its particular shape. Answer: The PS relation illustrates the effect of changes in the unemployment rate on the real wage implied by the price-setting behavior of firms. Firms set prices as a markup over their marginal cost of producing goods. Given that the marginal cost is assumed to be independent of the level of employment (and, therefore, the unemployment rate), changes in u will have no effect on the price firms set and, therefore, on the real wage based on PS behavior.Diff: 229) Graphically illustrate (using the WS and PS relations) and explain the effects of an increase in the markup on the equilibrium real wage, the natural rate of unemployment, the natural level of employment, and the natural level of output.Answer: An increase in the markup will cause firms to raise the price given the nominal wage. This will cause the real wage based on price setting behavior to decrease; this is represented by a downward shift in the PS curve. This reduction in the real wage will also occur with an increase in the unemployment rate. So, the natural rate of unemployment will rise and the natural level of employment and, therefore, output will fall. The equilibrium real wage will also be lower. Diff: 230) Graphically illustrate (using the WS and PS relations) and explain the effects of an increase in the minimum wage on the equilibrium real wage, the natural rate of unemployment, the natural level of employment, and the natural level of output.Answer: An increase in the minimum wage will cause the nominal wage based on wage setting behavior to increase; this is represented as an upward shift in the WS relation. As the nominal wage increases, firms will respond by increasing the price level so we will observe no change in the equilibrium real wage. We will observe an increase in the natural rate of unemployment and a reduction in both the natural level of employment and output.Diff: 231) Based on your understanding of the labor market model presented by Blanchard (i.e., the WS and PS relations), explain what types of policies could be implemented to cause a reduction in the natural rate of unemployment.Answer: The natural rate of unemployment will change whenever either the PS or WS relations change. To reduce the natural rate, policy makers could implement polices that: (1) reduce unemployment benefits; (2) reduce the minimum wage; or (3) increase competition in product markets.Diff: 232) Explain how a reduction in the unemployment rate will affect bargaining power and nominal wages.Answer: As the unemployment rate decreases, it is easier for individuals to find employment at other firms. So, workers' bargaining power will increase. As bargaining power increases, the nominal wage will increase.Diff: 233) Graphically illustrate (using the WS and PS relations) and explain the effects of a reduction in the markup on the equilibrium real wage, the natural rate of unemployment, the natural level of employment, and the natural level of output.Answer: A reduction in the markup will cause firms to reduce the price given the nominal wage. This will cause the real wage based on price setting behavior to increase; this is represented by a upward shift in the PS curve. This increase in the real wage will also occur with an decrease in the unemployment rate. So, the natural rate of unemployment will decrease and the natural level of employment and, therefore, output will increase. The equilibrium real wage will also be higher.Diff: 234) Graphically illustrate (using the WS and PS relations) and explain the effects of a reduction in the minimum wage on the equilibrium real wage, the natural rate of unemployment, the natural level of employment, and the natural level of output.Answer: A reduction in the minimum wage will cause the nominal wage based on wage setting behavior to decrease; this is represented as an downward shift in the WS relation. As the nominal wage deceases, firms will respond by reducing the price level so we will observe no change in the equilibrium real wage. We will observe a decrease in the natural rate of unemployment and an increase in both the natural level of employment and output.Diff: 235) Explain what effect an increase in the unemployment rate will have on the real wage based on: (1) the WS relation; and (2) the PS relation.Answer: An increase in the unemployment rate will decrease bargaining power, decrease the nominal wage, and therefore decrease the real wage based on wage setting behavior. Changes in the unemployment rate have no effect on the real wage based on price setting behavior.Diff: 2。
曼昆 宏观经济学 第七版 讲义

Economic models
…are simplified versions of a more complex reality
▪ irrelevant details are stripped away
…are used to
▪ show relationships between variables ▪ explain the economy’s behavior ▪ devise policies to improve economic
For example…
Unemployment (left scale)
Why learn macroeconomics?
2. The macroeconomy affects your well-being.
change from 12 mos earlier percent change from 12 mos earlier
U rate 7.7% 7.1% 7.5% 5.5% 7.5% 5.4% 4.0% 5.5% 7.2%
inflation rate 5.8%
13.5% 4.3% 4.1% 3.0% 3.3% 3.4% 3.3% 3.8%
elec. outcome Carter (D) Reagan (R) Reagan (R) Bush I (R) Clinton (D) Clinton (D) Bush II (R) Bush II (R) Obama (D)
“government stimulus” and why might it help?
▪ How can problems in the housing market spread
to the rest of the economy?
曼昆宏观经济学课件 (7)

MPK = f(k +1) – f(k) 1
Note: this production function exhibits diminishing MPK.
CHAPTER 7 Economic Growth I
Capital per worker, k
12
The national income identity
[sf(k) = k ],
then capital per worker will remain constant: k = 0.
This occurs at one value of k, denoted k*, called the steady state capital stock.
CHAPTER 7 Economic Growth I
4. no G or T (only to simplify presentation; we can still do fiscal policy experiments)
5. cosmetic differences
CHAPTER 7 Economic Growth I
10
The production function
Output per
f(k)
worker, y
c1 y1
sf(k)
i1
k1
CHAPTER 7 Economic Growth I
Capital per worker, k
16
Depreciation
Depreciation
per worker, k
= the rate of depreciation
§ understand why poor
曼昆《经济学原理》(宏观经济学分册)英文原版PPT课件

THE COMPONENTS OF GDP • GDP includes all items produced in the economy and sold legally n markets. • What Is Not Counted in GDP?
– Every transaction has a buyer and a seller. – Every dollar of spending by some buyer is a dollar of income for some seller.
© 2007 Thomson South-Western
Y = C + I + G + NX
© 2007 Thomson South-Western
THE COMPONENTS OF GDP • Consumption (C):
• The spending by households on goods and services, with the exception of purchases of new housing. • Investment (I):
© 2007 Thomson South-Western
Table 2 Real and Nominal GDP
© 2007 Thomson South-Western
Table 2 Real and Nominal GDP
© 2007 Thomson South-Western
Table 2 Real and Nominal GDP
• “. . . Final . . .” – It records only the value of final goods, not intermediate goods (the value is counted only once).
第章竞争市场上的企业曼昆经济学原理第七版_图文

– AR = P – MR = P
© 2015 Cengage Learning. All Rights Reserved. May not be copied, scanned, or duplicated, in whole or in part, except for use as
output
• Marginal-cost curve
– Determines the quantity of the good the firm is willing to supply at any price
– Is the supply curve
© 2015 Cengage Learning. All Rights Reserved. May not be copied, scanned, or duplicated, in whole or in part, except for use as
Profit Maximization
• Rules for profit maximization:
– If MR > MC, firm should increase output – If MC > MR, firm should decrease output – If MR = MC, profit-maximizing level of
© 2015 Cengage Learning. All Rights Reserved. May not be copied, scanned, or duplicated, in whole or in part, except for use as
6
permitted in a license distributed with a certain product or service or otherwise on a password-protected website for classroom use.
曼昆《经济学原理》Chapter 07

2
Table 1
Four Possible Buyers’ Willingness to Pay
© 2012 Cengage Learning. All Rights Reserved. May not be copied, scanned, or duplicated, in whole or in part, except for use as permitted in a license distributed with a certain product or service or otherwise on a password-protected website for classroom use.
© 2012 Cengage Learning. All Rights Reserved. May not be copied, scanned, or duplicated, in whole or in part, except for use as permitted in a license distributed with a certain product or service or otherwise on a password-protected website for classroom use.
1
Consumer Surplus
• Welfare economics
– How the allocation of resources affects economic well-being
• Willingness to pay
– Maximum amount that a buyer will pay for a good
© 2012 Cengage Learning. All Rights Reserved. May not be copied, scanned, or duplicated, in whole or in part, except for use as permitted in a license distributed with a certain product or service or otherwise on a password-protected website for classroom use.
曼昆的宏观经济学课件(英文版)

1990
1995
2000
2021/4/30
Why learn macroeconomics?
1. The macroeconomy affects society’s well-being. ▪ example: Unemployment and social problems
2021/4/30
Unemployment and social problems
• Why are there recessions? Can the government do anything to combat recessions? Should it??
2021/4/30
Important issues in macroeconomics
• What is the government budget deficit? How does it affect the economy?
▪ example 1:
Unemployment and earnings growth
▪ example 2:
Interest rates and mortgage payments
2021/4/30
%
Unemployment and earnings growth
5 4 3 2 1 0 -1 -2 -3 -4 -5 1965 1970 1975 1980 1985 1990 1995 2000
2021/4/30
Important issues in macroeconomics
• Why does the cost of living keep rising?
• Why are millions of people unemployed, even when the economy is booming?
宏观经济学(英文版)课件 Chapter07_IM1e
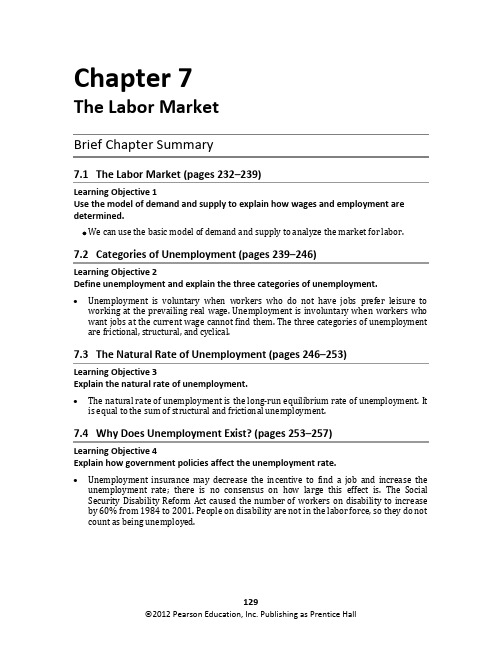
Chapter 7The Labor MarketBrief Chapter Summary7.1 The Labor Market (pages 232–239)Learning Objective 1Use the model of demand and supply to explain how wages and employment are determined.• We can use the basic model of demand and supply to analyze the market for labor.7.2 Categories of Unemployment (pages 239–246)Learning Objective 2Define unemployment and explain the three categories of unemployment.• Unemployment is voluntary when workers who do not have jobs prefer leisure to working at the prevailing real wage. Unemployment is involuntary when workers who want jobs at the current wage cannot find them. The three categories of unemployment are frictional, structural, and cyclical.7.3 The Natural Rate of Unemployment (pages 246–253)Learning Objective 3Explain the natural rate of unemployment.• The natural rate of unemployment is the long-run equilibrium rate of unemployment. It is equal to the sum of structural and frictional unemployment.7.4 Why Does Unemployment Exist? (pages 253–257)Learning Objective 4Explain how government policies affect the unemployment rate.• Unemployment insurance may decrease the incentive to find a job and increase the unemployment rate; there is no consensus on how large this effect is. The Social Security Disability Reform Act caused the number of workers on disability to increase by 60% from 1984 to 2001. People on disability are not in the labor force, so they do not count as being unemployed.129130 Hubbard, O’Brien, and Rafferty| Macroeconomics7.5 Comparisons of Unemployment Rates in Western Europe and theUnited States (pages 257–260)Learning Objective 5 Describe how economic policy explains differences in unemployment rates between Europe and the United States.•Households in Western Europe have recently begun to consume more leisure than households in the United States. Differences in labor markets between Western Europe and the United States may be explained by preferences of workers, income tax rates, and the strength of labor unions.List of Key TermsClassical dichotomy, p. 256. The assertion that in the long run, nominal variables, such as the money supply or the price level, do not affect real variables, such as the levels of employment and real GDP.Cyclical unemployment, p. 243. Unemployment caused by a recession; measured as the difference between the actual level of unemployment and the level of unemployment when the rate of unemployment equals the natural rate of unemployment.Efficiency wage, p. 254. A higher-than-market wage that a firm pays to motivate workers to be more productive.Frictional unemployment, p. 240. Short-term unemployment that arises from the process of matching the job skills of workers to the requirements of jobs.Marginal product of labor (MPL), p. 233. The extra output a firm receives from adding one more unit of labor, holding all other inputs and efficiency constant.Natural rate of unemployment, p. 243. The normal rate of unemployment, consisting of frictional unemployment plus structural unemployment.Structural unemployment, p. 241. Unemployment that arises from a persistent mismatch between the job skills or attributes of workers and the requirements of jobs. Unemployment insurance, p. 241. A government program that allows workers to receive benefits for a period of time after losing their jobs.Chapter OutlineERNST & YOUNG AND PHARMACEUTICAL FIRMS ARE HIRING, SO WHAT'S THE PROBLEM?During the recession of 2007-2009, real GDP declined by 4.1% and the unemployment rate rose to more than 10%. Though the recession officially ended in June 2009, in April 2011 the unemployment rate was 9% and 43% of the unemployed had been out of work for at least six months. Despite the severity of the recession, some firms continued to hire workers. Economists agree that the U.S. labor market creates and destroys millions of jobs every month. Some economists believe that there is an unusually large mismatch between workers' skills and available jobs. If correct, adjusting to structural changes in the economy could cause the unemployment rate to be stuck at high levels. Other economists believe that structural unemployment accounts for a small percentage of the increase in unemployment.CHAPTER 7 | The Labor Market 131The true sources of unemployment influence the approaches policymakers choose to reduce unemployment. Teaching Tips Key Issue : The unemployment rate in the United States remained about 9% more than 20 months after the end of the 2007–2009 recession. Key Question : Should policymakers strive for an unemployment rate of zero?7.1 The Labor Market (pages 232–239)Learning Objective: Use the model of demand and supply to explain how wages and employment are determined.We can use the basic demand and supply model to analyze the market for labor. In the labor market, firms are demanders and households are suppliers. The demand for labor and other factors of production is a derived demand .A. Nominal and Real WagesThe price of labor is the wage, which includes fringe benefits. The nominal wage, W, is how much workers are paid in dollars. The real wage, w , represents the purchasing power of the nominal wage:Real wage = w = .W P (7.1)B. The Demand for Labor ServicesThe labor demand curve is the same as the marginal product of labor (MPL ), which is defined as the extra output a firm receives from adding one more unit of labor, holding all other inputs and efficiency constant. Due to diminishing marginal returns, the marginal product of labor will decrease as firms hire more workers.C. Shifting the Demand CurveThe demand curve for labor shows the relationship between the real wage and the quantity of labor demanded, holding everything else constant. “Everything else ” includes the quantity of capital and the overall level of efficiency with which workers transform inputs into finished goods and services. Changes in these variables cause the demand curve to shift.D. The Supply of Labor ServicesThe wage is the opportunity cost of leisure. An increase in the real wage should cause a worker to devote less time to leisure and more time to work. This response is the substitution effect . The wage increase increases income. We consume more of normal goods as our income rises. More time spent at leisure means less time spent working. This response to a wage increase is the income effect . For the aggregate labor market, evidence suggests that in the short run, the substitution effect is stronger than the income effect, so132 Hubbard, O’Brien, and Rafferty| Macroeconomicsan increase in the real wage leads to an increase in the quantity of labor supplied. In other words, the labor supply curve slopes upward.E. Factors That Shift the Labor Supply CurveThe labor supply curve shows the relationship between the real wage and the quantity of labor supplied, holding constant other factors that might affect the willingness of households to supply labor. Households typically respond to an increase in wealth by “purchasing” more leisure time and supplying fewer hours of labor. When household wealth increases, the labor supply curve shifts to the right. An increase in income taxes will shift the labor supply curve to the left. This assumes that the substitution effect is larger than the income effect.F. Equilibrium in the Labor MarketEquilibrium in the labor market occurs at the intersection of the demand and supply curves. At a wage rate that is less than the equilibrium real wage, the quantity of labor demanded would exceed the quantity of labor supplied. At this wage, firms cannot hire all the labor they want, so competition among firms will drive up the real wage as long as it is below equilibrium. If the real wage started above equilibrium, the quantity of labor supplied would exceed the quantity of labor demanded. Not all workers who want jobs would be able to find them. Some workers would offer to work for a lower real wage, which would bid down the real wage, decreasing the quantity of labor supplied and increasing the quantity of labor demanded. The downward pressure on real wages will be eliminated when the quantity of labor demanded equals the quantity of labor supplied.A change in a variable, apart from the real wage, will cause the demand curve for labor or the supply curve for labor to shift.7.2 Categories of Unemployment (pages 239–246)Learning Objective: Define unemployment and explain the three categories of unemployment.The demand and supply model suggests that when the labor market is in equilibrium, any worker who does not have a job must prefer leisure to working at the prevailing real wage; that is, unemployment is voluntary. There are good reasons to be skeptical that all unemployment is voluntary.A. Unemployment Around the WorldIn all countries, the unemployment rate has fluctuated over time. The average unemployment rate over time has varied substantially across countries. But the unemployment rate never falls to zero. See Figure 7.7 on page 240 to demonstrate these points.B. Frictional Unemployment and Job SearchWorkers have different skills, and jobs have different skill requirements. As a result, most workers spend at least some time engaging in a job search, and most firms spend time searching for new persons to fill job openings. Frictional unemployment is short-term unemployment that arises from the process of matching the job skills of workers to the requirements of jobs.CHAPTER 7| The Labor Market133 Some unemployment is due to seasonal factors. Seasonal unemployment refers to unemployment due to factors such as weather, variations in tourism, and other calendar-related events. The Bureau of Labor Statistics reports two unemployment rates each month—one that is seasonally adjusted and one that is not seasonally adjusted. Some frictional unemployment increases economic efficiency because workers and firms take the time necessary to ensure a good match between the skills of workers and the requirements of jobs.When workers are more productive, they have a higher marginal product of labor, so the demand curve shifts to the right, which should lead to higher real wages and more employment. Unemployment insurance is a government program that allows workers to receive benefits for a period of time after losing their jobs. Without unemployment insurance, an unemployed worker would be under extreme pressure to accept the first job offer he or she received, regardless of whether the job suited his or her skills. But it is possible that providing unemployment insurance for too long a period may lead unemployed workers to take too much time searching for a new job, which would reduce economic efficiency.C. Structural UnemploymentStructural unemployment is unemployment that arises from a persistent mismatch between the job skills or attributes of workers and the requirements of jobs. Structural unemployment can last for longer periods of time than frictional unemployment because workers need time to learn new skills. Technological change is one possible cause of structural unemployment. Technological change in the United States has tended to eliminate unskilled jobs, while increasing the demand for skilled jobs. Low-skilled workers who are unable to acquire the skills necessary to find employment are structurally unemployed.D. Cyclical UnemploymentCyclical unemployment is unemployment caused by a recession; measured as the difference between the actual level of unemployment and the level of unemployment when the unemployment rate equals the natural rate of unemployment. The natural rate of unemployment is the normal rate of unemployment, consisting of frictional unemployment plus structural unemployment. It is the long-run equilibrium unemployment rate. Although cyclical unemployment is caused by a recession, it doesn't end when the recession ends. The unemployment rate continued to be well above the natural rate for many months after the recession of 2007–2009 ended (as illustrated in Figure 7.8 on page 243).E. Full EmploymentFull employment does not mean that every worker has a job. The economy is at full employment when the cyclical unemployment rate is zero.F. Duration of Unemployment Around the WorldThere is variation across countries in the average amount of time a worker is unemployed. Although unemployment rates in Europe were as low, or lower, than those in the United States during the 1960s and early 1970s, before becoming higher in recent years, the average duration of unemployment was higher in Europe even in the early 1970s. In 1971, the average duration of unemployment in Europe was 16.5 months, but it was just 2.6134 Hubbard, O’Brien, and Rafferty| Macroeconomicsmonths in the United States. The average duration of unemployment in Europe was 11.9 months in 2009 but 5.6 months in the United States. Differences in the average duration of unemployment have important policy implications. Workers who are unemployed for long periods of time are more likely to be unemployed for structural reasons than for frictional or cyclical reasons. Policies designed to help the long-term unemployed are more likely to be effective if they involve retraining programs or programs to help workers move from declining industries into expanding ones.Teaching Tips7.3 The Natural Rate of Unemployment (pages 246–253)Learning Objective: Explain the natural rate of unemployment.One explanation for the differences in the average unemployment rate across countries is that the natural rate of unemployment also varies across countries.A. A Model of the Natural Rate of UnemploymentEach month, the Bureau of Labor Statistics (BLS) collects employment data from about 140,000 businesses for what is known as the establishment survey. The survey reports the net change in employment. There is a constant flow of workers from employment to unemployment, even when cyclical unemployment is zero. The BLS uses the Job Openings and Labor Turnover Survey (JOLTS) to measure job flows. According to JOLTS, during March 2011, 4.043 million workers found jobs and 3.836 million workers left their jobs or were fired. This indicates that total employment increased by 207,000 during that month.We know that:Labor force = Employed + Unemployed.Every month, some of the unemployed find jobs. We call the percentage of unemployed individuals who find jobs the rate of job finding(f). We call the percentage of employed workers who separate from jobs the rate of job separation (s). The total number of workers moving from unemployed to employed status is:f × Unemployed,while the total number of workers moving from employed to unemployed status is:s × Employed.CHAPTER 7 | The Labor Market 135When the labor market is in equilibrium and unemployment is at the natural rate, the number of workers finding jobs equals the number of workers separating from jobs, so:f × Unemployed = s × Employed. (7.2) The unemployment rate equals the number of unemployed workers divided by the labor force. Using this definition and Equation (7.2), we can derive an expression of the natural rate of unemployment, U : 1.1(/)s U s f f s ==++ (7.3) Equation (7.3) tells us that the natural rate of unemployment depends on the rate at which workers find jobs and the rate at which workers separate from jobs. The model represented by Equation (7.3) tells us that if policymakers are going to lower the natural rate, they must find ways either to reduce the rate of job separation or increase the rate of job finding.B. The Natural Rate of Unemployment in the United StatesThe natural rate of unemployment fluctuates much less than does the actual unemployment rate. The natural rate of unemployment changes when either structural or frictional unemployment changes. Structural and frictional unemployment vary based on:1. Demographics2.Public policy 3. Technological change 4. Sectoral shiftsDemographics —Younger workers have lower skills and change jobs more frequently than do older workers, and it takes longer for younger workers to obtain an initial job. As the workforce ages, frictional and structural unemployment decline. The unemployment rate also varies by gender. Since 2000, women have typically had lower unemployment rates than men, so as women have become a larger share of the labor force, the natural rate of unemployment has decreased. Race and ethnicity may affect the natural rate of unemployment. Holding other factors constant, the increase in African Americans and Hispanics in the labor force has increased the natural rate of unemployment. Finally, the increase in the size of the prison population has likely reduced the natural rate of unemployment, since if these inmates had been in the labor force, many would have been unemployed.Public Policy —In the United States, unemployment insurance is a joint federal and state program, so benefits vary by state. During economic downturns, the federal government often extends the duration of unemployment insurance. Unemployment insurance makes it easier for workers to remain unemployed, so it reduces the probability that a worker will accept any given job offer. Holding other factors constant, this insurance reduces the rate of job finding and increases the natural rate of unemployment. There is no consensus among economists on how much unemployment insurance may decrease the incentive to find a job. In 1984, the federal government passed the Social Security Disability Reform Act, which made it easier for workers to receive a portion of their wages when physically or psychologically unable to work. The act caused the number of workers on disability to increase by 60% from 1984 to 2001. People on disability are not in the labor force, so they do not count as unemployed. When disabled low-skilled workers left the labor force, the136 Hubbard, O’Brien, and Rafferty| Macroeconomicsnatural rate of unemployment fell by about 0.5%. The growing importance of temporary agencies has also affected the natural rate of unemployment. As temporary employment has become more common since the 1980s, the job-finding rate has increased, and the natural rate of unemployment has decreased by 0.2–0.4 percentage points.Technological change—Research has found that increases in productivity reduce employment in the short run because new technology make some jobs obsolete. However, new technology also increases the demand for new products. As labor and resources flow from old to new industries, the new technology leads to higher employment; in the long run, technological change and increased labor productivity lead to higher wages. Higher wages increase the quantity of labor supplied; therefore, technological change and increases in labor productivity ultimately make workers as a group better off, even though individual workers may be made worse off. Overall, technological change has a large effect on the mix of employment across industries, but it probably has caused, at most, a small effect on the natural rate of unemployment.Sectoral shifts—Changes in the prices of raw materials can also cause employment to shift across sectors and increase structural unemployment. Sectoral shifts refers to the process of output and employment increasing in some industries and declining in other industries. In high-income countries, labor has been flowing from the manufacturing sector to the service sector, while in many low-income countries labor has been flowing from the agricultural sector to the manufacturing sector. As these reallocations take place, the natural rate of unemployment may temporarily increase.Teaching Tips7.4 Why Does Unemployment Exist? (pages 253–257)Learning Objective: Explain how government policies affect the unemployment rate. There are many types of frictions that prevent the real wage from adjusting to maintain the labor market continually at equilibrium. As a result, unemployment can exist.A. Equilibrium Real Wages and UnemploymentThe real wage can be above the equilibrium real wage. The real wage may remain above the equilibrium wage for a period of time, resulting in unemployment.CHAPTER 7| The Labor Market137B. Efficiency WagesMost firms must rely on workers being motivated to work hard, so some firms voluntarily pay an efficiency wage—a higher-than-market wage that a firm pays to motivate workers to be more productive. There are four reasons for efficiency wages. First, an efficiency wage can motivate workers to work harder since workers earn more than they could at their next best alternative jobs. Second, an efficiency wage makes workers less likely to switch jobs.When a worker quits, the firm incurs the cost of finding and training a new worker. If the costs of finding and training workers are high enough, the efficiency wage may increase profits. Third, firms may pay an efficiency wage to improve the quality of their workers. The fourth explanation for efficiency wages applies mostly to low-income nations. Higher real wages mean that workers can afford to purchase more food and more nutritious food, so they are healthier and more productive. Because the efficiency wage is above the market wage, it results in the quantity of labor supplied being greater than the quantity of labor demanded. Therefore, efficiency wages provide one explanation of why an economy can experience unemployment even when cyclical unemployment is zero.C. Labor Unions Around the WorldLabor unions are organizations of workers that bargain with employers over wages and working conditions for their members. In the United States, the National Labor Relations Act requires firms to allow unions to organize and requires firms to negotiate with unions. Unions can bargain for a wage that is above the market level. In the United States, fewer than 7% of workers in the private sector belong to a union, so it seems likely that workers who cannot find jobs in unionized industries can find jobs in other industries. In the United States, unionization rates are higher in the public sector, where more than 36% of workers are members of unions. In Canada and the United Kingdom, 27% of workers are unionized. Just 12% of workers (public and private sectors combined) are unionized in the United States. The relative strength of unions has declined dramatically in recent years in most countries due to globalization and the slow growth in the demand for labor in goods-producing industries.D. Minimum Wage LawsA minimum wage is a legal minimum hourly wage rate that employers are required to pay employees. The federal government has had a national minimum wage law since 1938. Some state and local governments also impose minimum wages. If the minimum wage is set above the market wage, the quantity of labor supplied will be greater than the quantity of labor demanded. As a result, some workers will be unemployed who would have been employed if there had been no minimum wage. In 2009, fewer than 5% of workers received the federal minimum wage. However, the minimum wage may significantly increase the unemployment rate for certain groups of low-skilled workers. Education level is an important determinant of whether a worker earns the minimum wage. During 2009, 10.2% of workers without a high school degree earned the minimum wage, while 2.5% of workers with a bachelor's degree or higher earned the minimum wage. The minimum wage law may have important effects on young, less educated workers. But because teenagers and other workers receiving the minimum wage are a relatively small part of the labor force, most economists believe that the effect of the minimum wage on the unemployment rate in the United States is fairly small.138 Hubbard, O’Brien, and Rafferty| MacroeconomicsE. Monetary Policy, Unemployment, and the Classical DichotomyThe classical dichotomy is the assertion that in the long run, nominal variables, such as the money supply or the price level, do not affect real variables, such as the levels of employment and real GDP. If the dichotomy is correct, then monetary policy will not affect the unemployment rate in the long run. An increase in the money supply increases nominal variables. But in the long run, the price level and the nominal wage both increase so as to leave the real wage unchanged.7.5 Comparisons of Unemployment Rates in Western Europe and theUnited States (pages 257–260)Learning Objective: Describe how economic policy explains differences in unemployment rates between Europe and the United States.There appear to be significant differences between the Western European and U.S. labor markets. Economists have examined three potential explanations for these differences:1. Preferences of workers2. Income tax rates3. Strength of labor unionsA. Preferences of WorkersCultural differences may explain why Western Europeans work less than individuals in the United States. Economist Olivier Blanchard has argued that as real GDP per person has increased, Western Europeans have simply used the increase in income to “purchase” more leisure than have Americans. But as recently as the 1960s, Western Europeans worked as many hours as Americans.B. Income Tax RatesEdward Prescott believes that higher income tax rates in Western Europe can explain why Western Europeans work fewer hours than do Americans in the United States. Prescott points out that the differences in income tax rates between Western Europe and the United States were smaller in the 1960s and early 1970s, when the amount of leisure time was similar in both areas. During the 1970s, income tax rates rose much more rapidly in Western Europe at the same time as the amount of leisure was increasing. However, for Prescott's explanation to be correct, declines in the after-tax wage resulting from tax increases should have resulted in the quantity of labor supplied declining significantly. That is, the elasticity of labor supply with respect to the after-tax wage would have to be large. Many estimates of the elasticity of labor supply with respect to the after-tax wage indicate that it is very low. Therefore, the observed increases in income tax rates in Western Europe do not appear to be large enough by themselves to explain the large increases in leisure taken by workers in those countries.C. Strength of Labor UnionsThe extent of unionization in the United Kingdom, Germany, Canada, and Japan is greater than in the United States and South Korea. Some economists argue that this factor could explain much of the difference between U.S. and European labor markets. Strong unions negotiate for a large number of mandatory holidays, long vacations, and short workweeks.Strong unions may push the wage above the equilibrium wage and cause unemployment. Powerful unions can pressure politicians for regulations that make it difficult for firms to fire workers. This may lead firms to adopt more capital-intensive technology that reduces the need to hire workers, or they may be reluctant to expand operations. In addition, labor unions have pushed for generous unemployment insurance, which reduces the incentives for workers to accept job offers.Teaching TipsSolutions to the End-of-Chapter Questionsand ProblemsAnswers to Thinking Critically questions that accompany the An Inside Look newspaper feature.1. The increase in the number of people employed indicates an increase in the demand forlabor, which shifts the demand curve for labor to the right, from Demand1 to Demand2.The decrease in the labor force is represented by a decrease in the supply of labor, which shifts the supply curve for labor to the left, from Supply1 to Supply2. Because the increase in the number of people employed was slightly greater than the number of workers leaving the labor force, the increase in the demand for labor was slightly larger than the decrease in the supply of labor. Therefore, the shift from Demand1 to Demand2 is slightly greater than the shift from Supply1 to Supply2. Equilibrium moves from pointA to point B, with the real wage rising from Real wage1 to Real wage2, and the quantityof labor increasing from L1 to L2.。
曼昆《宏观经济学》课件讲义

消费需求、投资需求等总需求超过总供给,推动物价上涨。
通货膨胀类型、原因及影响分析
• 成本推动:原材料、劳动力等成本上升推动物价上涨。
通货膨胀类型、原因及影响分析
01
02
03
实际收入水平下降
物价上涨导致货币购买力 下降,实际收入水平降低。
社会财富再分配
通货膨胀使得财富从固定 收入者向变动收入者转移, 从债权人向债务人转移。
总需求-总供给模型在政策分析中应用
• 财政政策分析:财政政策是政府通过调整财政支出和税收政策来影响总需求和总供给的重要手段。在总需求总供给模型中,财政政策可以通过改变政府购买支出、转移支付和税收等方式来影响总需求和总供给的平衡。 例如,增加政府购买支出可以刺激总需求增长;减少税收可以增加居民可支配收入和企业盈利能力,进而促进 消费和投资支出增加;增加转移支付可以提高低收入群体收入水平和消费能力,推动总需求上升。
财政政策与货币政策的协调配合
分析在开放经济条件下,如何协调配合财政政策和货币政策以实现宏观经济目标,如经济增 长、物价稳定、国际收支平衡等。
THANKS
感谢观看
意义
宏观经济学对于政府制定经济政策、促进经 济增长、维护社会稳定等方面具有重要意义。
通过宏观经济学的研究,政府可以更好地了 解国民经济的运行状况,制定更加科学合理 的经济政策,以实现经济的持续健康发展。 同时,宏观经济学也有助于我们更好地认识 和理解现实生活中的各种经济现象和问题。
02 国民收入核算与 衡量
06 开放经济条件下 宏观经济政策
汇率制度选择及影响分析
01
固定汇率制与浮动汇率制的比较
固定汇率制下,政府承诺维持汇率稳定;浮动汇率制下,汇率由市场供
曼昆《宏观经济学》(第6、7版)课后习题详解(第7章 经济增长Ⅰ:资本积累与人口增长)

曼昆《宏观经济学》(第6、7版)第3篇 增长理论:超长期中的经济第7章 经济增长Ⅰ:资本积累与人口增长课后习题详解跨考网独家整理最全经济学考研真题,经济学考研课后习题解析资料库,您可以在这里查阅历年经济学考研真题,经济学考研课后习题,经济学考研参考书等内容,更有跨考考研历年辅导的经济学学哥学姐的经济学考研经验,从前辈中获得的经验对初学者来说是宝贵的财富,这或许能帮你少走弯路,躲开一些陷阱。
以下内容为跨考网独家整理,如您还需更多考研资料,可选择经济学一对一在线咨询进行咨询。
一、概念题1.索洛增长模型(Solow growth model )答:索洛增长模型是表明储蓄、人口增长和技术进步如何影响一个经济的产出水平及其随着时间推移而实现增长的一种经济增长模型。
它的基本假定有:(1)社会储蓄函数为S sY =,式中,s 是作为参数的储蓄率;(2)劳动力按照一个不变的比例增长;(3)生产的规模报酬不变。
其主要思想是:人均投资用于资本扩展化和资本深化,当人均投资大于资本扩展化时,人均产出就会增长;当人均投资等于资本扩展化时,经济达到稳定状态,人均产出不再增长,但总产出会继续增长,增长率等于人口增长率。
2.稳定状态(steady state )答:索洛模型的稳定状态是指长期中经济增长达到的一种均衡状态,在这种状态下,投资等于资本扩展化水平,人均资本存量维持不变,即()0k sf k k δ∆=-=。
这个维持不变的人均资本存量k *称之为稳定状态人均资本存量。
在稳定状态下,不论经济初始位于哪一点,随着时间的推移,经济总是会收敛于该人均资本水平k *。
在稳定状态,由于人均资本存量保持不变,所以人均产出也保持不变,即人均产出增长率为零。
3.资本的黄金律水平(golden rule level of capital )答:资本的黄金律水平是指在稳定状态人均消费最大化时所对应的人均资本水平,由经济学家费尔普斯于1961年提出。
中文曼昆宏观经济学第七版讲义-62页精选文档

6
Trade surpluses and deficits
NX = EX – IM = Y – (C + I + G )
trade surplus:
output > spending and exports > imports Size of the trade surplus = NX
trade deficit:
spending > output and imports > exports Size of the trade deficit = –NX
CHAPTER 5 The Open Economy
7
International capital flows
Net capital outflow
=S –I
IM = imports = C f + I f + G f
= spending on foreign goods
NX = net exports (a.k.a. the “trade balance”) = EX – IM
CHAPTER 5 The Open Economy
4
GDP = expenditure on domestically produced g & s
9
Saving, investment, and the trade balance
(percent of GDP) 1960-2019
investment
saving
trade balance (right scale)
U.S.: “The world’s largest debtor nation”
曼昆宏观经济学课件mankiw7e-chap11

CHAPTER 11
Aggregate Demand II
4
An increase in government purchases
1. IS curve shifts right 1 by G 1 MPC causing output & income to rise. 2. This raises money demand, causing the interest rate to rise…
Consumers save (1MPC) r of the tax cut, so the initial boost in spending is smaller for T than for an r2 equal G… 2. r1 and the IS curve shifts by
1.
r r3 r2 r1
LM2 LM1
Results:
Y 0
IS2 IS1 Y1 Y2
Y
r r3 r1
CHAPTER 11
Aggregate Demand II
12
Estimates of fiscal policy multipliers
from the DRI macroeconometric model
If Congress raises G, the IS curve shifts right.
To keep r constant, Fed increases M to shift LM curve right. Results:
r
LM1
LM2
r2 r1 IS2 IS1 Y1 Y2 Y3
Y Y3 Y1
CHAPTER 11
第七版曼昆宏观经济学课件
总收入
25.06.2020
总支出 4
2.计算GDP的一些规则
1) GDP是一个市场价值概念。 2) GDP测度的是最终产品和劳务的市场 价值。
3) GDP是一定时期内所生产的而不是所 售卖掉的最终产品和劳务的市场价值。
A)二手货 B)存货 C)住房服务与其他估算
25.06.2020
5
4) GDP是计算期内生产的最终产品和 劳务的市场价值。
利润 = 收益 劳动成本
D Q
资本成本
=PY WL RK =P (K,L) WL RK
25.06.2020
26
3. 企业的要素需求 1)劳动的边际产量(MPL)
MPL F( K, L+1) F(K,L)
2)边际产量递减规律 3)从劳动的边际产量到劳动需求
MPL=W/P 4)从资本的边际产量到资本需求
35
非线性消费函数和储蓄函数
CS
C=Y
C=f(Y)
a 0 -a
25.06.2020
MPS>APS
S=f(Y)
Y
C曲线上某点的射线的斜率为APC C曲线上某点的切线的斜率为MPC S曲线上某点的射线的斜率为APS S曲线上某点的切线的斜率为MPS
MPC<APC
36
三. 进口需求
IM = m+γY m是自发性进口,γ为国民收入的边际进口倾向。
第1章 宏观经济学的科学
第一 节 宏观经济学家研究什么
Y = F(L,N,K,H)
总产出=总投入
总支出=总收入
总需求=总供给
1. 宏观经济学要解决的四大问题 1) 稳定物价 2) 3) 平衡国际收支 4) 持续经济增长
曼昆经济学原理第七章(第七版) PPT

7.1 消费者剩余
• 7.1.2用需求曲线衡量消费者剩余
• 各位看官原谅,由于内容假设你的朋友正在考虑两家手机服务提供商.A提供商每月 收取固定服务费120美元,无论打多少次电话都是如此.B提 供商不收取固定的服务费,而是每打1分钟电话费1美元.你 的朋友对每个月打电话时间的需求由方程Qd=150-50P给 出,其中P是每分钟电话的价格. a,对每个提供商,你朋友多打1分钟电话的费用是多少? b,根据你对a的回答,你朋友用每个提供商的服务会打多少 分钟电话? c,他每个月给每个提供商付费多少? d,他从每个提供商得到的消费剩余是多少? e,你会推荐选择哪个提供商?为什么?
曼昆经济学原理第七章(第七版)
大纲
• 引言 • 7.1 消费者剩余 • 7.2 生产者剩余 • 6.3 市场效率
引言
• 1、本书第一章引言中,经济学的定义是:研究社会如何管 理自己的稀缺资源。
• 2、换句话说,社会要对稀缺资源进行管理的目的是为了最 大限度地实现效率和平等这样两个目标。
• 3、如何考察一个市场或政府颁布的一项政策,是否最大限 度地实现了资源配置的效率和平等这样两个目标,需要用 科学的方法进行分析。
• C、(白话版)surplus若翻译为“盈余”可能理解起来更方 便些。消费者剩余说到底就是消费者觉得自己占了多少便宜, 因为愿意支付多少钱是每个人内心对商品价值的评价,若内 心估价较高,而实际价格较低,那购买此商品的“盈余”就 大了,占了大便宜,内心感觉很美好,这就是享受到市场经 济的“福利”了。所以商品要卖给对它评价最高者,因为这 样可以使福利最大化。
• A、 由Qd=150-50P,这个方程可以得出以下结论:P哪怕 是无限接近于0,Q也只能无限接近于150,由于打电话的 分钟只能按个位数计算,所以选择A提供商的话最多打149 分钟电话。(可能会有人说,超过或等于150分钟后的每 分钟就是0元啊,还是请回看一下方程式,P不可能为负数, 否则提供商要赔死了,所以方程式已经限定了最多150分 钟的,这时P=0,实际上这时已经是极限值了;综上所述: 选择A提供商,最多打149分钟电话,再多打1分钟的费用 是0美元。选择B提供商,根据方程得出,P=1时,共打100 分钟电话,再多打1分钟的费用仍是1美元。
2024版曼昆宏观经济学ppt课件完整版

曼昆宏观经济学ppt课件完整版•宏观经济学概述•国民收入核算与经济增长•失业、通货膨胀与货币政策•总需求-总供给模型与财政政策•国际金融与汇率制度•劳动市场、资本市场与长期经济增长•政府角色、社会保障与环境问题目录宏观经济学概述01宏观经济学定义与研究对象定义宏观经济学是研究整个经济体系的总体经济行为、经济表现及其内在规律的一门学科。
研究对象主要包括国民收入、就业、通货膨胀、经济增长等宏观经济现象。
宏观经济学与微观经济学关系联系微观经济学和宏观经济学都是研究经济现象的学科,两者相互补充,共同构成了经济学的完整体系。
区别微观经济学研究个体经济单位(如家庭、企业)的经济行为,而宏观经济学研究整个经济体系的总体经济行为。
03研究方法曼昆宏观经济学采用实证分析和规范分析相结合的方法,既注重理论推导,又强调经验验证。
01理论框架曼昆宏观经济学以新古典综合学派为基础,吸收了货币主义、理性预期学派等理论,形成了一个完整的理论体系。
02主要内容包括国民收入决定理论、就业理论、通货膨胀理论、经济增长理论等。
曼昆宏观经济学理论体系国民收入核算与经济增长02支出法通过核算一定时期内整个社会购买最终产品的总支出计算GDP ,适用于市场经济比较发达的国家。
收入法通过核算整个社会在一定时期内获得的收入总量来计算GDP ,适用于收入分配比较均衡的国家。
生产法通过核算一定时期内各生产单位所生产的全部最终产品的价值总量来计算GDP ,适用于统计基础比较完善的国家。
国内生产总值(GDP )核算方法经济增长率计算及分析经济增长的源泉主要包括劳动投入的增加、资本投入的增加以及技术进步等。
经济增长的波动经济增长不是平稳的,而是呈现出周期性的波动,包括繁荣、衰退、萧条和复苏四个阶段。
比较优势与国际贸易对经济增长影响比较优势理论不同国家在生产不同产品时具有不同的比较优势,通过国际贸易可以实现互利共赢。
国际贸易对经济增长的影响国际贸易可以促进资源在全球范围内的优化配置,提高生产效率,推动技术创新和产业升级,从而促进经济增长。
- 1、下载文档前请自行甄别文档内容的完整性,平台不提供额外的编辑、内容补充、找答案等附加服务。
- 2、"仅部分预览"的文档,不可在线预览部分如存在完整性等问题,可反馈申请退款(可完整预览的文档不适用该条件!)。
- 3、如文档侵犯您的权益,请联系客服反馈,我们会尽快为您处理(人工客服工作时间:9:00-18:30)。
CHAPTER 7
percentage increase in standard of living after…
…25 years
64.0% 85.4%
…50 years 169.2% 243.7%
…100 years
624.5% 1,081.4%
6
Economic Growth I
Why growth matters
If the annual growth rate of U.S. real GDP per
capita had been just one-tenth of one percent higher during the 1990s, the U.S. would have generated an additional $496 billion of income during that decade.
a major paradigm: widely used in policy making benchmark against which most
recent growth theories are compared
looks at the determinants of economic growth
on its saving and population growth rates
how to use the “Golden Rule” to find the
optimal saving rate and capital stock
Why growth matters
Data on infant mortality rates: 20% in the poorest 1/5 of all countries 0.4% in the richest 1/5 In Pakistan, 85% of people live on less than $2/day. One-fourth of the poorest countries have had
2. L is no longer fixed:
population growth causes it to grow
3. the consumption function is simpler
learn how our own
growth rate is affected by shocks and our government’s policies
CHAPTER 7
Economic Growth I
8
The Solow model
due to Robert Solow,
won Nobel Prize for contributions to the study of economic growth
Kenya
Brazil
Russian Federation
Chile S. Korea
Why growth matters
Anything that effects the long-run rate of economic
growth – even by a tiny amount – will have huge effects on living standards in the long run.
CHAPTER 7
Economic Growth I
3
Income and poverty in the world
selected countries, 2000
Madagascar India Nepal Bangladesh Botswana China Peru Mexico Thailand
and the standard of living in the long run
CHAPTER 7
Economic Growth I
9
How Solow model is different from Chapter 3’s model
1. K is no longer fixed:
investment causes it to grow, depreciation causes it to shrink
famines during the past 3 decades.
Poverty is associated with oppression of women
and minorities.
Economic growth raises living standards and reduces poverty….
CHAPTER 7
Economicቤተ መጻሕፍቲ ባይዱGrowth I
7
The lessons of growth theory
…can make a positive difference in the lives of hundreds of millions of people.
These lessons help us understand why poor countries are poor design policies that can help them grow
© 2010 Worth Publishers, all rights reserved
SEVENTH EDITION
In this chapter, you will learn:
the closed economy Solow model how a country’s standard of living depends
MACROECONOMICS
N. Gregory Mankiw
PowerPoint® Slides by Ron Cronovich
CHAPTER
7
Economic Growth I: Capital Accumulation and Modified for EC 204 Population Growth by Bob Murphy