气体传感器——外文翻译
SnO2基 R134a气体传感器 重点单词短语及名词注释

Aapplication [,æpli'keiʃən] n. 应用;BCCatalytic [kætə'litik]adj. 起催化作用的Coating ['kəutiŋ]n. 涂层Characterized adj. 以····为特点Cryogen n. 冷冻剂DDepleting [dɪ'pliːt] v. 用尽,耗尽;使减少detection [di'tekʃən]n.检测deionized [diː'aɪənaɪz] adj. 去离子的degassed vt. [diː'gæs] 脱气;除去瓦斯EEnhanced [in'hɑ:nst, -'hænst] v. 增强Ethylene ['eθɪliːn; -θ(ə)l-] n. 乙烯FGHIImpregnation n. 浸渍indicate ['indikeit]vt. 表明;isotherms ['aɪsə(ʊ)θɜːm] n. [气象] 等温线(isotherm的复数)JKLMMeasure ['meʒə] n.测量maintenance ['meintənəns] n. 维护NOPPorous ['pɔ:rəs,] adj. 多孔渗水的;能渗透的;有气孔的Powders ['paudəs] n. n. 粉;粉末Precipitation [pri,sipi'teiʃən] n. 沉淀,沉淀物prepared [pri'peəd] adj. 准备好的;精制的v. 准备(prepare的过去分词)potential [pəu'tenʃəl] n.潜力;poly ['pɒlɪ] polytechnic的缩写)工艺专科学校;科技学校;工业学校(或大学) propylene 英['prəʊpɪliːn] n. [有化] 丙烯QRrevealing [ri'vi:liŋ]v. 揭示;展现(reveal的ing形式)refrigerants [ri'fridʒərənts] n. 制冷剂复数形式SSensing ['sensiŋ]n. 传感;感觉Static ['stætik]adj. 静态的Significantly [sig'nifəkəntli] adv. 显著地stability [stə'biliti] n. 稳定性;sintering ['sɪntərɪŋ]v. 烧结sorption ['sɔːpʃ(ə)n] n. 吸附作用TTriblock 嵌段Transmittance [trænz'mɪt(ə)ns; trɑːnz-; -ns-] n. [光] 透射比UUndoped [ʌndəupt] adj 无掺杂的纯的Vvolumetric [,vɒljʊ'metrɪk] 体积的WXYZ词组gas sensing materials 气敏材料、noble metal 贵金属be characterized by 以·····为特征adsorption–desorption experiment [æd'sɔ:pʃən]- [di'sɔ:pʃən] 吸附解吸实验经典句型It is well known that Freon can damage the ozone layer which protects the earth from UV irradiation.专业术语nitrogenadsorption–desorption experiment名称缩写FT-IR傅里叶变换红外光谱学Fourier Transform Infrared SpectoscopyXRD 即X-ray diffraction 的缩写,X射线衍射,通过对材料进行X射线衍射,分析其衍射图谱,获得材料的成分、材料内部原子或分子的结构或形态等信息的研究手段。
气体传感器的分类

气体传感器的分类气体传感器是一种用于检测和测量气体浓度和组成的设备。
根据其工作原理和应用领域的不同,可以将气体传感器分为几个主要分类。
1. 热导式传感器(Thermal Conductivity Sensors)热导式传感器是一种基于气体热导率的测量原理来检测气体浓度的传感器。
它包含两个热电阻,其中一个加热丝用于产生热量,另一个用于测量热量传导。
热导率与气体浓度成正比,因此通过测量热导率的变化可以得出气体浓度的信息。
热导式传感器广泛应用于气体分析仪、气体检测仪等领域。
2. 氧气传感器(Oxygen Sensors)氧气传感器是一种用于测量气体中氧气浓度的传感器。
它采用电化学原理,通过氧化还原反应来测量气体中氧气的浓度。
氧气传感器常用于医疗设备、环境监测、工业过程控制等领域,用于监测氧气浓度以确保安全和正常运行。
3. 气体浓度传感器(Gas Concentration Sensors)气体浓度传感器是一种用于测量气体浓度的传感器。
它可以测量各种气体的浓度,如二氧化碳、甲烷、一氧化碳等。
气体浓度传感器采用不同的技术,例如化学传感器、红外传感器、电化学传感器等。
这些传感器广泛应用于室内空气质量监测、工业安全、矿井监测等领域。
4. 气体压力传感器(Gas Pressure Sensors)气体压力传感器是一种用于测量气体压力的传感器。
它可以测量气体的绝对压力或相对压力。
气体压力传感器常用于工业自动化、气象观测、天然气输送等领域,用于监测和控制气体系统的压力。
5. 气体流量传感器(Gas Flow Sensors)气体流量传感器是一种用于测量气体流量的传感器。
它可以测量气体在管道或通道中的流动速度和体积。
气体流量传感器广泛应用于气体供应、燃气测量、气体流程控制等领域,用于监测和调节气体的流动。
气体传感器根据其工作原理和应用领域的不同可以分为热导式传感器、氧气传感器、气体浓度传感器、气体压力传感器和气体流量传感器。
TypesofSensors(各种类型的传感器)外文翻译

Types of SensorsⅠ.Pressure sensorsModel FDS05-P Diffused Silicon Pressure Sensor: Tee intelligent industrial pressure sensor adopts the imported sensor of high quality. with great defending grade,it can work in any caustic condition. By linking external , linking external canola,it can measure the temperature of the medium with high temperature. It is stable and capable of limiting current in positive direction and protecting in negative direction. It is with the ability of intelligent temperature and linearity compensation with the temperature of一40℃~+ 140℃.It is widely used in petrifaction ,metallurgy, electric power and light spinning.Ⅱ.Load cell &torque sensorsSuspended arm type Bx5: Its elastomeric adopts cutting (or curved) hanging girder configuration, so it is low in height and with high configuration intensity. It is good against fatigue and eccentricity. It is stable and reliable in product performances,high in precision, and convenient in mount-up and use. It is suitable for force measurement and weighting such as strap balance, chute balance, flat balance and ground balance .Loading type: pull ox push .Ⅲ.Temp& hum sensorsMote MSTB Temperature Transducer: A sensor module is fitted in the temperature trans-ducker’s terminal block,which uses a specific chip to magnify and has linearization approach to improve the measurement precision .Tie cold junction needs no compensation. Sa it is with high direct load capacity , large transfer distance and strong ability of ants-external interference。
Seeed-Grove - Gas Sensor 气体传感器 - Wiki
Grove Gas Sensor 气体传感器 Wiki
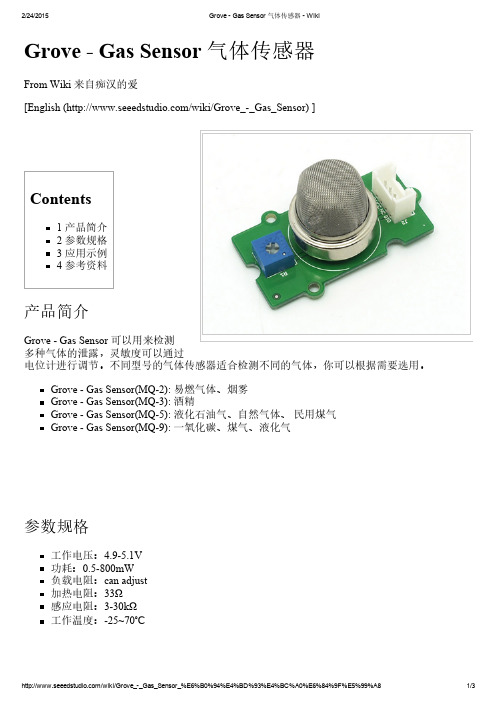
Grove Gas Sensor 气体传感器
From Wiki 来自痴汉的爱 [English (/wiki/Grove__Gas_Sensor) ]
Contents
RetrievBiblioteka d from "/wiki/index.php?title=Grove__Gas_Sensor_气体传感器 &oldid=38885"
This page was last modified on 17 September 2013, at 09:05. This page has been accessed 1,888 times.
*/ #define Vref 4.95 void setup() {
Serial.begin(9600); }
void loop() { float vol; int sensorValue = analogRead(A0); vol=(float)sensorValue/1023*Vref; Serial.print("The voltage is "); Serial.println(vol); delay(100);
参数规格
工作电压:4.95.1V 功耗:0.5800mW 负载电阻:can adjust 加热电阻:33Ω 感应电阻:330kΩ 工作温度:25~70℃
/wiki/Grove__Gas_Sensor_%E6%B0%94%E4%BD%93%E4%BC%A0%E6%84%9F%E5%99%A8
}
/wiki/Grove__Gas_Sensor_%E6%B0%94%E4%BD%93%E4%BC%A0%E6%84%9F%E5%99%A8
汽车传感器中英文

汽车传感器中英文曲轴转速传感器 crankshaft sensor凸轮轴位置传感器 camshaft sensor节气门位置传感器 throttle position sensor爆震传感器 knock sensor (or detonation sensor)进气温度传感器 intake air temperature sensor进气歧管绝对压力传感器manifold absolute pressure sensor (manifold vacuum sensor) 空气流量计 air flow sensor质量型空气流量传感器 air mass sensor加速踏板位置传感器 accelerator pedal position sensor轮速传感器 wheel speed sensor车速传感器 vehicle speed sensor空气传感器 air sensor环境温度传感器 ambient sensor大气压力传感器 barometric pressure sensor双金属式温度传感器 bimetallic sensor增压器传感器 boost sensor冷却水温传感器 coolant temperature sensor曲轴传感器 crank sensor碰撞传感器 crash sensor (or impact sensor)汽缸传感器 cylinder sensor排气再循环功能传感器 erg function sensor发动机转速传感器 engine speed sensor发动机温度传感器 engine temperature sensor离地间隙传感器 ground clearance sensor霍尔效应传感器 hall-effect sensor霍尔传感器 hall sensor加热式氧传感器 heated exhaust gas oxygen sensor热氧传感器 heated oxygen sensor侧向加速度感测器 lateral acceleration sensor车内传感器 in-car sensor歧管空气温度感测器 manifold air temperature sensor进气温度传感器 manifold charge temperature sensor进气歧管温度传感器 manifold surface temperature sensor 机油油位传感器 oil level sensor机油压力传感器 oil pressure sensor大气压力传感器 atmospheric pressure sensor压差传感器 pressure differential sensor基准传感器 reference mark sensor转向压力传感器 steering pressure sensor开关传感器 switching sensor叶轮空气温度传感器 vane air temperature sensor可变磁阻传感器 variable reluctance sensor车轮滑动传感器 wheel slip sensor横摆传感器 yaw sensor热膜传感器 hot-film sensor燃油压力传感器 fuel pressure sensor (regulator)上止点传感器 TDC sensor轮胎气压传感器 tire pressure sensor防抱死制动传感器 anti-lock brake sensor差速防滑传感器 differential antiskid sensor背压[排气压力]传感器back pressure transducer堵塞报警传感器 clog warning sensor燃料成分传感器 fuel composition sensor(燃油系)燃油不足[低限]传感器 fuel low—level sensor玻璃破裂传感器 glass breakage sensor(悬架)调平[高度]传感器 leveling sensor液面[位]传感器 level sensor灯光故障传感器 light failure sensor负[载]荷传感器 load sensor主氧传感器 main oxygen sensor相位传感器 phase sensor光电传感器 photo(electric)sensor催化转化器前氧传感器 pre-catalyst lambda probe(刮水器)雨滴传感器 raindrop sensor(悬架)行驶高度传感器ride-height sensor车内温度传感器 room temperature sensor安全传感器 safety sensor副氧传感器(装在催化转化器出口后面) sub-oxygen sensor 悬架位移传感器 suspension sensor油箱(贮液罐]液面[位]传感器 tank-level sensor转[扭]矩传感器 torque sensor燃油水分传感器 water in-fuel detector[sensor]磨损传感器 wear sensor空气滤清器堵塞报警传感器 air filter clog warning sensor 车距传感器 distance sensor停车传感器 park sensor变速范围传感器 transmission range sensor。
SnO2气体传感器
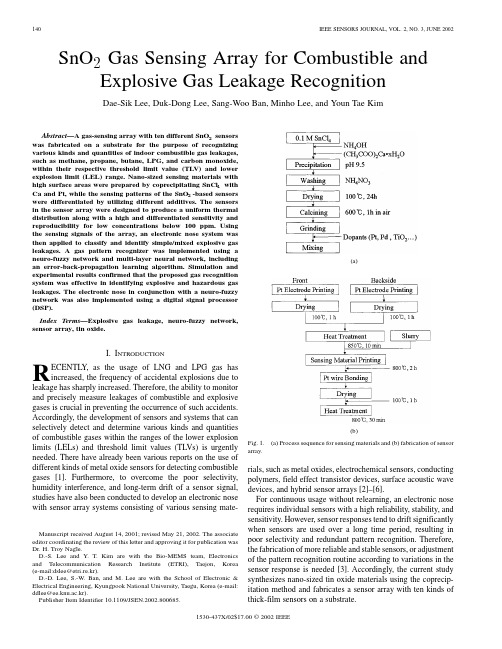
SnO2Gas Sensing Array for Combustible and Explosive Gas Leakage RecognitionDae-Sik Lee,Duk-Dong Lee,Sang-Woo Ban,Minho Lee,and Youn Tae KimAbstract—A gas-sensing array with ten different SnO2sensors was fabricated on a substrate for the purpose of recognizing various kinds and quantities of indoor combustible gas leakages, such as methane,propane,butane,LPG,and carbon monoxide, within their respective threshold limit value(TLV)and lower explosion limit(LEL)range.Nano-sized sensing materials with high surface areas were prepared by coprecipitating SnCl4with Ca and Pt,while the sensing patterns of the SnO2-based sensors were differentiated by utilizing different additives.The sensors in the sensor array were designed to produce a uniform thermal distribution along with a high and differentiated sensitivity and reproducibility for low concentrations ing the sensing signals of the array,an electronic nose system was then applied to classify and identify simple/mixed explosive gas leakages.A gas pattern recognizer was implemented using a neuro-fuzzy network and multi-layer neural network,including an error-back-propagation learning algorithm.Simulation and experimental results confirmed that the proposed gas recognition system was effective in identifying explosive and hazardous gas leakages.The electronic nose in conjunction with a neuro-fuzzy network was also implemented using a digital signal processor (DSP).Index Terms—Explosive gas leakage,neuro-fuzzy network, sensor array,tin oxide.I.I NTRODUCTIONR ECENTLY,as the usage of LNG and LPG gas has increased,the frequency of accidental explosions due to leakage has sharply increased.Therefore,the ability to monitor and precisely measure leakages of combustible and explosive gases is crucial in preventing the occurrence of such accidents. Accordingly,the development of sensors and systems that can selectively detect and determine various kinds and quantities of combustible gases within the ranges of the lower explosion limits(LELs)and threshold limit values(TLVs)is urgently needed.There have already been various reports on the use of different kinds of metal oxide sensors for detecting combustible gases[1].Furthermore,to overcome the poor selectivity, humidity interference,and long-term drift of a sensor signal, studies have also been conducted to develop an electronic nose with sensor array systems consisting of various sensing mate-Manuscript received August14,2001;revised May21,2002.The associate editor coordinating the review of this letter and approving it for publication was Dr.H.Troy Nagle.D.-S.Lee and Y.T.Kim are with the Bio-MEMS team,Electronics and Telecommunication Research Institute(ETRI),Taejon,Korea (e-mail:dslee@etri.re.kr).D.-D.Lee,S.-W.Ban,and M.Lee are with the School of Electronic& Electrical Engineering,Kyungpook National University,Taegu,Korea(e-mail: ddlee@ee.knu.ac.kr).Publisher Item Identifier10.1109/JSEN.2002.800685.(a)(b)Fig.1.(a)Process sequence for sensing materials and(b)fabrication of sensorarray.rials,such as metal oxides,electrochemical sensors,conductingpolymers,field effect transistor devices,surface acoustic wavedevices,and hybrid sensor arrays[2]–[6].For continuous usage without relearning,an electronic noserequires individual sensors with a high reliability,stability,andsensitivity.However,sensor responses tend to drift significantlywhen sensors are used over a long time period,resulting inpoor selectivity and redundant pattern recognition.Therefore,the fabrication of more reliable and stable sensors,or adjustmentof the pattern recognition routine according to variations in thesensor response is needed[3].Accordingly,the current studysynthesizes nano-sized tin oxide materials using the coprecip-itation method and fabricates a sensor array with ten kinds ofthick-film sensors on a substrate.1530-437X/02$17.00©2002IEEE/Ca,Pt powder was used as the basematerial.To prepare the raw materials,a solution containingSnClCOCa O and,H O was copre-cipitated by controlling the pH.The powder was then washed,dried,and calcined in an electric furnace at 600to reduce the grain size and enhance the gas-sensing prop-erties of the ing this powder as the base material,ten kinds of sensing materials with different additives,i.e.,none,Pt(1wt.%),La(5wt.%),CuO (5wt.%),Pd (3wt.%),Sc (3wt.%),TiO (10wt.%),ZnO (1wt.%),and Pd(3)(1wt.%),were uniformly mixed to modify the sen-sitivity spectrum of the sensors,based on previous results [8].The process sequence is shown in Fig.1(a).The sequential process used to fabricate the sensor array is shown in Fig.1(b).The sensing films were all prepared using the silk printing technique.After being simultaneously deposited by silk printing,the sensing films were then annealed at 8001.2cmC.Thesensor signals were transferred to a test system and monitored using a personal computer in a testing chamber.The microstructure of the basic sensing-film was investigated using a transmission electron microscope (TEM)and X-ray diffraction (XRD),while a voltage detecting method wasusedFig.2.Photograph of fabricated sensorarray.Fig.3.Crystalline size of SnObase powders as a function ofCH100(%)whereandare the electrical resistances in explosive gas and humid air,respectively.(a)(b)(c)(d)(e)Fig.5.Response of fabricated sensors array to four combustible gases;(a)methane,(b)butane,(c)propane,(d)carbon monoxide,and(e)LPG.III.R ESULTS AND D ISCUSSIONA.Microstructure and Gas-Sensing Characteristics of SnO/Pt,Ca powders as a function of the an-nealing temperature revealed that the peak patterns followed the tetragonal structure(JCPDS card no.41-1445)of the commer-cial powder(99.9%,Aldrich Co.).Xu et al.demonstrated that SnOpowders as a function of the heating temperature in the case of adding Ca and/or Pt at 0.1wt.%was measured by TEM analyzes,as shown in Fig.3, which revealed that Ca suppressed the grain growth of the SnO/Ca(0.1wt%)exhibited the smallest grain size of6nm under600/Ca(0.1wt%)and SnO-based thick films to gases can be modulated as a function of temperature.Plus,small water molecules are also known to appear on the surface of SnO C[11].Therefore,the operating tem-perature for the sensors in the array was set at400C,as shown in Fig.4.To prepare the various concentrations,the pure gases to be tested was injected by a syringe to a chamber with the volume of10liter and mixed the gases evenly with the atmo-spheric air using a small fan.SnO/Pt,Ca(0.1wt.%)was finally used as the base material for the sensor array.The operating temperature of the sensors in the array was set at400-Based Thick Film Sensors for Combustible GasesIt is known that the sensitivity of SnO-based thick-film sensors to combustible gases(methane,propane,butane,LPG,and carbon monoxide)within a concentration range of0C is shown in Fig.5.The sensors exhibited a good sensitivity and linearity to the combustible gas concentration. All the SnOC.sensors in the sensor array.Accordingly,the ability of thesensor array to recognize various kinds and quantities of combustible gases was determined to range from0,WOObase material,while the other sensingmaterials showed a lower sensitivity to methane compared tothe base material.Similarly,those materials,including V,TiOO,Sc,Z n O,o r P d,w e r e m o r e s e n s i t o p r o p a n e o r b u t a n e t h a n t h e p u r e S n OFig.8.PCA results of sensing data obtained from sensor array.materials were less sensitive.For carbon monoxide,the sensingmaterials,including V,La ,Z n O ,P d ,W O .A c c o r d i n g l y ,t h e n o b l e m e t a l o r o x i d e a d d i t i v e s a p p e a r e dt o c o n f e r d i f f e r e n t i a t e d s e n s i t i v i t y p a t t e r n s o n t h e S n OC i s s h o w n i nF i g .6.H e r e ,t h e g a s r e a c t i o n b e g a n t o s a t u r a t e w i t h i n 33m i n ,i n s i t u .T h e s e n s o r s a l s o e x h i b i t e d v a r i o u s g a s -s e n s i n g c u r v e s a c c o r d i n g t o t h e k i n d o f a d d i t i v e .W a t e r m o l e c u l e s a r e k n o w n t o i n t e r f e r e w i t h t h e s e n s i t i v i t yo f g a s s e n s o r s .B a s e d o n p r e v i o u s r e s u l t s i n d i c a t i n g t h e a p p e a r -a n c e o f s m a l l w a t e r m o l e c u l e s o n t h e s u r f a c e o f S n O C [11],[12],t h e r e s p o n s e o f t h e s e n s o r s t o 500p p m o f L P G w a s i n v e s t i g a t e d ,a s s h o w n i n F i g .7.O n l y a m i n i m a l a m o u n t o f i n t e r f e r e n c e w i t h t h e s e n s i t i v i t y w a s o b s e r v e d a t a ne l e v a t e d t e m p e r a t u r e of 400C w o u l d m i n i m i z e t h e i n t e r f e r i n g e f f e c t o f w a t e r o n t h es e n s i n g p r o p e r t i e s o f t h e s e n s o r s .T h e p o s s i b i l i t y o f c l a s s i f y i n g v a r i o u s k i n d s a n d q u a n t i t i e s o fs i m p l e /m i x e d c o m b u s t i b l e g a s e s c a n b e a c h i e v e d u s i n g a p r i n -c i p a l c o m p o n e n t a n a l y s i s (P C A )t h a t m a p s m u l t i -d i m e n s i o n a l d a t a o n t o t w o -o r t h r e e -d i m e n s i o n a l a x e s w i t h a m i n i m u m l o s s o f i n f o r m a t i o n .A f t e r t h e d a t a o b t a i n e d f r o m t h e e x p e r i m e n t a l r e s u l t s w a s m e a s u r e d u s i n g f o u r r e p e t i t i v e x p e r i m e n t ,i t w a s t r a n s p o s e d o n t o t w o a x e s ,a s s h o w n i n F i g .8,t h e r e b y d e m o n -F i g .9.A r c h i t e c t u r e o f p r o p o s e d t w o -s t e p r e c o g n i t i o n s y s t e ms t r a t i n g t h e a b i l i t y t o r o u g h l y c l u s t e r p o i n t s a c c o s p e c i e s a n d q u a n t i t y.H o w e v e r ,i t w a s d i f f i c u l t t o c1000p p m o f p r o p a n e a n d 500p p m o f b u t a n e d u e t o t p r o x i m i t y t o e a c h o t h e r.T h e r e f o r e ,t o p r e c i s e l y c l w i t h s i m i l a r c h a r a c t e r i s t i c s a n d o v e r c o m e s t a t i s t i a g a s p a t t e r n r e c o g n i z e r u s i n g a m u l t i -l a y e r n e u r a l e m p l o y e d a l o n g w i t h a n e r r o r -b a c k -p r o p a g a t i o n l e r i t h m .C .I m p l e m e n t a t i o n o f G a s P a t t e r n R e c o g n i z e r a n d R e c o g n i t i o n S y s t e m F i g .9s h o w s t h e s t r u c t u r e o f t h e p r o p o s e d g a s m e s y s t e m ;t h e s t r u c t u r e o f t h e n e u r a l n e t w o r k a s t h e g a n d t h e s t r u c t u r e o f t h e n e u r o -f u z z y n e t w o r k a s t c e n t r a t i o n r e c o g n i z e r.T h a t i s ,t h e p r o p o s e d c o m r e c o g n i t i o n s y s e m i n c l u d e s t w o p a t t e r n a n a l y z e r n e t w o r k w a s i p l em e n t e d t o i d e n t i f y t h e k i n d o frepresents the center values of the output vir-tual membership functions,which is determined by considering the sensor characteristics(a)(b)(c)(d)(e)Fig.11.Examples of combustible gas classification results based on learning data (left side:sensitivity of sensor array,right side:classification results);(a)methane 250ppm,(b)butane 1000ppm,(c)propane 500ppm,(d)LPG 3000ppm,and (e)carbon monoxide 3000ppm.As shown in Table I,the neuro-fuzzy gas concentration recog-nizer generated correct recognition results for the learning data with additive random noise of about 5%.As shown in Table II,the neuro-fuzzy network for the gas concentration recognizer exhibited good generalization results for the test data.As shown in Tables I and II,the average errors for the recognition results wereusually10%.These experimental results are very reasonable because a variation in the sensitivities of the sensor array and the low-res-olution representation of the sensitivity can generate variationsin the sensitivities of the sensors ofabout-gas sensing array system with a neuro-fuzzy pattern recognizer was implemented as an electronic nose system for monitoring leakages of combustible and explosive gases.SnOC to reduce the water interference on the sensors.Ten SnOTABLE IM EASUREMENT R ESULTS FOR G AS C ONCENTRATIONS U SED TO T RAINN EURO -F UZZY NETWORKTABLE IIM EASUREMENT R ESULTS FOR G AS C ONCENTRATIONS NOT U SED TO T RAINN EURO -F UZZY NETWORKeral additives,including Pt,Pd,Au,CuO,La ,Sc ,TiO,or ZnO,were mixed with the base material.The resulting sensor array exhibited high and selective sensitivities to low gas concentrations at 400,”Sens.Actuators B ,vol.1,pp.93–96,1990.[4] D.-D.Lee and D.-S.Lee,“Environmental gas sensors,”IEEE Sensors ,vol.1,pp.214–224,Oct.2001.[5]K.C.Persaud,S.M.Khaffaf,J.S.Payne,D.H.Lee,and H.G.Byun,“Sensor array techniques of mimicking the mammalian olfactory system,”Sens.Actuators B ,vol.35-36,pp.267–273,1996.[6]C.-F.Mandenius,T.Eklov,and I.Lundstrom,“Sensor fusion with on-line gas emission multisensor arrays and standard process measuring devices in Baker’s yeast manufacturing process,”Biotechnol.Bioeng.,vol.55,no.2,pp.427–238,1997.[7]Y .H.Hong and D.D.Lee,“Gas sensing characteristics of SnO,H ,”S u r f .S c i .,v o l .86,p p .335–343,1979.[13]M .L e e ,S .-Y.L e e ,a n d C .-H .P a r k ,“N e u r o -f u z z y i d e n t it r o l l e r s ,”J .I n t e l l .F u z z y S y s t .,v o l .2,p p .1–14,1994.[14]S .H a y k i n ,N e u r a l N e t w o r k s ;A C o m p r e h e n s i v e F o u n d a t i o n.New York:Macmillan,1994.[15] D.-S.Lee,J.-W.Lim,J.-S.Huh,H.-G.Byun,and D.-D.Lee,“An electricnose for recognizing combustible gases using thick film sensor array and neural network,”in Electron.Noses Olfaction 2000,J.W.Gardner and K.C.Persaud,Eds.London,U.K.:IOP,2000,pp.107–113.。
气体传感器使用说明书

FEATURES:The GasPoint transmitter provides a 4-20 mA output signal that can be technology and microcontroller based operation, the GasPoint provides continuous monitoring of hazardous gases.The GasPoint transmitter can accept any GasPoint sensor type:arefi eld-interchangeable.Full function sensor integrity test (auto) continuously advises gassensing ability and life endedNon-intrusive, one-person calibration with auto zero andauto spanEquipped with three 5-amp relay contacts—two gas alarm relays(low/high) and fault alarm. Field-selectable normally energized/de-energized and latching/non-latching alarm relay functions.Two backlit alphanumeric LCDs advise all environmental and gashazard conditions as well as instrument and sensor statusaway; combustible sensors over 1,550 ft./475 m. Kit can be installed at any time.Alarm setpoints displayed on demand—simply press the external buttonField programmable alarm levelsBacklight (auto) in low light conditions and alarm Extensive fault diagnostics2-way digital communication using MODBUS moduleOne Transmitterwith interchangeable electrochemical, infrared and catalytic plug-in sensorsR ATINGS AND C ERTIFICATIONS :Locally distributed by:n Class I, Div. 1, Groups B, C, D (LEL and IR models)Class I, Div. 1, Groups B, C, D; Class II, Div. 1, Groups E, F, G (toxic models only)Explosion-proof: ANSI/ISA: UL 1203; CSA: C22.2 No 30Combustible Performance Standards: ANSI/ISA: ISA-S12.13; CSA: C22.2 No 152S PECIFICATIONSM ONITOR : 3-wire, 4-20 mA gas transmitter with advanced microcontroller-based circuitryPower Input: 12 to 32 volts DCOutput Current:Normal Operation: Isolated linear 4-20 mA output Calibration Mode: Steady 3 mA (auto reset to normal operation)Fault Mode: 2 mA signal (and less) Power Consumption:Toxic Versions: 40 mA at 24 VDC Combustible Version: 100 mA at 24 VDCRelays: 50 mA per relay at 24 VDC S ENSORS : Plug-in, smart sensorsDetection Type:Combustible gases: catalytic or IR; Toxic gases and Oxygen: electrochemical Self-Test::Automatic daily self-test of sensor integrity and sensor life Relative Humidity:5 to 95% RH non-condensingDrift:Zero: <5% per year; Span: <10% per year*Factory default setting**Note: Cl 2 not rated for Class I, Div. 1C ALIBRATION :Non-intrusive, via pushbuttonAuto zero and auto spanD ISPLAYS :Two backlit liquid crystal displaysLCD 1 3-digit continuous readout of the gas present (ppm, % LEL or %v/v)LCD 2 Alphanumeric diagnostic status display Alarm Setpoints: Two setpoints: user-selectableR ELAY C ONTACTS :Three SPDT relays; 5 amps at 250 VACLOW/HIGH: Field selectable for normally energized/de-energized and latching/ non-latchingFAULT: Normally energized and non-latchingT RANSMISSION R ANGES : Relay contacts not considered. (For ranges with relays see manual.)1 Large, backlit LCD readout of gas concentration2 Alphanumeric LCD showing transmitter STATUS and diagnostics3 Non-intrusive calibration via simple pushbutton4 Interchangeable sensor types: LEL (catalytic or IR), toxic gas or oxygen with common transmitter assembly5 Three relays: two gas alarm relays, one fault relayDUE TO ONGOING RESEARCH AND PRODUCT IMPROVEMENT, SPECIFICATIONS ARE SUBJECT TO CHANGE WITHOUT NOTICE.C ONTROLS :Calibration: Non-intrusive via external pushbuttonAlarm Setpoints: Simple up/down pushbuttons with LCD readout of setpoints P HYSICAL :Size: 6.8 x 7 x 4.3 inches / 17 x 17.8 x 10.8 cm (approx.)Weight: 4.85 lb. / 2.2 kg (approx.)Transmitter:Nema 4, explosion-proof, anodized aluminum enclosure with mounting fl anges Sensor: Stainless steel enclosureW ARRANTY : Instrument: 2 years non-prorated; Sensor: 2 years full replacement warranty43。
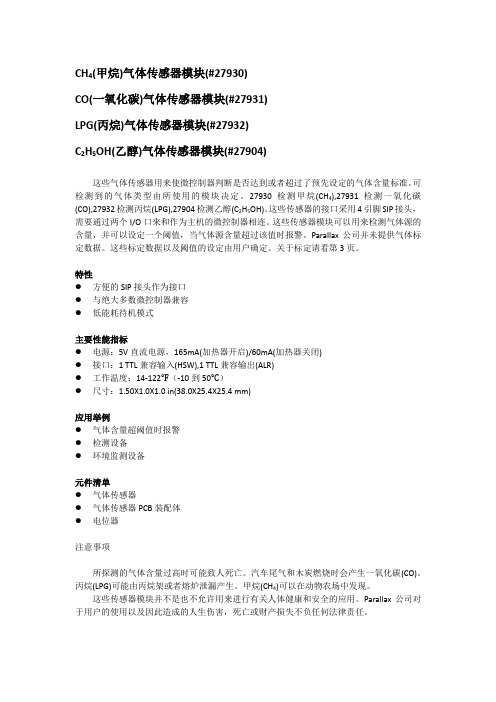
工业级甲烷CH4气体传感器NC-300S(英文)

Technical Information(C a t a l y t i c T y p e G a s S e n s o r)Model NC-300S(Single Header Type)For Industrial Application深圳市深国安电子科技有限公司地址:广东省深圳市龙华新区牛栏前大厦C507 蒋小姐:134 2876 2631 电话:86 755-85258900网址:www.singoan.com www.singoan.com.cn www.shenguoan.com1.GeneralCatalytic type gas sensor NC series were developed for industrial applications, and NC-300S is a single header type gas sensor for general combustible gases. Shape, supply voltage and current are compatible with other sensor, however reliability, repeatability, stability and responsibility are quite superior to others, additionally the durability in strict circumstance are quite excellent. Features and typical applications are as follows.2.Features and applications1)Features・Good stability・Excellent repeatability and detection accuracy・Good linearity against gas concentration・Quick response・Down sizing for design flexibility of gas alarm or detector2)Applications・Fixed type gas alarm or detector for general combustible gases・Gas densitometer3.Ratings1)Supply voltage to sensor AC 2.0 +/- 0.1V(50-60Hz)DC 2.0 +/- 0.1V2)Current (when 2.0V is supplied) AC 300 +/- 20mA(50-60Hz)DC 300 +/- 20mA3)Ambient temperature and humidity in operationTemperature -20 - +60 degree CHumidity Less than 95%RH(without dew condensation)4)Ambient temperature and humidity in storageTemperature -30 - +70 degree CHumidity Less than 99%RH(without dew condensation)5)Detection range 0 – around 60%LELLower accuracy over 60%LEL(Except acetylene)4.Specification1)Zero offset value in air 0 +/- 30mV(without trimming resistor)2)Minimum sensitivity 40mV/1% of methane3)Response time Less than 8 sec. at T90Less than 3 sec. at T504)Linearity Effectively linear to 60%LEL5)Detection accuracy +/- 1%LEL深圳市深国安电子科技有限公司地址:广东省深圳市龙华新区牛栏前大厦C507 蒋小姐:134 2876 2631 电话:86 755-85258900网址:www.singoan.com www.singoan.com.cn www.shenguoan.com6) Span drift Less than 1%LEL/month 7) Zero offset drift Less than 0.5%LEL/month 8) Warranty period 24 months 5.Appearance and dimensionFig. 1 : Appearance and dimensions6. Measuring circuit diagramI n p u t (+)I n p u t (G N D )Fig. 2 : Recommended circuit diagram (R1, 2 : 200ohm, VR1 : 3Kohm)7. Gas sensitivity characteristics深圳市深国安电子科技有限公司地址:广东省深圳市龙华新区牛栏前大厦C507 网址:www.singoan.com www.singoan.com.cn www.shenguoan.com蒋小姐:134 2876 2631 电话:86 755-85258900Fig. 3 : Gas sensitivity characteristics8.Temperature dependence at 60%RHFig. 4 : Temperature dependence of zero offset深圳市深国安电子科技有限公司地址:广东省深圳市龙华新区牛栏前大厦C507 网址:www.singoan.com www.singoan.com.cn www.shenguoan.com蒋小姐:134 2876 2631 电话:86 755-85258900Fig. 5 : Temperature dependence of relative sensitivity to methane9.Humidity dependenceFig. 6 : Humidity dependence of zero offset(at 25 degree C)深圳市深国安电子科技有限公司地址:广东省深圳市龙华新区牛栏前大厦C507 网址:www.singoan.com www.singoan.com.cn www.shenguoan.com蒋小姐:134 2876 2631 电话:86 755-85258900Fig.7 : Humidity dependence of relative sensitivity to methane10.Long term stabilityFig. 8 : Long term stability of relative sensitivity to methane11.Sensitivity distributionFig. 9 : Sensitivity distribution深圳市深国安电子科技有限公司地址:广东省深圳市龙华新区牛栏前大厦C507 网址:www.singoan.com www.singoan.com.cn www.shenguoan.com蒋小姐:134 2876 2631 电话:86 755-8525890012.Relative sensitivity(In case that sensitivity to methane is 100.)Gas/Vapor Chemical formula LEL (%) Relative sensitivityStd. Methane CH4 5.0 1001 Acetone (CH3)2CO 2.6 602 Ethanol C2H5OH 3.3 703 Ethyl acetate CH3COOC2H5 2.2 604 Ethylene C2H4 2.7 855 Hydrogen H2 4.0 1106 Iso-propanol CH3-C2H4OH 2.2 607 Methanol CH3OH 6.7 1008 Methyl ethyl ketone CH3-CO-C2H5 1.9 459 N-butane C4H10 1.8 7010 N-heptane C7H16 1.05 5511 N-hexane C6H14 1.2 6512 N-pentane C5H12 1.4 7013 Propane C3H8 2.1 7514 N-octane C8H18 0.95 5015 Toluene C6H5CH3 1.2 6016 Ammonia NH3 15.0 13017 Carbon monoxide CO 12.5 11018 Unleaded petrol 1.2 65Remarks)If other data are required, please contact us since sensitivity of many combustible gases except bad smell, dangerous, poisonous and high boiling temperature materials over 120 degree C are available for investigations.13. Durability1)Exposure in hydrogen sulfideTest conditionsSensors were exposed in 50%LEL of methane and 25ppm of hydrogen sulfide for 1hr. at normal temperature and humidity.No.Before test (mV) After test (mV)Zero offset Relative sensitivity to CH4 Zero offset Relative sensitivity toCH41 5.6 100 6.8 992 21.2 100 22.8 973 -17.9 100 -15.4 924 0.2 100 2.2 945 27.9 100 29.1 92深圳市深国安电子科技有限公司地址:广东省深圳市龙华新区牛栏前大厦C507 蒋小姐:134 2876 2631 电话:86 755-85258900网址:www.singoan.com www.singoan.com.cn www.shenguoan.com2)Exposure in HMDSTest conditionsSensors were exposed in 50%LEL of methane and 10ppm of HMDS for 1hr. at normal temperatureand humidity.No.Before test (mV) After test (mV)Zero offset Relative sensitivity to CH4 Zero offset Relative sensitivity to CH41 11.0 100 11.6 642 14.4 100 14.7 603 22.9 100 22.6 684 12.7 100 13.7 765 -19.4 100 -17.1 753)Exposure in high concentration of methaneTest conditionsSensors were exposed in 8% (160%LEL) of methane at normal temperature and humidity for 1hr.No.Before test (mV) After test (mV)Zero offset Relative sensitivity to CH4 Zero offset Relative sensitivity to CH41 -3.6 100 -1.3 982 -18.1 100 -16.2 1013 -10.7 100 -8.5 944 14.8 100 16.5 925 28.3 100 30.4 944)Drop testTest conditionsSensors were dropped from the height of 30cm onto the wood board of 3cm thickness with free fallby 3 times.No.Before test (mV) After test (mV)Zero offset Relative sensitivity to CH4 Zero offset Relative sensitivity to CH41 7.1 100 8.8 99-8.3 100 -8.8 100 23-5.4 100 -5.2 103-1.3 100 -1.2 100 4-2.0 100 -0.5 102 55)Vibration testTest conditionsVibration which is 10Hz with the 4mm of amplitude for 20min. to 3 directions of X, Y and Z wasadded to sensors at normal temperature and humidity.test(mV)testNo. Before(mV) After深圳市深国安电子科技有限公司地址:广东省深圳市龙华新区牛栏前大厦C507 蒋小姐:134 2876 2631 电话:86 755-85258900网址:www.singoan.com www.singoan.com.cn www.shenguoan.comZero offset Relative sensitivity to CH4 Zero offset Relative sensitivity to CH41 20.4 100 20.9 1002 11.8 100 12.7 1003 -11.6 100 -11.9 100-28.4 100 -29.4 100 45 0.3 100 1.4 1016)Storage in high temperature and humidityTest conditionsSensors were stored in 60 degree C, 90%RH for 1000hrs. without being energized.No.Before test (mV) After test (mV)Zero offset Relative sensitivity to CH4 Zero offset Relative sensitivity to CH41 24.8 100 26.3 992 21.9 100 23.2 953 18.4 100 20.0 954 14.4 100 15.6 975 2.5 100 2.4 997)Operation in high temperature and humidityTest conditionsSensors were energized in 60 degree C, 90%RH for 1000hrs.No.Before test (mV) After test (mV)Zero offset Relative sensitivity to CH4 Zero offset Relative sensitivity to CH41 24.1 100 25.1 972 3.2 100 2.7 953 -9.7 100 -10.3 954 12.5 100 13.2 955 17.7 100 18.1 918)Storage in low temperatureTest conditionsSensors were stored in -20 degree C for 1000hrs.No.Before test (mV) After test (mV)Zero offset Relative sensitivity to CH4 Zero offset Relative sensitivity to CH41 11.1 100 11.8 1002 18.5 100 18.3 973 20.9 100 21.7 974 -22.3 100 -23.5 955 2.2 100 3.0 9914. Evaluation method深圳市深国安电子科技有限公司地址:广东省深圳市龙华新区牛栏前大厦C507 蒋小姐:134 2876 2631 电话:86 755-85258900网址:www.singoan.com www.singoan.com.cn www.shenguoan.com1.Test equipmentOutline of test equipment is as follows.Remarks on equipments)A)Test chamber・Material of test chamber is to be inactive like metal, glass or acrylic resin which does not exhale and adsorb gases.・V olume of test chamber is to be more than 1 litter per 1pc. of sensor.B)Circumstance・Clean circumstance is recommended as evaluation area. Dirty circumstance which contains combustible gases like organic solvent vapor is to be avoided.C)Gas densitometer・Laser gas densitometer is recommended, but volume method is available simply.D)Agitation in test chamber・Air agitation in test chamber is to be conducted carefully in order not to flow air to sensor directly. Air velocity to sensor is to be less than 0.5m/sec.E)Power supply・Both of AC power and DC power are available for sensor, however DC power supply is recommended for accurate evaluation.F)Digital volt meter・Since the impedance of sensor is fairly low, general digital volt meter having over 100kohm as input impedance is sufficiently available.G)Ventilation・Ventilator with ventilation capacity of over 10 times/min. of the volume of test chamber is recommended for the convenient evaluation.H)Installation position of sensor in test chamber深圳市深国安电子科技有限公司地址:广东省深圳市龙华新区牛栏前大厦C507 蒋小姐:134 2876 2631 电话:86 755-85258900网址:www.singoan.com www.singoan.com.cn www.shenguoan.com・When the sensor is installed in test chamber, it should be careful that each sensor is to be in constant position because output signal changes in case that position of sensor changes. If the rough evaluation is carried out, such careful treatment is not necessary.2.Adjustment of gas concentrationAdjustment of gas concentration is to be conducted by volume method or by using laser gas densitometer. In case of volume method, gas volume to be injected into a chamber is obtained from the calculation formula below described.V m Vi C Tr Tc()l=++−・・102732736V: Gas volume to be injectedVi: V olume of test chamber()m lTc: Temperature in test chamber(℃)Tr: Room temperature(℃)C: Target gas concentration (ppm)3.Evaluation methodA.Preliminary aging・Before evaluation of sensor, preliminary aging at rated voltage for over 1 hr. is recommended for accurate evaluation.B.Measurement・At first, output voltage in clean air is measured. It should be confirmed that output voltage has to be stable without fluctuation.・Output voltage is measured around 1min. later after the designated volume of gas is injected intoa test chamber.・Inside of test chamber should be substituted of clean air by ventilator.4.Notice on handling・Sensor is to be gently handled without adding shock or dropping.・Handling in a location which corrosive gases or poisonous gases exist is to be avoided.・Sensor does not have to be dipped in water.・Sensor does not have to be disassembled.・Do not cut pins in any case.・It has explosion proof structure, however it is recommended to be assembled in an approved body.深圳市深国安电子科技有限公司地址:广东省深圳市龙华新区牛栏前大厦C507 网址:www.singoan.com www.singoan.com.cn www.shenguoan.com蒋小姐:134 2876 2631 电话:86 755-85258900。
传感器中英文介绍
. sensorssensors(English name: transducer/sensor) is a kind of detection device, can feel the measured information, and will feel information transformation according to certain rule become electrical signal output, or other form of information needed to satisfy the information transmission, processing, storage, display, record and control requirements.Sensor's features include: miniaturization, digital, intelligent, multi-functional, systematic and network. It is the first step of automatic detection and automatic control. The existence and development of the sensor, let objects have sensory, such as touch, taste and smell let objects become live up slowly. Usually according to its basic cognitive functions are divided into temperature sensor, light sensor, gas sensor, force sensor, magnetic sensor, moisture sensor, acoustic sensor, radiation sensitive element, color sensor and sensor etc. 10 major categories.temperature transducerTemperature sensors (temperature transducer) refers to can feel temperature translates into usable output signal of the sensor. The temperature sensor is the core part of the temperature measuring instrument, wide variety. According to measuring methods could be divided into two types: contact and non-contact, according to the sensor material and electronic component features divided into two categories, thermal resistance and thermocouple.1 principle of thermocoupleThermocouple is composed of two different materials of metal wire, the welded together at the end. To measure the heating part of the environment temperature, can accurately know the temperature of the hot spots. Because it must have two different material of the conductor, so called the thermocouple. Different material to make the thermocouple used in different temperature range, their sensitivity is also each are not identical. The sensitivity of thermocouple refers to add 1 ℃hot spot temperature changes, the output variation of potential difference. For most of the metal material support thermocouple, this value about between 5 ~ 40 microvolt / ℃.As a result of the thermocouple temperature sensor sensitivity has nothing to do with the thickness of material, use very fine material also can make the temperature sensor. Also due to the production of thermocouple metal materials have good ductility, the slight temperature measuring element has high response speed, can measure the process of rapid change.Its advantages are:(1)high precision measurement. Because of thermocouple direct contact with the object being measured, not affected by intermediate medium.(2)the measurement range. Commonly used thermocouple from 1600 ℃to 50 ℃ ~ + sustainable measurement, some special thermocouple minimum measurable to - 269 ℃ (e.g., gold iron nickel chrome), the highest measurable to + 2800 ℃ (such as tungsten rhenium).(3) simple structure, easy to use. Thermocouple is usually composed of two different kinds of metal wire, but is not limited by the size and the beginning of, outside has protective casing, so very convenient to use. The thermocouple type and structure of the form.2. The thermocouple type and structure formation(1)the types of thermocoupleThe commonly used thermocouple could be divided into two types: standard thermocouple and non-standard thermocouple. Standard thermocouple refers to the national standard specifies its thermoelectric potential and the relationship between temperature, permissible error, and a unified standard score table of thermocouple, it has with matching display instrument to choose from. Rather than a standard thermocouple or on the order of magnitude less than the range to use standardized thermocouple, in general, there is no uniform standard, it is mainly used for measurement of some special occasions.Standardized thermocouple is our country from January 1, 1988, thermocouple and thermal resistance of all production according to IEC international standard, and specify the S, B, E, K, R, J, T seven standardization thermocouple type thermocouple for our country unified design.(2)to ensure that the thermocouple is reliable, steady work, the structure of thermocouple requirements are as follows:①of the two thermocouple thermal electrode welding must be strong;②two hot electrode should be well insulated between each other, in case of short circuit;③compensation wires connected to the free cod of a thermocouple to convenient and reliable;④protect casing thermal electrodes should be able to make sufficient isolation and harmful medium.3.The thermocouple cold end temperature compensationDue to the thermocouple materials are generally more expensive (especiallywhen using precious metals), and the temperature measurement points are generally more far, the distance to the instrument in order to save materials, reduce cost, usually adopt the compensating conductor) (the free end of the cold junction of the thermocouple to the steady control of indoor temperature, connected to the meter terminals. It must be pointed out that the role of the thermocouple compensation wire extension hot electrode, so that only moved to the control room of the cold junction of the thermocouple instrument on the terminal, it itself does not eliminate the cold end temperature change on the influence of temperature, cannot have the compensation effect. So, still need to take some of the other correction method to compensate of the cold end temperature especially when t0 indicates influence on measuring temperature 0 ℃.Must pay attention to when using thermocouple compensating conductor model match, cannot be wrong polarity, compensation conductor should be connected to the thermocouple temperature should not exceed 100 ℃.传感器传感器(英文名称:transducer/sensor)是一种检测装置,能感受到被测量的信息,并能将感受到的信息,按一定规律变换成为电信号或其他所需形式的信息输出,以满足信息的传输、处理、存储、显示、记录和控制等要求。
气体传感器翻译
连接与测试 将气体传感器过滤器插入模块前方的狭槽。 气体传感器本质上是电阻性器件而不是两极 性器件,因此不用担心将其插反。无论安装时的方向如何都可正常工作。 4 引脚接头可以方便地将气体传感器插入面包板或 SIP 槽。 4 个引脚的定义如下图所示。 与像基板这样的 5V 微处理器相连是最直接的方法,只需要两个 I/O 口;一个输入口检测报 警信号,另一个输出口用来控制内部热源。 与一个像 Propeller 板这样的 3.3V 微处理器相连时,需要用到一个 3.9 千欧(10 千欧也 可)的电阻来将 ALR 输出与 Propeller 板输入口相连。为了便于 Propeller 板控制接头开关输 出(HSW)需要一个 NPN 型三极管,例如 2N3904 和一个 1 千欧电阻。接线图如下所示。
*HSW 线由一个 10 千欧电阻上拉至 5V。 注意:传感器震动时可能会发出咯咯声——这是正常现象。 工作原理 该气体传感器模块采用 Hanwei 电子的气体传感器。当内置加热元件被激活时,传感器 对特定的气体传声响应, 其电阻随元件周围的空气中的气体含量的增加而线性减小。 该电阻 是由传感器内部和电位器 R3 共同构成的分压电阻的一部分。分压电阻的输出就是两个 LT1013 双通道运算放大器集成电路的输入信号。运算放大器 A 被配置成具有单位增益的缓 冲器,用来给 TP1(+)和 TP2(-)提供一个零载荷测试点的信号电压。该信号电压输入给 运算放大器 B,运算放大器 B 被配置成比较器,其反相输入端的参考电压由 R4 的断路电平
引脚定义 引脚 E1 E2 E3 E4 TP1 TP2 TP3 TP4 名称 ALR HSW +5V GND 测试点 1+ 测试点 2测试点 3+ 测试点 4功能 输出到微控制器的警报信号 微控制器的热输入信号 +5V 直流电源 接地 传感器缓冲输出 接地 由 R4 设置的信号电平 接地 电平 0V/5V 0V/浮动 5V 0V 0V-5V 0V 0V-5V 0V
外文资料翻译---具有高灵敏度的甲醛气体传感器的制备及其气敏特性
1 外文资料翻译译文具有高灵敏度的甲醛气体传感器的制备及其气敏特性相对甲醛混有氧化铬的氧化铟气体传感器特性已经研究过了。
间接加热式气体传感器是用敏感材料进行制备的。
最终的材料的状态和传感层的形态通过x射线衍射和扫描电子显微镜分别在焙烧前后观察到其特点。
操作温度对传感器响应的影响氧化铬和氧化铟传感器的气体浓度特性的对比已经研究过了。
结果表明,在低操作温度该传感器对于甲醛具有良好的反应性能,使他们成为甲醛气体检测最有希望的候选材料。
1介绍作为一个重要的工业化学品,甲醛被应用于制造业,建筑板,胶合板和漆这样的材料。
此外,它还是消费产品中一个中间添加物,如洗涤剂和肥皂。
由于其杀菌性能也可用于药理学和药物中。
然而,调查结果表明,因为它是挥发性有害化合物,所以甲醛会对人体造成许多损害。
因此,需要一种有效的方法来监测甲醛进而进行气体环境测量与控制。
制造气体传感器被认为是一个理想的监测气体的手段。
我们目前的调查主要涉及与甲醛的检测。
虽然半导体金属氧化物气体传感器提供了对有毒气体或可燃性气体的安全检测,但是他们仍然有一定的局限性,如灵敏度,选择性,长期稳定性等等。
为了克服半导体金属氧化物气体传感器的缺点,半导体金属氧化物的制备与掺杂的研究已经做过了。
氧化铟是一个有希望的具有宽禁带的半导体材料(3.70电子伏特),其电子浓度主要取决于计量缺陷的浓度(如氧空位)就像其他金属氧化物半导体。
就传感机制来说,颗粒的大小,缺陷,表面与界面的性能和化学计量学直接影响了传感器表面的氧化物种类的状态和数量,最后影响了金属氧化物传感器的性能。
因此,为了提高并改善气体传感性能(敏感性,选择性,较好的热稳定性和较低的操作温度),氧化铟通常用于纳米结构形式或掺杂合适的贵金属和金属氧化物。
作为一个单组分氧化物,由于其良好的灵敏度,氧化铟是一种很有前途的氧化性气体检测的候选者。
因此,当其他金属氧化物掺杂氧化铟,对于不同的气体可调谐的气体灵敏度也不同。
传感器中英文介绍
. sensorssensors(English name: transducer/sensor) is a kind of detection device, can feel the measured information, and will feel information transformation according to certain rule become electrical signal output, or other form of information needed to satisfy the information transmission, processing, storage, display, record and control requirements.Sensor's features include: miniaturization, digital, intelligent, multi-functional, systematic and network. It is the first step of automatic detection and automatic control. The existence and development of the sensor, let objects have sensory, such as touch, taste and smell let objects become live up slowly. Usually according to its basic cognitive functions are divided into temperature sensor, light sensor, gas sensor, force sensor, magnetic sensor, moisture sensor, acoustic sensor, radiation sensitive element, color sensor and sensor etc. 10 major categories.temperature transducerTemperature sensors (temperature transducer) refers to can feel temperature translates into usable output signal of the sensor. The temperature sensor is the core part of the temperature measuring instrument, wide variety. According to measuring methods could be divided into two types: contact and non-contact, according to the sensor material and electronic component features divided into two categories, thermal resistance and thermocouple.1 principle of thermocoupleThermocouple is composed of two different materials of metal wire, the welded together at the end. To measure the heating part of the environment temperature, can accurately know the temperature of the hot spots. Because it must have two different material of the conductor, so called the thermocouple. Different material to make the thermocouple used in different temperature range, their sensitivity is also each are not identical. The sensitivity of thermocouple refers to add 1 ℃hot spot temperature changes, the output variation of potential difference. For most of the metal material support thermocouple, this value about between 5 ~ 40 microvolt / ℃.As a result of the thermocouple temperature sensor sensitivity has nothing to do with the thickness of material, use very fine material also can make the temperature sensor. Also due to the production of thermocouple metal materials have good ductility, the slight temperature measuring element has high response speed, can measure the process of rapid change.Its advantages are:(1)high precision measurement. Because of thermocouple direct contact with the object being measured, not affected by intermediate medium.(2)the measurement range. Commonly used thermocouple from 1600 ℃to 50 ℃ ~ + sustainable measurement, some special thermocouple minimum measurable to - 269 ℃ (e.g., gold iron nickel chrome), the highest measurable to + 2800 ℃ (such as tungsten rhenium).(3) simple structure, easy to use. Thermocouple is usually composed of two different kinds of metal wire, but is not limited by the size and the beginning of, outside has protective casing, so very convenient to use. The thermocouple type and structure of the form.2. The thermocouple type and structure formation(1)the types of thermocoupleThe commonly used thermocouple could be divided into two types: standard thermocouple and non-standard thermocouple. Standard thermocouple refers to the national standard specifies its thermoelectric potential and the relationship between temperature, permissible error, and a unified standard score table of thermocouple, it has with matching display instrument to choose from. Rather than a standard thermocouple or on the order of magnitude less than the range to use standardized thermocouple, in general, there is no uniform standard, it is mainly used for measurement of some special occasions.Standardized thermocouple is our country from January 1, 1988, thermocouple and thermal resistance of all production according to IEC international standard, and specify the S, B, E, K, R, J, T seven standardization thermocouple type thermocouple for our country unified design.(2)to ensure that the thermocouple is reliable, steady work, the structure of thermocouple requirements are as follows:①of the two thermocouple thermal electrode welding must be strong;②two hot electrode should be well insulated between each other, in case of short circuit;③compensation wires connected to the free cod of a thermocouple to convenient and reliable;④protect casing thermal electrodes should be able to make sufficient isolation and harmful medium.3.The thermocouple cold end temperature compensationDue to the thermocouple materials are generally more expensive (especiallywhen using precious metals), and the temperature measurement points are generally more far, the distance to the instrument in order to save materials, reduce cost, usually adopt the compensating conductor) (the free end of the cold junction of the thermocouple to the steady control of indoor temperature, connected to the meter terminals. It must be pointed out that the role of the thermocouple compensation wire extension hot electrode, so that only moved to the control room of the cold junction of the thermocouple instrument on the terminal, it itself does not eliminate the cold end temperature change on the influence of temperature, cannot have the compensation effect. So, still need to take some of the other correction method to compensate of the cold end temperature especially when t0 indicates influence on measuring temperature 0 ℃.Must pay attention to when using thermocouple compensating conductor model match, cannot be wrong polarity, compensation conductor should be connected to the thermocouple temperature should not exceed 100 ℃.传感器传感器(英文名称:transducer/sensor)是一种检测装置,能感受到被测量的信息,并能将感受到的信息,按一定规律变换成为电信号或其他所需形式的信息输出,以满足信息的传输、处理、存储、显示、记录和控制等要求。
气敏传感器
3.半导体原件
气体敏感元件,大多是以金属氧化物半导体为基础材料。 当被测气体在该半导体表面吸附后,引起其电学特性(例 如电导率)发生变化。流行的定性模型是:原子价控制模 型、表面电荷层模型、晶粒间界势垒模型。
4.常见的电路图
基于MC14468的烟雾传感路:
如果检测到烟雾,时钟周期T0就变成40ms,同时启动报警驱动电 路,使之打开160ms,再关断80ms。在关断期间若没有检测到烟雾, 就禁止BZ发出报警声。一旦检测到烟雾,LED就以1Hz的频率闪烁发 光,表示烟雾报警,1脚由低电平变为高电平
2.工作原理:
它将气体种类及其与浓度有关的信息转换成电信号,根据这些 电信号的强弱就可以获得与待测气体在环境中的存在情况有关的信 息,从而可以进行检测、监控、报警;还可以通过接口电路与计算 机组成自动检测、控制和报警系统。 气敏传感器就是利用这种性能在压电晶体表面涂覆一层选择性吸 附某气体的气敏薄膜,当该气敏薄膜与待测气体相互作用(化学作 用或生物作用,或者是物理吸附),使得气敏薄膜的膜层质量和导 电率发生变化时,引起压电晶体的声表面波频率发生漂移;气体浓 度不同,膜层质量和导电率变化程度亦不同,即引起声表面波频率 的变化也不同。通过测量声表面波频率的变化就可以获得准确的反 应气体浓度的变化值。
5.应用前景
随着微电脑和微电子技术的日益普及和应用,对传感器的性能、数量 及用途提出了新的需求,这就使人们更加重视对新型传感器的开发 传感器技术的发展是与新材料的研究开发密切结合在一起的,可以说, 各种新型传感器孕育在新材 所以说 气敏电阻的应用前景还是非常可观的
气敏传感器
1.概述:
何京沛 2013072019 电气131
MEMS 气体传感器简介(英文版)

•lity Spectrometry
technology of gas sensor
THE CLASSIFICATION AND THE PRINCIPLE OF SENSOR
1、 Based on the gas self photoacoustic spectroscopy and optical properties of MEMS gas sensor: Photoacoustic gas sensor consists of a modulated light source , photoacoustic cell , high sensitive microphone 3 main part of the system .
and optical properties of MEMS gas sensor
• 2、Gas sensors sensitive materials based on adsorption
principle
• 3、Gas sensor for inflammable and explosive gas
THE CLASSIFICATION AND THE PRINCIPLE OF SENSOR
According to different detection theory can be
divided into:
• 1、 Based on the gas self photoacoustic spectroscopy
INTRODUCTION AND APPLICATION
Gas detection in people's production life applications is very extensive, especially in the aspects of safety in production, such as, mine operation, gas production and transportation. Gas sensor is directly related to people's life and property safety.
SMC气体传感器
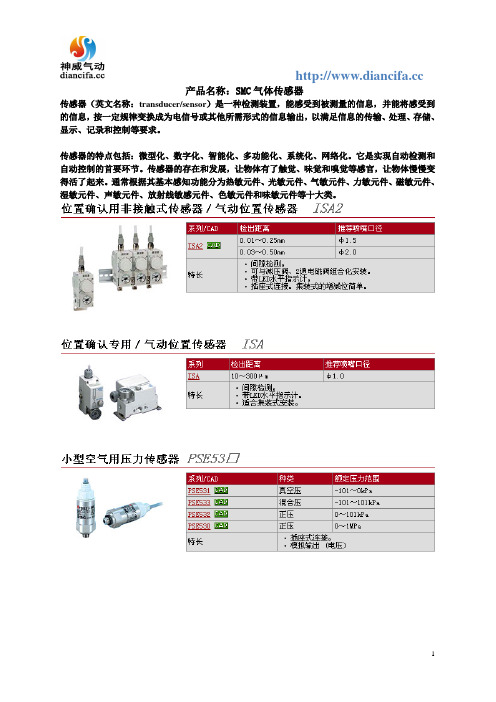
产品名称:SMC气体传感器
传感器(英文名称:transducer/sensor)是一种检测装置,能感受到被测量的信息,并能将感受到的信息,按一定规律变换成为电信号或其他所需形式的信息输出,以满足信息的传输、处理、存储、显示、记录和控制等要求。
传感器的特点包括:微型化、数字化、智能化、多功能化、系统化、网络化。
它是实现自动检测和自动控制的首要环节。
传感器的存在和发展,让物体有了触觉、味觉和嗅觉等感官,让物体慢慢变得活了起来。
通常根据其基本感知功能分为热敏元件、光敏元件、气敏元件、力敏元件、磁敏元件、湿敏元件、声敏元件、放射线敏感元件、色敏元件和味敏元件等十大类。
NDIR红外气体传感器的基本概述
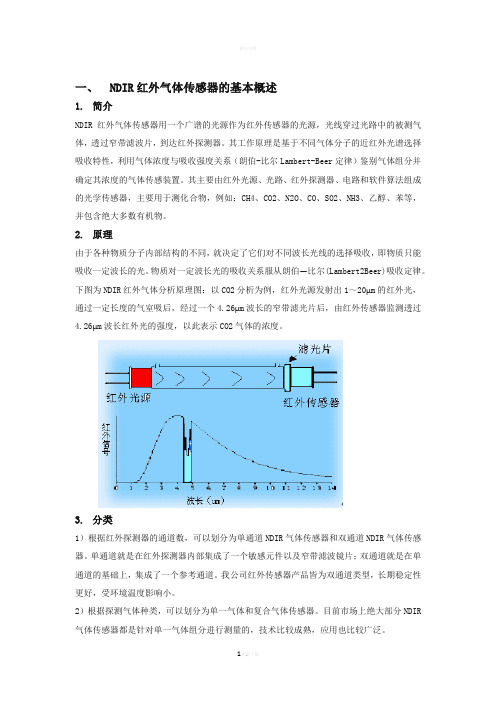
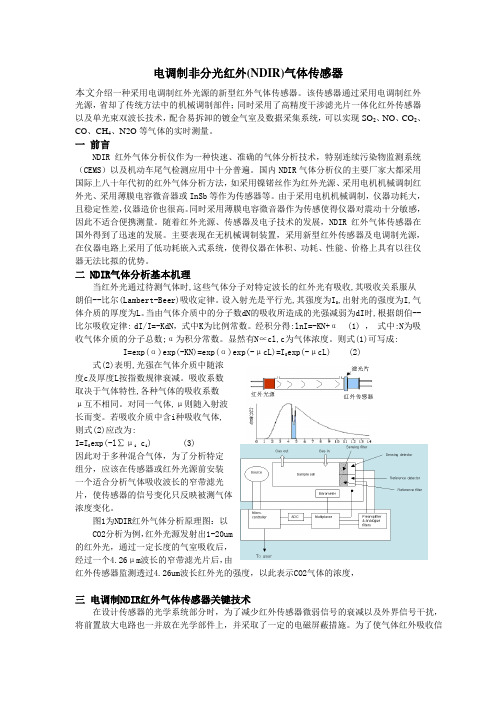
一、NDIR红外气体传感器的基本概述1.简介NDIR红外气体传感器用一个广谱的光源作为红外传感器的光源,光线穿过光路中的被测气体,透过窄带滤波片,到达红外探测器。
其工作原理是基于不同气体分子的近红外光谱选择吸收特性,利用气体浓度与吸收强度关系(朗伯-比尔Lambert-Beer定律)鉴别气体组分并确定其浓度的气体传感装置。
其主要由红外光源、光路、红外探测器、电路和软件算法组成的光学传感器,主要用于测化合物,例如:CH4、CO2、N2O、CO、SO2、NH3、乙醇、苯等,并包含绝大多数有机物。
2.原理由于各种物质分子内部结构的不同,就决定了它们对不同波长光线的选择吸收,即物质只能吸收一定波长的光。
物质对一定波长光的吸收关系服从朗伯—比尔(Lambert2Beer)吸收定律。
下图为NDIR红外气体分析原理图:以CO2分析为例,红外光源发射出1~20μm的红外光,通过一定长度的气室吸后,经过一个4.26μm波长的窄带滤光片后,由红外传感器监测透过4.26μm波长红外光的强度,以此表示CO2气体的浓度。
3.分类1)根据红外探测器的通道数,可以划分为单通道NDIR气体传感器和双通道NDIR气体传感器。
单通道就是在红外探测器内部集成了一个敏感元件以及窄带滤波镜片;双通道就是在单通道的基础上,集成了一个参考通道。
我公司红外传感器产品皆为双通道类型,长期稳定性更好,受环境温度影响小。
2)根据探测气体种类,可以划分为单一气体和复合气体传感器。
目前市场上绝大部分NDIR 气体传感器都是针对单一气体组分进行测量的,技术比较成熟,应用也比较广泛。
4.应用红外线气体分析器主要应用领域:1)石油、化工、发电厂、冶金焦碳等工业过程控制;2)大气及污染源排放监测等环保领域;3)饭店、大型会议中心等公共场所的空气监测;4)农业、医疗卫生和科研等领域;例如:(1)合成氨流程的醇化塔进(出)口,用红外气体分析器分析CO和CO2;(2)甲醇生产流程的脱碳工段,用红外气体分析器分析CO和CO2;(3)环保排放监测,用红外气体分析器分析SO2和NOx。
NDIR气体传感器
电调制非分光红外(NDIR)气体传感器本文介绍一种采用电调制红外光源的新型红外气体传感器。
该传感器通过采用电调制红外光源,省却了传统方法中的机械调制部件;同时采用了高精度干涉滤光片一体化红外传感器以及单光束双波长技术,配合易拆卸的镀金气室及数据采集系统,可以实现SO2、NO、CO2、CO、CH4、N2O等气体的实时测量。
一前言NDIR红外气体分析仪作为一种快速、准确的气体分析技术,特别连续污染物监测系统(CEMS)以及机动车尾气检测应用中十分普遍。
国内NDIR气体分析仪的主要厂家大都采用国际上八十年代初的红外气体分析方法,如采用镍锘丝作为红外光源、采用电机机械调制红外光、采用薄膜电容微音器或InSb等作为传感器等。
由于采用电机机械调制,仪器功耗大,且稳定性差,仪器造价也很高。
同时采用薄膜电容微音器作为传感使得仪器对震动十分敏感,因此不适合便携测量。
随着红外光源、传感器及电子技术的发展,NDIR红外气体传感器在国外得到了迅速的发展。
主要表现在无机械调制装置,采用新型红外传感器及电调制光源,在仪器电路上采用了低功耗嵌入式系统,使得仪器在体积、功耗、性能、价格上具有以往仪器无法比拟的优势。
二 NDIR气体分析基本机理当红外光通过待测气体时,这些气体分子对特定波长的红外光有吸收,其吸收关系服从朗伯--比尔(Lambert-Beer)吸收定律。
设入射光是平行光,其强度为I0,出射光的强度为I,气体介质的厚度为L。
当由气体介质中的分子数dN的吸收所造成的光强减弱为dI时,根据朗伯--比尔吸收定律: dI/I=-KdN,式中K为比例常数。
经积分得:lnI=-KN+α (1) ,式中:N为吸收气体介质的分子总数;α为积分常数。
显然有N∝cl,c为气体浓度。
则式(1)可写成:I=exp(α)exp(-KN)=exp(α)exp(-μcL)=I0exp(-μcL) (2)式(2)表明,光强在气体介质中随浓度c及厚度L按指数规律衰减。
各类气体传感器介绍
各类气体传感器介绍一、引言广义的说,传感器(Transducer或Sensor)是一种能把物理量或化学量转变成便于利用的电信号的器件或装置,在有些国家或科学领域,也将传感器称为变换器、检测器或探测器等。
将物理量或化学量得变化转变成电信号是传感器的最终目的。
国际电工委员会(IEC:International Electrotechnical Committee)的定义为:“传感器是测量系统中的一种前置部件,它将输入变量转换成可供测量的信号”。
国家标准GB 7765—87给传感器的定义是:能感受规定的被测量并按照一定的规律转换成可用输出信号的器件或装置,通常由敏感元件和转换元件组成。
此处的可用输出信号,一般即指易于处理和传输的电信号。
从这个角度也可以说传感器即为将非电信号转换成电信号的器件。
当然,可以预料,将来的“可用信号201D或许是光信息或者是更先进、更实用的其他信息。
本文主要介绍气体传感器的工作原理及应用场合,并对气体传感器的发展方向进行一些介绍。
二、工作原理传感器之所以具有能量信息转换的机能,在于它的工作机理是基于各种物理的、化学的和生物的效应,并受相应的定律和法则所支配。
了解这些定律和法则,有助于我们对传感器本质的理解和对新效应传感器的开发。
传感器工作物理基础的基本定律和法则有以下四种类型:(1)守恒定律。
包括能量、动量、电荷量等守恒定律。
这些定律,是我们探索、研制新型传感器时,或在分析、综合现有传感器时,都必须严格遵守的基本法则。
(2)场的定律。
包括运动长的运动定律,电磁场的感应定律等,气相互作用与物体在空间的位置及分布状态有关。
一半可由物理方程给出,这些方程可做诶许多传感器工作的数学模型。
例如:利用静电场定律研制的电容式传感器;利用电磁感性定律研制的自感、互感、电涡流式传感器;利用运动定律与电池感应定律研制的磁电式传感器等。
利用场的定律构成的传感器,其形状、尺寸(结构)决定了传感器的量程、灵敏度等主要性能,故此类传感器可统称为“结构型传感器”。
- 1、下载文档前请自行甄别文档内容的完整性,平台不提供额外的编辑、内容补充、找答案等附加服务。
- 2、"仅部分预览"的文档,不可在线预览部分如存在完整性等问题,可反馈申请退款(可完整预览的文档不适用该条件!)。
- 3、如文档侵犯您的权益,请联系客服反馈,我们会尽快为您处理(人工客服工作时间:9:00-18:30)。
本科生毕业设计外文资料翻译题目传感器技术专业**************班级********姓名*******指导教师**************所在学院************附件1.外文资料翻译译文;2.外文原文多传感器数据融合的多分类器系统一、引言在许多应用识别和自动识别的模式中,从不同的传感器监测物理现象提供的免费信息中获得数据是很罕见的。
对这类信息的适当组合通常就叫做数据或者信息的融合,而且可以提高分类决策的准确性和信赖度相对于那些基于单个数据源的任何单独的决策。
之前我们已经介绍过Learn++,一种以整体分类为基础的方法,作为一种有效的自动分类算法是能逐步学习的。
该算法能够获得额外的数据,在分类系统设计好后就能变成有用的数据了。
为了实现增量学习,Learn++生成一个整体的分类器(专家),其中每个分类器都是作为前面的数据库。
为了认清数据融合和增量学习之间概念的相似性,我们讨论了数据融合的一些类似的方法:聘用一个正义专家,从提供的数据中训练每个数据,然后战略性的结合他们的输出。
我们能发现这些系统的性能在决策应用中是很重要的而且向来是优于那些基于单一的数据源决策的决策在一些基准和真实的数据源世界。
这样一个系统中的应用很多,其中的数据是从相同的应用程序所产生的多种来源(或多个传感器)提供的可能包含补充信息中获得的。
例如,在对管道做非破坏性评估时,缺陷信息可从涡流,磁泄漏的图像,超声波扫描,热成像获得,或者几个不同的诊断信息可从不同的医学检测获得,如血液分析心电图,脑电图或者医疗成像设备,如超声波,磁共振或正电子扫描等。
直观的,如果来自多个来源的信息可以适当的结合起来,那么分类系统(检测是否有缺陷,或是否可以做出诊断决定)的性能可以得到改善。
所以,增量学习和数据融合涉及学习不同的数据集。
在增量学习中补充信息必须提取新的数据集,其中可能包含新的分类实例。
而在数据融合中补充信息也必须提取新的数据集,其中可能包含代表数据使用不同的特点。
传统的方法一般是根据概率理论(叶贝斯定理,卡尔曼滤波),或登普斯特-谢弗(DS)和它的变化,其中主要用于军事上的应用开发,特别是目标检测和跟踪,如决策理论。
以整体分类为基础的方法寻求一个新的和更通用的解决方案提供更广泛的应用。
还应当指出的是,在一些应用中如上述的无损检测和医疗诊断等,从不同的来源获得的数据可能已产生不同的物理方式,并因此获得的功能可能是不一样的。
虽然在这种情况下使用概率或者决策理论的方法会变得更加的复杂,但异构的功能可以很容易的被安置整体的系统,讨论如下。
一个集成系统结合了集中不同的分类和特定的输出。
分类的多样性可以允许使用略有不同的训练参数,如不同的训练数据集产生不同的决策边界。
直觉来看,每个专家会产生不同的错误,而这些分类战略可以降低总的错误。
集成系统由于各种应用的报道比单一的分类系统的优越性已在过去十年吸引了极大的关注。
认识到增量学习应用这种方法的潜力,我们最近开发了Learn++,并表明Learn++确实是有能力逐步学习新的数据。
此外,该算法不要求对以前使用的数据的访问,并没有忘记以前所学的知识,还能够容纳从以前在早期培训看不见的类的实例。
在Learn++中一般的方法,就像人脸检测在其他集成算法中的方法差不多,创建一个集成分类,每个分类学习数据集的一个子集。
然后结合使用加权的多数表决的分类。
在这方面的贡献,我们回顾了Learn++算法能适当修改数据融合的应用。
从本质上讲,从不同的来源或使用不同的功能生成的每个数据集,Learn++生成新的集成分类,然后结合使用加权的多数表决。
二、LEARN ++Learn++算法的伪码,应用于数据融合问题,见图1,并在下面的段落中详细描述。
对于每个数据库,FS k,k=1,…,K,由一组不同的特点,提出Learn++,算法的输入是:(一)m k训练数据实例的x i随着他们正确的标签y i的序列S k;(二)监督分类算法中相应的分类,生成个人分类(今后,假设);(三)一个整数T K为第k个数据库要生成的分类。
每一种假说h t,在第t个迭代算法中产生,接受不同的训练数据集。
这是通过初始化一套重量训练数据,w t,和从w t(第一步)获得的一个分布D t。
根据这个分布的训练子集TR t 是来自训练数据S k(步骤2)。
分布D t决定更有可能被选择进入训练子集TRT训练数据的实例。
TR t在步骤3中被分类,返回第t个假设h t。
这一假说的错误,εt 计算在当前数据库S k 上,作为误判实例分配权重的总和(步骤4)。
此错误是必须小于1/2 ,以确保最低限度的合理性能,可以从h t预计。
如果是这种情况,假设h t接受,则错误归到获得规范化的错误(步骤5)。
=)(xHfinal 自变量最大值∑∑==Ω∈⎪⎪⎭⎫⎝⎛yxht ttKkyt)(:11logαβ图1 Learn++数据融合算法如果εt≥1/2,目前的假设不成立,返回到步骤2中选择一个新的训练子集。
所有t假设产生迄今,然后结合使用加权多数投票(WMV)获得复合假说H t。
在对WMV,每个假设被分配重量是成反比的错误,给予较高的权重较小的训练误差分类。
然后以类似的方式计算错误的复合假说H t,通过H t(步骤6)为来误判实例分配权重的总和复合假说H t错误。
归复合误差B t是获得更新的分配权被分配到第7步中的个别实例,然后使用。
正确复合假说H t分类实例的分配权重降低了B t的因素;因此,当分布于下一次迭代的第1步重新正常化时,误判实例的权重有效地增加。
这是因为,当一个新的数据集介绍(尤其是与新类或功能),现有的合奏(H t)是可能误认的实例,尚未得到妥善的教训,因此这些情况下的权重增加,迫使该算法把重点放在新的数据。
介绍了在每个数据融合应用中一个权重的额外集。
这些权重代表的特定数据源的重要性和可靠性,可以根据以往的经验分配,(例如,诊断神经系统疾病,我们可以知道,磁共振成像(MRI)是更为可靠的脑电图,因此,我们可以选择较高的权重训练与MRI数据分类),或者他们可以在自己的训练数据上,根据整体的表现设置的特定功能训练。
我们一套αK等权重计算k个数据集的基础上,第k个数据集上训练的合奏训练中的表现,调整使用αK投票权。
我们已经算出了这样的一套关于第k个数据集的基础上的第k个数据集上训练的整体训练中的表现的权重αk,,使用αk调整表决权重。
每个分类调整后的权重,在最后假说H final.加权多数表决。
图2是该算法的示意图。
Learn++的仿真结果,使用多个数量集的增量学习,相比较其他增量学习的方法,如模糊ARTMAP可以找到。
Learn++两个数据融合应用的仿真结果,现介绍如下,其中主要包括额外的细节,更新的结果比提出的有进一步了解。
一个涉及超声波和确定管道缺陷漏磁数据的组合,以及其他涉及化学传感器的数据来自多个传感器的组合,这些应用程序都是真实世界的应用。
图2 算法示意图厚度对ZnO薄膜的CO气体传感器的影响3 结果与讨论3.1 结构特征半导体氧化锌的传感机制,属于表面控制型,气敏表面吸附位/地区决定。
表面形貌随薄膜厚度的变化显著,因此暴露目标气体的总吸附面积也可能随薄膜厚度变化。
在本文中,吸附面积ZnO薄膜厚度的功能控制,通过改变沉积时间30,60,90,120,150,180分钟。
从89纳米到510纳米ZnO薄膜的厚度增加,当沉积时间从30至180分钟不等。
图2 ZnO薄膜的能量弥散的X线分析频谱正如图2所示,光谱表明,主峰是锌线和O线。
在光谱的另一高峰期是从SEM观察到的预先进行金涂层处理的凹峰。
图3 不同厚度的ZnO薄膜表面的SEM形貌(a)89纳米(b)为240纳米表面的SEM形貌(c)425纳米各种ZnO薄膜的厚度,表面形貌如图3所示。
可以看出,薄膜的光滑,作为薄膜厚膜的增加同晶粒尺寸与形貌发达的多。
3.2 薄膜传感器的传感特性在一般情况下,传感器的灵敏度受工作温度的影响。
温度越高,薄膜表面的反应越大,在一定温度范围内给出了更高的灵敏度。
图4 2100 ppm的CO气氛下,氧化锌薄膜的灵敏度和操作温度的关系如图4所示,2100 ppm的CO浓度下,从50℃至350℃,显示A函数的操作温度灵敏度,沉积氧化锌薄膜各种厚度。
观察快速增长的敏感度,89纳米的薄膜的操作温度升高到200℃达到最大,随着操作温度的进一步增加而下降。
从这个观察中由此可以推断,敏感度的增长随着薄膜厚度的减少,相比较另外的薄膜,89纳米的薄膜的最佳工作温度是最低的。
金属氧化物半导体传感器的灵敏度主要取决于目标气体和传感器的表面之间的相互作用。
材料的表面积越大,吸附气体和传感器的表面之间的相互作用越强,即气体传感灵敏度较高。
它可以从扫描时电子显微镜中观察到形貌,如图2所示,晶粒尺寸在89纳米的薄膜小,而在425纳米晶界是最大的。
在这项研究中膜的厚度为89纳米时大。
图5 ZnO薄膜(89纳米厚)暴露于各种CO浓度下的300摄氏度的瞬态响应如图5所示,作为一个CO气体浓度的功能的灵敏度,89 纳米的氧化锌在300℃沉积ZnO气体传感器的灵敏度,例如CO气体浓度的增加从400到2100 ppm,然后当CO气体被转移急剧下降。
对于不同的CO浓度,表明气体传感器具有良好的反应。
此外,传感器几乎同一时间在不同的CO浓度中达到最高灵敏度。
这一结果与操作温度响应时间的控制的结论是一致的。
图6 气体的灵敏度和不同的CO浓度下,89纳米的ZnO薄膜的工作温度的关系。
如图6所示,作为各种CO浓度的功能操作温度的敏感性。
由此可以看出,ZnO薄膜的敏感性增加随着CO浓度从200到2100 ppm的变化。
图7 在2100 ppm的CO气氛下,对于89 nm的ZnO薄膜沉积操作温度灵敏度的影响如图7所示,在2100 ppm的CO气体气氛下,对于89纳米的薄膜沉积在不同操作温度下灵敏度与操作时间的动态变化。
据观察,操作温度升高到350℃时,灵敏度达到最大。
4.结论用射频磁控溅射系统获得的各种厚度的CO气体传感器的结构和ZnO薄膜的传感特性进行了研究。
结构特征显示晶粒尺寸的提高,因为薄膜厚度增加,导致总面积的减少,结果有一个低的传感灵敏度。
此外,气体传感器灵敏度也增加了CO气体的浓度增加。
通过提高操作温度,灵敏度以及响应时间进行了改进。
在这项研究中获得最高灵敏度为在200℃的操作温度的89纳米的薄膜。
Multiple Classifier Systems for Multisensor Data FusionI. INTRODUCTIONIn many applications of pattern recognition and automated identification, it is not uncommon for data obtained from different sensors monitoring a physical phenomenon to provide complimentary information. A suitable combination of such information is usually referred to as data or information fusion, and can lead to improved accuracy and confidence of the classification decision compared to a decision based on any of the individual data sources alone.We have previously introduced Learn++, an ensemble of classifiers based approach, as an effective automated classification algorithm that is capable of learning incrementally. The algorithm is capable of acquiring novel information from additional data that later become available after the classification system has already been designed. To achieve incremental learning, Learn++ generates an ensemble of classifiers (experts), where each classifier is trained on the currently available database. Recognizing the conceptual similarity between data fusion and incremental learning, we discuss a similar approach for data fusion: employ an ensemble of experts, each trained on data provided by one of the sources, and then strategically combine their outputs. We have observed that the performance of such a system in decision making applications is significantly and consistently better than that of a decision based on a single data source across several benchmark and real world databases.The applications for such a system are numerous, where data available from multiple sources (or multiple sensors) generated by the same application may contain complementary information. For instance, in non-destructive evaluation of pipelines, defect information may be obtained from eddy current, magnetic flux leakage images, ultrasonic scans, thermal imaging; or different pieces of diagnostic information may be obtained from several different medical tests, such as blood analysis, electrocardiography or electroencephalography, medical imaging devices, such as ultrasonic, magnetic resonance or positron emission scans, etc. Intuitively, if such information from multiple sources can be appropriately combined, the performance of a classification system (in detecting whether there is a defect, or whether a diagnostic decision can be made) can be improved. Consequently, both incremental learning and data fusion involve learning from different sets of data. In incremental learning supplementary information must be extracted from new datasets, which may include instances from new classes. In data fusion, complementary information must be extracted from new datasets, which may represent the data using different features.Traditional methods are generally based on probability theory (Bayes theorem, Kalman filtering),or decision theory such as the Dempster-Schafer (DS) and its variations, which were primarily developed for military applications, such as notably target detection and tracking. Ensemble of classifiers based approaches seek to provide a fresh and a more general solution for a broader spectrum of applications. It should also be noted that in several applications, such as the nondestructive testing and medical diagnostics mentioned above, the data obtained from different sources may have been generated by different physical modalities, and therefore the features obtained may be heterogeneous. While using probability or decision theory based approaches become more complicated in such cases, heterogeneous features can easily be accommodated by an ensemble based system, as discussed below.An ensemble system combines the outputs of several diverse classifiers or experts. The diversity in the classifiers allows different decision boundaries to be generated by using slightly different training parameters, such as different training datasets. The intuition is that each expert will make a different error, and strategically combining these classifiers can reduce total error . Ensemble systems have attracted a great deal of attention over the last decade due to their reported superiority over single classifier systems on a variety of applications.Recognizing the potential of this approach for incremental learning applications, we have recently developed Learn++, and shown that Learn++ is indeed capable of incrementally learning from new data. Furthermore, the algorithm does not require access to previously used data, does not forget previously acquired knowledge and is able to accommodate instances from classes previously unseen in earlier training. The general approach in Learn++, much like those in other ensemble algorithms, such as AdaBoost, is to create an ensemble of classifiers, where each classifier learns a subset of the dataset. The classifiers are then combined using weighted majority voting. In this contribution, we review the Learn++algorithm suitably modified for data fusion applications. In essence, for each dataset generated from a different source and/or using different features, Learn++ generates new ensemble of classifiers, which are then combined using weighted majority voting.II. LEARN ++The pseudocode of the Learn++ algorithm, as applied to the data fusion problem, is provided in Figure 1, and is described in detail in the following paragraphs.For each database, FS k, k=1,…,K, that consists of a different set of features that is submitted to Learn++, the inputs to the algorithm are (i) a sequence S k of m k training data instances x i along with their correct labels y i; (ii) a supervised classification algorithm BaseClassifier, generating individual classifiers (henceforth, hypotheses); and (iii) an integer T k, the number of classifiers to be generated for the k th database.Each hypothesis h t, generated during the t th iteration of the algorithm, is trained on a different subset of the training data. This is achieved by initializing a set of weights for the training data, w t, and a distribution D t obtained from w t(step1). According to this distribution a training subset TR t is drawn from the training data S k(step 2). The distribution D t determines which instances of the training data are more likely to be selected into the training subset TR t.The Base classifier is trained on TR t in step 3, which returns the t th hypothesis h t.The error of this hypothesis,εt ,is computed on the current database S k as the sum of the distribution weights of the misclassified instances (step 4). This error is required to be less than1/2 to ensure that a minimum reasonable performance can be expected from ht. If this is the case, the hypothesis h t is accepted and the error is normalized to obtain the normalized error (step 5).Fig. 1. The Learn++ algorithm for data fusionIf εt≥1/2,the current hypothesis is discarded, and a new training subset is selected by returning to step 2. All t hypotheses generated thus far are then combined using weighted majority voting (WMV) to obtain a composite hypothesis H t. In WMV, each hypothesis is assigned a weight that is inversely proportional to its error, giving a higher weight to classifiers with smaller training error. The error of the composite hypothesis H t is then computed in a similar fashion as the sum of the distribution weights of the instances that are misclassified by H t (step 6).The normalized composite error B t is obtained which is then used for updating the distribution weights assigned to individual instances in Step 7. The distribution weights of the instances correctly classified by the composite hypothesis H t are reduced by a factor of B t; hence when the distribution is re-normalized in step 1 of the next iteration, the weights of the misclassified instances are effectively increased. We note that this weight update rule, based on the performance of the current ensemble, facilitates learning from new data. This is because, when a new dataset is introduced (particularly with new classes or features), the existing ensemble (H t) is likely to misclassify the instances that have not yet been properly learned, and hence the weights of these instances are increased, forcing the algorithm to focus on the new data.An additional set of weights are introduced in data fusion applications for each ensemble. These weights represent the importance and reliability of the particular data source and can be assigned based on former experience, (e.g., for diagnosing a neurological disorder we may know that magnetic resonance imaging (MRI) is more reliable then electroencephalogram, and we may therefore choose to give a higher weight to the classifiers trained with MRI data), or they can be based on the performance of the ensemble trained on the particular feature set on its own training data. We have calculated a set of such weights αk for the k th dataset based on the training performance of the ensemble trained on the k th dataset, and adjusted the voting weights using αk . The adjusted weight of each classifier is then used during the weighted majority voting for the final hypothesis H final.The schematic representation of the algorithm is provided in Figure 2. Simulation results of Learn++on incremental learning using several datasets, as well as comparisons to the other methods of incremental learning such as Fuzzy ARTMAP can be found in [11]. The simulation results of Learn++ on two applications of data fusion are presented below, which primarily include additional detail, updated results and further insight than those presented in [14,15]. Both of theseapplications are real world applications, one involving the combination of ultrasonic and magnetic flux leakage data for identification of pipeline defects, and the other involving the combination of chemical sensor data from several sensors for identification of volatile organic Compounds.Fig. 2. Schematic representation of algorithmTHE EFFECT OF THICKNESS ON ZNO THIN FILM CO GASSENSOR3. Results and discussion3.1 Structural CharacteristicsThe sensing mechanism of the semiconducting ZnO belongs to the surface-controlled type where the gas sensitivity is determined by the surface adsorption sites/area. The surface morphology varied with the film thickness significantly , therefore the total adsorption area exposed to the target gas may also vary as the film thickness . In this paper, the adsorption area as a function of ZnO film thickness was controlled by changing the deposition time of 30 , 60, 90, 120,150 , 180 min. The ZnO film thickness increased from 89nm to 510 nm when deposition time varied from 30 to 180 min.Figure 2. EDAX spectrum of ZnO thin filmAs shown in Fig. 2, the spectra indicate that the prominent peak is the Zn line followed by O line. The other peak in the spectra is Au peaks from the Gold-coating treatment in preparation for SEM observation.Fig.3. SEM morphology of surface of ZnO films with various thickness(a) 89 nm (b) 240 nm (c) 425 nmThe surface morphologies were shown in fig 3 for various ZnO film thickness. It is seen that the film smooth in morphologies with the grain size much more developed as the film thickness was increased.3.2 Sensing Characteristics of the thin film sensorsIn general, the sensitivity of the sensor is affected by the operating temperature. The higher temperature enhances surface reaction of the thin films and gives higher sensitivity in a temperature range.Fig.4. The relation between sensitivity and operation temperature of ZnO films under 2100 ppmCO atmosphereFig 4 shows the sensitivity as a functions of operation temperature from 50o C to 350o C for the various thickness of deposited Zinc Oxide film under 2100 ppm CO concenteration. A rapid increase in sensitivity was observed as the operation temperature was increased to 200o C and reached a maximum for the 89 nm films and decreased thereafter with further increase in operation temperature. It can be inferred from this observation that the sensitivity increased as the film thickness decreased and optimum operating temperature for 89 nm films is the lowest compare to other films. The sensitivity of the metal oxide semiconductor sensor is mainly determined by the interaction between the target gas and the surface of the sensor. The greater the surface area of the materials, the stronger the interaction between the adsorbed gases and the sensor surface , i.e. the higher the gas sensing sensitivity. It can be observed from SEM morphologies as shown in Fig.2 that the grain size is small in the 89 nm film while it is large in the 425 nm one and grain boundary are the largest when the film thickness is 89 nm in this study.Fig. 5. Transient responses of ZnO films (89 nm thick) for exposure to various CO concentrationat 300 o C.The sensitivity as a function of CO gas concentration for the as deposited 89 nm ZnO at 300 o C is shown in Fig. 5. The sensitivity of the ZnO gas sensor increased as the CO gas concentration was increased from 400 to 2100 ppm and it dropped rapidly when the CO gas was removed , indicating that the gas sensor has a good response for different CO concentrations. Besides, it took almost the same time for the sensor to reach the maximum sensitivity for different CO concentrations. This result was consistent with the conclusion for the dominance of operation temperature for the response time.Fig.6. Relationship between gas sensitivity and operating temperature at various COconcentrations for 89 nm ZnO films.Fig. 6 shows the sensitivity as a function of operation temperature for the various CO concentration. It can be seen that the sensitivity of ZnO films was increased from 200 to 2100 ppm CO concentrations.Fig.7. Effect of operation temperature in the sensitivity for as-deposited 89 nm ZnO thin filmunder 2100 ppm CO atmosphereFig.7 shows the dynamic variation of sensitivity with operation time at various operation temperature for the as deposited 89 nm ZnO films in 2100 ppm CO gas atmosphere. It was observed that the sensitivity is a maximum when the operation temperature was increased to 350o C.4. ConclusionThe structures and sensing properties of ZnO films as a CO gas sensor with various thickness obtained by rf magnetron sputtering system were investigated. The structural characteristics reveal that the grain size were enhanced as the film thickness was increased which resulted in decrease in the total surface area and as a result a low sensing sensitivity. Furthermore the sensitivity of the gas sensor also increased as the concentration of CO gas was increased . The sensitivity as well as the response time were improved by increasing the operation temperature. The maximum sensitivity in this study was obtained for the 89 nm film at the operation temperature of 200 o C.。