图表类说明文(1)
图表类作文写作方法
图表作文图表作文与写议论文和说明文的写作方法大致相同,唯一的差异就是如何利用浓缩在图表中的信息阐明图中各种数据和信息所反映的问题。
因此考生在写此类作文时只有在看懂图表的基础上才能动笔写。
如果不能全部领会图中信息,在写作中就会出现这样或那样的问题。
因此考生在阅读图表时应注意以下两点:第一,掌握图表上提供的信息及每一栏上面的小标题的标注,由此弄清设计者想通过图表反映出的信息、问题或现象。
第二,在掌握全部信息的基础上,着手分析这些信息和表上的具体数字。
通过分析与对比,抓住问题,便可以开拓思路,构思文章的布局、段落的划分及上下文的连贯等。
段落的划分可根据内容而定。
一般第一段应对图表做一简要的概述,点出所要涉及的问题;中间段落应对图表的重要问题进行分析;结尾段对全文做一小结。
举例说明For this part, you are allowed 30 minutes to write a composition of no less than 150 words under the title of “Changes in People’s Diet”. Your composition should be based on the following table.审题:这张图表介绍了1990年~1999年人们食品结构发生的变化,包括四大类食品:粮、奶、肉及水果蔬菜。
从图表上看,粮食消费量在逐年下降,奶和肉的消费量在上升,可见人民生活水平提高了。
蔬菜水果消费量上升的原因可否归结为人民生活富裕了,而且更加重视合理的饮食结构。
最后总结:整个图表反应了人民生活水平提高,更加经济快速发展。
Changes in People’s DietGreat changes have taken place in people’s diet these ten years. The above table tells us that grain, formerly the main food of most Chinese people, began to play a less important role in people’s diet, while the proportion of high-energy food, milk and meat, has generally increased.I think there are two main reasons that may account for the changes. First, people are becoming better off. They can now afford to buy more meat and milk, whose prices are much higher than that of grain. Second, people now pay more attention to the structure of their diet. They are seeking the most reasonable diet structure, wholesome,nutritious, and beneficial to their health.In short, the above changes in people’s diet in the ten years reflect the improvement in people’s living standard and the rapid development of the country’s economy. Such positive changes will surely continue in our future life.图表类作文的常用句型1. As is shown by the graph/in the table...(概述图表)正如曲线所示,最近54年来该国人口飞速增长。
(完整)高考英语写作图表说明文模板范文
高考英语指导写作专题:图表说明文一,图表说明1,分类:数字表、函数关系图、曲线图(graph);表格(table);几何图形(figure);图形表、饼状图(pie chart);条状图、柱状图(bar chart);平面图、示意图、外形图(diagram)。
2,一般可分三个层次来写:按照题目要求描述图表反映的总情况,即概括大意。
对数字进行仔细的比较,抓住特点进行分析、归纳并找出产生变化的原因。
读图表后的想法、结论、评论或针对反映出的问题采取的解决措施。
二.表达方式:1,常用的描述句型The table/chart/diagram/graph shows that ...According to the table/chart/diagram/graph...As is shown in the table/chart/diagram/graph...As can be seen from the table/chart/diagram/graph/figures...We can see from the figures/statistics...It is clear/ apparent from the figures/statistics...2.图表中数据(data)的具体表达法数据(data)在某一个时间段固定不变:fixed in time在一系列的时间段中转变:changes over time增加:increase/raise/rise/...减少:decrease/grow down/drop/fall/decline稳定:remain stable3.描写变化的形容词及副词rapid/rapidly,dramatic/dramatically,significant/significantly,sharp/sharplysteep/steeply,steady/steadily,gradual/gradually,slow/slowly,slight/slightly三、写作模板As (is) shown/indicated by the figure/in the table/graph/pie chart/chart,_____ has been increased/decreased significantly/steadily from _____ to_____. From the sharp decline/rise in the chart,it goes without saying that_____.There are at least two reasons accounting for / contributing to ____. On the one hand, _____ On the other hand, _____. _____is due to the fact that_____. In addition,_____is responsible for_____. Maybe there are other reasons to show. But it is generally believed that the above mentioned reasons are commonlyconvincing/persuasive.As far as I am concerned,I hold the view that_____. I am sure my opinion is both sound and well-grounded.四,作文范例1,最近你校对中学生的消费情况进行了调查。
[高考语文]图表作文
![[高考语文]图表作文](https://img.taocdn.com/s3/m/cefed26e7fd5360cba1adb7a.png)
As can be seen from the chart, ownership of houses in a big city in China has changed in the past ten years.
Ownership of Houses in a Big City in China
二 数据说明常用套语 1.和去年同期相比,其销售额上涨8.3%,达到 1063亿美元,创历史新高。 compared with by Sales increased __________8.3% __________the to same period last year, ____a record $106.3 billion.
As can be seen from the chart, ownership of houses in a big city in China changed in the past ten years. In 1995, 75 percent of the houses were state-owned, and five years later, the rate of state____________________________________________ owned houses to private ones was 3 to 2. ______________________________________________________ But from then on, the ownership of houses changed so rapidly that 80 percent of __________________________ houses have been private so far.
图表型说明文英语范文

图表型说明文英语范文英文回答:## The Power of Charts: Unveiling the Insights in Data.Charts are visual representations of data that simplify complex information and make it more accessible and understandable. They play a crucial role in data analysis, enabling us to identify patterns, trends, and relationships that would otherwise be difficult to discern from raw data alone.### Types of Charts.There are numerous types of charts, each suited to specific data types and analysis purposes. Some common types include:Bar charts: Represent data as vertical or horizontal bars, with the length of the bars indicating the value ofthe data points.Line charts: Connect data points with lines, showing the trend or progression of data over time or with respect to other variables.Pie charts: Divide data into slices representing different categories' proportions.Scatter plots: Plot individual data points as dots on a coordinate plane, highlighting the relationship between two variables.Histograms: Display the distribution of data bydividing the range into bins and showing the frequency of occurrence within each bin.### Benefits of Using Charts.Charts offer several advantages over raw data:Improved comprehension: Visualizing data makes iteasier to understand patterns, trends, and relationships than reading numerical tables.Easy identification of outliers: Charts can highlight unusual data points that may represent errors orsignificant deviations from the norm.Facilitate comparisons: Charts allow for quick and easy comparisons between different datasets or data subsets.Enhance presentations: Charts can make presentations more visually appealing and engaging, enhancing the audience's understanding of the data.### How to Create Effective Charts.Creating informative and visually effective charts requires careful attention to the following principles:Choose the right chart type: Select the chart type that best suits the data and analysis objectives.Use clear labels: Label axes, titles, and legendsclearly and concisely to guide readers through the chart.Ensure appropriate scale: Use a scale that accurately represents the range of data and avoids distorting the patterns.Highlight important features: Use color, size, or other visual cues to emphasize key insights or areas of interest.### Conclusion.Charts are a powerful tool for data analysis and communication. They transform complex numerical data into visual representations that reveal insights, facilitate understanding, and support informed decision-making. By understanding the different types of charts, their benefits, and best practices for creating them, we can harness the power of charts to unlock valuable insights from data.中文回答:## 图表的力量,揭示数据中的见解。
高中英语基础写作——图表类说明文

倍数的表达:
1.The number /rate has nearly _______ doubled ...的两倍 的两倍) (是...的两倍), as against that of last year. 2.The number is five times as many as that of…. (是…的5倍) 的 倍 =The number is four times more than in…(比...多4倍) 比...多
Possible Version: As can be seen from the graph, great changes in car ownership have taken place in China in the past ten years. The number of private cars increased more than 5 times from nearly 3 million in 1999 to over 15 million in 2009. It’s mainly because the economy of China has developed so rapidly that many Chinese people want to own private cars. Besides, in modern society, many Chinese need a car to do business so as to save time. In my view, as the car ownership constantly increases year by year, a large number of social problems, such as traffic jams, will turn up in nearly every city throughout China.
英语图表类作英语写作

Besides, being lonely and confused is a typical of us students. Everyone around us seems to be so busy that we feel at a loss for what we should do and what is right. In my opinion, teenagers’ psychological problems are of importance because they have relation to their future. What adults should do is to understand them fully and lead them to a bright future.
some solutions to get rid of pressure. Only by keeping balance of pressure and relaxation can they grow up better.
24
As is …., the number of children who have psychological problems varies a lot depending on their age. As is …., there are more and more healthy problems existing among students. It’s quite worrying that nowadays some students are not quite psychologically healthy. Because of peer pressure, children have more psychological problems when they grow older.
图表分析类英语作文

3. 孩子们可以通过旅行开阔视野。
Children can broaden their mind by traveling. T_h_e_r_e_i_s_n_o__d_e_n_y_i_n_g_t_h_a_t_c_h_i_ld_r_e_n__c_a_n_b_r_o_a_d_e_n__th__ei_r_m__i_n_d_b_y__t_r_a_v_el_i_n_g. (用There is no denying that ... 句型改写)
(用When doing ... 状语从句省略句改写)
5. 如果我努力,我就能实现我的梦想。 If I work hard, I can realize my dream. O__n_l_y_i_f _I_w__o_rk__h_a_r_d__c_a_n_I_r_e_a_l_iz_e__m_y__d_r_e_a_m_.( 用 O n l y 倒 装 句 改 写 )
四、完成写作
①以46%和25% A school did a survey among 1,200 students 的学生作主语来 about what they think themost important ability in life is. Here ar4e6% othfethe srtuesduelntst.s thin①k 描述图中的数据 _c_o_m__m_u__n_ic_a_t_i_o_n__a_b_i_li_t_y__is_ their first choice, while ,并用while连接 _2_5_%___o_f__t_h_e_m___c_h_o_o_se___le_a_d_e_r_s_h_ip___a_s__th__e most 。
三、句式升级 1. 60%的人喜欢读电子书,只有30%的人喜欢读纸质书。
17版:(全国)19.图表类

一、写作常识 1.常用的描述句型 (1)The table/chart/diagram/graph shows (that)... (2)According to the table/chart/diagram/graph... (3)As (is) shown in the table/chart/diagram/graph... (4)As can be seen from the table/chart/diagram/graph/figures... (5)We can see from the figures/statistics... (6)It is clear/apparent from the figures/statistics... (7)The table shows the changes in the number of...over the period from...to...
It is not easy to reach definite conclusions based on such a survey example.However,some general comments can be made.It seems clear from the response that some students lack communication with others.So teachers and parents need to play a more important role in their lives.
Therefore,we should spend our pocket money on what we really need.Also,we should acquire a scientific outlook of consumption and focus on study.What’s more,it’s essential for us to develop a good habit of saving money.
图表说明文

作文复习专题之--- 图表说明文一.图表说明文的常见类型1. 以表格形式,将统计的数据或被说明的事物直接用表格形式体现出来2. 表示数据的大小或数量之间的差异的柱状图3.表示数据变化的曲线图4.表示总体内部结构变化的扇形图二.图表作文的一般结构:建议用三段式作文三.图表类说明文的写作结构:第一段:开门见山地点明本图表所反映的主题, 即conclusion.第二段:分析数据间的主要差异及趋势,然后描写(在描写数据间变化及总趋势特征时,可采用分类式或对比式以支持主题,并阐明必要的理由)。
注意层次。
第三段:归纳总结或发表评论四.写作步骤:1.审题(四确定)1)确定类型2)确定体裁3). 确定主体时态4). 确定主体人称2. 列要点3. 依要点, 拟草纲, 组织成句.4. 构篇章,扩句成文.5. 检查润色6. 书写五.图标说明文常用词句。
1. 常用词汇:table(表格, 项目表), chart(图表), graph(图表, 曲线图),figure(数据),rate (比列,比率),make a survey about…(做关于…的调查) ,describe,tell, show, represent, Obviously/Apparently(很明显地),rise,increase(增多,增加),climb,go up,fall,decline (下降),decrease(减少,减低),drop,go down, ….2. 常用句型:1).The rate of … is2).There was a great /slight increase /rise in…3).The main reason is that ….4).The rate dropped slightly from 38%in… to 31% in…5). By comparison with…, it decreased/increased/fell from…to…6). From Chart 1, / According to Chart 2, /As is shown on Chart 1,7)Besides/ What’s more/What’s worse.8)In a word/In short/ Generally speaking /In summary/ As far as I am concerned.3.单句训练:1.由表1,我们可以看出……2.最近的一项关于人们怎样度假的调查表明。
考研作文模板——图表类

考研英语写作大作文范文及模板:图表作文图表作文1.写作攻略图表作文是考研英语写作中较为常见的题型之一,也是难度较大的一种写作题型。
这类作文可综合提供题目、数据、图像、提纲,形式多样,但实际上只涉及5个方面:描述图表、指明寓意、分析原因、联系实际、给出建议,而每次考试只是从这5个方面的内容中选出3个结合在一起。
从写作类型来看,基本上属于说明文。
要求考生围绕题目将有关信息转化为文字形式,考生应该具有一定数据分析和材料归纳的能力,同时会运用一定的写作方法。
考研试题一般以三段式写作方法来组织文章,第一段总结归纳信息反映的整体情况,点出主题思想,第二段回答第一段所得出的问题,对数字、数据等做出有条理的分析比较,第三段做出总结或给以简单的评论。
表格和图表题型写作要点:(1)考生应仔细研究题目以及提示信息,认清图表中的数字、线条、阴影等部分的变化趋势和走向,抓住其主要特点,然后根据图表所显示的中心信息确定内容层次以及主题句。
(2)考生应该仔细研究图表所给出的大量信息,从中选取最重要,最有代表性的信息,然后根据全文的主旨去组织运用所获取的关键信息。
切忌简单地罗列图表所给出的信息。
(3)图表作文一般采用的时态为一般现在时,但如果图表中给出了具体时间参照,考生则应对时态进行相应的调整。
(4)图表作文有一些固定句型和表达法,考生应对此融会贯通。
(5)图表作文可以细分为表格,曲线图、柱形图和饼形图。
除了上述共同要点,考生还应了解这四种图在写作方面的不同特点。
——表格可以表示多种事物的相互关系,所以考生要对表格中所给出的大量数字进行比较分析,从中找出其变化规律。
——曲线图常表示事物的变化趋势,考生应认真观察坐标系所显示的数据信息,并且密切注意交汇在坐标横轴和纵轴上的数字及单位。
——柱形图用来表示各种事物的变化情况及相互关系,要求考生通过宽度相等的柱形的高度或长度差别来判断事物的动态发展趋势,因此考生应密切关注坐标线上的刻度单位及图表旁边的提示说明与文字。
图表类书面表达技巧讲解

图表类书面表达技巧讲解题型介绍近几年高考说明文多数以图表、表格或文字的形式给出提示,并往往融合在应用文体中进行考查,一样分为:场所路线介绍、事物介绍、方式方法或打算安排介绍三大类。
在写作时要求语言简明扼要、通俗易明白,说明过程讲究层次性和条理性。
图表式作文的几种形式:一是以表格形式,将统计的数据或被说明的事物直截了当用表格形式表达出来,即统计表。
二是以图形形式:表示数据变化的曲线图;表示数据的大小或数量之间的差异的条形图;表示总体内部结构变化的扇形图。
图表作文的结构通常是三段式:第一段分析图表中的数据变化反映出的问题或趋势,简要概述图表所揭示的信息;第二段分析缘故;第三段提出解决问题的方法或建议。
写作时注意直截了当、尽快入题,适当加入自己的议论,力争做到观点明确,不要拐弯抹角,拖泥带水,使人读后一头雾水。
解题技巧审题:【链接高清】1. 对数据进行比较,找出变化规律。
2. 留心所给图形坐标轴上的数字和单位。
3. 注意饼状图各部分间的关系,部分与整体的关系。
4. 写作时先描画图表内容,写明变化规律,依照题目要求分析和推测走势(假如必要的话),并简要说明缘故。
三步走:第一步:开门见山地点明本图表所反映的主题。
第二步:分析数据间的要紧差异及趋势,然后描写。
第三步:归纳总结或发表评论。
图表用词:曲线图graph表格table几何图形figure饼状图pie chart条状图bar chart平面图、示意图、外形图diagram时态:现在时或过去时◆常用句型:图表作文中的过渡、概括句型1. As can be indicated in the table …2. As is revealed in the table...3. According to the figures given in the table...4. This chart shows that...5. As is shown by the graph...6. It can be seen from the statistics that...描写图表和数据的句型1. A is by far the largest...2. The figure has nearly doubled/tripled, as against that of last year.3. There is a slight/slow/steady/rapid rise in population.4. Sth. be on the increase/decrease/rise/decline常用过渡词过渡到下一点:what’s more, in addition, besides, furthermore表示比较:on the contrary, compare …to/with…, compared to/with 得出结论:consequently, as a result, in other words, in short, accordi ng表示强调:without doubt, chiefly, as a matter of fact, in fact表示不同:different from, difference between/among数据表达法百分比的表达:70% of... /seventy percent of... /70 percent of the... (易漏用of)其它一些比例的表达手段。
作文训练系列之图表作文(一)
• I think we have more freedom to choose what we would like to do after graduation. Going to college is no longer the only choice for most of us as it was years ago. For one thing, our city government has made more efforts to help the non-local workers. For example, their children can enjoy the equal right of a good education with the city students. • For another, with the economic development of our city, more foreigners are attracted to set up business here and they are happy to send their children to local schools to learn more about China and Chinese culture. • I believe the future of the education in our city is promising! • That's all. Thank you.
• 实战演练 实战演练: • 下面的饼状图(pie chat)显示了你对你校 学生兴趣爱好的调查结果。请你用英语给 English Weekly写一篇短文,报道你的调查 结果,并对此结果发表你的看法或建议。 字数120词左右。首句已给出(不计入词 数)。
39图表作文写作指导 (1)
《图表作文》写作指导中考中的图表作文一般有以下三类。
一、看图作文【命题形式】看图作文一般要求学生根据所给出的一幅图或几幅图所提供的信息写一篇短文。
在命题形式上,除了图的提示外,一般有英文单词提示或中文文字提示。
有的文章开头已给出。
要求书写的词数一般在80至100之间。
【写作技巧】1.审题要清。
看清题目要求,读懂画面内容和所陈述的含义,抓住要点,注意文体是什么,如果是故事或日记,宜用过去时态;如果介绍物品之类的,多采用现在时态。
2.逐图列提纲。
看图作文所提供的材料是一幅或几幅图。
做题时,可逐图列好提纲,并运用所提供的词语。
根据图示情景并结合自己的英语水平,尽量扬长避短,避繁化简。
遇到一时想不起来的词、句时,可用同义词或同义句代替。
3.连句成文。
就是把第二步所写的句子,在规定的范围内稍加发挥,适当用上连词把它们串联起来整理成一篇短文。
连句成文时应注意文中动词时态的应用,简单句和复合句的交替应用。
4.复核检查。
按要求逐图写好句子后,认真通读写好的句子,一查所写句子是否准确表达出了所给图画的情景,行文是否流畅;二查有没有遗漏要求,句子的时态、语态是否正确,所写句子是否符合英语的基本语序,即:主语+谓语+宾语十状语(地点、时间等);三查单词的拼写、大小写是否规范,标点符号的运用是否正确,主谓语是否一致。
确定无误后,再誊写正稿。
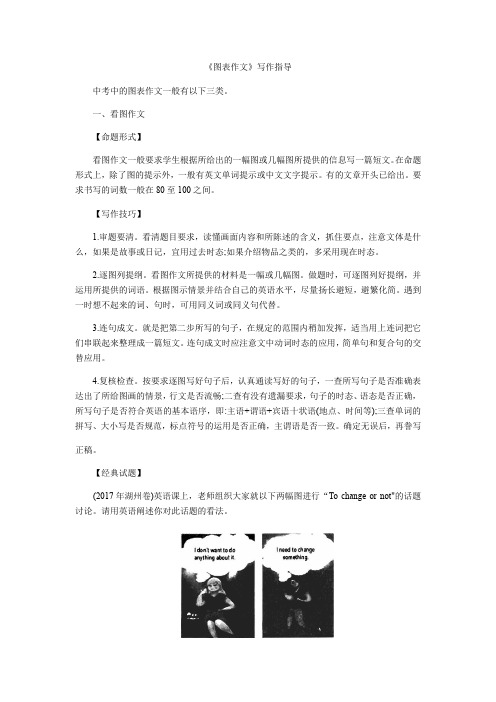
【经典试题】(2017年湖州卷)英语课上,老师组织大家就以下两幅图进行“To change or not"的话题讨论。
请用英语阐述你对此话题的看法。
注意:(1)短文可结合图片信息或自身经历,作适当发挥;(2)文中不得出现真实的姓名和校名;(3)词数:80~100,短文首句仅供选择使用,不计入总词数。
短文首句:Last week, we had a discussion about the topic "To change or not".【审题指导】1.因为短文首句已给出,所以我们可以接着引出下文。
谈谈图表类说明文的写作技巧

谈谈图表类说明文的写作技巧作者:叶晓靖来源:《广东教育·高中》2009年第06期图表类作文的特点是提示语言少但信息量大而且零散,对考生在考场上短时间内整理、组织信息的能力要求较高,因此难度也较大。
但此类作文的方法是不难掌握的,以下是笔者总结的一些图表类作文的解题步骤及技巧,供各位考生参考。
一、审题三部曲:1. 一审对象:明确文章主题,确定阐述对象。
2. 二审数据:把握变化规律,揣摩蕴含信息。
3. 三审时态:描述过去情况时使用一般过去时,而发表个人看法或者结尾总结时应使用一般现在时。
二、写作三部曲1. 漂亮第一句,有章可循。
The table/chart shows that ...The figures/statistics demonstrate/reveal that...It can be seen from the figures that...We can see from the table/chart that ...The graph shows the changes in the number of...over the period from...to...2. 积累分析数据的句型,写好第二、三、四句。
①描述上升:The number sharply/ rapidly/slowly /steadily went up/rose / increased/ grew to...The figures reached the peaks in the year...②描述下降:The number sharply/rapidly/slowly /steadilydropped/ reduced/ decreased/ to ...The figures reached the bottom in the year...③描述数据平稳过渡、无变化:The number of...stayed the same between... and...The number of... remained the same.④描述对比:词组:as...as; ...times + the height/length/width of...; less than, more than, the same as, similar to, equal to; be twice / three times more than; be half as ... as句型:In comparison with that in ..., the percentage of ... decreased by...The number of ... increased slightly and the number of ... declined slightly.连接词:while, but, on the contrary, however, in contrast to3. 第五句:结尾句做总结。
2020版高考英语作文系列4-说明文(图表类)(学生版)- 章杰文
精锐教育学科教师辅导教案高考英语图表类说明文写作一. 题型简介:看图作文是借助于图画或图表进行写作的一种文体。
它要求作者将画面直观的内容或图片包含的信息转换成传神表意的文字形式,属于说明文性质。
其目的是考察考生的观察分析能力、想象力和语言表达能力。
作文的命题模式基本如下:给出标题、图画或图表、写作提纲、半小时内写出一篇120-180字左右的评论性文章。
看图作文要求:(1)主题明确,即能概括画面或图表所反映的中心议题;(2)图文一致,即要包括画面或图表中所反映的主要内容。
二. 写作方法:1. 审题图画作文实质上就是描述、分析并评论一幅(或一组)图所反映的社会现象。
对图画进行描述时,一般以被观察者为对象,联系图片中所包含的背景、插入的文字等,揣摩作者的绘画意图,以观众的口吻进行解说。
如果看的是一组图画,就得按照图示的顺序,对画面上的内容进行整体分析,去除细枝末节,分清主次,抓住图画后隐藏的中心意思进行解说。
切莫象记流水帐一样把所看到的、想到的细节全部写出来,这只会使读者感到乏味无趣。
想象你自己就是这位画家,在画这副画之前,你首先要构思画的内容;其次是构思作画的步骤,先画什么,后画什么;然后将你的构思用文字叙述出来,你对该图画的描述就完成了。
2大体框架(具体按照写作要求进行调整)::第二段和第三段的开头最好写一个主题句,既可以防止离题,又符合英文写作的习【例题精讲】2002年上海高考,Directions: Write an English composition in over 120 words based on the picture and the instructions given below. 简要描述图片内容,结合生活实际,就图片的主题谈谈自己的感想。
写作步骤:1.仔细审题:把握图片的要素--女孩,父母,奶奶,自行车,医药箱,流汗,联系这些要素可知图片信息是围绕父母教孩子学骑自行车这一内容展开,通过图片中的人物行为和表情肢体动作的补充可以进一步挖掘出主题是围绕--教育,过度保护。
- 1、下载文档前请自行甄别文档内容的完整性,平台不提供额外的编辑、内容补充、找答案等附加服务。
- 2、"仅部分预览"的文档,不可在线预览部分如存在完整性等问题,可反馈申请退款(可完整预览的文档不适用该条件!)。
- 3、如文档侵犯您的权益,请联系客服反馈,我们会尽快为您处理(人工客服工作时间:9:00-18:30)。
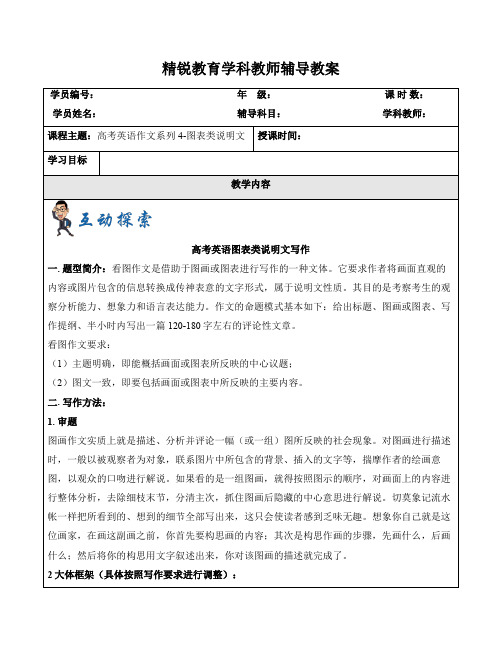
某城市近年每百人中手机用户增长示意图。根据所给图表, 简要描述某城市近年每百人中手机用户增长情况,并分析 其增长原因。
80 70 60 50 40 30 20 10 0 1997年 1999年 2001年 2004年
In 1997, only ten people in a hundred had mobile phones in the city In 1999, the number doubled , reaching 20 in 100. The people owning mobile phones in 2001 were 5 times as many as those in 1997. Three years later, the number of the citizens owning the magic tools increased rapidly, making up 80 percent .
常用句型: 1.The graph/chart/table above shows/describes/ reflects.. 2. From the above graph/chart, it can be seen that.../we can see that …. 3.As is shown in the graph, ... 4.According to the table/chart /graph, ....
Reasons:
1. The reason why/for…is that… 2. It is because /because of … that … 3. We may consider the change as a result of... 4.….is the key factor (因素) contributing to… 5.The reasons why …….are as follows. / There are plenty of reasons for the change. Firstly,… secondly, … Thirdly….
80 70 60 50 40 30 20 10 0
3.Reasons— • There are some reasons for the rise in the number of people with mobile phones. Firstly, the technology of making mobile phones is changing rapidly, which leads to the drop in the prices. Secondly, people’s income has been increasing . As a consequence, they have more options. Thirdly, being useful in daily life, mobile phones make people’s communication easy and convenient .
第一步 点明主题 According to the above chart, we know more and more people have mobile phones in recent years. 第二步 阐明图表数据 说明原因 In 1997, only ten people in a hundred had mobile phones in some city. In 1999, the number doubled , reaching 20 in 100. The people owning mobile phones in 2001 were 5 times as many as those in 1997.Three years later, 80 percent of the citizens had the magic tools. There are some reasons for the rise in the number of people with mobile phones. Firstly, the technology of making mobile phones is changing rapidly, which leads to the drop in the prices. Secondly, people’s income has been increasing . As a consequence, they have more options. Thirdly, being useful in daily life, mobile phones make people’s communication easy and convenient . 第三步 总结归纳 From what has been discussed above, it can be estimated(估计) that the number of the mobile phone holders will reach a new height with the further advance of science and technology.
outline: introduction: 近年越来越多的人使用手机
描述1997-2004数据增长的对比、差异 facts : 科技,收入,方便联系…… reasons: 你的观点 conclusion:
图表类说明文的写作步骤
第一步:开门见山地点明本图表所反映的主题, 即Introduction
1997年 1999年 2001年 2004年
第三步: 归纳总结或发表评论。
1.In a word,/ In short,/In conclusion, /In summary, we can say /conclude/predict that…… 2.As far as I’m concerned,/ As for me,/ For my part,/ From my point of view,/ in my opinion, I think it necessary to….. 3. From what has been discussed above, we can draw a conclusion/ it can be concluded (得出结论)that… 第三步 总结归纳 From what has been disscussed above, it can be estimated that the number of the mobile phone holders will reach a new height with the further advance of science and technology.
ownership
99 00 01 02 03 04 05 06 07 08 09
As can be seen from the graph, great changes in car ownership have taken place in China in the past ten years.
高考英语基础写作 复习系列
下图为某城市近年每百人中手机用户增长示意图。 根据所给图表,简要描述某城市近年每百人中手 机用户增长情况,并试分析其增长原因。
80 70 60 50 40 30 20 10 0 1997年 1943;图表数据
人称: 第三人称 时态: 一般过去时 现在完成时 要点: 概述增长现象 具体数据变化 原因
某城市近年每百人中手机用户增长示意图。
80 70 60 50 40 30 20 10 0 1997年 1999年 2001年 2004年
According to the above chart, we know more and more people have owned mobile phones in recent years.
What Jobs Do College Students Want to Do 目前学生择业状况 男女学生就业选择的区别 我的观点
What Jobs Do College Students Want to Do It goes without saying that college students have a clear idea about their future occupation. Boys are to some extend different from girls in their choice .As can be seen from the picture, the most striking contrast is in the occupation of teaching: 45% of girls students would like to do the job. What boys like to do most is to become managers (40%) and the second largest group is to be businessmen (30%). Girls also like to pursue these two professions, with a percentage of 15% and 25% respectively choosing these two jobs. 15% of boys want to become lawyers while 10% of girls preferring this professions.
• 第二步:分析数据间的主要差异及变化趋势,抓重点 抓特征抓规律,不能事无巨细,一一列出. 主体部分往往包含 facts and reasons ( Facts)一,描述变化趋势 1.The number of private cars increased /rose suddenly/rapidly/sharply/dramatically(急剧) /considerably(大量)/slowly/gradually/slightly(轻 微) (from …to…) 2.The number of private cars increased by 10% in 1999, reaching 20000. 3.The number dropped/decreased/declined/went down slightly from 38%in 2005 to 31% in 2006 4.The number remained steady/stable/constant between……and…从……到…期间,数量保持稳定!