基于MatLab的排队系统仿真研究
基于MatLab的排队系统仿真研究

/(-  ̄ 1p) 一
客户到达
— — — — — — —
— — — 型 H 器 童 f l I — — — 丽辑 —圭 —塑— 1 — —4 — — ~
f ) / c 统 的 数 学 特 性 3 M M, 系 M M/ 的 排 队 系 统 有 c台服 务 器 . 台服 务 器 独 立 / e 每 工 作 . 具 有 相 同分 布 的 服 务 时 间 , 们 假 设 所 有 服 务 且 我
0 引 言
排 队论 是 研 究 系 统 由于 随 机 因 素 的干 扰 而 出 现 排 队现 象 的一 门学 科 排 队是 日常 生 活 中经 常 遇 到 的 现 象 。例 如 : 出行 坐 火 车等 待 检票 进 站 的 排 队 ; 食 堂 打 到 饭所 形成的排 队 ; 校 打预防针 , 检所 形成 的排 队 ; 学 体 看 电影 、 游 时前 往售 票 处 购 票 形 成 的排 队等 。 近 几 旅 最
服 务 效 率 与 最合 理 的 配 置 。应 用 Ma a t b对 M/ c M / / / 等排 队 系 统进 行 仿 真 , 仿 L M/ , M c N 对
真 结 果进 行 评 估 , 果 表 明 , 方 法是 切 实 可行 的。 结 该
关 键 词 :仿 真 ;MaL b¥言 ;排 队 系统 ;马可 夫过 程 ta i
图 1 单 服 务 台 排 队 系 统 的 结构 模 型
台是空 的概率 P, n所有服务 台都在忙 的概率 P , 由下面
12 排 队 系统 的数 学特 性 .
( ) 人记 号 和重 要 度 量 参 数 1引
收 稿 日期 :0 0 7 2 2 1 —0 ~ 0 修 稿 日期 :0 0 0 —1 21— 8 1
排队系统仿真matlab实验报告

M/M/1排队系统实验报告一、实验目的本次实验要求实现M/M/1单窗口无限排队系统的系统仿真,利用事件调度法实现离散事件系统仿真,并统计平均队列长度以及平均等待时间等值,以与理论分析结果进行对比。
二、实验原理根据排队论的知识我们知道,排队系统的分类是根据该系统中的顾客到达模式、服务模式、服务员数量以及服务规则等因素决定的。
1、 顾客到达模式设到达过程是一个参数为λ的Poisson 过程,则长度为t 的时间内到达k 个呼叫的概率 服从Poisson 分布,即e t kk k t t p λλ-=!)()(,⋅⋅⋅⋅⋅⋅⋅⋅⋅=,2,1,0k ,其中λ>0为一常数,表示了平均到达率或Poisson 呼叫流的强度。
2、 服务模式设每个呼叫的持续时间为i τ,服从参数为μ的负指数分布,即其分布函数为{}1,0t P X t e t μ-<=-≥3、 服务规则先进先服务的规则(FIFO )4、 理论分析结果在该M/M/1系统中,设λρμ=,则稳态时的平均等待队长为1Q ρλρ=-,顾客的平均等待时间为T ρμλ=-。
三、实验内容M/M/1排队系统:实现了当顾客到达分布服从负指数分布,系统服务时间也服从负指数分布,单服务台系统,单队排队,按FIFO (先入先出队列)方式服务。
四、采用的语言MatLab 语言源代码:clear;clc;%M/M/1排队系统仿真SimTotal=input('请输入仿真顾客总数SimTotal='); %仿真顾客总数;Lambda=0.4; %到达率Lambda;Mu=0.9; %服务率Mu;t_Arrive=zeros(1,SimTotal);t_Leave=zeros(1,SimTotal);ArriveNum=zeros(1,SimTotal);LeaveNum=zeros(1,SimTotal);Interval_Arrive=-log(rand(1,SimTotal))/Lambda;%到达时间间隔Interval_Serve=-log(rand(1,SimTotal))/Mu;%服务时间t_Arrive(1)=Interval_Arrive(1);%顾客到达时间ArriveNum(1)=1;for i=2:SimTotalt_Arrive(i)=t_Arrive(i-1)+Interval_Arrive(i);ArriveNum(i)=i;endt_Leave(1)=t_Arrive(1)+Interval_Serve(1);%顾客离开时间LeaveNum(1)=1;for i=2:SimTotalif t_Leave(i-1)<t_Arrive(i)t_Leave(i)=t_Arrive(i)+Interval_Serve(i);elset_Leave(i)=t_Leave(i-1)+Interval_Serve(i);endLeaveNum(i)=i;endt_Wait=t_Leave-t_Arrive; %各顾客在系统中的等待时间t_Wait_avg=mean(t_Wait);t_Queue=t_Wait-Interval_Serve;%各顾客在系统中的排队时间t_Queue_avg=mean(t_Queue);Timepoint=[t_Arrive,t_Leave];%系统中顾客数随时间的变化Timepoint=sort(Timepoint);ArriveFlag=zeros(size(Timepoint));%到达时间标志CusNum=zeros(size(Timepoint));temp=2;CusNum(1)=1;for i=2:length(Timepoint)if (temp<=length(t_Arrive))&&(Timepoint(i)==t_Arrive(temp)) CusNum(i)=CusNum(i-1)+1;temp=temp+1;ArriveFlag(i)=1;elseCusNum(i)=CusNum(i-1)-1;endend%系统中平均顾客数计算Time_interval=zeros(size(Timepoint));Time_interval(1)=t_Arrive(1);for i=2:length(Timepoint)Time_interval(i)=Timepoint(i)-Timepoint(i-1);endCusNum_fromStart=[0 CusNum];CusNum_avg=sum(CusNum_fromStart.*[Time_interval 0] )/Timepoint(end);QueLength=zeros(size(CusNum));for i=1:length(CusNum)if CusNum(i)>=2QueLength(i)=CusNum(i)-1;elseQueLength(i)=0;endendQueLength_avg=sum([0 QueLength].*[Time_interval 0] )/Timepoint(end);%系统平均等待队长%仿真图figure(1);set(1,'position',[0,0,1000,700]);subplot(2,2,1);title('各顾客到达时间和离去时间');stairs([0 ArriveNum],[0 t_Arrive],'b');hold on;stairs([0 LeaveNum],[0 t_Leave],'y');legend('到达时间','离去时间');hold off;subplot(2,2,2);stairs(Timepoint,CusNum,'b')title('系统等待队长分布');xlabel('时间');ylabel('队长');subplot(2,2,3);title('各顾客在系统中的排队时间和等待时间');stairs([0 ArriveNum],[0 t_Queue],'b');hold on;stairs([0 LeaveNum],[0 t_Wait],'y');hold off;legend('排队时间','等待时间');%仿真值与理论值比较disp(['理论平均等待时间t_Wait_avg=',num2str(1/(Mu-Lambda))]);disp(['理论平均排队时间t_Wait_avg=',num2str(Lambda/(Mu*(Mu-Lambda)))]);disp(['理论系统中平均顾客数=',num2str(Lambda/(Mu-Lambda))]);disp(['理论系统中平均等待队长=',num2str(Lambda*Lambda/(Mu*(Mu-Lambda)))]);disp(['仿真平均等待时间t_Wait_avg=',num2str(t_Wait_avg)])disp(['仿真平均排队时间t_Queue_avg=',num2str(t_Queue_avg)])disp(['仿真系统中平均顾客数=',num2str(CusNum_avg)]);disp(['仿真系统中平均等待队长=',num2str(QueLength_avg)]);五、数据结构1.仿真设计算法(主要函数)利用负指数分布与泊松过程的关系,产生符合泊松过程的顾客流,产生符合负指数分布的随机变量作为每个顾客的服务时间:Interval_Arrive=-log(rand(1,SimTotal))/Lambda;%到达时间间隔,结果与调用exprnd(1/Lambda,m)函数产生的结果相同Interval_Serve=-log(rand(1,SimTotal))/Mu;%服务时间间隔t_Arrive(1)=Interval_Arrive(1);%顾客到达时间时间计算t_Wait=t_Leave-t_Arrive;%各顾客在系统中的等待时间t_Queue=t_Wait-Interval_Serve; %各顾客在系统中的排队时间由事件来触发仿真时钟的不断推进。
基于matlab GUI的MG1排队系统的可视化仿真程序设计

基于matlab GUI的M/G/1排队系统的可视化仿真程序设计刘健鹭(云南民族大学电气与信息工程学院 10级信号与信息处理研究生邮编:650500)摘要:M/G/1排队系统是一个顾客到达是无记忆泊松过程,服务时间为相互独立的一般分布的、具有多种服务规则的排队系统。
利用matlab GUI的面向对象的可视化的开发环境,设计一个参数可调的,直观的动画仿真程序,用于不同参数的M/G/1排队系统;本程序的主要作用有:为研究M/G/1排队系统提供一个简单的可视化仿真环境;为课堂教学提供一个直观的演示平台。
关键词:M/G/1排队系统 matlab GUIM/G/1 queuing system of visual simulation programming basedon Matlab GUIJianLuLiu(Y unnan national university)Abstrac t: M/G/1 queuing system is a customer arrives is no memory Poisson process, service time is independent of the general distribution, with a variety of services, rules of queuing systems. Using matlab GUI object-oriented visual development environment, design an adjustable parameter, intuitive animation simulation program for different parameters of the M/G/1 queuing system; major role in this program are: to study the M/G/1 queuing system provides a simple visual simulation environment; for the classroom to provide a visual presentation platform;key word:M/G/1 queuing system Matlab GUI引言:排队论是研究系统由于随机因素的干扰而出现排队现象的一门学科。
应用Matlab软件解决排队论模型问题

一 Ma tla b 解决排队论问题 用
Matlab 是美国 MathWorks 公司出品的商业 数 学 软 件 ,主 要 应 用 于 工 程 计 算 、控 制 设 计 、信 号 处 理 与 通 讯 、图 像 处 理 、
信号检测、建模设计与分析等领域。 由于 Matlab 具备很强的 开放性,用户可通过对源文件的修改加入自己编写的文件构 成新的专用工具箱。 笔者正是在此基础上,运用运筹学求解 方 法 ,结 合 上 机 实 践 ,整 理 出 运 用 Matlab 软 件 实 现 求 解 排 队 系统问题的一般方法及步骤。 实践证明,此方法是快速有效 的。 对于 M/M/s 等待制排队模型,单服务台模型服务 台 个 数 为 1 ,多服务台模型服务台个数为 s ,笔者所建立的 M 函数文 件,公式以解决等待制多服务台模型为基础,同时包括了 s=1 时 单 服 务 台 模 型 的 情 况 ,所 以 ,对 于 单 服 务 台 模 型 问 题 可 认 为是其特例,同样适用。 顾客相继到达的平均时间间隔为 1/λ , 平均服务时间为 1/μ ,服务台个数为 s 。 将主要 数 量 指 标 考 虑 在 内 ,建 立 M 文 件如下:
谷海兰 张 威
况下,排队 系 统 的 工 作 性 能 和 状 态 ,为 设 计 新的排队系统及改进现有系统的性能提供数量依据。 随着生 产与服务的日益社会化,没有排队引起的拥挤现象会愈来愈 普遍。 排 队 系 统 大 都 由 3 个 基 本 部 分 组 成 :输 入 过 程 、排 队 及 排队规则、服务机制。 排队系统的主要数量指标有:队长 N(t) 和 排 队 长 Nq(t) ;等 待 时 间 T(t) 和 逗 留 时 间 Tq(t) ;忙 期 B 和 闲 期 I ;单位时间内来到系统的平均顾客 数 λ ;单 位 时 间 内 可 以 服 务 完 的 顾 客 数 μ ;系 统 的 服 务 强 度 ρ=λ/sμ ;时 刻 t 时 系 统 处于状态 n 的概率 pn(t) 。 这些数量指标一般都是和系统运行 的时间有关的随机变量,而求这些随机变量的瞬时分布一般 是 很 困 难 的 ,注 意 到 排 队 系 统 在 运 行 了 一 定 时 间 后 ,都 会 趋 于一个平衡状态。 排队模型的类型有:M/M/s 等待制排队模型、顾客到达过 程 为 参 数 为 λ 的 Poisson 流 、服 务 时 间 服 从 参 数 为 μ 的 负 指 数分布、系统空间无限,允许永远排队,这是一类最基本的排 队 系 统 ;M/M/s 混 合 制 排 队 模 型 , 顾 客 到 达 过 程 为 参 数 为 λ 的 Poisson 流、服务时间服从参数为 μ 的负指数分布、系统空 间为 K 。
排队论的matlab仿真(包括仿真代码)

Wireless Network Experiment Three: Queuing TheoryABSTRACTThis experiment is designed to learn the fundamentals of the queuing theory. Mainly about the M/M/S and M/M/n/n queuing models.KEY WORDS: queuing theory, M/M/s, M/M/n/n, Erlang B, Erlang C. INTRODUCTIONA queue is a waiting line and queueing theory is the mathematical theory of waiting lines. More generally, queueing theory is concerned with the mathematical modeling and analysis of systems that provide service to random demands. In communication networks, queues are encountered everywhere. For example, the incoming data packets are randomly arrived and buffered, waiting for the router to deliver. Such situation is considered as a queue. A queueing model is an abstract description of such a system. Typically, a queueing model represents (1) the system's physical configuration, by specifying the number and arrangement of the servers, and (2) the stochastic nature of the demands, by specifying the variability in the arrival process and in the service process.The essence of queueing theory is that it takes into account the randomness of the arrival process and the randomness of the service process. The most common assumption about the arrival process is that the customer arrivals follow a Poisson process, where the times between arrivals are exponentially distributed. The probability of the exponential distribution functionis f(t)=λe−λt.●Erlang B modelOne of the most important queueing models is the Erlang B model (i.e., M/M/n/n). It assumes that the arrivals follow a Poisson process and have a finite n servers. In Erlang B model, it assumes that the arrival customers are blocked and cleared when all the servers are busy. The blocked probability of a Erlang B model is given by the famous Erlang B formula,w here n is the number of servers and A=λ/μis the offered load in Erlangs, λis the arrival rate and 1/μis the average service time. Formula (1.1) is hard to calculate directly from its right side when n and A are large. However, it is easy to calculate it using the following iterative scheme:●Erlang C modelThe Erlang delay model (M/M/n) is similar to Erlang B model, except that now it assumes that the arrival customers are waiting in a queue for a server to become available without considering the length of the queue. The probability of blocking (all the servers are busy) is given by the Erlang C formula,Where ρ=1if A>n and ρ=Aif A<n. The quantity ρ indicates the server utilization.nThe Erlang C formula (1.3) can be easily calculated by the following iterative schemewhere P B(n,A)is defined in Eq.(1.1).DESCRIPTION OF THE EXPERIMENTSing the formula (1.2), calculate the blocking probability of the Erlang B model.Draw the relationship of the blocking probability PB(n,A) and offered traffic A with n = 1,2, 10, 20, 30, 40, 50, 60, 70, 80, 90, 100. Compare it with the table in the text book (P.281, table 10.3).From the introduction, we know that when the n and A are large, it is easy to calculate the blocking probability using the formula 1.2 as follows.P B(n,A)=AP B(n−1,A)m+AP B(n−1,A)it use the theory of recursion for the calculation. But the denominator and the numerator of the formula both need to recurs( P B(n−1,A)) when doing the matlab calculation, it waste time and reduce the matlab calculation efficient. So we change the formula to be :P B(n,A)=AP B(n−1,A)n+AP B(n−1,A)=1n+AP B(n−1,A)AP B(n−1,A)=1(1+nAP B(n−1,A))⁄Then the calculation only need recurs once time and is more efficient. The matlab code for the formula is: erlang_b.m%**************************************% File: erlanb_b.m% A = offered traffic in Erlangs.% n = number of truncked channels.% Pb is the result blocking probability.%**************************************function [ Pb ] = erlang_b( A,n )if n==0Pb=1; % P(0,A)=1elsePb=1/(1+n/(A*erlang_b(A,n-1))); % use recursion "erlang(A,n-1)" endendAs we can see from the table on the text books, it uses the logarithm coordinate, so we also use the logarithm coordinate to plot the result. We divide the number of servers(n) into three parts, for each part we can define a interval of the traffic intensity(A) based on the figure on the text books :1. when 0<n<10, 0.1<A<10.2. when 10<n<20, 3<A<20.3. when 30<n<100, 13<A<120.For each part, use the “erlang_b”function to calculate and then use “loglog”function to figure the logarithm coordinate.The matlab code is :%*****************************************% for the three parts.% n is the number servers.% A is the traffic indensity.% P is the blocking probability.%*****************************************n_1 = [1:2];A_1 = linspace(0.1,10,50); % 50 points between 0.1 and 10.n_2 = [10:10:20];A_2 = linspace(3,20,50);n_3 = [30:10:100];A_3 = linspace(13,120,50);%*****************************************% for each part, call the erlang_b() function.%*****************************************for i = 1:length(n_1)for j = 1:length(A_1)p_1(j,i) = erlang_b(A_1(j),n_1(i));endendfor i = 1:length(n_2)for j = 1:length(A_2)p_2(j,i) = erlang_b(A_2(j),n_2(i));endendfor i = 1:length(n_3)for j = 1:length(A_3)p_3(j,i) = erlang_b(A_3(j),n_3(i));endend%*****************************************% use loglog to figure the result within logarithm coordinate. %*****************************************loglog(A_1,p_1,'k-',A_2,p_2,'k-',A_3,p_3,'k-');xlabel('Traffic indensity in Erlangs (A)')ylabel('Probability of Blocking (P)')axis([0.1 120 0.001 0.1])text(.115, .115,'n=1')text(.6, .115,'n=2')text(7, .115,'10')text(17, .115,'20')text(27, .115,'30')text(45, .115,'50')text(100, .115,'100')The figure on the text books is as follow:We can see from the two pictures that, they are exactly the same with each other except that the result of the experiment have not considered the situation with n=3,4,5,…,12,14,16,18.ing the formula (1.4), calculate the blocking probability of the Erlang C model.Draw the relationship of the blocking probability PC(n,A) and offered traffic A with n = 1,2, 10, 20, 30, 40, 50, 60, 70, 80, 90, 100.From the introduction, we know that the formula 1.4 is :P C(n,A)=nP B(n,A)n−A(1−P B(n,A))Since each time we calculate the P B(n,A), we need to recurs n times, so the formula is not efficient. We change it to be:P C(n,A)=nP B(n,A)n−A(1−P B(n,A))=1n−A(1−P B(n,A))nP B(n,A)⁄=1(An+n−AnP B(n,A))⁄Then we only need recurs once. P B(n,A)is calculated by the “erlang_b” function as step 1. The matlab code for the formula is : erlang_c.m%**************************************% File: erlanb_b.m% A = offered traffic in Erlangs.% n = number of truncked channels.% Pb is the result blocking probability.% erlang_b(A,n) is the function of step 1.%**************************************function [ Pc ] = erlang_c( A,n )Pc=1/((A/n)+(n-A)/(n*erlang_b(A,n)));endThen to figure out the table in the logarithm coordinate as what shown in the step 1.The matlab code is :%*****************************************% for the three parts.% n is the number servers.% A is the traffic indensity.% P_c is the blocking probability of erlangC model.%*****************************************n_1 = [1:2];A_1 = linspace(0.1,10,50); % 50 points between 0.1 and 10.n_2 = [10:10:20];A_2 = linspace(3,20,50);n_3 = [30:10:100];A_3 = linspace(13,120,50);%*****************************************% for each part, call the erlang_c() function.%*****************************************for i = 1:length(n_1)for j = 1:length(A_1)p_1_c(j,i) = erlang_c(A_1(j),n_1(i));%µ÷Óú¯Êýerlang_cendendfor i = 1:length(n_2)for j = 1:length(A_2)p_2_c(j,i) = erlang_c(A_2(j),n_2(i));endendfor i = 1:length(n_3)for j = 1:length(A_3)p_3_c(j,i) = erlang_c(A_3(j),n_3(i));endend%*****************************************% use loglog to figure the result within logarithm coordinate. %*****************************************loglog(A_1,p_1_c,'g*-',A_2,p_2_c,'g*-',A_3,p_3_c,'g*-');xlabel('Traffic indensity in Erlangs (A)')ylabel('Probability of Blocking (P)')axis([0.1 120 0.001 0.1])text(.115, .115,'n=1')text(.6, .115,'n=2')text(6, .115,'10')text(14, .115,'20')text(20, .115,'30')text(30, .115,'40')text(39, .115,'50')text(47, .115,'60')text(55, .115,'70')text(65, .115,'80')text(75, .115,'90')text(85, .115,'100')The result of blocking probability table of erlang C model.Then we put the table of erlang B and erlang C in the one figure, to compare their characteristic.100The line with ‘ * ’ is the erlang C model, the line without ‘ * ’ is the erlang B model. We can see from the picture that, for a constant traffic intensity (A), the erlang C model has a higher blocking probability than erlang B model. The blocking probability is increasing with traffic intensity. The system performs better when has a larger n.ADDITIONAL BONUSWrite a program to simulate a M/M/k queue system with input parameters of lamda, mu, k.In this part, we will firstly simulate the M/M/k queue system use matlab to get the figure of the performance of the system such as the leave time of each customer and the queue length of the system.About the simulation, we firstly calculate the arrive time and the leave time for each customer. Then analysis out the queue length and the wait time for each customer use “for ” loops. Then we let the input to be lamda = 3, mu = 1 and S = 3, and analysis performance of the system for the first 10 customers in detail.Finally, we will do two test to compared the performance of the system with input lamda = 1, mu = 1 and S = 3 and the input lamda = 4, mu = 1 and S = 3.The matlab code is: mms_function.mfunction[block_rate,use_rate]=MMS_function(mean_arr,mean_serv,peo_num,server_num) %%%%%%%%%%%%%%%%%%%%%%%%%%%%%%%%%%%%%%%%%%%%% %%%%%%%%%%%%%%%%%%%%%%%%%%%%first part: compute the arriving time interval, service time%interval,waiting time, leaving time during the whole service interval %%%%%%%%%%%%%%%%%%%%%%%%%%%%%%%%%%%%%%%%%%%%% %%%%%%%%%%%%%%%%%%%%%%%%%%%state=zeros(5,peo_num);%represent the state of each customer by%using a 5*peo_num matrix%the meaning of each line is: arriving time interval, service time%interval, waiting time, queue length when NO.ncustomer%arrive, leaving timestate(1,:)=exprnd(1/mean_arr,1,peo_num);%arriving time interval between each%customer follows exponetial distributionstate(2,:)=exprnd(1/mean_serv,1,peo_num);%service time of each customer follows exponetial distributionfor i=1:server_numstate(3,1:server_num)=0;endarr_time=cumsum(state(1,:));%accumulate arriving time interval to compute%arriving time of each customerstate(1,:)=arr_time;state(5,1:server_num)=sum(state(:,1:server_num));%compute living time of first NO.server_num%customer by using fomular arriving time + service timeserv_desk=state(5,1:server_num);%create a vector to store leaving time of customers which is in service for i=(server_num+1):peo_numif arr_time(i)>min(serv_desk)state(3,i)=0;elsestate(3,i)=min(serv_desk)-arr_time(i);%when customer NO.i arrives and the%server is all busy, the waiting time can be compute by%minus arriving time from the minimum leaving timeendstate(5,i)=sum(state(:,i));for j=1:server_numif serv_desk(j)==min(serv_desk)serv_desk(j)=state(5,i);breakend%replace the minimum leaving time by the first waiting customer'sleaving timeendend%%%%%%%%%%%%%%%%%%%%%%%%%%%%%%%%%%%%%%%%%%%%% %%%%%%%%%%%%%%%%%%%%%%%%%%%%second part: compute the queue length during the whole service interval %%%%%%%%%%%%%%%%%%%%%%%%%%%%%%%%%%%%%%%%%%%%% %%%%%%%%%%%%%%%%%%%%%%%%%%zero_time=0;%zero_time is used to identify which server is emptyserv_desk(1:server_num)=zero_time;block_num=0;block_line=0;for i=1:peo_numif block_line==0find_max=0;for j=1:server_numif serv_desk(j)==zero_timefind_max=1; %means there is empty serverbreakelse continueendendif find_max==1%update serv_deskserv_desk(j)=state(5,i);for k=1:server_numif serv_desk(k)<arr_time(i) %before the NO.i customer actually arrivesthere maybe some customerleaveserv_desk(k)=zero_time;else continueendendelseif arr_time(i)>min(serv_desk)%if a customer will leave before the NO.i%customer arrivefor k=1:server_numif arr_time(i)>serv_desk(k)serv_desk(k)=state(5,i);breakelse continueendendfor k=1:server_numif arr_time(i)>serv_desk(k)serv_desk(k)=zero_time;else continueendendelse %if no customer leave before the NO.i customer arriveblock_num=block_num+1;block_line=block_line+1;endendelse %the situation that the queue length is not zeron=0;%compute the number of leaing customer before the NO.i customer arrives for k=1:server_numif arr_time(i)>serv_desk(k)n=n+1;serv_desk(k)=zero_time;else continueendendfor k=1:block_lineif arr_time(i)>state(5,i-k)n=n+1;else continueendendif n<block_line+1% n<block_line+1 means the queue length is still not zeroblock_num=block_num+1;for k=0:n-1if state(5,i-block_line+k)>arr_time(i)for m=1:server_numif serv_desk(m)==zero_timeserv_desk(m)=state(5,i-block_line+k)breakelse continueendendelsecontinueendendblock_line=block_line-n+1;else %n>=block_line+1 means the queue length is zero%update serv_desk and queue lengthfor k=0:block_lineif arr_time(i)<state(5,i-k)for m=1:server_numif serv_desk(m)==zero_timeserv_desk(m)=state(5,i-k)breakelse continueendendelsecontinueendendblock_line=0;endendstate(4,i)=block_line;endplot(state(1,:),'*-');figureplot(state(2,:),'g');figureplot(state(3,:),'r*');figureplot(state(4,:),'y*');figureplot(state(5,:),'*-');Since the system is M/M/S which means the arriving rate and service rate follows Poisson distribution while the number of server is S and the buffer length is infinite, we can computeall the arriving time, service time, waiting time and leaving time of each customer. We can test the code with input lamda = 3, mu = 1 and S = 3. Figures are below.Arriving time of each customerService time of each customerWaiting time of each customerQueue length when each customer arriveLeaving time of each customerAs lamda == mu*server_num, the load of the system could be very high.Then we will zoom in the result pictures to analysis the performance of the system for the firstly 10 customer.The first customer enterthe system at about 1s.Arriving time of first 10 customerThe queue length is 1for the 7th customer.Queue length of first 10 customerThe second customerleaves the system atabout 1.3sLeaving time of first 10 customer1.As we have 3 server in this test, the first 3 customer will be served without any delay.2.The arriving time of customer 4 is about 1.4 and the minimum leaving time of customerin service is about 1.2. So customer 4 will be served immediately and the queue length is still 0.3.Customer 1, 4, 3 is in service.4.The arriving time of customer 5 is about 1.8 and the minimum leaving time of customerin service is about 1.6. So customer 5 will be served immediately and the queue length is still 0.5.Customer 1, 5 is in service.6.The arriving time of customer 6 is about 2.1 and there is a empty server. So customer 6will be served immediately and the queue length is still 0.7.Customer 1, 5, 6 is in service.8.The arriving time of customer 7 is about 2.2 and the minimum leaving time of customerin service is about 2.5. So customer 7 cannot be served immediately and the queue length will be 1.9.Customer 1, 5, 6 is in service and customer 7 is waiting.10.The arriving time of customer 8 is about 2.4 and the minimum leaving time of customerin service is about 2.5. So customer 8 cannot be served immediately and the queue length will be 2.11.Customer 1, 5, 6 is in service and customer 7, 8 is waiting.12.The arriving time of customer 9 is about 2.5 and the minimum leaving time of customerin service is about 2.5. So customer 7 can be served and the queue length will be 2.13.Customer 1, 7, 6 is in service and customer 8, 9 is waiting.14.The arriving time of customer 10 is about 3.3 and the minimum leaving time of customerin service is about 2.5. So customer 8, 9, 10 can be served and the queue length will be 0.15.Customer 7, 9, 10 is in service.Test 2:lamda = 1, mu = 1 and S = 3Waiting time of customerQueue length when each customer arriveAs lamda < mu*server_num, the performance of the system is much better.Test 3:lamda = 4, mu = 1 and S = 3Waiting time of customerQueue length when each customer arriveAs lamda > mu*server_num, system will crash as the waiting time and queue length increases as new customer arrives. For the situation of lamda<mu*server_num, the system performs better when mu and server_num are both not small. If the mu is smaller than lamda or we only have one server though with large mu, the system works not very good. It is may be because that the server time for each customer is a Poisson distribution, it may be a large time though the mu is large enough, so the more number of server, the better of the performance of the system.CONCLUSTIONAfter the experiment, we have a deeply understanding of the queuing theory, including the erlang B model and the erlang C model. What’s more, we are familiar with how to simulate the queue system for M/M/s. Through the simulation, we have known how the queue system works and the performance of the system with different input parameter.。
MMN排队系统建模与仿真

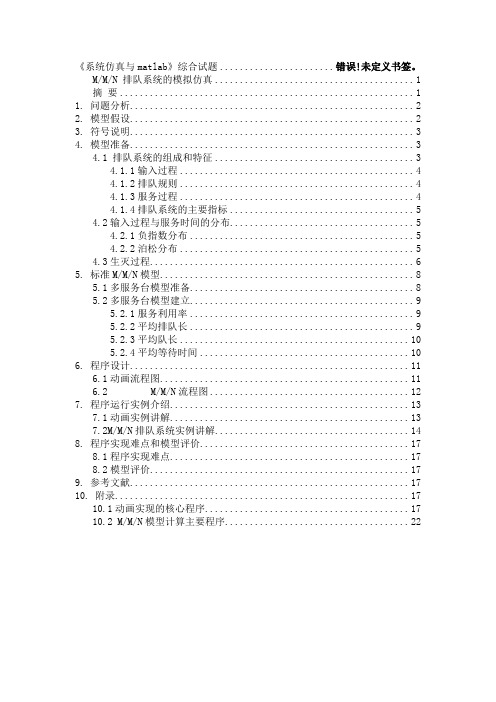
.《系统仿真与matlab》综合试题....................... 错误!未定义书签。
M/M/N 排队系统的模拟仿真 (1)摘要 (1)1. 问题分析 (3)2. 模型假设 (4)3. 符号说明 (5)4. 模型准备 (5)4.1 排队系统的组成和特征 (5)4.1.1输入过程 (6)4.1.2排队规则 (6)4.1.3服务过程 (7)4.1.4排队系统的主要指标 (7)4.2输入过程与服务时间的分布 (8)4.2.1负指数分布 (8)4.2.2泊松分布 (8)4.3生灭过程 (9)5. 标准M/M/N模型 (11)5.1多服务台模型准备 (11)5.2多服务台模型建立 (12)5.2.1服务利用率 (12)5.2.2平均排队长 (13)5.2.3平均队长 (13)5.2.4平均等待时间 (14)6. 程序设计 (14)6.1动画流程图 (14)6.2 M/M/N流程图 (15)7. 程序运行实例介绍 (16)7.1动画实例讲解 (16)7.2M/M/N排队系统实例讲解 (18)8. 程序实现难点和模型评价 (21)8.1程序实现难点 (21)8.2模型评价 (21)9. 参考文献 (21)10. 附录 (22)10.1动画实现的核心程序 (22)10.2 M/M/N模型计算主要程序 (32)M/M/N 排队系统的模拟仿真摘要排队是在日常生活中经常遇到的事,由于顾客到达和服务时间的随机性,使得排队不可避免。
因此,本文建立标准的M/M/N模型,并运用Matlab软件,对M/M/N排队系统就行了仿真,从而更好地深入研究排队问题。
问题一,基于顾客到达时间服从泊松分布和服务时间服从负指数分布,建立了标准的M/M/N模型。
运用Matlab软件编程,通过输入服务台数量、泊松分布参数以及负指数分布参数,求解出平均队长、服务利用率、平均等待时间以及平均排队长等重要指标。
然后,分析了输入参数与输出结果之间的关系。
MM1排队系统仿真matlab实验报告
M/M/1排队系统实验报告一、实验目的本次实验要求实现M/M/1单窗口无限排队系统的系统仿真,利用事件调度法实现离散事件系统仿真,并统计平均队列长度以及平均等待时间等值,以与理论分析结果进行对比。
二、实验原理根据排队论的知识我们知道,排队系统的分类是根据该系统中的顾客到达模式、服务模式、服务员数量以及服务规则等因素决定的。
1、 顾客到达模式设到达过程是一个参数为λ的Poisson 过程,则长度为t 的时间内到达k 个呼叫的概率 服从Poisson 分布,即etkk k t t p λλ-=!)()(,⋅⋅⋅⋅⋅⋅⋅⋅⋅=,2,1,0k ,其中λ>0为一常数,表示了平均到达率或Poisson 呼叫流的强度。
2、 服务模式设每个呼叫的持续时间为i τ,服从参数为μ的负指数分布,即其分布函数为{}1,0t P X t e t μ-<=-≥3、 服务规则先进先服务的规则(FIFO ) 4、 理论分析结果在该M/M/1系统中,设λρμ=,则稳态时的平均等待队长为1Q ρλρ=-,顾客的平均等待时间为T ρμλ=-。
三、实验内容M/M/1排队系统:实现了当顾客到达分布服从负指数分布,系统服务时间也服从负指数分布,单服务台系统,单队排队,按FIFO (先入先出队列)方式服务。
四、采用的语言MatLab 语言源代码:clear; clc;%M/M/1排队系统仿真SimTotal=input('请输入仿真顾客总数SimTotal='); %仿真顾客总数;Lambda=0.4; %到达率Lambda;Mu=0.9; %服务率Mu;t_Arrive=zeros(1,SimTotal);t_Leave=zeros(1,SimTotal);ArriveNum=zeros(1,SimTotal);LeaveNum=zeros(1,SimTotal);Interval_Arrive=-log(rand(1,SimTotal))/Lambda;%到达时间间隔Interval_Serve=-log(rand(1,SimTotal))/Mu;%服务时间t_Arrive(1)=Interval_Arrive(1);%顾客到达时间ArriveNum(1)=1;for i=2:SimTotalt_Arrive(i)=t_Arrive(i-1)+Interval_Arrive(i);ArriveNum(i)=i;endt_Leave(1)=t_Arrive(1)+Interval_Serve(1);%顾客离开时间LeaveNum(1)=1;for i=2:SimTotalif t_Leave(i-1)<t_Arrive(i)t_Leave(i)=t_Arrive(i)+Interval_Serve(i);elset_Leave(i)=t_Leave(i-1)+Interval_Serve(i);endLeaveNum(i)=i;endt_Wait=t_Leave-t_Arrive; %各顾客在系统中的等待时间t_Wait_avg=mean(t_Wait);t_Queue=t_Wait-Interval_Serve;%各顾客在系统中的排队时间t_Queue_avg=mean(t_Queue);Timepoint=[t_Arrive,t_Leave];%系统中顾客数随时间的变化Timepoint=sort(Timepoint);ArriveFlag=zeros(size(Timepoint));%到达时间标志CusNum=zeros(size(Timepoint));temp=2;CusNum(1)=1;for i=2:length(Timepoint)if (temp<=length(t_Arrive))&&(Timepoint(i)==t_Arrive(temp)) CusNum(i)=CusNum(i-1)+1;temp=temp+1;ArriveFlag(i)=1;CusNum(i)=CusNum(i-1)-1;endend%系统中平均顾客数计算Time_interval=zeros(size(Timepoint));Time_interval(1)=t_Arrive(1);for i=2:length(Timepoint)Time_interval(i)=Timepoint(i)-Timepoint(i-1);endCusNum_fromStart=[0 CusNum];CusNum_avg=sum(CusNum_fromStart.*[Time_interval 0] )/Timepoint(end);QueLength=zeros(size(CusNum));for i=1:length(CusNum)if CusNum(i)>=2QueLength(i)=CusNum(i)-1;elseQueLength(i)=0;endendQueLength_avg=sum([0 QueLength].*[Time_interval 0] )/Timepoint(end);%系统平均等待队长%仿真图figure(1);set(1,'position',[0,0,1000,700]);subplot(2,2,1);title('各顾客到达时间和离去时间');stairs([0 ArriveNum],[0 t_Arrive],'b');hold on;stairs([0 LeaveNum],[0 t_Leave],'y');legend('到达时间','离去时间');hold off;subplot(2,2,2);stairs(Timepoint,CusNum,'b')title('系统等待队长分布');xlabel('时间');ylabel('队长');subplot(2,2,3);title('各顾客在系统中的排队时间和等待时间');stairs([0 ArriveNum],[0 t_Queue],'b');stairs([0 LeaveNum],[0 t_Wait],'y');hold off;legend('排队时间','等待时间');%仿真值与理论值比较disp(['理论平均等待时间t_Wait_avg=',num2str(1/(Mu-Lambda))]);disp(['理论平均排队时间t_Wait_avg=',num2str(Lambda/(Mu*(Mu-Lambda)))]);disp(['理论系统中平均顾客数=',num2str(Lambda/(Mu-Lambda))]);disp(['理论系统中平均等待队长=',num2str(Lambda*Lambda/(Mu*(Mu-Lambda)))]);disp(['仿真平均等待时间t_Wait_avg=',num2str(t_Wait_avg)])disp(['仿真平均排队时间t_Queue_avg=',num2str(t_Queue_avg)])disp(['仿真系统中平均顾客数=',num2str(CusNum_avg)]);disp(['仿真系统中平均等待队长=',num2str(QueLength_avg)]);五、数据结构1.仿真设计算法(主要函数)利用负指数分布与泊松过程的关系,产生符合泊松过程的顾客流,产生符合负指数分布的随机变量作为每个顾客的服务时间:Interval_Arrive=-log(rand(1,SimTotal))/Lambda;%到达时间间隔,结果与调用exprnd(1/Lambda,m)函数产生的结果相同Interval_Serve=-log(rand(1,SimTotal))/Mu;%服务时间间隔t_Arrive(1)=Interval_Arrive(1);%顾客到达时间时间计算t_Wait=t_Leave-t_Arrive; %各顾客在系统中的等待时间t_Queue=t_Wait-Interval_Serve; %各顾客在系统中的排队时间由事件来触发仿真时钟的不断推进。
用Matlab实现排队过程的仿真
用Matlab实现排队过程的仿真一、引言排队是日常生活中经常遇到的现象。
通常,当人、物体或是信息的到达速率大于完成服务的速率时,即出现排队现象。
排队越长,意味着浪费的时间越多,系统的效率也越低。
在日常生活中,经常遇到排队现象,如开车上班、在超市等待结账、工厂中等待加工的工件以及待修的机器等。
总之,排队现象是随处可见的。
排队理论是运作管理中最重要的领域之一,它是计划、工作设计、存货控制及其他一些问题的基础。
Matlab 是MathWorks 公司开发的科学计算软件,它以其强大的计算和绘图功能、大量稳定可靠的算法库、简洁高效的编程语言以及庞大的用户群成为数学计算工具方面的标准,几乎所有的工程计算领域,Matlab 都有相应的软件工具箱。
选用 Matlab 软件正是基于 Matlab 的诸多优点。
二、排队模型三.仿真算法原理( 1 )顾客信息初始化根据到达率λ和服务率µ来确定每个顾客的到达时间间隔和服务时间间隔。
服务间隔时间可以用负指数分布函数 exprnd() 来生成。
由于泊松过程的时间间隔也服从负指数分布,故亦可由此函数生成顾客到达时间间隔。
需要注意的是 exprnd() 的输入参数不是到达率λ和服务率µ而是平均到达时间间隔 1/ λ和平均服务时间 1/ µ。
根据到达时间间隔,确定每个顾客的到达时刻 . 学习过 C 语言的人习惯于使用 FOR 循环来实现数值的累加,但 FOR 循环会引起运算复杂度的增加而在 MATLAB 仿真环境中,提供了一个方便的函数 cumsum() 来实现累加功能读者可以直接引用对当前顾客进行初始化。
第 1 个到达系统的顾客不需要等待就可以直接接受服务其离开时刻等于到达时刻与服务时间之和。
( 2 )进队出队仿真在当前顾客到达时刻,根据系统内已有的顾客数来确定是否接纳该顾客。
若接纳则根据前一顾客的离开时刻来确定当前顾客的等待时间、离开时间和标志位;若拒绝,则标志位置为 0。
排队论的matlab仿真(包括仿真代码)

Wireless Network Experiment Three: Queuing TheoryABSTRACTThis experiment is designed to learn the fundamentals of the queuing theory.Mainly about the M/M/S and M/M/n/n queuing models.KEY WORDS:queuing theory,M/M/s,M/M/n/n,Erlang B,Erlang C. INTRODUCTIONA queue is a waiting line and queueing theory is the mathematical theory of waiting lines. More generally,queueing theory is concerned with the mathematical modeling and analysis of systems that provide service to random demands.In communication networks,queues are encountered everywhere.For example,the incoming data packets are randomly arrived and buffered,waiting for the router to deliver.Such situation is considered as a queue.A queueing model is an abstract description of such a system.Typically,a queueing model represents(1) the system's physical configuration,by specifying the number and arrangement of the servers, and(2)the stochastic nature of the demands,by specifying the variability in the arrival process and in the service process.The essence of queueing theory is that it takes into account the randomness of the arrival process and the randomness of the service process.The most common assumption about the arrival process is that the customer arrivals follow a Poisson process,where the times between arrivals are exponentially distributed.The probability of the exponential distribution functionis.●Erlang B modelOne of the most important queueing models is the Erlang B model(i.e.,M/M/n/n).It assumes that the arrivals follow a Poisson process and have a finite n servers.In Erlang B model,it assumes that the arrival customers are blocked and cleared when all the servers are busy.The blocked probability of a Erlang B model is given by the famous Erlang B formula,w here n is the number of servers and A=is the offered load in Erlangs,is the arrival rate and is the average service time.Formula(1.1)is hard to calculate directly from its right side when n and A are large.However,it is easy to calculate it using the following iterative scheme:●Erlang C modelThe Erlang delay model(M/M/n)is similar to Erlang B model,except that now it assumes that the arrival customers are waiting in a queue for a server to become available without considering the length of the queue.The probability of blocking(all the servers are busy)is given by the Erlang C formula,Where if and if.The quantity indicates the server utilization.The Erlang C formula(1.3) can be easily calculated by the following iterative schemewhere is defined in Eq.(1.1).DESCRIPTION OF THE EXPERIMENTSing the formula(1.2),calculate the blocking probability of the Erlang B model.Draw the relationship of the blocking probability PB(n,A)and offered traffic A with n=1,2,10,20,30,40,50,60,70,80,90,pare it with the table in the text book(P.281,table10.3).From the introduction,we know that when the n and A are large,it is easy to calculate the blocking probability using the formula1.2as follows.it use the theory of recursion for the calculation.But the denominator and the numerator of the formula both need to recurs()when doing the matlab calculation,it waste time and reduce the matlab calculation efficient.So we change the formula to be:Then the calculation only need recurs once time and is more efficient.The matlab code for the formula is:erlang_b.m%**************************************%File:erlanb_b.m%A=offered traffic in Erlangs.%n=number of truncked channels.%Pb is the result blocking probability.%**************************************function[Pb]=erlang_b(A,n)if n==0Pb=1;%P(0,A)=1elsePb=1/(1+n/(A*erlang_b(A,n-1)));%use recursion"erlang(A,n-1)" endendAs we can see from the table on the text books,it uses the logarithm coordinate,so we also use the logarithm coordinate to plot the result.We divide the number of servers(n)into three parts,for each part we can define a interval of the traffic intensity(A)based on the figure on the text books:1.when0<n<10,0.1<A<10.2.when10<n<20,3<A<20.3.when30<n<100,13<A<120.For each part,use the“erlang_b”function to calculate and then use“loglog”function to figure the logarithm coordinate.The matlab code is:%*****************************************%for the three parts.%n is the number servers.%A is the traffic indensity.%P is the blocking probability.%*****************************************n_1=[1:2];A_1=linspace(0.1,10,50);%50points between0.1and10.n_2=[10:10:20];A_2=linspace(3,20,50);n_3=[30:10:100];A_3=linspace(13,120,50);%*****************************************%for each part,call the erlang_b()function.%*****************************************for i=1:length(n_1)for j=1:length(A_1)p_1(j,i)=erlang_b(A_1(j),n_1(i));endendfor i=1:length(n_2)for j=1:length(A_2)p_2(j,i)=erlang_b(A_2(j),n_2(i));endendfor i=1:length(n_3)for j=1:length(A_3)p_3(j,i)=erlang_b(A_3(j),n_3(i));endend%*****************************************%use loglog to figure the result within logarithm coordinate. %*****************************************loglog(A_1,p_1,'k-',A_2,p_2,'k-',A_3,p_3,'k-');xlabel('Traffic indensity in Erlangs(A)')ylabel('Probability of Blocking(P)')axis([0.11200.0010.1])text(.115,.115,'n=1')text(.6,.115,'n=2')text(7,.115,'10')text(17,.115,'20')text(27,.115,'30')text(45,.115,'50')text(100,.115,'100')The figure on the text books is as follow:We can see from the two pictures that,they are exactly the same with each other except that the result of the experiment have not considered the situation with n=3,4,5,…,12,14,16,18. ing the formula(1.4),calculate the blocking probability of the Erlang C model.Draw the relationship of the blocking probability PC(n,A)and offered traffic A with n=1,2,10,20,30,40,50,60,70,80,90,100.From the introduction,we know that the formula1.4is:Since each time we calculate the,we need to recurs n times,so the formula is not efficient. We change it to be:Then we only need recurs once.is calculated by the“erlang_b”function as step1.The matlab code for the formula is:erlang_c.m%**************************************%File:erlanb_b.m%A=offered traffic in Erlangs.%n=number of truncked channels.%Pb is the result blocking probability.%erlang_b(A,n)is the function of step1.%**************************************function[Pc]=erlang_c(A,n)Pc=1/((A/n)+(n-A)/(n*erlang_b(A,n)));endThen to figure out the table in the logarithm coordinate as what shown in the step1. The matlab code is:%*****************************************%for the three parts.%n is the number servers.%A is the traffic indensity.%P_c is the blocking probability of erlangC model.%*****************************************n_1=[1:2];A_1=linspace(0.1,10,50);%50points between0.1and10.n_2=[10:10:20];A_2=linspace(3,20,50);n_3=[30:10:100];A_3=linspace(13,120,50);%*****************************************%for each part,call the erlang_c()function.%*****************************************for i=1:length(n_1)for j=1:length(A_1)p_1_c(j,i)=erlang_c(A_1(j),n_1(i));%µ÷Óú¯Êýerlang_cendendfor i=1:length(n_2)for j=1:length(A_2)p_2_c(j,i)=erlang_c(A_2(j),n_2(i));endendfor i=1:length(n_3)for j=1:length(A_3)p_3_c(j,i)=erlang_c(A_3(j),n_3(i));endend%*****************************************%use loglog to figure the result within logarithm coordinate. %*****************************************loglog(A_1,p_1_c,'g*-',A_2,p_2_c,'g*-',A_3,p_3_c,'g*-'); xlabel('Traffic indensity in Erlangs(A)')ylabel('Probability of Blocking(P)')axis([0.11200.0010.1])text(.115,.115,'n=1')text(.6,.115,'n=2')text(6,.115,'10')text(14,.115,'20')text(20,.115,'30')text(30,.115,'40')text(39,.115,'50')text(47,.115,'60')text(55,.115,'70')text(65,.115,'80')text(75,.115,'90')text(85,.115,'100')The result of blocking probability table of erlang C model.Then we put the table of erlang B and erlang C in the one figure,to compare their characteristic.The line with‘*’is the erlang C model,the line without‘*’is the erlang B model.We can see from the picture that,for a constant traffic intensity(A),the erlang C model has a higher blocking probability than erlang B model.The blocking probability is increasing with traffic intensity.The system performs better when has a larger n.ADDITIONAL BONUSWrite a program to simulate a M/M/k queue system with input parameters of lamda, mu,k.In this part,we will firstly simulate the M/M/k queue system use matlab to get the figure of the performance of the system such as the leave time of each customer and the queue length of the system.About the simulation,we firstly calculate the arrive time and the leave time for each customer. Then analysis out the queue length and the wait time for each customer use“for”loops. Then we let the input to be lamda=3,mu=1and S=3,and analysis performance of the system for the first10customers in detail.Finally,we will do two test to compared the performance of the system with input lamda=1, mu=1and S=3and the input lamda=4,mu=1and S=3.The matlab code is:mms_function.mfunction[block_rate,use_rate]=MMS_function(mean_arr,mean_serv,peo_num,server_num) %%%%%%%%%%%%%%%%%%%%%%%%%%%%%%%%%%%%%%%%%%%%% %%%%%%%%%%%%%%%%%%%%%%%%%%%%first part:compute the arriving time interval,service time%interval,waiting time,leaving time during the whole service interval %%%%%%%%%%%%%%%%%%%%%%%%%%%%%%%%%%%%%%%%%%%%% %%%%%%%%%%%%%%%%%%%%%%%%%%%state=zeros(5,peo_num);%represent the state of each customer by%using a5*peo_num matrix%the meaning of each line is:arriving time interval,service time%interval,waiting time,queue length when NO.ncustomer%arrive,leaving timestate(1,:)=exprnd(1/mean_arr,1,peo_num);%arriving time interval between each%customer follows exponetial distributionstate(2,:)=exprnd(1/mean_serv,1,peo_num);%service time of each customer follows exponetial distributionfor i=1:server_numstate(3,1:server_num)=0;endarr_time=cumsum(state(1,:));%accumulate arriving time interval to compute%arriving time of each customerstate(1,:)=arr_time;state(5,1:server_num)=sum(state(:,1:server_num));%compute living time of first NO.server_num%customer by using fomular arriving time+service timeserv_desk=state(5,1:server_num);%create a vector to store leaving time of customers which is in service for i=(server_num+1):peo_numif arr_time(i)>min(serv_desk)state(3,i)=0;elsestate(3,i)=min(serv_desk)-arr_time(i);%when customer NO.i arrives and the%server is all busy,the waiting time can be compute by%minus arriving time from the minimum leaving time endstate(5,i)=sum(state(:,i));for j=1:server_numif serv_desk(j)==min(serv_desk)serv_desk(j)=state(5,i);breakend%replace the minimum leaving time by the first waiting customer'sleaving timeendend %%%%%%%%%%%%%%%%%%%%%%%%%%%%%%%%%%%%%%%%%%%%% %%%%%%%%%%%%%%%%%%%%%%%%%%%%second part:compute the queue length during the whole service interval %%%%%%%%%%%%%%%%%%%%%%%%%%%%%%%%%%%%%%%%%%%%% %%%%%%%%%%%%%%%%%%%%%%%%%%zero_time=0;%zero_time is used to identify which server is emptyserv_desk(1:server_num)=zero_time;block_num=0;block_line=0;for i=1:peo_numif block_line==0find_max=0;for j=1:server_numif serv_desk(j)==zero_timefind_max=1;%means there is empty serverbreakelse continueendendif find_max==1%update serv_deskserv_desk(j)=state(5,i);for k=1:server_numif serv_desk(k)<arr_time(i)%before the NO.i customer actually arrivesthere maybe some customerleaveserv_desk(k)=zero_time;else continueendendelseif arr_time(i)>min(serv_desk)%if a customer will leave before the NO.i%customer arrivefor k=1:server_numif arr_time(i)>serv_desk(k)serv_desk(k)=state(5,i);breakelse continueendendfor k=1:server_numif arr_time(i)>serv_desk(k)serv_desk(k)=zero_time;else continueendendelse%if no customer leave before the NO.i customer arriveblock_num=block_num+1;block_line=block_line+1;endendelse%the situation that the queue length is not zeron=0;%compute the number of leaing customer before the NO.i customer arrives for k=1:server_numif arr_time(i)>serv_desk(k)n=n+1;serv_desk(k)=zero_time;else continueendendfor k=1:block_lineif arr_time(i)>state(5,i-k)n=n+1;else continueendendif n<block_line+1%n<block_line+1means the queue length is still not zeroblock_num=block_num+1;for k=0:n-1if state(5,i-block_line+k)>arr_time(i)for m=1:server_numif serv_desk(m)==zero_timeserv_desk(m)=state(5,i-block_line+k)breakelse continueendendelsecontinueendendblock_line=block_line-n+1;else%n>=block_line+1means the queue length is zero%update serv_desk and queue lengthfor k=0:block_lineif arr_time(i)<state(5,i-k)for m=1:server_numif serv_desk(m)==zero_timeserv_desk(m)=state(5,i-k)breakelse continueendendelsecontinueendendblock_line=0;endendstate(4,i)=block_line;endplot(state(1,:),'*-');figureplot(state(2,:),'g');figureplot(state(3,:),'r*');figureplot(state(4,:),'y*');figureplot(state(5,:),'*-');Since the system is M/M/S which means the arriving rate and service rate follows Poisson distribution while the number of server is S and the buffer length is infinite,we can computeall the arriving time,service time,waiting time and leaving time of each customer. We can test the code with input lamda=3,mu=1and S=3.Figures are below.Arriving time of each customerService time of each customerWaiting time of each customerQueue length when each customer arriveLeaving time of each customerAs lamda==mu*server_num,the load of the system could be very high.Then we will zoom in the result pictures to analysis the performance of the system for the firstly10customer.The first customer enterthe system at about1s.Arriving time of first10customerThe queue length is1for the7th customer.Queue length of first10customerThe second customerleaves the system atabout1.3sLeaving time of first10customer1.As we have3server in this test,the first3customer will be served without any delay.2.The arriving time of customer4is about1.4and the minimum leaving time of customerin service is about1.2.So customer4will be served immediately and the queue length is still0.3.Customer1,4,3is in service.4.The arriving time of customer5is about1.8and the minimum leaving time of customerin service is about1.6.So customer5will be served immediately and the queue length is still0.5.Customer1,5is in service.6.The arriving time of customer6is about2.1and there is a empty server.So customer6will be served immediately and the queue length is still0.7.Customer1,5,6is in service.8.The arriving time of customer7is about2.2and the minimum leaving time of customerin service is about2.5.So customer7cannot be served immediately and the queue length will be1.9.Customer1,5,6is in service and customer7is waiting.10.The arriving time of customer8is about2.4and the minimum leaving time of customerin service is about2.5.So customer8cannot be served immediately and the queue length will be2.11.Customer1,5,6is in service and customer7,8is waiting.12.The arriving time of customer9is about2.5and the minimum leaving time of customerin service is about2.5.So customer7can be served and the queue length will be2.13.Customer1,7,6is in service and customer8,9is waiting.14.The arriving time of customer10is about3.3and the minimum leaving time of customerin service is about2.5.So customer8,9,10can be served and the queue length will be0.15.Customer7,9,10is in service.Test2:lamda=1,mu=1and S=3Waiting time of customerQueue length when each customer arriveAs lamda<mu*server_num,the performance of the system is much better. Test3:lamda=4,mu=1and S=3Waiting time of customerQueue length when each customer arriveAs lamda>mu*server_num,system will crash as the waiting time and queue length increases as new customer arrives.For the situation of lamda<mu*server_num,the system performs better when mu and server_num are both not small.If the mu is smaller than lamda or we only have one server though with large mu,the system works not very good.It is may be because that the server time for each customer is a Poisson distribution,it may be a large time though the mu is large enough,so the more number of server,the better of the performance of the system.CONCLUSTIONAfter the experiment,we have a deeply understanding of the queuing theory,including the erlang B model and the erlang C model.What’s more,we are familiar with how to simulate the queue system for M/M/s.Through the simulation,we have known how the queue system works and the performance of the system with different input parameter.。
完整版MM1排队系统仿真matlab实验报告

M/M/1排队系统实验报告一、实验目的本次实验要求实现M/M/1单窗口无限排队系统的系统仿真,利用事件调度 法实现离散事件系统仿真,并统计平均队列长度以及平均等待时间等值, 以与理论分析结果进行对比。
二、实验原理根据排队论的知识我们知道,排队系统的分类是根据该系统中的顾客到达模 式、服务模式、服务员数量以及服务规则等因素决定的。
1、 顾客到达模式设到达过程是一个参数为的Poisson 过程,则长度为t 的时间内到达k 个呼常数,表示了平均到达率或Poisson 呼叫流的强度。
2、 服务模式设每个呼叫的持续时间为「,服从参数为的负指数分布,即其分布函数为P{X t} 1 e t ,t 03、 服务规则 先进先服务的规则(FIFO4、理论分析结果Q -在该M/M/1系统中,设,则稳态时的平均等待队长为1,顾客T --------的平均等待时间为 。
三、 实验内容M/M/ 1排队系统:实现了当顾客到达分布服从负指数分布,系统服务时间也服从负指数分布,单服务台系统,单队排队,按 FIFO (先入先出队列)方式服务。
四、 采用的语言MatLab 语言源代码:clear; clc;叫的概率 服从Poisson 分布,即Pk ⑴(t)k t k! e k 0,1,2,,其中 >0为一%M/M/1排队系统仿真SimTotal=input(' 请输入仿真顾客总数SimTotal='); % 仿真顾客总数;Lambda=0.4; % 到达率Lambda;Mu=0.9; % 服务率Mu;t_Arrive=zeros(1,SimTotal);t_Leave=zeros(1,SimTotal);ArriveNum=zeros(1,SimTotal);LeaveNum=zeros(1,SimTotal);Interval_Arrive=-log(rand(1,SimTotal))/Lambda;% 到达时间间隔Interval_Serve=-log(rand(1,SimTotal))/Mu;% 服务时间t_Arrive(1)=Interval_Arrive(1);% 顾客到达时间ArriveNum(1)=1;for i=2:SimTotalt_Arrive(i)=t_Arrive(i-1)+Interval_Arrive(i);ArriveNum(i)=i;endt_Leave(1)=t_Arrive(1)+Interval_Serve(1);% 顾客离开时间LeaveNum(1)=1;for i=2:SimTotalif t_Leave(i-1)<t_Arrive(i)t_Leave(i)=t_Arrive(i)+Interval_Serve(i);elset_Leave(i)=t_Leave(i-1)+Interval_Serve(i);endLeaveNum(i)=i;endt_Wait=t_Leave-t_Arrive; % 各顾客在系统中的等待时间t_Wait_avg=mean(t_Wait);t_Queue=t_Wait-Interval_Serve;% 各顾客在系统中的排队时间t_Queue_avg=mean(t_Queue);Timepoint=[t_Arrive,t_Leave];% 系统中顾客数随时间的变化Timepoint=sort(Timepoint);ArriveFlag=zeros(size(Timepoint));% 到达时间标志CusNum=zeros(size(Timepoint));temp=2;CusNum(1)=1;for i=2:length(Timepoint)if (temp<=length(t_Arrive))&&(Timepoint(i)==t_Arrive(temp))CusNum(i)=CusNum(i-1)+1;temp=temp+1;ArriveFlag(i)=1;elseCusNum(i)=CusNum(i-1)-1;endend%系统中平均顾客数计算Time_interval=zeros(size(Timepoint));Time_interval(1)=t_Arrive(1);for i=2:length(Timepoint)Time_interval(i)=Timepoint(i)-Timepoint(i-1);endCusNum_fromStart=[0 CusNum];CusNum_avg=sum(CusNum_fromStart.*[Time_interval 0] )/Timepoint(end);QueLength=zeros(size(CusNum));for i=1:length(CusNum) if CusNum(i)>=2QueLength(i)=CusNum(i)-1;elseQueLength(i)=0;endendQueLength_avg=sum([0 QueLength].*[Time_interval 0] )/Timepoint(end);% 长系统平均等待队%仿真图figure(1); set(1,'position',[0,0,1000,700]);subplot(2,2,1);title(' 各顾客到达时间和离去时间'); stairs([0 ArriveNum],[0 t_Arrive],'b');hold on;stairs([0 LeaveNum],[0 t_Leave],'y'); legend(' 到达时间',' 离去时间'); hold off;subplot(2,2,2); stairs(Timepoint,CusNum,'b') title(' 系统等待队长分布');xlabel(' 时间');ylabel(' 队长');subplot(2,2,3);title(' 各顾客在系统中的排队时间和等待时间'); stairs([0 ArriveNum],[0 t_Queue],'b');hold on;stairs([0 LeaveNum],[0 t_Wait],'y');hold off; legend(' 排队时间',' 等待时间');%仿真值与理论值比较disp([' 理论平均等待时间t_Wait_avg=',num2str(1/(Mu-Lambda))]);disp([' 理论平均排队时间t_Wait_avg=',num2str(Lambda/(Mu*(Mu-Lambda)))]); disp([' 理论系统中平均顾客数=',num2str(Lambda/(Mu-Lambda))]);disp([' 理论系统中平均等待队长=',num2str(Lambda*Lambda/(Mu*(Mu-Lambda)))]);disp([' 仿真平均等待时间t_Wait_avg=',num2str(t_Wait_avg)])disp([' 仿真平均排队时间t_Queue_avg=',num2str(t_Queue_avg)]) disp([' 仿真系统中平均顾客数=',num2str(CusNum_avg)]);disp([' 仿真系统中平均等待队长=',num2str(QueLength_avg)]);五、数据结构1. 仿真设计算法(主要函数)利用负指数分布与泊松过程的关系,产生符合泊松过程的顾客流,产生符合负指数分布的随机变量作为每个顾客的服务时间:Interval_Arrive=-log(rand(1,SimTotal))/Lambda; %到达时间间隔,结果与调用exprnd(1/Lambda, m)函数产生的结果相同In terval_Serve=-log(ra nd(1,SimTotal))/Mu; %服务时间间隔t_Arrive(1)=Interval_Arrive(1); %顾客到达时间时间计算t_Wait=t_Leave-t_Arrive; %各顾客在系统中的等待时间t_Queue=t_Wait-Interval_Serve; %各顾客在系统中的排队时间由事件来触发仿真时钟的不断推进。
基于Matlab的排队问题仿真

自 10 9 9年 E L N R A G开创 性 的论 文 发表 以 来 , 队论 理 论 广 泛 应 用 于通 信 、 事 、 输 、 排 军 运 维
第3 卷 第 6 2 期
21 00年 1 2月
武 汉 理 工 大 学 学 报 ・信 息 与 管 理 工 程 版
J U N L O T I F R TO O R A FWU (N O MA IN& M N G ME TE G N E IG) A A E N N IE R N
Vo _ 2 . l3 No 6 De 2 0 c. 01
应结果 。
统 内有 n个 顾客 的概 率 P () t满足 方程 :
收稿 日期 :00— 6— 2 21 0 2.
作者简介: 李字光 (9 6一) 男 , 16 , 湖北天 门人 , 武汉理工大学理学 院讲师
第3 2卷
第 6期
李 宇光 : 基于 M t b的排队问题仿真 aa l
而某 阶段 服务员 又空 闲无 事 的情 形 。服务 系统 的 服务 能力一 方 面取决 于服 务员 的数量 和服 务员 的 能力 ; 另一 方 面也 取 决 于 顾 客 流 的性 质 。排 队 问 题就 是要 寻求顾 客流 、 务 能 力 和 服务 系统 效益 服
足 这种假 设 , 因此 需要 有更 一般 的方法 。
理 包括 线性 、 非线 性 系统 、 离散 、 连续 及混 合 、 任 单
应用matlab解决排队论的问题

应用matlab解决排队论的问题应用MATLAB 解决排队论的问题背景介绍:排队论起源于1909年丹麦电话工程师A.K.爱尔朗的工作,他对电话通话拥挤问题进行了研究。
1917年爱尔朗发表了他的著名文章“自动交换机中的概率理论问题的解决”。
排队论已广泛应用于解决军事、运输、维修、生产、服务、库存、医疗、教育、水利灌溉之类的排队系统问题,显示了强大的生命力。
排队是日常生活中经常遇到的现象,如顾客到商店去购买物品、病人到医院去看病常常需要排队。
此时要求服务的数量超过服务机构的容量。
也就是说到达的顾客不能立即得到服务,应而出现了排队现象。
这种现象不仅在个人日常生活中出现,电话的占线问题,车站,码头等交通枢纽的堵塞和疏导,故障机器的停机待修。
由于顾客到达和服务时间的随机性,可以说排队现象是不可避免的。
模型介绍:1. 排队系统1.1. 输入过程顾客源:有限/无限顾客流的分布:泊松分布/一般分布1.2 排队规则排队方式:一直等待/一定时间后退出1.3 服务规则服务器数目:一个/多个服务时间的分布:指数分布/一般分布2. M/M/1模型2.1 例子:假设1) 顾客按照速率为λ的泊松过程到达一个单个服务线的服务站。
也就是说,相继达到者之间的时间是独立的具有均值1λ的指数分布。
2) 在每个顾客到达时,如果服务器闲着,就直接进入服务,否者顾客就加入队列。
当服务线完成一个顾客的服务,这个顾客就离开系统,而队列中的下一个顾客(如果有)进入服务。
3) 相继的服务时间假定是独立的具有均值1μ的指数分布。
参数:λ:顾客按泊松过程到达的速率μ:服务按指数分布的速率n P :系统中恰有n 个顾客的稳态概率L :系统中平均顾客数Q L :队列中平均等待的顾客数W :一个顾客在系统中所耗的平均时间Q W :一个顾客在队列中等待的平均时间()E S :一个顾客在服务系统中的时间解:如果系统中只有一个顾客,而且完成了服务,那么系统就变成空的了。
MM1排队系统仿真matlab实验报告

M/M/1排队系统实验报告一、实验目的本次实验要求实现M/M/1单窗口无限排队系统的系统仿真,利用事件调度法实现离散事件系统仿真,并统计平均队列长度以及平均等待时间等值,以与理论分析结果进行对比。
二、实验原理根据排队论的知识我们知道,排队系统的分类是根据该系统中的顾客到达模式、服务模式、服务员数量以及服务规则等因素决定的。
1、 顾客到达模式设到达过程是一个参数为λ的Poisson 过程,则长度为t 的时间内到达k 个呼叫的概率 服从Poisson 分布,即etkk k t t p λλ-=!)()(,⋅⋅⋅⋅⋅⋅⋅⋅⋅=,2,1,0k ,其中λ>0为一常数,表示了平均到达率或Poisson 呼叫流的强度。
2、 服务模式设每个呼叫的持续时间为i τ,服从参数为μ的负指数分布,即其分布函数为{}1,0t P X t e t μ-<=-≥3、 服务规则先进先服务的规则(FIFO ) 4、 理论分析结果在该M/M/1系统中,设λρμ=,则稳态时的平均等待队长为1Q ρλρ=-,顾客的平均等待时间为T ρμλ=-。
三、实验内容M/M/1排队系统:实现了当顾客到达分布服从负指数分布,系统服务时间也服从负指数分布,单服务台系统,单队排队,按FIFO (先入先出队列)方式服务。
四、采用的语言MatLab 语言 源代码:clear; clc;%M/M/1排队系统仿真SimTotal=input('请输入仿真顾客总数SimTotal='); %仿真顾客总数;Lambda=0.4; %到达率Lambda;Mu=0.9; %服务率Mu;t_Arrive=zeros(1,SimTotal);t_Leave=zeros(1,SimTotal);ArriveNum=zeros(1,SimTotal);LeaveNum=zeros(1,SimTotal);Interval_Arrive=-log(rand(1,SimTotal))/Lambda;%到达时间间隔Interval_Serve=-log(rand(1,SimTotal))/Mu;%服务时间t_Arrive(1)=Interval_Arrive(1);%顾客到达时间ArriveNum(1)=1;for i=2:SimTotalt_Arrive(i)=t_Arrive(i-1)+Interval_Arrive(i);ArriveNum(i)=i;endt_Leave(1)=t_Arrive(1)+Interval_Serve(1);%顾客离开时间LeaveNum(1)=1;for i=2:SimTotalif t_Leave(i-1)<t_Arrive(i)t_Leave(i)=t_Arrive(i)+Interval_Serve(i);elset_Leave(i)=t_Leave(i-1)+Interval_Serve(i);endLeaveNum(i)=i;endt_Wait=t_Leave-t_Arrive; %各顾客在系统中的等待时间t_Wait_avg=mean(t_Wait);t_Queue=t_Wait-Interval_Serve;%各顾客在系统中的排队时间t_Queue_avg=mean(t_Queue);Timepoint=[t_Arrive,t_Leave];%系统中顾客数随时间的变化Timepoint=sort(Timepoint);ArriveFlag=zeros(size(Timepoint));%到达时间标志CusNum=zeros(size(Timepoint));temp=2;CusNum(1)=1;for i=2:length(Timepoint)if (temp<=length(t_Arrive))&&(Timepoint(i)==t_Arrive(temp)) CusNum(i)=CusNum(i-1)+1;temp=temp+1;ArriveFlag(i)=1;CusNum(i)=CusNum(i-1)-1;endend%系统中平均顾客数计算Time_interval=zeros(size(Timepoint));Time_interval(1)=t_Arrive(1);for i=2:length(Timepoint)Time_interval(i)=Timepoint(i)-Timepoint(i-1);endCusNum_fromStart=[0 CusNum];CusNum_avg=sum(CusNum_fromStart.*[Time_interval 0] )/Timepoint(end);QueLength=zeros(size(CusNum));for i=1:length(CusNum)if CusNum(i)>=2QueLength(i)=CusNum(i)-1;elseQueLength(i)=0;endendQueLength_avg=sum([0 QueLength].*[Time_interval 0] )/Timepoint(end);%系统平均等待队长%仿真图figure(1);set(1,'position',[0,0,1000,700]);subplot(2,2,1);title('各顾客到达时间和离去时间');stairs([0 ArriveNum],[0 t_Arrive],'b');hold on;stairs([0 LeaveNum],[0 t_Leave],'y');legend('到达时间','离去时间');hold off;subplot(2,2,2);stairs(Timepoint,CusNum,'b')title('系统等待队长分布');xlabel('时间');ylabel('队长');subplot(2,2,3);title('各顾客在系统中的排队时间和等待时间');stairs([0 ArriveNum],[0 t_Queue],'b');stairs([0 LeaveNum],[0 t_Wait],'y');hold off;legend('排队时间','等待时间');%仿真值与理论值比较disp(['理论平均等待时间t_Wait_avg=',num2str(1/(Mu-Lambda))]);disp(['理论平均排队时间t_Wait_avg=',num2str(Lambda/(Mu*(Mu-Lambda)))]);disp(['理论系统中平均顾客数=',num2str(Lambda/(Mu-Lambda))]);disp(['理论系统中平均等待队长=',num2str(Lambda*Lambda/(Mu*(Mu-Lambda)))]);disp(['仿真平均等待时间t_Wait_avg=',num2str(t_Wait_avg)])disp(['仿真平均排队时间t_Queue_avg=',num2str(t_Queue_avg)])disp(['仿真系统中平均顾客数=',num2str(CusNum_avg)]);disp(['仿真系统中平均等待队长=',num2str(QueLength_avg)]);五、数据结构1.仿真设计算法(主要函数)利用负指数分布与泊松过程的关系,产生符合泊松过程的顾客流,产生符合负指数分布的随机变量作为每个顾客的服务时间:Interval_Arrive=-log(rand(1,SimTotal))/Lambda;%到达时间间隔,结果与调用exprnd(1/Lambda,m)函数产生的结果相同Interval_Serve=-log(rand(1,SimTotal))/Mu;%服务时间间隔t_Arrive(1)=Interval_Arrive(1);%顾客到达时间时间计算t_Wait=t_Leave-t_Arrive;%各顾客在系统中的等待时间t_Queue=t_Wait-Interval_Serve; %各顾客在系统中的排队时间由事件来触发仿真时钟的不断推进。
基于Matlab的排队问题仿真

f ( S ) =β1 e- S /βS ( S ≥0) S
应用反变换法 [2 ] ,得
A
=
-
β A
ln u1 S
=
-
β S
ln u2
其中 , u1 , u2 为 U ( 0, 1)分布随机数 。
1. 2 建立事件表
由于采用面向事件的仿真方法 , 仿真钟按下一
个最早发生事件的发生时间推进 。由此对引起系统
(上接第 14页 )
4 结束语
采用超临界 CO2 萃取大豆磷脂工艺简单 ,设备 单一 ,无溶剂残留等优点 ,所用溶剂 CO2 的性质稳 定 ,安全 ,操作方便 ,耗能低 ,价格便宜 ,提取成本较 低 。所以 ,超临界 CO2 萃取法比其它方法更优越 。 对超临界 CO2 流体萃取大豆磷脂的精制方法进行 的初步研究 ,可做以下确定 。 4. 1 超临界 CO2 萃取技术可有效地提高大豆磷脂 的含量 ,其纯度可达到 95%以上 。 4. 2 由于磷脂不溶于超临界 CO2 和乙醇 ,因此在
高静涛 , 史百战
(兰州交通大学 机电技术研究所 ,甘肃 兰州 730070)
摘 要 : 排队问题仿真的目的 ,就是要寻找服务对象与服务设置之间的最佳配置 ,保证系统具 有最佳的服务效率与最合理的配置 。本文讨论了排队问题的基本要素 ,并提出一套标准的求 解公式 。通过 M atlab软件对这些公式的仿真 ,来协助计划人员分析顾客的需求 ,从而建立符 合现有条件的服务设施 。 关键词 : M atlab; 排队问题 ; 仿真 中图分类号 : TP 39119; O 226 文献标识码 : A
Q ( t) ———t时刻排队等待的顾客数 ; T———完成 n个
顾客服务所需时间 。
MM排队系统仿真maab实验报告

M/M/1排队系统实验报告一、实验目的本次实验要求实现M/M/1单窗口无限排队系统的系统仿真,利用事件调度法实现离散事件系统仿真,并统计平均队列长度以及平均等待时间等值,以与理论分析结果进行对比。
二、实验原理根据排队论的知识我们知道,排队系统的分类是根据该系统中的顾客到达模式、服务模式、服务员数量以及服务规则等因素决定的。
1、 顾客到达模式设到达过程是一个参数为λ的Poisson 过程,则长度为t 的时间内到达k 个呼叫的概率 服从Poisson 分布,即e t kk k t t p λλ-=!)()(,⋅⋅⋅⋅⋅⋅⋅⋅⋅=,2,1,0k ,其中λ>0为一常数,表示了平均到达率或Poisson 呼叫流的强度。
2、 服务模式设每个呼叫的持续时间为i τ,服从参数为μ的负指数分布,即其分布函数为{}1,0t P X t e t μ-<=-≥3、 服务规则先进先服务的规则(FIFO )4、 理论分析结果在该M/M/1系统中,设λρμ=,则稳态时的平均等待队长为1Q ρλρ=-,顾客的平均等待时间为T ρμλ=-。
三、实验内容M/M/1排队系统:实现了当顾客到达分布服从负指数分布,系统服务时间也服从负指数分布,单服务台系统,单队排队,按FIFO (先入先出队列)方式服务。
四、采用的语言MatLab 语言源代码:clear;clc;%M/M/1排队系统仿真SimTotal=input('请输入仿真顾客总数SimTotal='); %仿真顾客总数;Lambda=0.4; %到达率Lambda;Mu=0.9; %服务率Mu;t_Arrive=zeros(1,SimTotal);t_Leave=zeros(1,SimTotal);ArriveNum=zeros(1,SimTotal);LeaveNum=zeros(1,SimTotal);Interval_Arrive=-log(rand(1,SimTotal))/Lambda;%到达时间间隔Interval_Serve=-log(rand(1,SimTotal))/Mu;%服务时间t_Arrive(1)=Interval_Arrive(1);%顾客到达时间ArriveNum(1)=1;for i=2:SimTotalt_Arrive(i)=t_Arrive(i-1)+Interval_Arrive(i);ArriveNum(i)=i;endt_Leave(1)=t_Arrive(1)+Interval_Serve(1);%顾客离开时间LeaveNum(1)=1;for i=2:SimTotalif t_Leave(i-1)<t_Arrive(i)t_Leave(i)=t_Arrive(i)+Interval_Serve(i);elset_Leave(i)=t_Leave(i-1)+Interval_Serve(i);endLeaveNum(i)=i;endt_Wait=t_Leave-t_Arrive; %各顾客在系统中的等待时间t_Wait_avg=mean(t_Wait);t_Queue=t_Wait-Interval_Serve;%各顾客在系统中的排队时间t_Queue_avg=mean(t_Queue);Timepoint=[t_Arrive,t_Leave];%系统中顾客数随时间的变化Timepoint=sort(Timepoint);ArriveFlag=zeros(size(Timepoint));%到达时间标志CusNum=zeros(size(Timepoint));temp=2;CusNum(1)=1;for i=2:length(Timepoint)if (temp<=length(t_Arrive))&&(Timepoint(i)==t_Arrive(temp)) CusNum(i)=CusNum(i-1)+1;temp=temp+1;ArriveFlag(i)=1;elseCusNum(i)=CusNum(i-1)-1;endend%系统中平均顾客数计算Time_interval=zeros(size(Timepoint));Time_interval(1)=t_Arrive(1);for i=2:length(Timepoint)Time_interval(i)=Timepoint(i)-Timepoint(i-1);endCusNum_fromStart=[0 CusNum];CusNum_avg=sum(CusNum_fromStart.*[Time_interval 0] )/Timepoint(end);QueLength=zeros(size(CusNum));for i=1:length(CusNum)if CusNum(i)>=2QueLength(i)=CusNum(i)-1;elseQueLength(i)=0;endendQueLength_avg=sum([0 QueLength].*[Time_interval 0] )/Timepoint(end);%系统平均等待队长%仿真图figure(1);set(1,'position',[0,0,1000,700]);subplot(2,2,1);title('各顾客到达时间和离去时间');stairs([0 ArriveNum],[0 t_Arrive],'b');hold on;stairs([0 LeaveNum],[0 t_Leave],'y');legend('到达时间','离去时间');hold off;subplot(2,2,2);stairs(Timepoint,CusNum,'b')title('系统等待队长分布');xlabel('时间');ylabel('队长');subplot(2,2,3);title('各顾客在系统中的排队时间和等待时间');stairs([0 ArriveNum],[0 t_Queue],'b');hold on;stairs([0 LeaveNum],[0 t_Wait],'y');hold off;legend('排队时间','等待时间');%仿真值与理论值比较disp(['理论平均等待时间t_Wait_avg=',num2str(1/(Mu-Lambda))]);disp(['理论平均排队时间t_Wait_avg=',num2str(Lambda/(Mu*(Mu-Lambda)))]);disp(['理论系统中平均顾客数=',num2str(Lambda/(Mu-Lambda))]);disp(['理论系统中平均等待队长=',num2str(Lambda*Lambda/(Mu*(Mu-Lambda)))]);disp(['仿真平均等待时间t_Wait_avg=',num2str(t_Wait_avg)])disp(['仿真平均排队时间t_Queue_avg=',num2str(t_Queue_avg)])disp(['仿真系统中平均顾客数=',num2str(CusNum_avg)]);disp(['仿真系统中平均等待队长=',num2str(QueLength_avg)]);五、数据结构1.仿真设计算法(主要函数)利用负指数分布与泊松过程的关系,产生符合泊松过程的顾客流,产生符合负指数分布的随机变量作为每个顾客的服务时间:Interval_Arrive=-log(rand(1,SimTotal))/Lambda;%到达时间间隔,结果与调用exprnd(1/Lambda,m)函数产生的结果相同Interval_Serve=-log(rand(1,SimTotal))/Mu;%服务时间间隔t_Arrive(1)=Interval_Arrive(1);%顾客到达时间时间计算t_Wait=t_Leave-t_Arrive;%各顾客在系统中的等待时间t_Queue=t_Wait-Interval_Serve; %各顾客在系统中的排队时间由事件来触发仿真时钟的不断推进。
MMN排队系统建模与仿真
《系统仿真与matlab》综合试题....................... 错误!未定义书签。
M/M/N 排队系统的模拟仿真 (1)摘要 (1)1. 问题分析 (2)2. 模型假设 (2)3. 符号说明 (3)4. 模型准备 (3)4.1 排队系统的组成和特征 (3)4.1.1输入过程 (4)4.1.2排队规则 (4)4.1.3服务过程 (4)4.1.4排队系统的主要指标 (5)4.2输入过程与服务时间的分布 (5)4.2.1负指数分布 (5)4.2.2泊松分布 (5)4.3生灭过程 (6)5. 标准M/M/N模型 (8)5.1多服务台模型准备 (8)5.2多服务台模型建立 (9)5.2.1服务利用率 (9)5.2.2平均排队长 (9)5.2.3平均队长 (10)5.2.4平均等待时间 (10)6. 程序设计 (11)6.1动画流程图 (11)6.2 M/M/N流程图 (12)7. 程序运行实例介绍 (13)7.1动画实例讲解 (13)7.2M/M/N排队系统实例讲解 (14)8. 程序实现难点和模型评价 (17)8.1程序实现难点 (17)8.2模型评价 (17)9. 参考文献 (17)10. 附录 (17)10.1动画实现的核心程序 (17)10.2 M/M/N模型计算主要程序 (22)M/M/N 排队系统的模拟仿真摘要排队是在日常生活中经常遇到的事,由于顾客到达和服务时间的随机性,使得排队不可避免。
因此,本文建立标准的M/M/N模型,并运用Matlab软件,对M/M/N排队系统就行了仿真,从而更好地深入研究排队问题。
问题一,基于顾客到达时间服从泊松分布和服务时间服从负指数分布,建立了标准的M/M/N模型。
运用Matlab软件编程,通过输入服务台数量、泊松分布参数以及负指数分布参数,求解出平均队长、服务利用率、平均等待时间以及平均排队长等重要指标。
然后,分析了输入参数与输出结果之间的关系。
基于Matlab的医院门诊候诊排队系统仿真研究
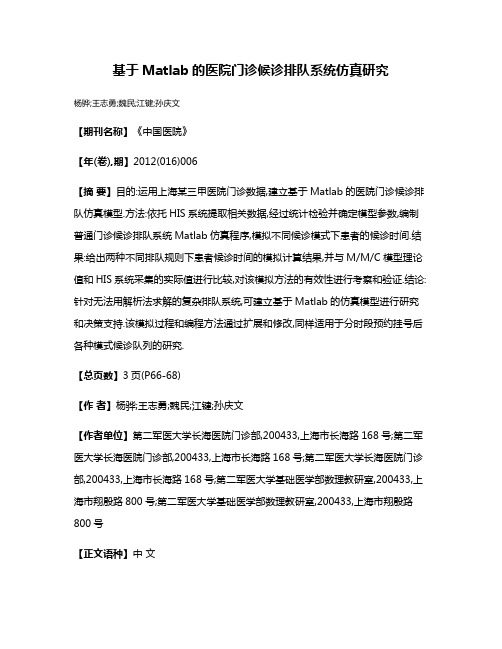
基于Matlab的医院门诊候诊排队系统仿真研究杨骅;王志勇;魏民;江键;孙庆文【期刊名称】《中国医院》【年(卷),期】2012(016)006【摘要】目的:运用上海某三甲医院门诊数据,建立基于Matlab的医院门诊候诊排队仿真模型.方法:依托HIS系统提取相关数据,经过统计检验并确定模型参数,编制普通门诊候诊排队系统Matlab仿真程序,模拟不同候诊模式下患者的候诊时间.结果:给出两种不同排队规则下患者候诊时间的模拟计算结果,并与M/M/C模型理论值和HIS系统采集的实际值进行比较,对该模拟方法的有效性进行考察和验证.结论:针对无法用解析法求解的复杂排队系统,可建立基于Matlab的仿真模型进行研究和决策支持.该模拟过程和编程方法通过扩展和修改,同样适用于分时段预约挂号后各种模式候诊队列的研究.【总页数】3页(P66-68)【作者】杨骅;王志勇;魏民;江键;孙庆文【作者单位】第二军医大学长海医院门诊部,200433,上海市长海路168号;第二军医大学长海医院门诊部,200433,上海市长海路168号;第二军医大学长海医院门诊部,200433,上海市长海路168号;第二军医大学基础医学部数理教研室,200433,上海市翔殷路800号;第二军医大学基础医学部数理教研室,200433,上海市翔殷路800号【正文语种】中文【相关文献】1.儿童医院门诊部候诊公共空间的设计研究 [J], 陈曦2.基于MatLab的排队系统仿真研究 [J], 杨武俊3.问诊单在医院船海外医疗服务妇科门诊候诊患者中的应用研究 [J], 黄菲菲;陈于;汪莹;陈珏;张玲娟4.基于AnyLogic的门诊候诊空间优化研究——以北京友谊医院为例 [J], 默秀卿;王冰冰5.基于患者心理需求下综合医院门诊候诊空间评价研究 [J], 刘飞;凌峰因版权原因,仅展示原文概要,查看原文内容请购买。
- 1、下载文档前请自行甄别文档内容的完整性,平台不提供额外的编辑、内容补充、找答案等附加服务。
- 2、"仅部分预览"的文档,不可在线预览部分如存在完整性等问题,可反馈申请退款(可完整预览的文档不适用该条件!)。
- 3、如文档侵犯您的权益,请联系客服反馈,我们会尽快为您处理(人工客服工作时间:9:00-18:30)。
2
基于 MatLab 仿真排队系统
下面以 M/M/c 模型为例 , 用 MatLab 对结果进行仿
真 。 客户到达时间和服务时间都服从指数分布 ,模拟开 始后 , 依次输入 1/λ 、1/μ 、c 和 K , 程序便开始进行 M/M/
c 排队系统的模拟并输出 L、Lq、W、Wq 等仿真结果 。 选
择 λ=4 ,μ=10/9 ,c=4 , 客户数 K 从 10000 到 100000 不 等 。 针对不同的 K 都做 6 次模拟 ,得到的实验结果取平 均值可得表 1 。
An Improved Method of the Fingerprint Orientation Field Estimating Method
CHEN Yan-yan
(School of Computer Engineering, Huaihai Institute of Technology, Lianyungang 222005) Abstract: The fingerprint has an obviously texture structured character, meanw hile, the directional map information can reflect its form character directly and abstractly. Proposes a fingerprint orienta tion estimating method based on gradient. This new method indicates that normalization should be normalized before calculating the block-gradient vectors. Expriment shows that the direc tional map information based on this new method is more accurate. Especially in the noisy area edge, the effect is more apparent. Keywords: Fingerprint Image ; Orientation Field ; Gradient Vector ; Normalization
从参数为 1/λ 的指数分布 ,服务时间服从参数为 1/μ 的 指数分布 。 设 X (t )[2] 为 t 时刻系统中的客户数 ,X (t ) 为 马可夫过程 。 当 ρ<1 时 ,该生灭过程有平稳分布 。 由马 可夫方程和概率统计分析 , 可得 :
2 ,Wq= p L= p ,Lq= p ,W= 1 1-p 1-p μ (1-p ) μ (1-p )
研究与开发
基于 MatLab的排队系统仿真研究
杨武俊
( 运城学院公共计算机教学部 , 运城 摘
044000 )
要 : 排队问题仿真的目的是要寻找服务对象与服务设置之间的最佳配置 , 保证系统 具 有 最佳 的 服务效率与最合理的配置 。 应用 MatLab 对 M/M/c ,M/M/c/N 等排队系统进行仿真 , 对仿 真结果进行评估 , 结果表明 , 该方法是切实可行的 。
[4]
图 3 顾客停留时间与等待时间曲线图 参考文献
用 MatLab [5] 仿 真 出 各 顾 客 到 达 时 刻 与 离 开 时 刻 曲 线 ,等待时间与停留时间曲线 ,如图 2、3 所示 。
1994: 112-131
[1] 孟 玉 珂 . 排 队 论 及 其 应 用 [M]. 上 海 : 同 济 大 学 出 版 社 , [2]刘次华 . 随机过程 [M]. 武汉 : 华中科技大学 , 2004: 23~57 [3] 熊 光 楞 , 肖 田 元 , 张 燕 立 . 连 续 系 统 仿 真 与 离 散 事 件 系 统 仿
n c ∞ 0
-1
Lq= pP∞ ,L=cp+ pP∞ ,W= L ,Wq=W- 1 1-p 1-p λ μ
பைடு நூலகம்(4 )M/M/c/N 系统的数学特性
M/M/c/N 系统内只有 N 个空位供顾客排队 , 顾客
到达时 , 如 果系统内尚有空位 , 则进 入 系 统 排 队 , 否 则 顾客立即离去 。 与 M/M/c 系统类似 ,如下公式可以得到
M/M/c/N 系统的 Lq、L、W、Wq [3]。 其中 PN 为客户的损失
率。
p = λ , P0 = cμ
Σ Σ n!
n=0
c-1
(cpn)
N
+Σ
n=0
(cpn)
c! cn-c
ΣP=
,
∞
-1
(cp )cp0 , PN=
图2
顾客到达时间与离开时间曲线图
c!
ccpN P ,L = p (cp )cp0 [1- (N-c+1)pN-c+ (N-c )pN-c+1] 0 q c! c! (1-p )2 L= λ (1-P∞)+Lq,W= L ,Wq=W- 1 μ λ μ
[4]B M Mehtre, Chatterjee B. Segmentation of Fingerprint Im ages-A Composite Method[J]. Pattern Recognition. 1989 (4): 381~385 [5]A.R.Rao, R.C.Jain. Computerized Flow Field Analysis: Ori ented Texture Fields[J]. IEEE Trans on Pattern Analysis and Machine Intelligence, 1992.14(7):693~709 [6] 田 捷 等 . 指 纹 识 别 技 术 的 新 进 展 [J]. 自 然 科 学 进 展 ,2006 (4 ) [7] 苏永利 , 张博 , 张书玲 . 改进的指纹图像方向 图 求 取方 法 [J]. 计算机工程与应用 ,2009 ,45(3) [8] 聂 桂 军 , 吴 陈 . 自 动 指 纹 识 别 系 统 中 连 续 分 布 方 向 图 的 研 究 [J]. 中国图象图形学报 ,2005,10(3)
[4] 唐 彦 , 王 志 坚 , 吴 吟 . 基 于 Java 的 排 队 系 统 仿 真 研 究 [J]. 北
京 : 计算机工程 ,2006
[5] 张 圣 勤 . MatLab 7.0 实 用 教 程 [M]. 北 京 : 机 械 工 业 出 版 社 , 2006: 70~105
( 下转第 57 页 )
1
排队系统及其数学特性
排队系统可以简单理解为 :客户在随机的时间来到
1.1 排队模型
一个由数台服务器组成的系统请求服务 。 每一个服务 器的服务时间是随机的 , 每一个客户接受服务后就立 即离开系统 。 排队系统主要由 3 个部分组成 : 客户到 达 、 等待队列 、 服务器 ,如图 1 所示 。
M/M/1 系统中只有一台服务器 , 客户到达间隔服
现代计算机
2010.09
趹 趨
Abstract: Queue problem's purpose is to find the simulation object of service and services between the optimal configuration, guarantee system has the best service with the most reasonable allocation efficiency. Uses MatLab language to simulate M/M/c, M/M/c/N queuing systems.The result of simulation shows that the method is feasible. Keywords: Simulation; MatLab Language; Queueing Systems; Markov Process
!!!!!!!!!!!!!!!!!!!!!!!!!!!!!!!!!!!!!!!!!!!!!!!!!
( 上接第 39 页 )
Research on Simulation of Queuing System Based on MatLab
YANG Wu-jun
(Public Department of Computer Teaching, Yuncheng University, Yuncheng 044000 )
(3 )M/M/c 系统的数学特性
M/M/c 的排队系统有 c 台服务器 ,每台服务器独立
工作 , 且具有相同分布的服务时间 , 我们假设所有服务
图 1 单服务台排队系统的结构模型
台是空的概率 P0, 所有服务台都在忙的概率 P∞, 由下面 公式可以估算 Lq、L 、W 、Wq[3]:
1.2 排队系统的数学特性
关键词 : 仿真 ; MatLab 语言 ; 排队系统 ; 马可夫过程
0
引 言
排队论是研究系统由于随机因素的干扰而出现排
K :客户数目 c:服务器的数量 λ: 客户到达率或到达强度 ρ: 服务器利用率 L: 系统平均队长 Lq:等待队列平均长度 W: 客户在系统中平均等待时间 Wq:客户在队列中平均等待时间 Little's 法则:L=λ×W Lq=W ×Wq
N 等。
表 1 模拟 M/M/c 系统结果
现代计算机
2010.09
趽 趦
图形图像
算方法 , 实验证明 , 利用归一化处理消除了梯度向量模 对方向场的影响 ,使得估算出的块方向场更加准确 。
参考文献
[1]Dario Maio. Direct Gray-Scale Minutiae Detection in Fingerprints[J]. IEEE Trans on Pattern Analysis and Machine Intelligence,1997(19)1:27~40 [2]Jain A, Hong L, Bolle R. Online Fingerprint Verification [J]. IEEE Trans on Pattern Analysis and Machine Intelligence. 1997(4):302~314 [3] 孙 冬 梅 , 裘 正 定 . 生 物 特 征 识 别 技 术 综 述 [J]. 电 子 学 报 , 2001.12(Vol. 29 No.12A)