标定软件INCA中快捷键大全
INCA使用

标定软件INCA操作流程
打开INCA软件,在 “数据库对象”下 拉菜单中,鼠标右 键-添加-添加顶层
文件夹
标定软件INCA操作流程
依次点击这三个 图标
标定软件INCA操作流程
在弹出的对话 框中选择自己 设置的文件路 径下后缀为.a2l 的文件,之后
点击确定
标定软件INCA操作流程
4)数据记录按钮
1)在弹出的对话框 中选择如图所示项目
2)点击“OK”
标定软件INCA操作流程
点击如图所示“初始 化硬件”按钮
标定软件INCA操作流程
在弹出的对话框 中点击“是”
标定软件INCA操作流程
1)点击“高级”
3)点击“执行”
2)点击“上载”
标定软件INCA操作流程
点击“OK”
标定软件INCA操作流程
在弹出的对话 框中选择设置 的文件路径下 后缀为.s19的 文件,之后点
击确定
标定软件INCA操作流程
点击如图所示“硬件”图标
标定软件INCA操作流程
1)在新界面上,点击“ 搜索已连接设备”
2)点击“OK”
标定软件INCA操作流程
2)点击“OK”
1)选择“37012” 下的“CCP:1”
标定软件INCA操作流程
点击“否”
标定软件INCA操作流程
点击“是”
标定软件INCA操作流程
点击“是”
标定软件INCA操作流程
点击“关闭”
标定软件INCA操作流程
点Hale Waihona Puke “实验环境”, 即可进入实验标定软件INCA操作流程
3)“WP”模式下可进行标定, “RP”模式下不能进行标定
INCA使用说明
INCA使⽤说明INCA6.2 使⽤说明天津同步动⼒有限公司尚震1.介绍本教程适⽤于使⽤INCA 的新⼿,INCA 主要特点:测量和标定。
使⽤此教程需要最基本的WINDOWS 操作能⼒。
1.1准备开始本教程必须保证系统装有INCA 软件。
本教程中的任务可以在演⽰模式下进⾏,这意味着你不需要任何实际硬件。
硬件模拟在ETK 测试设备和V A DI 测试设备。
该装置会随着INCA 软件安装。
确认0400.hex 和0400.a2l 这两个⽂件在\ETA SData\INCA6.2\Data\Demo 中。
最后请确认您使⽤本教程的计算机有⼀个互联⽹浏览器。
1.2建⽴⼀个DA TABA SE点击Database 选择new,然后输⼊⼯程的名字点击OK1.3 创建⼀个顶层⽂件夹点击Edi t->A dd->A dd to fol der输⼊⽂件夹名称并按回车键1.4 创建⼀个⼯作区单击Edi t->A dd->A dd fol der 并把⽂件夹命名为w orkspace选中w orkspac e 的⽂件夹,单击Edi t->A dd->Workspac e 并命名为OneETK1.5 添加⼀个⼯程先新建⼀Fol der 命名为004 并将其选中,单击Edi t->A dd->ECU proj ec t(A2L)然后添加\i nc a6.2\data\04001.6把⼯程添加到w orkspac e 中选中⼯作区OneETK,单击4 proj ec t/devi c e 下⾯打开按钮右边的选中 0400 单击OK单击 4 proj ec t/devi c e会出现许多设备,选中 ETKtestdevi c e 单击 OKINCA 界⾯会变成1.7添加V A DI 硬件组件下⾯的单击5 H ardw are选中ETK test devi c e 单击右键选中Insert选中V A DI test devi c e 单击OK然后会出现下⾯的界⾯关闭上⾯对话框返回硬件连接会显⽰然后 H ardw are->H ardware status会显⽰2.建⽴⼀个实验下⾯将学习如何将变量和窗⼝添加到实验中,并如何配置功能。
INCA基本使用

武汉菱电汽车科技有限公司
内容简介
‡ INCA的安装 ‡ INCA概述 ‡ 创建Database ‡ 添加Workspace ‡ 添加Project ‡ 配置硬件(HW) ‡ 添加Experiment ‡ 测量模块 ‡ 标定模块 ‡ 数据库的导入导出 ‡ 数据分析测量 ‡ 中英文切换 ‡ INCA缩写说明 ‡ 常用快捷键一览
数据刷写
当INCA中的数据与 ECU中的数据不相 同时,在正常初始 化后会弹出窗口提 示是否需要刷写数 据
根据下拉窗口中的选项可选择“上传、下载、复 制或Flash等来保证INCA中的数据和ECU中的数 据是相同,以此来保证标定的准确性
进入eriment
所有标定测量实验是在Experiment中进行的,配置 完毕后,点击图标 进入实验环境 实验环境注释如下图:
学习INCA时两个最基本的文档:
1.INCA_Tutorial_R6.2_EN 2.INCA_Manual_R6.2_EN
QQ:1309223593
软件破解
谢 谢!
数据集(Dataset)管理
有三种操作方式:输出列表,复制,比较。
数据库(Database)的导入导出
导出(Export)
数据库(Database)的导入导出
导入(Import)
数据分析测量
☯INCA对在标定过程中采集到的数据提供了强大
的 分析功能
☯软件名称:Measure Data Analyzer(MDA),
该软件不支持在线测量分析。
☯图标: ,也可从Experiment下打开 ☯示波器的配置:
数据分析测量
中英文切换
1、英文切换中文:
找到INCA安装盘, ETASData/INCA6.2/Switch_Language,双击 Reg_CN.reg,点击确定后重启INCA
Inca软件基本操作

hpa 机油压力
mV 电瓶电压
四、常用参数解释
名称
Rail_Psetpointbase_map LIGov_nsetpointwarm_c Engm_trqFrc_map Fmtc_trq2qBas_map Ligov_nsetpointInit_cur CTSCD_tlin_CUR Accped_trqEng_map Flmng_rlmbdsmk_map Engprt_qlim_cur DSM_Fcmclear_C Injcrv_stinjcharActVal Injcrv_stinjcharsetVal
9标定量一般分标定样式数据表样式和图表样式313设置参数样式314参数分层显示315暂停测量和记录数据315暂停测量和记录数据315暂停测量和记录数据315暂停测量和记录数据316常用快捷键的使用3161ctrli用于解释参数名称含义点击需要解释的参数ctrli显示解释3162ctrlw显示当前所在的范围3163ctrlu使wp中改变的某参数设置返回到rp状态3164ctrlz使wp中多次改变的某参数设置返回到上一次改变前的状态317查看故障码ecu和etas工具连接成功后进入epe
3.13、设置参数样式
3.13、设置参数样式
State 选项:标定量选择Disp only即可,测量量按需要选择Disp only或Disp/rec
3.13、设置参数样式
Window窗口选择调用参数存放的试验分层,以及显示的样式(测量量 一般分测量样式和示波器样式,标定量一般分标定样式、数据表样式和 图表样式)
3.5、单独调入hex数据文件
注:该方式调入的hex文件为workpage形式(可修改该数据),要变成 reference page形式(不可修改该数据),则右击该文件---set read only
INCA基本使用

目录
1. INCA介绍 2. 实际操作需要的软硬件 3. INCA操作流程及使用 4. MDA(measure data analyzer)
-1-
1、INCA介绍
INCA是德国ETAS公司出品的标定软件。主要提供一个工作平台实时监控测 量发动机的数据并进行标定。
INCA软件目前有6.1、6.2、7.0等系列软件版本。本文以INCA7.1版本为例 简要说明INCA软件基本操作。
新建试验环境 打开新试验环境
加载VUI窗口 转到inca主窗口
配置变量 公式管理
同步运行 暂停记录
管理记录 MDA分析
保存试验环境 配置硬件 添加变量 添加层 结束记录 开始记录 数据记录配置
选择VUI窗口
- 23 -
3、INCA操作流程及使用
3.7添加试验环境变量
4
3 1
变量不确定的情况下用“*”代替
此处没有hex文件,选取消
-9-
3、INCA操作流程及使用
3.3添加A2l文件
添加完成后, 如右图
- 10 -
3、INCA操作流程及使用
3.4添加dbc文件
- 11 -
3、INCA操作流程及使用
3.4添加dbc文件
- 12 -
3、INCA操作流程及使用
3.4添加dbc文件
- 13 -
3、INCA操作流程及使用
INCA基本操作界面
新 打 存 剪拷粘 删 建 开 储 切贝贴 除
收 缩
展导 导 开入 出
添 加
添 加 标 定 界 面
添
加 添
加
项 目
设 置
用 户 设 置
新 建
标
INCAM操作讲解

INCAM操作讲解总目录:一、Incam软件基本操作介绍。
1.1、Incam操作界面、常用菜单栏、工具栏介绍。
1.2、Incam操作常用快捷键介绍。
1.3、Cam料号名及层别命名介绍。
1.3、Incam基本操作考核。
二、第一阶段操作步骤讲解。
1、Input操作步骤讲解。
1.1、Gerber274X、Gerber274D格式Input讲解。
1.2、Input资料前处理操作讲解。
1.3、Input各种Gerber格式操作考核。
2、钻孔补偿操作讲解及考核。
3、Aarray制作讲解及考核。
4、阻抗制作讲解及考核。
5、Panel制作讲解及考核。
6、Ding床、Pcs/Set治具制作讲解。
7、第一阶段综合考核。
三、第二阶段操作步骤讲解。
1、外层制作讲解及考核。
2、防焊制作讲解及考核。
3、文字制作讲解及考核。
4、化金制作讲解及考核。
5、塞孔、挡点制作讲解及考核。
6、成型程式、厂内机构制作讲解及考核。
7、第二阶段综合考核。
一、Incam软件基本操作介绍:1.1.1进入Incam软件界面在桌面右击terminal在出现的界面里健入“get”在弹出的对话框中输入用户名和密码。
如图一:图一图二1.1.2进入Incam操作界面,如图二:1.1.3在料号名过滤器中输入料号名进入Incam主窗口,如下图:菜单栏、常用工具栏Input窗口资料编辑窗口成型编辑窗口排版窗口Ouput窗口程式输出窗口库文件窗口层别显示、编辑区资料显示区Step选择区1.1.4常用菜单栏介绍:File(文件)、Edit(编辑)、View(视图)。
Step(step)、Layer(层别)、Tools(工具)。
新建打开导入导出导出.tgz 格式保存另存为打印料号上锁部分上锁料号解锁冻结关闭退出删除切除撤消撤消上一步比例变形连接转角添加移动复制修改尺寸极性转变改变铜皮暂存属性指令框编辑框层别显示框显示结果工具条参考零点重命名删除新建选择建立冻结建立profile 定义零点原点复制对齐层别比对层别复制层别打散层别极性分层优化极性建立map 图锁点工具profile 选择过滤器物件过滤器钻孔管理器物件清单选择清单标记物件属性选择工具量测工具残铜率Netlist(网络)、Action(动作)、Settings(设置)1.1.5常用工具栏介绍:新建保存选择step 撤消上步锁点开/关锁住profile 线设置网格大小打开编辑step执行被撤消锁点类型锁住网格点选区域选多边形选同层网络选反选添加PAD 添加铜皮剪切粘贴全选框选同网络的线全板网络选取消选择添加线添加文字复制删除移动镜像框选放大按中心放大撤消上步放大取窗口放大复制旋转反极性显示全部按中心放小坐标放大图片抓取删除无角度拉伸打断拉伸无角度拉伸截取拉伸折线有角度拉伸打断拉伸有角度拉伸截取拉伸比对网络调出网络设置基准网络删除网络设置CAD 网络新建checklist打开checklistDFM 参数分析系统设置客户颜色设置显示设置网格设置选择设置缓存设置1.2Incam操作常用快捷键汇总:1Ctrl+A将鼠标变成放大功能43Ctrl+Q选择同种类型的物体2Ctrl+F刷新屏幕44Ctrl+E加大script3Ctrl+Shift+A选择所有物体45Shift+L关闭打开的层别4Alt+R将鼠标变成框选功能46Alt+e+c+o copy到另外一层5B返回上一个比例的界面47Alt+e+m+o move到另外一层6W copy bak层48Alt+e+s+c物件整体化7Shift+F显示matrix区域49Alt+e+z+g减小/加大物件尺寸8Shift+G显示功能区域50Alt+e+i裁切物件9Alt+C double复制51Alt+e+p+p正负极性转换10Shift+R反选52Alt+e+h+y改变symbol11Ctrl+B删除选中的物体53Alt+e+h+t改变文字12Ctrl+G更改网格状态54Alt+e+v+b打散13Ctrl+Alt+L重新导入incam界面布局55Alt+e+v+s替换symbol14Alt+N建立新料号56Alt+e+b+e移排线15Ctrl+N显示负片57Alt+e+e物件属性定义编辑16Ctrl+Shift+P显示profile58Alt+e+l连接线、R角17Ctrl+O打开料号59Alt+e+v+f pad转弧18Ctrl+P打印功能60Alt+s+t新建profile 19Ctrl+R在排版中显示子step的内容61Alt+s+a定相对原点20Ctrl+S存盘62Alt+t+f过滤器21Ctrl+Shift+S打开抓取功能63Alt+t+g cam_flow22Ctrl+Alt+S存入自己定制的incam界面布局64Alt+t+d钻孔补偿23Ctrl+T转换功能(Trasnform)65Alt+t+k checklist24Ctrl+U更改单位66Alt+t+c关闭资料25Ctrl+Alt+V incam默认显示内容67Alt+t+x退出窗口26Ctrl+W更改显示物体构造68s+e抓取物件边界27Shift+V切换鼠标焦点69s+p抓取profile 28Ctrl+Z undo70s+s抓取线中心29Shift+C不选中任何物体71s+c抓取端点中心30Home图形编辑正常显示72s+i抓取交点31Ctrl+H图形编辑正常显示73s+a转换工作层别32Ctrl+-图形编辑缩小功能74s+o关闭抓取功能33Ctrl++图形编辑放大功能75s+m抓取圆弧圆心34Page Down图形编辑缩小功能76Alt+e+y整理重线35Page Up图形编辑放大功能77Alt+e+a+p添加PAD36Insert绑定鼠标焦点78Alt+e+a+t添加线37Ctrl+X移动物体79Alt+e+a+s添加铜皮38Ctrl+C将选中内容复制到缓存80Alt+e+a+x添加文字39Ctrl+V将缓存的内容黏贴81Alt+e+a+o添加slot孔40Ctrl+M 显示中点(添加物体时比较有用)82Alt+a+d+c+v手动转pad41Ctrl+I添加层别83Alt+d+h+v自动拉孔42Ctrl+F2查看存盘记录等1.3料号命名与层别定义例:HK06N87046B0H代表HDI板M代表传统PCBK代表表面处理方式选择性化金(E为全板金、O为全板OSP、A为全板化银、F为喷锡、L为金手指+化金、R为金手指+化金+OSP、T为无铅喷锡等)。
CAM快捷键
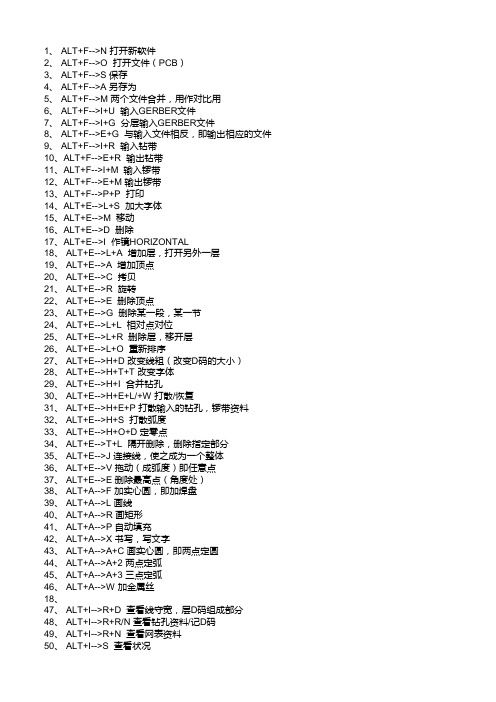
1、 ALT+F-->N 打开新软件2、 ALT+F-->O 打开文件(PCB)3、 ALT+F-->S 保存4、 ALT+F-->A 另存为5、 ALT+F-->M 两个文件合并,用作对比用6、 ALT+F-->I+U 输入GERBER文件7、 ALT+F-->I+G 分层输入GERBER文件8、 ALT+F-->E+G 与输入文件相反,即输出相应的文件9、 ALT+F-->I+R 输入钻带10、ALT+F-->E+R 输出钻带11、ALT+F-->I+M 输入锣带12、ALT+F-->E+M 输出锣带13、ALT+F-->P+P 打印14、ALT+E-->L+S 加大字体15、ALT+E-->M 移动16、ALT+E-->D 删除17、ALT+E-->I 作镜HORIZONTAL18、 ALT+E-->L+A 增加层,打开另外一层19、 ALT+E-->A 增加顶点20、 ALT+E-->C 拷贝21、 ALT+E-->R 旋转22、 ALT+E-->E 删除顶点23、 ALT+E-->G 删除某一段,某一节24、 ALT+E-->L+L 相对点对位25、 ALT+E-->L+R 删除层,移开层26、 ALT+E-->L+O 重新排序27、 ALT+E-->H+D 改变线粗(改变D码的大小)28、 ALT+E-->H+T+T 改变字体29、 ALT+E-->H+I 合并钻孔30、 ALT+E-->H+E+L/+W 打散/恢复31、 ALT+E-->H+E+P 打散输入的钻孔,锣带资料32、 ALT+E-->H+S 打散弧度33、 ALT+E-->H+O+D 定零点34、 ALT+E-->T+L 隔开删除,删除指定部分35、 ALT+E-->J 连接线,使之成为一个整体36、 ALT+E-->V 拖动(成弧度)即任意点37、 ALT+E-->E 删除最高点(角度处)38、 ALT+A-->F 加实心圆,即加焊盘39、 ALT+A-->L 画线40、 ALT+A-->R 画矩形41、 ALT+A-->P 自动填充42、 ALT+A-->X 书写,写文字43、 ALT+A-->A+C 画实心圆,即两点定圆44、 ALT+A-->A+2 两点定弧45、 ALT+A-->A+3 三点定弧46、 ALT+A-->W 加金属丝18、47、 ALT+I-->R+D 查看线守宽,层D码组成部分48、 ALT+I-->R+R/N 查看钻孔资料/记D码49、 ALT+I-->R+N 查看网表资料50、 ALT+I-->S 查看状况51、 ALT+U-->C D码定义把某种图形定义一个D码52、 ALT+U-->D+A 自动转换53、 ALT+U-->D+I D码转换(把某种复杂图形转换为焊盘)54、 ALT+U-->N 连网(一般连网这后做DRC后才可显示检测资料)55、 ALT+U-->L+R 切除独立的焊盘56、 ALT+U-->L+I 切除多余的焊盘57、 ALT+U-->I+T 钻孔编辑表—复制到外形层58、 ALT+U-->I+R 优化钻孔59、 ALT+U-->I+A 添加钻孔60、 ALT+U-->I+G 转为钻孔70、 ALT+U--Z 补尝线宽61、 ALT+N-->R 做DRC(帮助检查线距、线宽等)62、 ALT+T-->A 输入D码大小,D码表63、 ALT+T-->L层表,定义层的性质,名称64、 ALT+S-->U 公,英制转换65、 ALT+S-->T 字体设置66、 ALT+S-->O 察看设置67、 ALT+S-->A打散时的弧度设置68、 ALT+N-->O测铜面积(参数选择为1mil,一般需连网之后再进行测量69、 ALT+I-->M+P 测量距离CAM350快捷键。
Inca_软件基本操作

3.13、设置参数样式
Window窗口选择调用参数存放的试验分层,以及显示的样式(测量量一 般分测量样式和示波器样式,标定量一般分标定样式、数据表样式和图 表样式)
3.14、参数分层显示
3.15、暂停、测量和记录数据
3.15、暂停、测量和记录数据
3.8.5、初始化
3.8.5、初始化
3.8.5、初始化
3.9、刷写数据
Flashing programming---working page(reference page)--do it
3.9、刷写数据
选择Prof文件
3.9、刷写数据
选择刷写波特率,125K和250K均可
3.9、刷写数据
• 3.8.5、初始化
初始化之前应确保网线、K线、电源线、线束 及ECU连接正确,24V(或12V)直流电源供电 正常,各接口连接紧固。同时要确保IP –manger
状态正确,显示如下:
3.8.5、初始化
注:该IP为个人电脑的IP地址,此图表可在电脑右下角显示。查看步骤如下
3.8.5、初始化
开始-所有程序-ETAS-ETK driver&Tools---ETAS network setting
两种ECU
三、软件基本操作
3.1、起动进入主界面
3.2 、新建database
Database窗口→New
3.2 、新建database
选择OK
3.3、创建workspace
Edit----Add-----Workapce或者 右键----Add----Workspace
3.4、同步添加A2l、hex文件
3.9、刷写数据
选择操作项,刷数据之前最好先 read ECU-ID
INCA使用说明

添加project
使用INCA进行标定的前提条件是要创建一个控制单元的镜 像文件并把它以数据集dataset的形式存储到INCA里面。这 通常需要下列文件:
–带有数据的物理性描述的描述文件(*.a2l) –包含由代码和数据构成的控制单元程序的hex文件(*.hex)
•工作页和参考页的不同数据集单独的存储在INCA中,作 为工作数据集和只读参考数据集。 •当安装第一个HEX文件时,该文件的代码部分被映射到控 制单元的项目中,而数据部分被存储到一个主数据集中了, 然后这个主数据集用来创建需要的工作数据集。
• 5、进入试验环境后,在WP(WorkingPage)工 作页里面调出相应MAP和功能模块的相关变 量,进行标定和验证。 • 6、生成新hex文件后进行trim,最终再次把数 据刷到ECU。
创建Database的步骤
• • • • • 首先推荐用户为每一次试验都建立一个新的数据库 1. 选择Database →New. 2. 在New Database对话框内, 输入一个名字. 3. 点击OK. 为了能够创建workspaces, experiments, and Projects,首 先需要客户在数据库内创建一个top folder.然后, Workspaces, Experiments, and Projects 数据库都是在这个 top folder下创建的 • a. 选择Edit →Add top folder. • b. 命名这个top folder,并点击<ENTER>.
创建新的工作数据库
3、在当前目录下分别点击1、2、3对应的图标创建数据开发需要的试验环境 (experiment)、试验空间(workespace)和试验项目(project)。
INCA基础教程
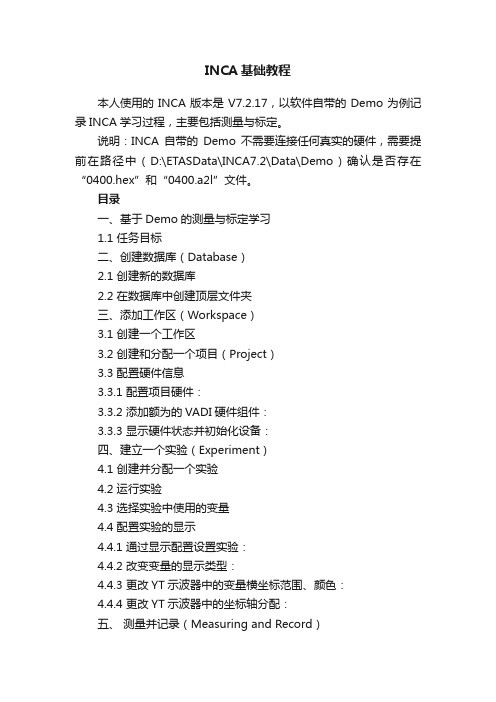
INCA基础教程本人使用的INCA版本是V7.2.17,以软件自带的Demo为例记录INCA学习过程,主要包括测量与标定。
说明:INCA自带的Demo不需要连接任何真实的硬件,需要提前在路径中(D:\ETASData\INCA7.2\Data\Demo)确认是否存在“0400.hex”和“0400.a2l”文件。
目录一、基于Demo的测量与标定学习1.1 任务目标二、创建数据库(Database)2.1 创建新的数据库2.2 在数据库中创建顶层文件夹三、添加工作区(Workspace)3.1 创建一个工作区3.2 创建和分配一个项目(Project)3.3 配置硬件信息3.3.1 配置项目硬件:3.3.2 添加额为的VADI硬件组件:3.3.3 显示硬件状态并初始化设备:四、建立一个实验(Experiment)4.1 创建并分配一个实验4.2 运行实验4.3 选择实验中使用的变量4.4 配置实验的显示4.4.1 通过显示配置设置实验:4.4.2 改变变量的显示类型:4.4.3 更改YT示波器中的变量横坐标范围、颜色:4.4.4 更改YT示波器中的坐标轴分配:五、测量并记录(Measuring and Record)5.1 加载Lambda标定实验并进行测量5.2 利用示波器分析测量结果5.2.1 在示波器中停止显示5.2.2 移动时间轴5.2.3 增加显示器大小5.2.4 添加光标5.2.5 添加边界线5.3 手动创建记录器5.3.1 创建记录管理器5.3.2 向记录器中添加变量5.3.3 指定存储记录的文件一、基于Demo的测量与标定学习1.1 任务目标目标:通过标定λ值优化燃料在发动机中燃烧的方式,以减少整体燃料的消耗和排放。
λ值的含义是指在气缸内燃烧的空气与燃料的比值(空燃比),理论情况下1kg的燃料需要14.7kg的空气。
二、创建数据库(Database)2.1 创建新的数据库(1)选择界面左上角的数据库→新建;(2)在新建数据库对话框中输入数据库的名字“Tutorial”,然后点击OK。
CAM快捷键

Alt+1 设置构图深度F1 窗口放大
Alt+2 设置系统颜色F2 缩小
Alt+3 设置系统图层F3 重画
Alt+4 设置限定图层F4 分析
Alt+5 设置限定图层F5 删除
Alt+6 设置刀具平面F6 文件
Alt+A 使用自动存储F7 修整
Alt+B 工具栏可见/不可见F8 绘图
Alt+C 运行c-hooks F9 显示屏幕上的资料
Alt+D 设置标尺寸全局参数F10 列出所有功能键的定义
Alt+E 进入消隐功能Alt+F1 屏幕适度化
Alt+F 设置一种新字体Alt+F2 缩小0.8倍
Alt+G 进入选择格点参数对话框Alt+F3 切换显示光标位置的坐标Alt+H 进入在线帮助Alt+F4 退出系统
Alt+I 列表打开文件Alt+F5 删除窗口内的图素
Alt+J 进入工作设置参数Alt+F6 待用户分配
Alt+K Alt+F7 隐藏
Alt+L 设置线型和线宽Alt+F8 系统规划
Alt+M 查看内存配置Alt+F9 显示坐标轴
Alt+N 编辑视角名Alt+F10 列出所有功能键的定义Alt+O 进入操作管理对话框Alt+‘ 用两点画圆
Alt+P 使提示区可见/不可见Esc 中断命令
Alt+Q 取消上次操作PageDown 窗口放大
Alt+R 编辑上次操作PageUp 缩小
Alt+S 切换全时间阴影处理开/关End 视图自动旋转Alt+T 切换刀具路径开关方向键四方面平移Alt+U 取消上次操作Alt+方向键改变视点Alt+V 显示版本号和产品序列号
Alt+W 设定视区设置
Alt+X 进入转换菜单
Alt+Y 固体历史编辑器
Alt+Z 设置可见层。
INCA基本操作
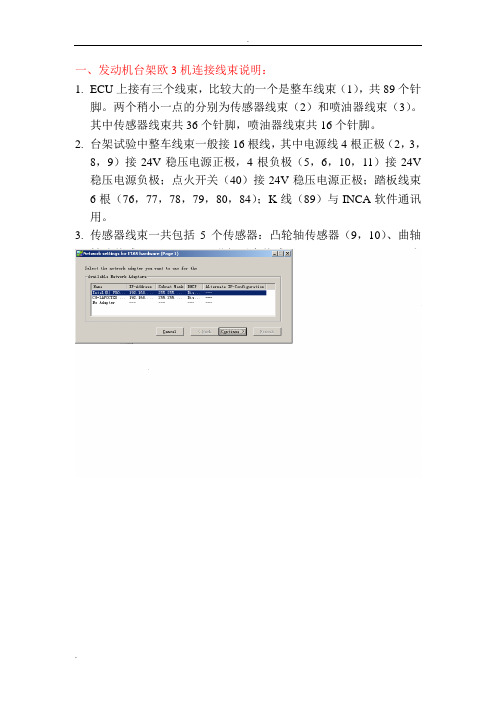
一、发动机台架欧3机连接线束说明:1.ECU上接有三个线束,比较大的一个是整车线束(1),共89个针脚。
两个稍小一点的分别为传感器线束(2)和喷油器线束(3)。
其中传感器线束共36个针脚,喷油器线束共16个针脚。
2.台架试验中整车线束一般接16根线,其中电源线4根正极(2,3,8,9)接24V稳压电源正极,4根负极(5,6,10,11)接24V 稳压电源负极;点火开关(40)接24V稳压电源正极;踏板线束6根(76,77,78,79,80,84);K线(89)与INCA软件通讯用。
3.传感器线束一共包括5个传感器:凸轮轴传感器(9,10)、曲轴转速传感器(19,23);进气压力传感器(25,33,34,36);水温传感器(15,26);轨压传感器(12,13,14);喷油器线束除6个缸以外,还有高压泵的流量计量单元(ZME,9,10)。
4.标定工具ES590或ES690上连接与电脑通讯的网线一根,接24V稳压电源的电源线一根,与带ETK的ECU通讯的ETK线一根,与ECU通讯的K线一根。
其中K线红(接24V稳压电源正极),黑(接24V稳压电源负极),黄(接信号线1.89)二、INCA(Integrated Calibration and Application)软件基本操作1. 网址设置(Network Setting)要使计算机与ES590正常通讯,必须正确设置网址。
首先将控制面板中所用的网卡IP设置为192.168.40.2(→10)其次在INCA软件菜单中→Utilities→ETAS Network settings →Continue→Default→Continue→Finish2. INCA基本操作①建立数据库(items)、工作区(workspace)、环境文件(Experiments)、选取硬件(Hardware)。
②建立数据库时,在items中右键→Add→Add top folder,items右键→Add→ECU project(A2L),此时出现选择.a2l文件的对话框。
Inca 软件基本操作

3.8、在线连接基本步骤
3.8.1、基本界面如下
3.8.2、选择要用的hex数据
3.8.2、选择要用的hex数据
3.8.3、选择要用的试验环境
3.8.3、选择要用的试验环境
3.8.4、硬件连接选项
3.8.4、硬件连接选项
点击
3.8.4、硬件连接选项
点击
搜索链接硬件,或者点击Hardware窗口---Search for hardware
注:该方式调入的hex文件为workpage形式(可修改该数据),要变成 reference page形式(不可修改该数据),则右击该文件---set read only
3.5、单独调入hex数据文件
3.5、单独调入hex数据文件
3.6、导出hex文件
右击要导出的hex数据-- create Hex file
3.13、设置参数样式
3.13、设置参数样式
State 选项:标定量选择Disp only即可,测量量按需要选择Disp only或Disp/rec
3.13、设置参数样式
Window窗口选择调用参数存放的试验分层,以及显示的样式(测量量一 般分测量样式和示波器样式,标定量一般分标定样式、数据表样式和图 表样式)
3.18、MDA(测量数据分析)使用
3.18.1、进入界面
3.18.1、进入界面
3.18.2、打开选择文件
3.18.2、打开选择文件
3.18.3、选择分析参数
3.18.3、选择分析参数
选择需要分析的参数,OK
3.18.4、选择显示形式
选择显示形式
3.18.5、MDAsetpointbase_map LIGov_nsetpointwarm_c Engm_trqFrc_map Fmtc_trq2qBas_map Ligov_nsetpointInit_cur CTSCD_tlin_CUR Accped_trqEng_map Flmng_rlmbdsmk_map Engprt_qlim_cur DSM_Fcmclear_C Injcrv_stinjcharActVal Injcrv_stinjcharsetVal 单位 Hpa rpm Nm mg/cyc rpm Degc Nm -Mg/hub 描述 基础轨压map 暖机设定怠速转速 摩擦功map 油量扭矩转化map 怠速随水温设定曲线 水温传感器标定曲线 油门开度与扭矩map 冒烟限制map 外特性油量限制曲线 清错参数 实际喷油状态 设定喷油状态
INCA软件最新版操作手册
INCA软件最新版操作⼿册INCA EnergyOperator Manualf??ìé=OKN=g~?ì~êó=OMMSOxford Instruments AnalyticalHalifax RoadHigh Wycombe HP12 3SE, UKSection 1 - INCA Energy System Overview1Section 2 - Introduction to INCA Energy Software2 Navigators23 DataManagementHelp 10 Energy Options12Section 3 – Description of Main Steps131.Optimum Microscope Conditions Setup for X-ray Microanalysis142.Quant optimization - Why do we need to do it?173.Selecting Optimum Acquisition Conditions for X-ray Acquisition194.Start/Stop/Resume Spectrum Acquisition215.Automatic Peak Identification (AutoID)216.Manually Identifying Peaks237.Spectrum Display and Manipulation258.Spectrum Export259.Four Modes of Spectra Acquisition2510.Acquiring Spectra from Lines and Grids of Beam Points27 /doc/9e651c43eff9aef8941e069d.html pare2912.Quantitative Analysis3113.SmartMap4514.Element Maps4815.LineScan5016.Cameo+5217.PhaseMap53QuantMap5718.19.AutoMate59Montage 6520.21.Feature6884Report22.Section 1 - INCA Energy System OverviewThe main components that make up an INCA Energy system are:PCx-stream module to control X-ray acquisition and/ or mics module to control imaging EDS detector to detect X-raysThe PC is loaded with the INCA Energy software and an IEEE 1394 card.System Block DiagramFigure 1: INCA Energy SystemPage 1Page 2Section 2 - Introduction to INCA Energy SoftwareThe INCA software platform has four main components:Navigators ?Data Management ?Help ?Energy OptionsNavigatorsThe INCA software platform has unique navigators for guiding the user through the stages of the microanalysis process from starting a new project to producing a hardcopy report.You can easily switch between a Navigator, which directs the work flow, and the data tree which keeps avisual record of work progress.Point & ID Navigator Data treeData ManagementData within INCA Energy and Energy TEM is archived in a logical and easily accessible manner and can be directly viewed in the Data tree. To access the Data tree, press the Data tab to the right of the Navigator tab.ProjectsWithin INCA Energy, data is managed within Projects as illustrated by the Data tree shown above. As you acquire data, you will see your data build up in the Data tree. The entries in theData tree can be renamed within the Data tree view.Within a Project you may examine more than one Sample, and on each Sample, more than one Site of Interest. Data acquired from an individual Site of Interest is stored together for example electron or Cameo+ image, spectra and maps as easily recognizable icons as displayed below:Page 3Page 4SpectrumProjectSmartMapSampleSite of InterestReconstructed spectrumSynthesized spectrumPhaseMapCameo+imageElement MapISIS Imported spectrumElectron imageOther images (e.g. ISIS Importedimage)Combined ED/WD spectrumNote that more than one Project can be viewed at any one time in the Data tree. ?A Project is a single file with the extension .ipj which can be saved in any directory on any drive in the conventional Windows? way. Note that the name of the current Project is displayed as partof the Menu Title.At any time you can save your Project by going to the main menu, under File and selecting 'Save Project as' or using Ctrl and S on the keyboard. Autosaving your ProjectYou can set the Autosave function to save your current Project at regular intervals. This can be set by going to the main menu, under Options, and checking the box in Preferences under'Saving'.If you open a Project and you have the Autosave function on, Autosave will save the Project ontop of the original.If you create a Project and save it and you have the Autosave function on, further autosaves will save the Project to the original saved location.If you create a new Project and you have the Autosave function on, Autosave will save the Project to a recovery file.The recovery file is located under Program files\INCA\Data. If you wish to open this file, make a copy of this file with a different name in a different directory.Note that Autosave does not take effect during data acquisition.Autosave does not function on read-only Projects.If you have multiple Projects open, ensure that you save your Projects.Samples and Site of InterestWithin a Project you may analyze more than one Sample, and on each Sample, more than one Site of Interest.Data acquired from an individual Site of Interest is stored together for example electron or Cameo+ image, spectra and maps as easily recognizable icons. The current analytical conditions such as kV, Mag and Quant optimization data are also stored with the data.Thumbnail images of the individual images and spectra can be easily viewed by hovering over the data labels with the mouse.Page 5Exporting spectra, images, maps, linescans and Cameo+ dataElectron images, maps, linescans, Cameo+ images and spectra can be exported from INCA in a variety of formats thus allowing them to be read by appropriate software packages. You can export either from the data tree or from theimage/spectrum viewer:Data treeTo export from the Data tree click with the right hand mouse button on the data label and select Export. This enables the user to convert and export the data in file formats such as JPG and TIF:Image ViewerWhen you click with the right hand mouse button on an image or map you have two options for exporting:?ExportThis allows the data to be converted as a bitmap (BMP), TIFF (TIF), or JPEG(JPG, with optional high compression) file. You can select the image size fromthe drop-down list. The default size is set to the size of the original image. Enterthe file name and select a folder in which you wish to save the image:Page 6Page 7Export Data OnlyThis allows the raw data to be exported in suitable formats for further processinge.g., 8-bit or 16-bit TIF and TSV (Tab Separated Variable). Only raw data isexported without contrast enhancement or annotation. However, the TIFF Coloroption will save a color image with contrast enhancement. The scalinginformation is also included in the exported data.If you have analySIS ?software (Soft Imaging Systems) installed on your computer you can export the data to the analySIS ?database. There are two options for exporting data to the analySIS ?database:analySIS ?database: Use this option if you wish to export the raw data. analySIS ?database (color): Use this option if you wish to export eithera Cameo+ image or a contrast enhanced image. Spectrum ViewerWhen you click with the right hand mouse button on the spectrum you are allowed to convert and export the spectrum as BMP, TIF, JPG or WMF(Metafile). You can also export the spectrum inEMSA or ISIS format. If you have analySIS software installed on your computer you can exportthe data to the analySIS database.Linescan ViewerYou can export a linescan in a variety of formats. When you click with the right hand mousebutton on the linescan you are allowed to convert and export the linescan as BMP, JPG or TSVetc.Note that it is the data as currently displayed which is exported. Therefore, if the current image has been zoomed, the contrast or brightness, the color or the spectrum scaling has beenchanged, this will be included in the conversion.Note also that images exported to files include the scalemarker.Exporting SmartMap dataYou can export the current SmartMap data by selecting 'Export SmartMap' under File from the main menu.Exporting data in an INCA formatElectron images, maps, Cameo+ images and energy dispersive (ED) spectra can be exported from INCA in an INCA format. These can be displayed within INCA Viewer.Click with the right hand mouse button on the data label, select Export and then, INCA Export Format. This allows the data to be converted and exported in file formats: .iex for spectra and .mcv for images. INCA ViewerINCA Viewer is installed with INCA although INCA Viewer can be installed separately if desiredTo start INCA Viewer either:Double click on the exported file from Windows ExplorerSelect INCA Viewer from Start/Programs/Oxford Instruments menuCopying spectra, images, maps, linescans and Cameo+ dataSpectra, electron images, maps, linescans, Cameo+ images and spectra can be copied to the clipboard from INCA Energy in two ways:1.By clicking with the right hand mouse button on the data label and selecting Copy.2.By clicking with the right hand mouse button on the image, linescan etc and selecting Copy. Hereyou are allowed to choose the size of the image before you copy it to the clipboard:The data will be copied to the Clipboard. You can then use your desired application into which you wish to transfer the image etc from the Clipboard.Note that it is the data as currently displayed which is copied. Therefore, if the current image has been zoomed, the contrast or brightness, the color, or the spectrum scaling has been changed;this will be included in the copying.Note also that images copied to the clipboard include the scalemarker.Page 8Deleting images, spectra, samples and Sites of InterestSpectra, electron images, maps, linescans, Cameo+ images and spectra can be deleted from INCA Energy by clicking with the right hand mouse button on the data label and selecting delete.Projects, Sites of Interest and Samples can also be deleted directly from the Data tree by clicking with the right hand mouse button on the appropriate icon.Note: You can not delete the last Site of Interest in a Sample and last Sample in a Project. Page 9Page 10HelpThere is an expert multimedia user Help system, which is fully integrated with the applications software. The Help has the following features:On-line Bubble help and tool tips for expert advice and guidance through each stage of the microanalysis process.A fully integrated and indexed microanalysis encyclopaedia that provides comprehensive description of key microanalysis terms, background, and theory.Multimedia training and background tutorials with movie based modules.‘Getting Started’ multimedia tutorial for immediate training of new user.Also, advice on using the application to achieve good results.INCA Bubble HelpINCA TutorialsPage 11Energy OptionsThe basic packaged system has two navigators:AnalyzerMappingThe advanced packaged system has three navigators:AnalyzerPoint & IDMappingThere are additional software options such as Cameo+, Spectrum Synthesis, PhaseMap, Matching, AutoMate, GSR, QuantMap and Feature. The basic system can be upgraded in steps by adding new software options easily.Application KeysEach software application is supplied as a key-enabled locked module. You need to have an appropriate key for unlocking each application.Page 12Section 3 – Description of Main StepsThis manual describes the main steps to enable the users to carry out analysis using the INCA Energy system. Comprehensive INCA Energy Help is available within the software that users can easily access for further information. List of topics described in the manual are:1. Optimum Microscope Conditions Setup for X-ray Microanalysis2. Quant Optimization3. Selecting Optimum Conditions for X-ray Acquisition4. Start/Stop/Resume Spectrum Acquisition5. AutoMatic Peak Identification (AutoID)6. Manually Identifying Peaks7. Spectrum Display and Manipulation8. Spectrum Export9. Four Modes of Spectrum Acquisition10. Acquiring Spectra from Lines & Grids of Beam Points11. Compare12. QuantitativeAnalysis13. SmartMapMaps14. Elementscans15. Line16. Cameo+17. PhaseMap18. QuantMap19. AutoMate20. Montage21. Feature22. ReportPage 131. Optimum Microscope Conditions Setup for X-ray MicroanalysisThe main purpose of this step is to enable you to set up an appropriate X-ray count rate from your sample to use for your analysis before you start collecting data into your Project.If you are starting a new session with INCA Energy, there are a few things we recommend you optimize on your microscope, which will ensure that you get the best results for your analysis.The main points to consider are listed below.1.1 Are you working with tilted samples?If you are working with tilted samples and you are going to use the spectrum for quantitative analysis, it is important to enter the correct value of the sample tiltIf you have purchased Microscope Control (the application for controlling and reading the electron beam and column parameters ) and you have a motorized tilt stage, the current tilt angle will be automatically read by the software.More commonly, the stage tilt will not be motorized; in which case you will need to enter the value into Microscope Control.1.2 What value of accelerating voltage should I use?Initially you need to choose a kV to get an image of your sample and then you can adjust the beam current such that you get sufficient X-rays in your spectrum. You may want to refine the kV once you have performed a more detailed analysis on your sample.20kV is a good starting point, particularly if the sample is unknown. This kV will excite most X-ray lines from most elements and these will be automatically identified in the spectrum.Choose a lower kV if you are concerned about:1. Accuracy of quantification of light elements since the lower penetration into the samplewill reduce the absorption correction.2. Analysis of a small particle, inclusion or a film less than 10mm in depth since a smallerexcitation volume will enhance the contribution from these features.If you have purchased Microscope (column) control INCA Energy will automatically read the current microscope accelerating voltage.If you have not purchased Microscope (column) control and you are working in Point & ID, you will need to go to the ‘Site of Interest step’ in the Navigator and manually enter the currentkV on your microscope into the space provided. Alternatively, select Microscope (column)control under Options from the main menu and enter the kV in the space provided.1.3 Setting up the beam currentIt is generally easiest to setup the microscope if you operate in secondary electron imaging mode.The next stage is to produce a stable beam of electrons for X-ray microanalysis. You may have a tungsten,LaB6 emitter or a field emission gun each requiring its own type of setup procedure.The degree of electron emission can be monitored in more than one way, depending on your microscope. If you have a tungsten or LaB6gun, it is good practice to increase the filament current slowly as this will preserve the lifetime of the filament. Initially, as you increase the filament or heating current, the beamPage 14current increases to an initial maximum, before dropping and then rising again to a point above which the beam current no longer increases. This is known as the saturation point, and any further increase in heating current just reduces the lifetime of the filament.With the filament operating at the saturation point, emission is stabilized and this is where you should operate if you wish the beam to be stable.You can observe the saturation point for a filament by viewing the trace variation on the CRT, or waveform monitor, which represents the signal from the sample. Increase the filament current such that you no longer produce an increase in the height of the waveform above the baseline. At this point, you have reached filament saturation.Another common way of monitoring the emission from a gun is by observing the so called ‘emission image’.1.4 Working distanceThe working distance is defined as the distance between the lower pole piece of the objective lens and the plane at which electrons are focused.1.4.1 Which value of working distance should I use for X-ray microanalysis?Ensure that the working distance, as displayed in millimeters on your microscope monitor, is the desired value for performing X-ray microanalysis. This is specific to the geometry of the detector mount on the SEM chamber.The recommended value for your instrument can be viewed by going to Microscope Control from the Options menu on the INCA menu bar.If you have purchased Microscope (column) Control, the value of the working distance displayed on your microscope monitor will be automatically read by INCA Energy. If you do not have Microscope (column) control installed, you should manually enter the working distance by selecting Microscope (column) control under Options from the main menu.1.4.2 How do I adjust the working distance?Adjust the strength of the objective lens by adjusting the ‘focus’ on your microscope until your microscope monitor displays the recommended working distance. Note that your image may now appear out of focus.Carefully adjust the sample height using the Z drive of your stage so that the image comes into focus. Check for excessive lens hysterisis.If you move to another area of the sample or move to another sample completely, don’t adjust the focus, but adjust the Z drive of the stage to bring the image into focus. This means that X-rays are always generated at the same position within the microscope, which gives the correct geometry for the detector. Take care that if you have a large sample, or have many samples of different heights mounted on the stage, that any sample does not collide with any detector mounted directly below the pole piece of the objective lens (e.g. backscattered electron detector).1.4.3 How to improve image qualityBy now you should see a focused image on your microscope monitor.The quality of your image will very much depend on how well your column has been aligned. Your image quality will be optimized if your filament has been exactly centered in the gun area, and the electron beam travels exactly down the optic axis of the column before it strikes the sample. There are a variety of methods provided on microscopes to achieve these optimum conditions.Page 15Some microscopes have a ‘Wobbler’ button to check the alignment of the objective aperture which when activated fluctuates the objective lens current about a fixed value. Alternatively you can manually increase and decrease the focus about a fixed point.If you do this, look at your secondary electron image, it will appear to go through focus but will distort if the objective aperture is not centered. When correctly centered, the image will appear to go in and out of focus, without moving or distorting.You may further improve the quality of the image by adjusting the stigmators on your microscope. Astigmatism manifests itself in images by causing streaking of features as you change the focus about a fixed point. You can reduce any astigmatism by adjusting the stigmators in conjunction with the focus.If you are going to perform any X-ray analysis, make sure that you re-adjust the focus to ensure that you are operating at your recommended working distance and bring your image into focus using the Z drive of the stage.Page 16。
Inca 软件基本操作

技术中心 2011.3
第四节 钢结构工程施工质量缺陷分析与防治措施
1、在线操作需要的硬件 2、基本连接示意 3、Inca软件的基本操作 4、常用参数解释
第四节 钢结构工程施工质量缺陷分析与防治措施
INCA软件目前有5.3、5.4、6.1、6.2等系列软件 版本,对应使用的博世ECU系列分别有EDC7、 EDC16、EDC17等。本文以INCA6.2版本博世 EDC7系统为例简要说明INCA软件基本操作。
选择操作项,刷数据之前最好先 read ECU-ID
3.9、刷写数据
第四节 钢结构工程施工质量缺陷分析与防治措施
识别成功,选择close,回到如下界面
3.9、刷写数据
第四节 钢结构工程施工质量缺陷分析与防治措施
第四节 钢结构工程施工质量缺陷分析与防治措施
第四节 钢结构工程施工质量缺陷分析与防治措施
再次选择要使用的hex数据
第四节 钢结构工程施工质量缺陷分析与防治措施
出现选择Seed的窗口,找到Prof文件中的seed文件
第四节 钢结构工程施工质量缺陷分析与防治措施
出现如下窗口,此时仍旧是ECU off
第四节 钢结构工程施工质量缺陷分析与防治措施
点击default,确保自己的IP地址在Start Address和End address之间,若不 是则改动自己IP地址。点击contune
第四节 钢结构工程施工质量缺陷分析与防治措施
第四节 钢结构工程施工质量缺陷分析与防治措施
第四节 钢结构工程施工质量缺陷分析与防治措施
右击workspace---add—experiment
第四节 钢结构工程施工质量缺陷分析与防治措施
标定方法和步骤

设置密码 3#
13 # 68#
14# 24#
1# 2# 5# 10# 20# 50#
设置列表
功能描述
进入密码
取消四舍五入, 168#8#
逢一进十
16897#或 26897#
14 按键 *24 按键 分度值设置
1克 2克 5克 10 克 20 克 50 克
168#或 268# 168#或 268#
168#或 268# 168#或 268# 168#或 268# 168#或 268# 168#或 268# 168#或 268#
标定方法和步骤
1、标定的步骤 开机归零后输入密码:59016 或 59256 去皮
(1)进入标定后,窗口依次显示-CAL-、o、 空 ,输入 1,按【去皮】键,窗口依次显 示-CAL-、1、 内码值。进入步骤(2)。 (2)窗口依次显示 -CAL-、2-put、- - - - - -。放置标准砝码,按【去皮】键,进入步骤 (3) (3)窗口依次显示 -CAL-、3-in-、10000,用户此时输入标准砝码的重量。在第 3 个窗 口显示,用户输错可以清除重输。按【去皮】键,显示-CAL-、4----、0 后,自动进入步骤 (4) (4)窗口依次显示 -CAL-、5-fl-、30000,用户此时输入最大秤量范围。在第 3 个窗口 显示,用户输错可以清除重输。按【去皮】键,进入步骤(5) (5)窗口依次显示 -CAL-、6-fo-、3,用户此时输入重量的小数点,默认为 3。在第 3 个窗口显示,用户输错可以清除重输。按【去皮】键,进入步骤(6) (6)窗口依次显示 -CAL-、7-fd-、10,用户此时输入重量的单位,默认为 10 个单位, 根据秤的出厂定位自由设定。按【去皮】键,退出标定模式。
新标杆软件快捷键汇总
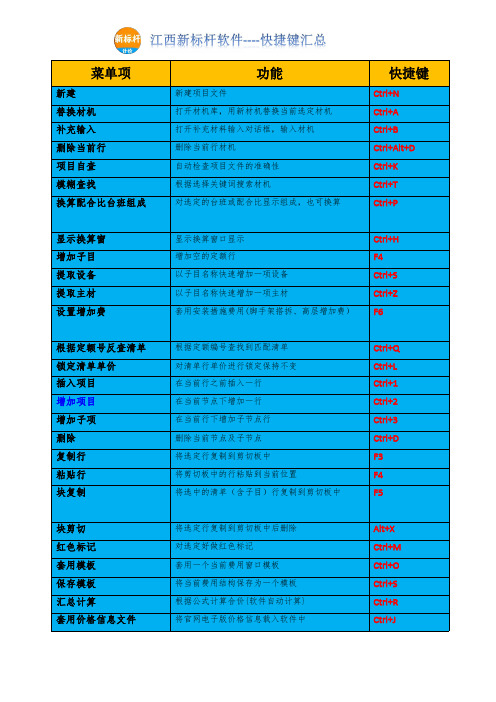
菜单项功能快捷键新建新建项目文件Ctrl+N
替换材机打开材机库,用新材机替换当前选定材机Ctrl+A
补充输入打开补充材料输入对话框,输入材机Ctrl+B
删除当前行删除当前行材机Ctrl+Alt+D
项目自查自动检查项目文件的准确性Ctrl+K
模糊查找根据选择关键词搜索材机Ctrl+T
换算配合比台班组成对选定的台班或配合比显示组成,也可换算Ctrl+P
显示换算窗显示换算窗口显示Ctrl+H
增加子目增加空的定额行F4
提取设备以子目名称快速增加一项设备Ctrl+S
提取主材以子目名称快速增加一项主材Ctrl+Z
设置增加费套用安装措施费用(脚手架搭拆、高层增加费)F6
根据定额号反查清单根据定额编号查找到匹配清单Ctrl+Q
锁定清单单价对清单行单价进行锁定保持不变Ctrl+L
插入项目在当前行之前插入一行Ctrl+1
增加项目在当前节点下增加一行Ctrl+2
增加子项在当前行下增加子节点行Ctrl+3
删除删除当前节点及子节点Ctrl+D
复制行将选定行复制到剪切板中F3
粘贴行将剪切板中的行粘贴到当前位置F4
块复制将选中的清单(含子目)行复制到剪切板中F5
块剪切将选定行复制到剪切板中后删除Alt+X
红色标记对选定好做红色标记Ctrl+M
套用模板套用一个当前费用窗口模板Ctrl+O
保存模板将当前费用结构保存为一个模板Ctrl+S
汇总计算根据公式计算合价{软件自动计算}Ctrl+R
套用价格信息文件将官网电子版价格信息载入软件中Ctrl+J。
ca快捷键
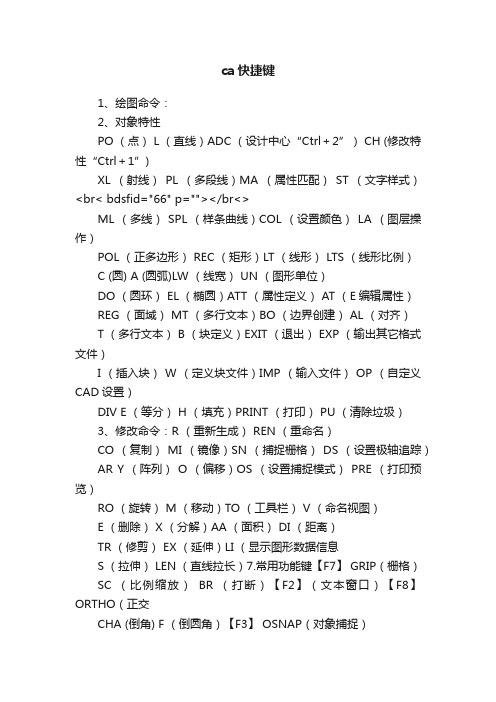
ca快捷键1、绘图命令:2、对象特性PO (点) L (直线)ADC (设计中心“Ctrl+2”) CH (修改特性“Ctrl+1”)XL (射线)PL (多段线)MA (属性匹配)ST (文字样式)<br< bdsfid="66" p=""></br<>ML (多线) SPL (样条曲线)COL (设置颜色) LA (图层操作)POL (正多边形) REC (矩形)LT (线形) LTS (线形比例)C (圆) A (圆弧)LW (线宽) UN (图形单位)DO (圆环) EL (椭圆)ATT (属性定义) AT (E编辑属性)REG (面域) MT (多行文本)BO (边界创建) AL (对齐)T (多行文本) B (块定义)EXIT (退出) EXP (输出其它格式文件)I (插入块) W (定义块文件)IMP (输入文件) OP (自定义CAD设置)DIV E (等分) H (填充)PRINT (打印) PU (清除垃圾)3、修改命令:R (重新生成) REN (重命名)CO (复制) MI (镜像)SN (捕捉栅格) DS (设置极轴追踪)AR Y (阵列) O (偏移)OS (设置捕捉模式) PRE (打印预览)RO (旋转) M (移动)TO (工具栏) V (命名视图)E (删除) X (分解)AA (面积) DI (距离)TR (修剪) EX (延伸)LI (显示图形数据信息S (拉伸) LEN (直线拉长)7.常用功能键【F7】 GRIP(栅格)SC (比例缩放)BR (打断)【F2】(文本窗口)【F8】ORTHO(正交CHA (倒角) F (倒圆角)【F3】 OSNAP(对象捕捉)PE (多段线编辑) ED (修改文本)4、视窗缩放:5、尺寸标注:P (平移) Z+空格+空格 , *实时缩放Z+E 显示全图DLI(直线标注) DAL(对齐标注)Z 局部放大 Z+P *返回上一视图DRA(半径标注) DDI(直径标注) 6.常用CTRL快捷键DAN ,(角度标注)DCE(中心标注)【CTRL】+P PRINT(打印文件)【CTRL】+W (对象追踪)DOR(点标注) TOL(标注形位公差)【CTRL】+Z UNDO(放弃)【CTRL】+U (极轴)LE (快速引出标注)DBA(基线标注)【CTRL】+X CUTCLIP (剪切)DCO(连续标注)D(标注样式)【CTRL】+B SNAP(栅格捕捉)【CTRL】+1 PROPERTIES(修改特性) DED(编辑标注)DOV (替换标注系统变量)【CTRL】+F OSNAP(对象捕捉)【CTRL】+2 ADCENTER(设计中心)【CTRL】+G GRID(栅格)【CTRL】+L (正交)(设计中心)。
- 1、下载文档前请自行甄别文档内容的完整性,平台不提供额外的编辑、内容补充、找答案等附加服务。
- 2、"仅部分预览"的文档,不可在线预览部分如存在完整性等问题,可反馈申请退款(可完整预览的文档不适用该条件!)。
- 3、如文档侵犯您的权益,请联系客服反馈,我们会尽快为您处理(人工客服工作时间:9:00-18:30)。
INCA快捷键介绍
↑选择前一个小窗口Ctrl+S保存实验
↓选择下一个小窗口Ctrl+Shift+V粘贴
Alt++优化窗口大小Ctrl+V属性转移(T) 粘贴
Alt+<激活上一层F1当前窗口的帮助信息
Alt+>激活下一层F3初始化硬件
Alt+→把右侧的分割条向右移F4配置实验
Alt+←把右侧的分割条向左移F5手动触发
Alt+Enter属性F6数据量减少-
Alt+F1显示项目文档F7数据量增加+
Alt+F3显示硬件状态F8更改活动的存储页
Alt+F6选择下一个窗口F9停止测量
Alt+F8改变工作数据F11开始测量显示
Alt+F9下移F12开始数据记录
Alt+F10上移Pause数据记录暂停
Alt+G设备选择的激活/禁用Shift+↑选择下一个小窗口 (多选) Alt+O优化列宽Shift+↓选择下一个小窗口 (多选) Alt+Q测量速率Shift+F4选择新的变量
Alt+T打开层配置对话框Shift+F8管理存储器页面
Ctrl+→把左侧的分割条向右移Shift+Pause锁定测量显示
Ctrl+←把左侧的分割条向左移
Ctrl+2激活设备组
Ctrl+9转换激活方案
Ctrl+A全部选中
Ctrl+Alt+C定义/管理计算信号
Ctrl+Alt+F固化工作数据
Ctrl+B二进制显示方式
Ctrl+C属性转移(T) 复制
Ctrl+D十进制表示法
Ctrl+Delete移除变量
Ctrl+End选中分割条2
Ctrl+F在实验中搜寻变量
Ctrl+F1指定快捷键
Ctrl+F3配置硬件
Ctrl+F7转到INCA主窗口
Ctrl+F11打开记录管理器
Ctrl+F12MDA - 测量数据分析器(M)
Ctrl+H十六进制表示
Ctrl+Home选中分割条1
Ctrl+I关于变量
Ctrl+K设置测量标记
Ctrl+L ECU标定访问开/关
Ctrl+M测量数据转换器(C)
Ctrl+N创建新实验
Ctrl+O打开实验
Ctrl+P物理值表示
Ctrl+Q记录属性/触发器...。