微观经济学 全英教案
微观经济学教案(1)
微观经济学教案(1)经济学教研室安晓云第一章导言教学目的:本章讲授西方经济学的研究对象、方法、目的,总体概括西方经济学基本内容,了解什么是现代西方经济学,它企图解决什么问题,并明确为什么要学习西方经济学,应持怎样的态度去研究西方经济学。
使学生不仅对西方经济学有梗概了解,而且能够确立一个正确的指导思想贯穿于西方经济学整个学习过程中。
重点和难点:正确理解西方经济学的含义,研究对象的特性,分析方法的特性。
对稀缺、稀缺法则、比较分析法、西方经济学的双重性质的分析理解。
课堂教学设计:在与马克思主义经济学研究对象的比较分析中展开教学,特别针对学生把马克思主义经济学与西方经济学相对立的、认为政治经济学无现实意义等模糊认识,从社会经济活动具有社会性和自然性两方面属性入手,引申对西方经济学研究对象与方法的讲授分析。
提出问题引发学生边思考、边讨论、边讲授,例如:马克思主义经济学与西方经济学的研究对象有什么区别?由此导致两大理论体系间存在怎样的关系(对立或互补)?从西方经济学对象与方法的了解中如何体会认识和研究经济现象的思维方式应发生的变化?(我将在导言的讲授中,提出自己的观点,即通过西方经济学学习,对我们更有益的是培养认识问题、分析问题的全新思维方式:辨证思维、发散思维、求异思维、创新思维。
)教案内容:社会经济活动有两重性:社会属性——人与人经济关系;自然属性——人与物的关系。
这一章从整体上概括西方经济学研究对象、主要分析方法及为什么研究西方经济学?如何研究西方经济学等。
通过学习,要求了解什么是现代西方经济学?它研究经济活动的什么内容?企图解决什么问题?所运用的主要分析方法有什么特点?同时要明确为什么学习西方经济学?在学习和研究中应持怎样的态度(或者说应确立怎样的指导思想)。
第一节什么是现代西方经济学“经济学“一词在西方具有较广泛的含义,总结起来至少包括三种领域的文献:第一:企业、事业管理的经验、方法总结。
如企业质量管理分析。
平狄克 微观经济学 全英教案5
©2005 Pearson Education, Inc.
Output can only be increased by increasing labor Must know how output changes as the amount of labor is changed (Table 6.1)
©2005 Pearson Education, Inc.
Short Run
Period of time in which quantities of one or more production factors cannot be changed These inputs are called fixed inputs
Long Run
Amount of time needed to make all production inputs variable
Chapter 6
9
2. Production: One Variable Input
©2005 Pearson Education, Inc.
Chapter 6
10
2.Production: One Variable Input
Average product of Labor - Output per unit of a particular product Measures the productivity of a firm’s labor in terms of how much, on average, each worker can produce
q = F(K,L)
©2005 Pearson Education, Inc.
Chapter 6
微观经济学精华讲义英文版 (3)
ⅣProduction and Cost☻Production Theory ☻Cost TheoryThe Production Function…shows the relationship betweenquantity of inputs used to make a goodand the quantity of output of that good.Q=f (L,K,N,E)•Q=f (L,K ) Short-run•Q=f (L,K) Long-run•Total Product TP=f (L,K)•Average Product AP=TP/L or AP=TP/K •Marginal ProductIn the production process, marginalproduct of any input is the increase inoutput that arises from an additional unitof that input.MP = (dTP/dL ) or (dTP/ dK)a Production Function: Helen’s cookie factoryQuantity of(cookies per hour)150140130120110100908070605040302010Hungry Helen’s Production FunctionMPTP•The slope of TP curve measures the marginal product of an input.•When the marginal product declines, TP curve becomes flatter(decreasing).Diminishing Marginal Product•…is the property whereby the marginalproduct of an input declines as the quantityof the input increases.•As more and more workers are hired at a firm, each additional worker contributes less and less to production because the firm has a limited amount of equipment.•At the beginning of production process…typical production curve-106.2-5809.625211512.51014151520151512.51010627277777570604525101010910810710610510410310210110MP L AP L TP L L K Short-run<>=00TUMUXX•MU >0,TU ↑increasing •MU <0,TU ↓decreasing •MU =0,TU max00TPMP,APLLTP L & MP L•MP L ----the slope of TP L curve•MP L >0,TP L increasingMP L increasing & decreasing•MP L <0,TP L decreasing •MP L =0,TP L maxAP LMP LTP LAP L & MP L•MP L >AP L ,AP L increasing •MP L <AP L ,AP L decreasing •MP L =AP L ,AP L maxTP L & AP L•AP L ---the slope of segment whichlinks the original and any point on TP L curve•When the segment is just the tangent of TP L curve , MP L =AP L ,AP L maxL 2L 1L 3ⅠⅢⅡlong-run Q=f (L,K)•Isoquant curve•Isocost curve•OptimizationFour Properties of Isoquant Curves •Higher isoquant curves are preferred tolower ones.•Isoquant curves do not cross.•Isoquant curves are downward sloping.•Isoquant curves are bowed inward.KQ1Q2CBAD⊿K⊿K⊿L⊿LLLaw of Diminishing Marginal Rate of Technical Substitution•RTSLK =-⊿K/⊿L•It is the rate at which a firm is willing to trade one factor for another.RTS•If ⊿L→0, RTSLK=-dK / dL•C = w·L +r·K •K = C/ r -(w/ r)·LWhat the firm can affordThe slope (absolute value)of the isocost lineequals the relative price of the two factors.K LC/wC/ rProducer OptimumBest Combination of Factors•Given quantity, minimize cost •Given cost, maximize quantityKQ1 ABOptimumECLKQ1Q2Q3ABOptimumE CLProducer Optimum occurs…… at the point where the highest isoquant curve and the isocost curve are tangent.•C = w· L+r· K ; Q=f (L, K)•RTS=w/ rLK•MP/ MP K =w/ rL/ w = MP K / rLAccording to the Law of Supply:•Firms are willing to produce and sell a greater quantity of a good when the price of the good is high.The economic goal of the firmis to maximize profits.Total Revenue, Total Cost, and Profit•Total RevenueThe amount a firm receives forthe sale of its output.•Total CostThe market value of the inputsa firm uses in production.•Profit…is the firm’s TR minus its TC.Costs as Opportunity CostsA firm’s cost of production includes all theopportunity costs of making its output ofgoods and services.Explicit and Implicit Costs •Explicit costs are input costs that require a direct outlay of money by the firm.•Implicit costs are input costs that do not require an outlay of money by the firm.Economic Profit & Accounting Profit π=TR(Q)-TC(Q)•Economists measure a firm’s economic profit as TR minus TC, including both explicit and implicit costs.•Accountants measure the accounting profit as the firm’s TR minus only the firm’s explicit costs.✶When TR exceeds both explicit and implicit costs, the firm earns economic profit.✶Economic profit is smaller than.accounting profit.✶Normal profitTypical Cost Curves•The relationship between the quantity a firm can produce and its costs determines pricing decisions.For many firms, the division of TC between fixed and variable costs depends on the time horizon being considered.•In the short run,some costs are fixed.•In the long run,fixed costs become variable costs.The Various Measures of Cost•Costs of production (TC)may be dividedinto fixed costs and variable costs.costs in the short-runFixed and Variable Costs•Fixed costs are those costs that do not varywith the quantity of output produced.•Variable costs are those costs that do varywith the quantity of output produced.Total Costs•Total Fixed Costs (TFC)•Total Variable Costs (TVC)•STC= TFC+ TVC= r· K +w· L (Q)Average Costs•AC can be determined by dividing the firm’s costs by the quantity of output it produces.•AC is the cost of each typical unit of product. ✓Average Total Costs SAC=STC/Q=AFC+ AVC ✓Average Fixed Costs AFC=TFC/Q✓Average Variable Costs AVC =TVC/QMarginal Cost•MC measures the increase in TC that arises from an extra unit of production.SMC = ⊿STC/⊿Q= ⊿TVC/⊿QIf ⊿Q→0, MC = d TC/ d Q= d TVC/ d QCost Curves and Their Shapes •SMC、STC、TVCSMC=⊿STC/⊿Q=⊿TVC/⊿Q=⊿w· L/⊿Q=w/(⊿Q/⊿L)=w/MP L•MC rises with the amount of output producedwhich reflects the property of diminishing MP L .•MP L ---reciprocal “U”-Shaped•MC ---“U”-ShapedTVC 、TFC 、STC●TFC---straight line●SMC----the slope of STC or TVC curveMC ---“U”-ShapedMC>0,STC and TVC increasing✓MC increasing, STC and TVC increasing at increasing speed ✓MC decreasing, STC and TVC increasing at decreasing speed•AFC 、A VC 、SACA VC=TVC/Q=(w· L)/Q=w/ (Q/L)=w/AP L•AP---reciprocal “U”-ShapedL•AVC and SAC ---“U”-ShapedThe SAC curve is U-shaped.•At very low levels of output SAC is high because FC is spread over only a few units.•SAC declines as output increases.•SAC starts rising because AVC rises substantially.•The bottom of the U-shaped SAC curve occurs at the quantity that minimizes SAC. •This quantity is sometimes called the efficient scale of the firm.Relationship between MC and SAC(AVC)✓Whenever MC is less than SAC, SAC is falling.✓Whenever MC is greater than SAC, SAC is rising. MC crosses SAC at the efficient scale which is the quantity that minimizes SAC.Three Important Properties of Cost Curves•MC eventually rises with the quantity of output.•SAC,A VC curve are U-shaped.•MC curve crosses the A VC and SAC curve at the minimum of A VC and SAC successively .•Because many costs are fixed in the short run but variable in the long run, a firm’s long-run cost curves differ from its short-run cost curves.•LTC = r· K(Q)+w· L (Q)•LAC = LTC/Q•LMC= dLTC / dQLTC Q 0LMC LTCLMCLAC2013-7-2347STC 1STC 2STC 3TC Q0Q 1Q 2Q 3LTCSAC 1SAC 2SAC 3C 1C 2C 3Q 1Q 2Q 3Q’ 2Q’1O CQEconomies and Diseconomies of Scale •Economies of scale refer to the property whereby LAC falls as the quantity of output increases.•Diseconomies of scale refer to the property whereby LAC rises as the quantity of output increases.•Constant returns of scale refers to the property whereby LAC stays the same as the quantity of output increases.•f(λL,λk)>λf(L,k)•f(λL,λk)= λf(L,k)•f(λL,λk)<λf(L,k)。
平狄克微观经济学课件英文01精品文档19页

Chapter 1: Preliminaries
Copyright © 2009 Pearson Education, Inc. Publishing as Prentice Hall • Microeconomics • Pindyck/Rubinfeld, 7e.
4 of 18
1.1 THE THEMES OF MICROECONOMICS
Theories and Models
In economics, explanation and prediction are based on theories. Theories are developed to explain observed phenomena in terms of a set of basic rules and assumptions.
Workers Workers also face constraints and make trade-offs. First, people must decide whether and when to enter the workforce. Second, workers face trade-offs in their choice of employment. Finally, workers must sometimes decide how many hours per week they wish to work, thereby trading off labor for leisure.
In a market economy, prices are determined by the interactions of consumers, workers, and firms. These interactions occur in markets—collections of buyers and sellers that together determine the price of a good.
微观经济学英文课件

Edited by Yong, E.L.
Continuously,
Microeconomics is also used for evaluating broad question in regards to government policy (although this is more to macroeconomics).
Edited by Yong, E.L.
Continuously,
If the firm produces 6 units of apple and 12 units of apple pie wants to increase the production of apple pie by one unit to the 13th unit. It has to forgo 2 units of apple so that resources can be shifted to produce the additional apple pie; Opportunity Cost is thus 2.
Edited by Yong, E.L.
Continuously,
If the firm produces 10 units of apple and 6 units of apple pie wants to increase the production of apple pie by one unit to the 7th unit. It has to forgo 1 unit of apple so that resources can be shifted to produce the additional apple pie; Opportunity Cost is thus 1.
微观经济学课件英文版 En-micro01
Relationship Between Microeconomics and Macroeconomics
Different e.g.object of study ,method of analysis Contact Microeconomics is the foundation of macroeconomics Complementary Both of them can research the same economy phenomenon from different visual angle .
01:14
5
An object of study
In short, Economics studies optimal allocation and full use of resources. In detail :
Microeconomics What ,how,for whom Macroeconomics Resources are used fully or idly? How does inflation affect purchasing power? Can economy grow?
01:14
8
Theory System of Economics
Two branches:Microeconomics and Macroeconomics
Microeconomics Another name Theory base Basic assumptions Founder Subject Key theory Major aim Individual Economics Macroeconomics Overall Economics
平狄克微观经济学课件(英文)06全

4 of 24
6.1 THE TECHNOLOGY OF PRODUCTION
The Short Run versus the Long Run
●short run Period of time in which quantities of one or more production factors cannot be changed.
As we move from point A on curve O1 to B on curve O2 to C on curve O3 over time, labor productivity increases.
7 of 24
Chapter 6: Production
6.2 PRODUCTION WITH ONE VARIABLE INPUT (LABOR)
The Slopes of the Product Curve
Figure 6.1
Production with One Variable Input
0
Average
Marginal
Product (q/L) Product (∆q/∆L)
—
—
1
10
10
10
10
2
10
30
15
20
3
10
60
20
30
4
10
80
20
20Hale Waihona Puke 51095
19
15
6
10
108
18
13
7
10
112
16
4
8
10
112
14
0
微观经济学英文版PPT课件

10
2.2 the definition of microeconomics
The starting point of economics searching The definition of Microeconomics People how to make decision Why need to bargain Why need to build market economics
Economics is a study, learning selection of scarce resources with different uses; The goal is effective allocation of scarce resources to produce goods and services, and in the present or future, let them reasonable allocated to social members or group for consumption.
8
Production possibilities curve
PPC is a graph that shows the combinations of output that the economy can possibly produce given the available factors of production and the available production technology.
微观经济学( 双语)教学大纲
《微观经济学》课程教学大纲课程编码:12020401H112课程性质:专业基础课学分:3课时:54开课学期:3适用专业:国际经济与贸易一、课程简介《微观经济学》课程是经济与管理类专业的专业基础课程。
该课程详细介绍了微观经济学的基本概念、基本理论和方法,旨在系统地分析总结了市场机制配置经济资源的基本规律以及不同市场微观经济主体的经济决策行为,并提出了一些微观经济政策。
通过学习可以让学生了解这一课程的基本框架和分析逻辑,理解和掌握微观经济学中的主要分析方法和基本模型,认识个人与企业在市场经济体制中如何达到他们的目的,并且能够运用微观经济学原理观察、分析和解释现实生活中比较简单和典型的一些经济现象。
先修课程是《政治经济学》和《微积分》,后续课程有《宏观经济学》、《统计学》、《金融学》等。
二、教学目标该课程的教学目标是使学生理解和掌握微观经济学的基本理论、基本知识和理论运用能力。
在教学过程中,应注意培养学生的经济学逻辑思维能力和独立学习、独立分析能力,使学生能够用微观经济学的理论知识和分析方法开展基础的研究分析工作,并为学习其他应用经济学科打下坚实的理论基础。
通过本课程的教学应实现以下目标:了解该课程的基本理论体系和框架,以及经济学的前沿问题,并对其主要流派及其观点有一定了解;理解该课程的基本概念和基本分析工具,如十大经济学原理及其运用;需求价格弹性与定价策略;税收成本与贸易得失;外部性和公共产品及相关政策;市场结构与厂商决策行为等;掌握该课程的基本分析方法,如比较静态分析、动态分析、图表分析,并能够运用基本微观经济学理论解释现实经济问题和现象。
三、教学内容Part 1 IntroductionChapter 1 Ten principle of economics主要内容:How people make decisionsHow people interactHow the economy as a whole works教学要求:通过本章教学,使学生了解十大经济学原理,初步接触经济学的思维方式,认识西方经济学的理论体系和研究方法。
《微观经济学microeconomics》英文版全套课件(101页)

The economic constraint:
px p1x1 ... pL xL w
The Walrasian budget set (Definition 2.D.1)
Bp,w {x RL : px w}
or
u(x* ) xl
pl
px w
Solution: Walrasian demand function x*( p, w)
Utility Maximization -- Example
Example 3.D.1: the transformed Cobb-Douglas Utility Function
Expenditure Function
Expenditure function e( p,u) Min px s.t. u(x) u {x}
Properties: 1. Homogeneous of degree of one in p 2. Strictly increasing in u and nondecreasing in p 3. Concave in p 4. Continuous in p and u
Comparative Statics – Wealth Effects
The consumer’s Engel function x( p, w)
The wealth effect xl ( p, w) / w or Dwx( p, w) Normal goods and inferior goods
A choice rule C(B) B
The weak axiom of revealed preference (WARP): if x is revealed at least as good as y, then y cannot be revealed preferred to x
微观经济学课件英文版En-micro02

D
S
Surplus E Shortage
O
100
200
300
Q
03:49
21
Equilibrium of Demand and Supply
Effect of a shift in supply or demand
Shifts in demand
P D1 S
D0 D2
E1
P1
P0 P2
E2
E0
中文版
Contents
Basic Elements of Demand
Demand, demand schedule and demand curve
Demand
Other things being constant, the quantity that consumers can and are willing to buy depends on its price .
03:49
5
Basic Elements of Demand
Behind the demand curve and Demand function
Demand Function
The relationship between demand and the factors affecting demand is called demand function.
P P1 A Income Increasing Income D0 Decreasing D O Q1 Q2 Qd O D1 Qd D2 P
P2
B
a
03:49
b
10
Basic Elements of Supply
经济学微观英文版第三版课程设计 (2)

经济学微观英文版第三版课程设计
课程描述
本课程是经济学微观英文版第三版的设计与讲解。
经济学微观英文版是一门研究人们作为消费者与生产者的决策与交换行为的学科。
学习本课程后,学生将具备一定的微观经济学基础知识和分析技能,能够在实际生活和工作中应对各种经济问题。
课程目标
•熟悉微观经济学中的常用概念和理论。
•掌握微观经济学中的分析方法和技能。
•能够将微观经济学的知识应用于实际生活和工作中解决经济问题。
教学大纲
本课程将分为以下内容:
1.Introduction to Microeconomics
–Definition and scope of microeconomics
–Basic economic concepts: scarcity, choice, and
opportunity cost
–Basic economic models: production possibilities frontier and circular flow diagram
2.Supply and Demand
–Demand: law of demand, demand curve, determinants of demand
–Supply: law of supply, supply curve, determinants of supply
1。
《微观经济学》教学大纲(英文版)
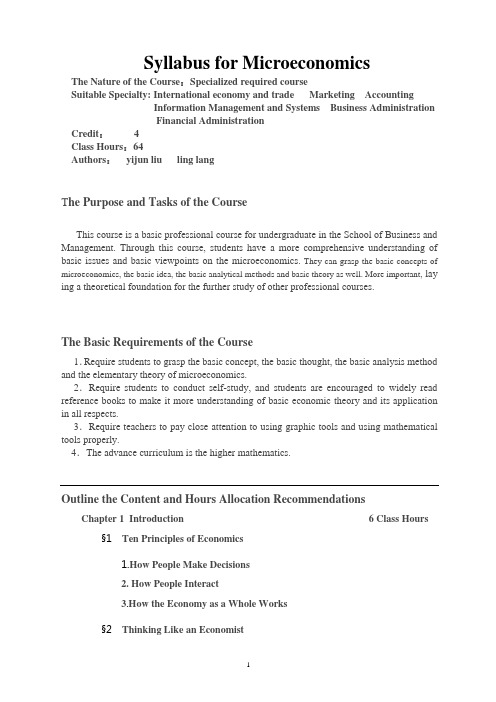
Syllabus for MicroeconomicsThe Nature of the Course:Specialized required courseSuitable Specialty: International economy and trade Marketing AccountingInformation Management and Systems Business AdministrationFinancial AdministrationCredit: 4Class Hours:64Authors:yijun liu ling langT he Purpose and Tasks of the CourseThis course is a basic professional course for undergraduate in the School of Business and Management. Through this course, students have a more comprehensive understanding of basic issues and basic viewpoints on the microeconomics. They can grasp the basic concepts of microeconomics, the basic idea, the basic analytical methods and basic theory as well. More important, lay ing a theoretical foundation for the further study of other professional courses.The Basic Requirements of the Course1.Require students to grasp the basic concept, the basic thought, the basic analysis method and the elementary theory of microeconomics.2.Require students to conduct self-study, and students are encouraged to widely read reference books to make it more understanding of basic economic theory and its application in all respects.3.Require teachers to pay close attention to using graphic tools and using mathematical tools properly.4.The advance curriculum is the higher mathematics.Outline the Content and Hours Allocation Recommendations Chapter 1Introduction 6 Class Hours §1 Ten Principles of Economics1.How People Make Decisions2. How People Interact3.How the Economy as a Whole Works§2 Thinking Like an Economist1.The Economist as a Scientist2. The Economist as a Policy Adviser3.Why Economist Disagree§3 the Using of Graphs in Economics (#)1.Graphic Drawing and Graphics Type in Economic Analysis2.Slope and Elasticity3. Note for Graphics Use in Economic Analysis§4 Interdependence and the Gains from Trade1.The Production Possibilities Frontier、Specialization and Tradeparative Advantage3.Applications of Comparative AdvantageChapter 2Supply and Demand(Ⅰ):How Markets Work 8 Class Hours §1Markets and Competitionpetitive Market2.Other Markets§2 law of demand1.Demand and the Demand Curve2.Shifts in the Demand Curve and Shift of the Demand Curve3.Market Demand and Individual Demand§3 law of supply (#)1. Supply and the Supply Curve2. Shifts in the Supply Curve and Shift of the Supply Curve3.Market Supply and Individual Supply§4 Supply and Demand Model1.The Conditions of Supply and Demand Model2.Supply and Demand Model3.What happens to equilibrium when supply and demand shifts?4.Cobweb Theory (☆)§5Elasticity and The Applications of Elasticity Theory1.the Elasticity of Demand and Its Application2.the Elasticity of Supply and Its Application(#)§6Supply、Demand and Government Policies1.Controls on prices (#)2.How Taxes Affect Market Outcomes3.Can Good News for Farming Be Bad News for Farmers?Exercise classes 2Class Hours Chapter 3 Supply and Demand(Ⅱ):Market and Welfare 16 Class Hours §1 The Theory of Consumer Choice 4 Class Hours1.Cardinal Utility Theory2. Preference Theory3.Application of The Theory of Consumer Choice§2 The Theory of Producer Choice 6 Class Hours1.The Organization of Production (#)2. Production Function and Factor Inputs3. The Cost Theory§3 Consumer Surplus 2Class Hours1.Willingness to Paying the Demand Curve to Measure Consumer Surplus3.How a Lower Price Raises Consumer Surplus§4 Producer Surplus(#)1.Cost and the Willingness to Sell2. Using the Supply Curve to Measure Producer Surplus3. How a Higher Price Raises Producer Surplus§5 Market Efficiency 2 Class Hours1.The Concept of Efficiency2.The Equilibrium Efficiency of the Competitive Firm(1)3.The conditions of the Efficient Competitive Firm§6 Application:The Cost of Taxation 2 Class Hours1.The Deadweight Loss of Taxation2.The Determinants of the Deadweight Loss3. Deadweight Loss and Tax Revenue as Taxes Vary§7 Application:International Trade (#)1.The Determinants of Trade2.The Winners and Losers from Trade3.The Arguments for Restricting TradeExercise classes 3 Class Hours Discussion class 1 Class Hour Chapter 4The Economics of the Public Sector 4 Class Hours §1 Externalities1.Externalities and Market Inefficiency2.Private Solutions to Externalities3.Public Policies toward Externalities§2 Public Goods and Common Resources1.The Different Kinds of Goods2.Public Goodsmon Resources§3 The Design of the Tax System(#)1.Taxes and Efficiency2.Taxes and EquityChapter 5 Supply and Demand(Ⅲ):Enterprise behavior and industrial organization8 Class Hours§1Types of Market (#)§2 Firms in Competitive Markets 4 Class Hours1. The Demand Curve and Revenue Curve of the Competitive Firm2. The Short-run Decision and the Supply Curve of the Competitive Firm3. The Short-run Supply Curve of the Competitive Market4.The Competitive Firm's Long-run Decision5.The Long-run Supply Curve of the Competitive Firm6.The Equilibrium Efficiency of the Competitive Firm(2)§3 Monopoly 4 Class Hours1.Why Monopolies Arise2.The Demand Curve and Revenue Curve of the Monopolistic Firm3.The Monopolistic Firm's Short-run and Long-run Decision4.The Welfare Cost of Monopoly5.Public Policy toward Monopolies6.Price Discrimination§4 Oligopoly (#)1.Markets with Only a few Sellers2.Game Theory and the Economics of Cooperation3.Public Policy toward Oligopolies§5 Monopolistic Competition(#)1.The Demand Curve and Revenue Curve of The MonopolisticCompetitive Firm2. The Monopolistic Competitive Firm in the Short-run and Long-run3. Monopolistic Competition and the Welfare of Society4.AdvertisingExercise classes 1 Class Hour Discussion class 1 Class Hour Chapter 6 Supply and Demand(Ⅳ):The Markets for the factors of production6 Class Hours§1 How Markets Determine Incomes1. Income and Wealth (#)2. Marginal Productivity Determines the Prices of Inputs§2 The Economics of Labor Market1.The Demand and Supply for Labor (#)2.Equilibrium in the Labor Market (#)3. Some Determinants of Equilibrium Wages4.The Economics of Discrimination§3 The Land Market and The Capital Marketnd and Rent2.Capital and Interest§4 Income Distribution (#)1.The Measurement of Inequality2.The Political Philosophy of Redistributing Income3.Policies to Reduce PovertyDiscussion class 2 Class Hours Chapter 7 Supply and Demand(Ⅴ):(General equilibrium) Market and Welfare (☆)§1 General equilibrium1.Meaning of the Equilibrium2. The Equilibrium Model of Léon Walras3. The Two-sector Model of General Equilibrium§2 Welfare Economics1.The Social Welfare Function2.Equity and EfficiencyChapter 8Uncertainty and Information (☆)§1 Uncertainty in the Economy1. Uncertainties and Risks2. The Effectiveness of Property3. Measurement of Risk Cost§2 Information, Risk and Markets1. Insurance and Risk-sharing2. Private Information and Market3. Risk Management in the Financial MarketsReview class 2 Class Hours Flexible time 4 Class Hours note:(#)Expressed that students learn these contents on its own, and they are included in the scope of examination.(☆)Expressed that students can choose according to their interest in reading, but not included in the scope of examination.Recommended Teaching Materials and Major Reference Books1.[美]曼昆著,梁小民译,《经济学原理(第5版)》,机械工业出版社,2009年2.[美]保罗·萨缪尔森、威廉·诺德豪斯著,萧琛主译,《经济学(第18版)》,人民邮电出版社,2008年3.刘毅军主编,《经济学基础》,石油工业出版社,2006年。
- 1、下载文档前请自行甄别文档内容的完整性,平台不提供额外的编辑、内容补充、找答案等附加服务。
- 2、"仅部分预览"的文档,不可在线预览部分如存在完整性等问题,可反馈申请退款(可完整预览的文档不适用该条件!)。
- 3、如文档侵犯您的权益,请联系客服反馈,我们会尽快为您处理(人工客服工作时间:9:00-18:30)。
U2
Food (units per month)
4
4
©2005 Pearson Education, Inc.
12
20
Chapter 4
Effect of a Price Change
Clothing
10
6 5 4
A
U1
The PriceConsumption Curve traces out the utility maximizing market basket for each price of food
The
quantity demanded increases with income The income elasticity of demand is positive The good is a normal good
©2005 Pearson Education, Inc.
Chapter 4
©2005 Pearson Education, Inc.
Chapter 4
2
1. Individual Demand
Price Changes
Using
the figures developed in the previous chapter, the impact of a change in the price of food can be illustrated using indifference curves For each price change, we can determine how much of the good the individual would purchase given their budget lines and indifference curves
©2005 Pearson Education, Inc.
Chapter 4
16
An Inferior Good
Steak (units per month) 10
U3 …but hamburger becomes an inferior good when the income consumption curve bends backward between B and C. U2 U1
©2005 Pearson Education, Inc.
Income-Consumption Curve C
Both hamburger and steak behave as a normal good, between A and B...
5
B
A
5
10
20
Chapter 4
30
Hamburger (units per month)
Chapter 4
Individual and Market Demand
Topics to be Discussed
Individual Demand
Income and Substitution Effects
Market Demand
Consumer Surplus
Network Externalities
5 3
A B U1
U2
4
©2005 Pearson Education, Inc.
10
16
Chapter 4
Food (units per month)
11
Individual Demand
Income Changes
The income-consumption curve traces out the utility-maximizing combinations of food and clothing associated with every income level An increase in income shifts the budget line to the right, increasing consumption along the income-consumption curve Simultaneously, the increase in income shifts the demand curve to the right
4
8
Chapter 4
12
16
Food (units per month)
19
Engel Curves
Income 30 ($ per month)
Inferior
Engel curves are backward bending for inferior goods.
20
Normal 10
©2005 Pearson Education, Inc.
©2005 Pearson Education, Inc.
Chapter 4
18
Engel Curves
Income 30 ($ per month)
Engel curves slope upward for normal goods.
20
10
©2005 Pearson Education, Inc.
©2005 Pearson Education, Inc. Chapter 4 12
Effects of Income Changes
Clothing (units per month) The Income Consumption Curve traces out the utility maximizing market basket for each income level
17
Individual Demand
Engel Curves
Engel
curves relate the quantity of good consumed to income If the good is a normal good, the Engel curve is upward sloping If the good is an inferior good, the Engel curve is downward sloping
D
B
U3
U2
Food (units per month)
5
4
©2005 Pearson Education, Inc.
12
20
Chapter 4
Effect of a Price Change
By changing prices and showing what the consumer will purchase, we can create a demand schedule and demand curve for the individual From the previous example:
©2005 Pearson Education, Inc.
Chapter 4
8
Effect of a Price Change
Price of Food
$2.00
E
When the price falls, Pf /Pc & MRS also fall
• E: Pf /Pc = 2/2 = 1 = MRS • G: Pf /Pc = 1/2 = .5 = MRS • H:Pf /Pc = .5/2 = .25 = MRS
7
D
U3
Income Consumption Curve
5 3
A B U1
U2
4
©2005 Pearson Education, Inc.
10
16
Chapter 4
Food (units per month)
13
Effects of Income Changes
Price of food
An increase in income, from $10 to $20 to $30, with the prices fixed, shifts the consumer’s demand curve to the right as well.
G $1.00 Demand Curve $.50 H
Food (units per month)
7
4
©2005 Pearson Education, Inc.
12
20
Chapter 4
Demand Curves – Important Properties
The level of utility that can be attained changes as we move along the curve At every point on the demand curve, the consumer is maximizing utility by satisfying the condition that the MRS of food for clothing equals the ratio of the prices of food and clothing
4
8
Chapter 4
12
16
Food (units per month)
©2005 Pearson Education, Inc.
Chapter 4
3
Effect of a Price Change
Clothing
10
Assume: • I = $20 • PC = $2 • PF = $2, $1, $0.50
A
U1
6 5 4
D