英文图表描述类方法汇总
图表的英文描述

图表的英文描述:图表的种类:饼状图 pie chart/pie graph segment柱形图 bar chart/bar graph bar线型/曲线图 line chart/line graphline线条实线solid line 虚线dotted line 横轴 horizontal axis竖轴vertical axis表格 table行row 列column常用的表达:比例percentage percent 5% five percent数量 number趋势 trend关系 relationThis is a pie chart/bar chart/line chart/table of_________.这是一个关于________的饼状图/柱形图/线型图/表格;This pie chart/bar chart/line chart/table shows________这张图展示了___________.From this pie chart/bar chart/line chart/table, we can see/ know that_____________.从这张图中,我们知道___________.As we can see from the pie chart/bar chart/line chart/table, ____________________.我们可以从这张图中知道,________________________________.在这张曲线图中,横轴代表_________________,竖轴代表___________________. In this line chart, the horizon tal axis stands for_________, the vertical axis stands for _____________.比较:比较级+than大 big/large 更大 bigger/larger 最大the biggest/largest多 more快 fast/rapid 更快faster/more rapidly 最快the fastest/the most rapid 高 high 更高 higher 最高the highest好 good 更好 better 最好 the bestCompared with_______, ___________________________.同_______相比,________________.例:同A相比,B的数量比A更多;Compared with A, the number of B is larger than the number of A.同A相比,B增长得更快;Compared with A, B increases faster.变化:变化速度:快地fast/rapidly 慢地slowly 稳定地stably变化程度:大剧烈dramatic ally 小轻微s light ly改变change增加 grow/increase/ go up减少decrease/go down无变化 have no change/ stay the same描述、分析图表的主要步骤:描述图表的内容,概括反映的主题分析产生的原因The reason of this is...../ i think it is because.... 提出方法或建议My advice is....season季节This is a graph about....From the graph, we can see..... 内容... I think it is because.... my advice is....The highest 最高The lowest 最低The fastest 最快The slowest 最慢Peak 高峰 n.The most/ the number is the highest 最多the least/The number is the lowest 最少与...比较 compared with...We have service for our customers.Product 产品 we have products for our customers.Service n.Serve vt.We serve everyone.。
英语图表描述的技巧
英语图表描述的技巧1. 确定图表类型:动态图表:有变化趋势2010 手机,2011 汽车品牌,2013 兼职,2014.1 城市乡村静态图表:只有比例2012 员工满意度2014.12 春节花销2.动态图表 (柱状图,线性图):①确定描述对象;②多个描述对象则分别描述;③找到变化趋势(上升,下降,不变);④具体数字可写可不写;假设写,只写首尾数字。
⑤动态图表一般用过去时态描述。
2图表英语作文怎么写认真读图,不要缺失任何一个部分。
图表作文总的来说是结合说明和表达观点的文章,所以首先就要审好题,无论是以什么形式展现出来的图表作文,我们首先都要看清楚说的内容以及它的数据,分析它要我们写什么。
三段论第一段(描述段):考试的作文三段论通常是跑不掉的,见到英语考试有图表作文不要慌。
我们还是把作文分为三部分,第一段对图表来一个总体的描述,简单概括一下列图表的内容,基本就不会有什么岔子了。
三段论第二段(分析段):分析图表内容,这一段就不是概括那么简单了,我们要横向地、纵向地对图表进行分析,特别是数据的最大值、最小值等等,通常图表作文都会有一个主题,我们分析之余要往这个方向靠。
不要排列数字,要分析出规律。
三段论第三段(表达段):这一段通常就文章的大意,或者顺着出题者的意思去进行一个"自己的看法'补充,也就是对这个现象或者是状况作出一种总结和评论。
这一点大家写作文通常都会有,就不用太担心了。
检查与修改:写完一篇作文后,如果有时间,尽量去检查一下单词有没有错误,因为图表作文通常都要用到一些平常不常用的短语,注意看看有没有对图的描述还有没有其他的遗漏,如果有尽量作出一点补充。
3英语考试的小技巧听力问答英语考试的第一大项就是英文听力,假设是做的不好会影响到后面题目的作答。
听听力前要先浏览每个听力题目,熟悉每一个听力选项,推测这一道听力小题目对话可能会说些什么,答案又有可能是哪一个。
这样带着问题听力更能加大对关键词汇的敏感度,提升听力的准确性,获得更高的分数。
如何用英文分析各种图表

Frankly speaking, the user of the fixed telephone is decreasing. On contrast, the user of mobile phone is creasing .It shows that the devolpment of our country and the addition of our income. At the same time, it makes our life more convenient.
This is a pie diagram about ”Typical Lone Noble Spending Proportion”, one of the largest proportion is “Personal life basic expenses “ which reached 40 percent ,when ” Housing “ account for 30 percent , ” Other Expenses “ take up 20 percent and ”Savings and Investment “ and “Support Their Parents” each only account for five percent .To our surprise , children education expenses is zero .
The common used phrase in graph analysis
• • • • • • • • • • As we can see from the graph/charts As is indicated in the bar chart/diagram Generally speaking A much higher percentage Take up a much larger percentage in Show a trend of Reveal a trend of dramatic increase Have a significant impact on Much better than that of Cover a much wider range of
描述图标-英语

上升, 上升, 下降
词: rise, raise,climb, rise, raise,climb, increase, increase,jump, go up, up, ascend,mount, ascend,mount, aggrandize 例子: 例子: 人口上升: 人口上升: the number of population increased/ascended/mou nted.
19
练习
最近5年来中国人口的出生率已经大大下 最近5年来中国人口的出生率已经大大下 降。 最近10年来印度人口飞速增长。 年来印度人口飞速增长 最近10年来印度人口飞速增长。 这个工厂生产的彩电已由1986年的 年的5000 这个工厂生产的彩电已由1986年的5000 增加到1990年的 年的21000台 台增加到1990年的21000台。 这个学校的教职工人数已减少到 人 减少到700 这个学校的教职工人数已减少到700人。
17
3、复苏后面需要使用的是from 复苏后面需要使用的是from
recover from 举例: 举例: 人口在200万时开始复苏 万时开始复苏: 人口在200万时开始复苏: The number of population recovered from 2 million.
18
4、波动后面需要连接 between …..and…..
词: fall, drop, decrease, descend, decline 例子: 例子: 人口减少: 人口减少: the number of population decreased/ declined .
7
保持平稳
词: stay stable,remain steady stable, 例子: 例子: 人口数量保持平稳 : the number of population stayed / remained stable.
柱状图英语描述方法
柱状图英语描述方法1、图形种类及概述法:泛指一份数据图表:a data graph(曲线图)/chart/diagram/illustration/table饼图:pie chart直方图或柱形图:bar chart/histogram趋势曲线图:line chart/curve diagram表格图:table流程图或过程图:flow chart/sequence diagram程序图:processing/procedures diagram2、常用的描述用法The table/chart diagram/graph shows (that)According to the table/chart diagram/graphAs (is) shown in the table/chart diagram/graphAs can be seen from the table/chart/diagram/graph/figures, figures/statistics shows (that)It can be seen from the figures/statisticsWe can see from the figures/statisticsIt is clear from the figures/statisticsIt is apparent from the figures/statisticstable/chart/diagram/graph figures (that)table/chart/diagram/graph shows/describes/illustrates 3、图表中的数据(Data)具体表达法数据(Data)在某一个时间段固定不变:fixed in time在一系列的时间段中转变:changes over time继续变化的data在不同状况下:增加:increase/raise/rise/go up减少:decrease/grow down/drop/fall波动:fluctuate/rebound/undulate/wave稳定:remain stable/stabilize/level off2如何写柱状图图表作文柱状图表作文一般较为容易,不像曲线图那样令人眼花缭乱,其数字之间的对出非常显然。
如何用英语描述图表
1、图形种类及概述法:泛指一份数据图表:a data graph(曲线图)/chart/diagram/illustration/table饼图:pie chart直方图或柱形图:bar chart/histogram趋势曲线图:line chart/curve diagram表格图:table流程图或过程图:flow chart/sequence diagram程序图:processing/procedures diagram2、常用的描述用法The table/chart diagram/graph shows (that)According to the table/chart diagram/graphAs (is) shown in the table/chart diagram/graphAs can be seen from the table/chart/diagram/graph/figures,figures/statistics shows (that)……It can be seen from the figures/statisticsWe can see from the figures/statisticsIt is clear from the figures/statisticsIt is apparent from the figures/statisticstable/chart/diagram/graph figures (that)……table/chart/diagram/graph shows/describes/illustrates 3、图表中的数据(Data)具体表达法数据(Data)在某一个时间段固定不变:fixed in time在一系列的时间段中转变:changes over time持续变化的data在不同情况下:增加:increase/raise/rise/go up ……减少:decrease/grow down/drop/fall ……波动:fluctuate/rebound/undulate/wave ……稳定:remain stable/stabilize/level off ……二、相关常用词组1、主章开头图表类型:table(表格)、chart(图表)、diagram(图标)、graph(多指曲线图)、column chart(柱状图)、pie graph(饼图)、tree diagram(树形图)描述:show、describe、illustrate、can be seen from、clear、apparent、reveal、represent内容:figure、statistic、number、percentage、proportion2、表示数据变化的单词或者词组rapid/rapidly 迅速的,飞快的,险峻的dramatic/dramatically 戏剧性的,生动的significant/significantly 有意义的,重大的,重要的sharp/sharply 锐利的,明显的,急剧的steep/steeply 急剧升降的steady/steadily 稳固的,坚定不移的gradual/gradually 渐进的,逐渐的slow/slowly 缓慢的,不活跃的slight/slightly 稍微的、略微地stable/stably 稳定的3、其它在描述中的常用到的词significant changes 图中一些较大变化noticeable trend 明显趋势during the same period 在同一时期grow/grew 增长distribute 分布unequally 不相等地in the case of 在……的情况下in terms of/in respect of/regarding 在……方面in contrast 相反,大不相同government policy 政府政策market forces 市场力量measuren n.尺寸,方法,措施v.估量,调节forecast n.先见,预见v.猜测三、图表描述套句精选1.the table shows the changes in the number of……over the period from……to……该表格描述了在……年之……年间……数量的变化。
各类图表英文描述
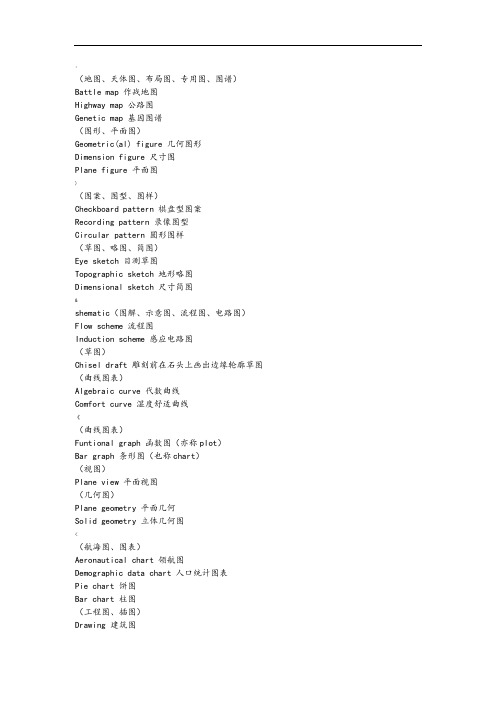
:(地图、天体图、布局图、专用图、图谱)Battle map 作战地图Highway map 公路图Genetic map 基因图谱(图形、平面图)Geometric(al) figure 几何图形Dimension figure 尺寸图Plane figure 平面图)(图案、图型、图样)Checkboard pattern 棋盘型图案Recording pattern 录像图型Circular pattern 圆形图样(草图、略图、简图)Eye sketch 目测草图Topographic sketch 地形略图Dimensional sketch 尺寸简图&shematic(图解、示意图、流程图、电路图)Flow scheme 流程图Induction scheme 感应电路图(草图)Chisel draft 雕刻前在石头上画出边缘轮廓草图(曲线图表)Algebraic curve 代数曲线Comfort curve 湿度舒适曲线《(曲线图表)Funtional graph 函数图(亦称plot)Bar graph 条形图(也称chart)(视图)Plane view 平面视图(几何图)Plane geometry 平面几何Solid geometry 立体几何图<(航海图、图表)Aeronautical chart 领航图Demographic data chart 人口统计图表Pie chart 饼图Bar chart 柱图(工程图、插图)Drawing 建筑图Explanatory drawing 说明(插)图*(布局图、规划图)1、图形种类及概述法:泛指一份数据图表:a data graph(曲线图)/chart/diagram/illustration/table饼图:pie chart直方图或柱形图:bar chart/histogram趋势曲线图:line chart/curve diagram、表格图:table流程图或过程图:flow chart/sequence diagram程序图:processing/procedures diagram2、常用的描述用法The table/chart diagram/graph shows (that)According to the table/chart diagram/graphAs (is) shown in the table/chart diagram/graphAs can be seen from the table/chart/diagram/graph/figures,;figures/statistics shows (that)……It can be seen from the figures/statisticsWe can see from the figures/statisticsIt is clear from the figures/statisticsIt is apparent from the figures/statisticstable/chart/diagram/graph figures (that)……table/chart/diagram/graph shows/describes/illustrates3、图表中的数据(Data)具体表达法《数据(Data)在某一个时间段固定不变:fixed in time在一系列的时间段中转变:changes over time持续变化的data在不同情况下:增加:increase/raise/rise/go up ……减少:decrease/grow down/drop/fall ……波动:fluctuate/rebound/undulate/wave ……稳定:remain stable/stabilize/level off ……}二、相关常用词组1、主章开头图表类型:table(表格)、chart(图表)、diagram(图标)、graph(多指曲线图)、column chart(柱状图)、pie graph(饼图)、tree diagram(树形图)描述:show、describe、illustrate、can be seen from、clear、apparent、reveal、represent 内容:figure、statistic、number、percentage、proportion2、表示数据变化的单词或者词组rapid/rapidly 迅速的,飞快的,险峻的dramatic/dramatically 戏剧性的,生动的/significant/significantly 有意义的,重大的,重要的sharp/sharply 锐利的,明显的,急剧的steep/steeply 急剧升降的steady/steadily 稳固的,坚定不移的gradual/gradually 渐进的,逐渐的slow/slowly 缓慢的,不活跃的slight/slightly 稍微的、略微地stable/stably 稳定的,3、其它在描述中的常用到的词significant changes 图中一些较大变化noticeable trend 明显趋势during the same period 在同一时期grow/grew 增长distribute 分布unequally 不相等地in the case of 在……的情况下【in terms of/in respect of/regarding 在……方面in contrast 相反,大不相同government policy 政府政策market forces 市场力量measuren n.尺寸,方法,措施v.估量,调节forecast n.先见,预见v.猜测?三、图表描述套句精选table shows the changes in the number of……over the period from……to……该表格描述了在……年之……年间……数量的变化。
图表描述句型

1、图表的种类泛指一份数据图表:chart/diagram/illustration/table 曲线图:curve graph饼图:pie chart柱形图:bar chart表格图:table流程图:flow chart树形图: tree diagram2、如何描述图表,句子的开头The table/chart/diagram/graph shows/illustrates (that)According to the table/chart/diagram/graph,As (is) shown/ exhibited in thetable/chart/diagram/graph,As can be seen from thetable/chart/diagram/graph/figures,Figures/statistics show(that)It can be seen from the figures/statisticsWe can see from the figures/statisticsIt is clear/apparent from the figures/statistics 3、图表数据的内容数据图中不外乎两种数据——number和percentage的体现。
因此主语出来一般会是the number of 和 the percentage of 的形式,至于of后面的东西需要具体结合图表信息来判断。
你必须得准确判断出这幅图究竟显示的是什么的数据和百分比,因为主语的准确性在图表描述中尤其重要。
4、图表中数据变化的描述动态图中的关键点主要有三个:起点,拐点和终点。
起点和终点应该尽量展现,但是拐点比较特殊,当出现频繁的拐点时便不需要每个点都给数据,只须描述出这一段的趋势便可。
数据在某一个时间段固定不变:be fixed in 1990,1995,2001在一系列的时间段中转变:changes over time 增加:increase/rise/climb/ go up to/by……减少:decrease/go down/drop/fall to/by……波动:wave/fluctuate稳定:remain stable5、修饰数据变化的副词rapidly 迅速的,飞快的significantly 有意义的,重大的,重要的sharply/dramatically急剧的steadily 稳固的gradually 渐进的,逐渐的slowly 缓慢的slightly 稍微的、略微地6.其他常用词和词组significant changes 图中一些较大变化noticeable trend 明显趋势during the same period 在同一时期distribute 分布unequally 不相等地in the case of 在……的情况下in terms of/in respect of/regarding 在……方面in contrast 相反,大不相同government policy 政府政策market forces 市场力量take measures采取措施forecast 预见high/low/great/small/ percentage. 比率高(低)be similar to…… 与……相似be the same as…… 与……相同7、时间的表达1)in the year between……and……/ over the period from……to……在……年到……期间……2)in the 3 years spanning from 1995 through 1998…… 1995年至1998三年里……3)from then on…… 从那时起……4)year by year 逐年5)在…前/后 before… / after…6)自从… /直到… since…/ until…8、图表描述套句1)The table shows the changes in the number of……over t he period from……to……该表格描述了在……年之……年间……数量的变化。
英语论文写作中图表描述表达法集粹

图表描述表达法集粹I .Introduction (Paraphrase the Words on the Graphic Material) ﹡ Pattern One (Without the Summary of the Trend)1.This diagram unfolds a clear comparison between Florida ,a state of the United States ,and the United States as a whole in four aspects ,namely ,registered engineers ,the civilian labor force ,manufacturing employment and hi-tech employment ,from 1978 to 1987.2.There were many significant changes in modes of transport used by city dwellers from 1950 to 1990.The following paragraphs will identify and discuss the trends in the accompanying graph .3.The chart below displays the average earnings per week ,in pounds sterling ,of people of different levels of education living in the UK between the years 1965 and 1995.4.The chart indicates the subjects studied by university students in Australia during the latter of last century .5.The chart shows the number of road accidents in Britain over a period of six years .6.The line graph reveals the amount of fast food consumed by Australian teenagers over a 25-year period between 1975 and 2000.7.The bar chart illustrates the percentage of employees in different occupations absent from work in a given week in 2001.8.Indicators of economic and social conditions in four countries ,Canada ,Japan ,Peru and Zaire ,in 1994,compiled by the UN ,reflect the great differences that exist between wealthier and poorer nations .﹡Pattern Two (With the Summary of the Trend)⎪⎩⎪⎨⎧trend overall the describe two Sentence graph the in described being is what and location date about is graph the what define one Sentence :),(:on Introducti9. The graph compares the rate of smoking in men and women in Erewhonbetween the years 1960 and 1995. It can be clearly seen that the rate of smoking for both men and women is currently declining and that fewer women have smoked throughout the period.10. The graphs compare the number of deaths caused by six diseases in Erewhom in 1990 with the amount of research funding allocated to each of those diseases. It can be clearly seen that the amount of research funding in many cases did not correlate with the seriousness of the disease in terms of numbers of deaths.11. The three graphs provide an overview of the types of music people purchase in the UK. At first glance, we see that classical music is far less popular than pop or rock music.II. Comparison﹡The Same12. In 1985, people with a Master's degree enjoyed the same average earnings as people with a Doctoral degree.﹡Little Difference13. The difference in earnings of people with different levels of education is very small.14. The situation in Australia and New Zealand was similar in that the imprisonment rates from 1930 to 1980 remained stable.15. A similar trend was seen in Asia.16. The difference in earnings between high school leavers and university graduates diminished after 1995.17. By 1999, coffee consumption in China stood at 992 million cups, almost equal that of America, which stood at 1,090 million cups per year.18. The trend was virtually mirrored by study of the arts, which increased significantly from 20 % in 1950-59, through 25 % ten years later, finally reaching 38 % by 1990-99.19. During the first period of each year, the figures averaged out to around 300,000 to 350, 000 accidents.20. A similar pattern is also recorded for both the finance/banking and defence-related public sectors.* Large Difference21. There is a significant difference between all three countries.22. In the highest executive position (Grade A), women represent only about 8% of the workers This stands in marked contrast to the 92% of men represented in this job category.23. This is in stark contrast with 1945 when only 30% of girls completed primary school, 35 % had no schooling at all and 35 % only completed the third grade.24. It can be seen that the amount of leisure time available varies considerably across the age groups and that people of different age levels have very different ways of spending their free time.25. When children enter the household, however, the inequality becomes even more pronounced.26. Canada differs from the United States because the figures reached a peak of 120 people in a thousand in 1930.27. In contrast, almost the opposite occurred with business.28. In fact, the higher the position, the higher the percentage of men represented in the category. In comparison, women's representation is inversely proportional to the men's so that the higher the category, the lower the percentage of women to be found.29. Interest also drops off after the age of 35 with an even sharper fall from age 45 onwards, a pattern which is the opposite to the classical music graph.Less than30. Earning for people with a Bachelor's degree was slightly less than people with a Master's or Doctoral degree.31. The figures reveal that hamburgers are the most popular fast food, pizza coming a close second.32. In a word, America has the highest rate of imprisonment, followed by Europe and finally Australia.33. Although the rate of imprisonment in New Zealand fell, it was outmatched by the United State' s.34. The increase in earning for the whole period was less for people with a Bachelor's degree (£60) than for people with a Master's or Doctoral degree (£70).* More than35. There were more males than females (5% and 10% respectively).36. These figures were overwhelmingly greater than the corresponding figures of $160 in Peru and $130 in Zaire.37. People working in the computer industry in China exceeded that of Britain in the year 2000.38. In 1970 and 2000, more people did manual labor in Britain than in China.39. In 1960, the United State's imprisonment was in the process of being developed. Yet it still outnumbered the other countries.40. Although the United States experienced a decline in imprisonment rates, it still remained ahead of Canada.41. We .would expect to see that coffee drinkers in America far outweigh those in China, which, in fact is the case.42. In both cases, teenagers, and retired people spend around twice as much time as those who are at working age.﹡Avoiding Repetition43. While women showed a steady increase, male smokers dropped sharply after 1980, but began a steady increase again after 1990.44. People working in the computer industry in China exceeded that of Britain in the year 2000.45. The number of male smokers in 1960 stood at 21%, compared to 16% of the female population.Ⅲ. Overall Trend46. There was an overall increase in earnings across the board.47. Female smokers saw the opposite trend.48. The increase in male smokers corresponds with a decline in female smokers.49. The general trend is that the amount of TV watched increases with age.50. China experienced a decline in agricultural and manual work, and a significant rise in computer-related work.51. Far less significant change took place in Britain with the exception of a significant decline in manual jobs.52. There was a steady increase in computer use in all categories.53. Most computer usage is for business or pleasure purposes.54. The trend continued through 1970.55. Overall, there was a decline in male smokers.56. Apart from a decline in the 31 to 45 age group, overall, America saw a steady climb after about 21, from 18% to 40 %.57. All four continents saw a general population growth.58. A similar trend was seen in Asia.IV. Increase* Big Increase59. The biggest change occurred in the period 1985 to 1995, when high school graduates enjoyed the greatest increase in earnings.60. Over the thirty-year period, there was a big increase in earnings amongst people with high school certificates (£85).61. China experienced a significant rise in computer-related work.62. There was a dramatic increase, in 1970, in the number of university graduates.63. Japan experienced a massive increase in car ownership in the 1930s.64. There was a significant difference in the money people spent on CDs in the Northern Territories between August and September, from 25 % to 48 %.65. The greatest difference occurred between 1940 and 1950 in Brazil.66. After 1940, there was a significant increase in the number of imprisonments, reaching 90 thousand in 1980, a three-fold increase from 1930.67. In Great Britain, in 1930, imprisonment figures stood at 30, 000. However, they increased three fold, to 90,000 by 1980.68. Three years later, in 1996, both countries saw a marked increase.69. In fact, 1997 saw a huge increase from 329,000 accidents in the first quarter to a massive 764,000 accidents during the second quarter.70. From this time onwards, energy demand climbed dramatically from two units of energy in 1996 and is projected to reach seven units in the year 2005.71. It increased substantially at the beginning of the year.* Small Increase72. During the same period, people with a Doctoral degree increased their earnings by the least amount.73. The Northern Territories, during the first part of the year, experienced a slight increase from 10% in January to 15% in March.74. People holding a Bachelor's degree only managed a modest increase of £ 5 per week, reaching a level of£145 in 1995.75. The number of men in the sector rose only marginally from 425,000 to 480,000 in the same period.* Gradual/Steady Increase76. There was a gradual increase in earning amongst people with a university degree.77. While women showed a steady increase, male smokers dropped sharply after 1980, but began a steady increase again after 1990.78. There was a steady increase in computer use in all categories.79. India experienced a steady rise between 1940 and 1960.80. Following a slump in sales during April to June, Queensland saw a steady rise in spending between July and October.81. In 1990, the number of male smokers diminished significantly to only 13 96, whilst the number of female smokers rose steadily to 22 %.82. Apart from a decline in the 31 to 45 age group, overall, America saw a steadyclimb after about 21, from 18% to 40%.* Sharp Increase83. There was a sharp increase in the USA in 1970 from 5 million to 8 million. There was a second significant increase in 1990 to 11 million, followed by a massive leap to 24 million in 2000.84. Mobile phone use increased in big leaps in Japan, reaching a peak of 32 million in 1990.85. Mobile phone use doubled to 2 million in 1980, followed by a sudden and massive increase to 17 million in 1990.86. Earnings in general rose sharply between 1965 and 1995.87. Japan remained much lower than other countries, fluctuating between 6 % and 14% during the whole period. The exception being after about 55 years of age, when there was a sudden leap to 36 %.88. By 1968 this increased to 170, and increased again but more steeply to 320 in 197789. After that, it rose gradually to 5,000, and then continued its upward trend more steeply to 15,000.90. The number of women grew sharply from 25,000 to over 100,000.V. Summit91. Mobile phone use increased in big leaps in Japan, reaching a peak of 32 million in 1990.92. Due to the introduction of a luxury goods tax, Acme Sports Cars' monthly profit fell dramatically during the second quarter from $ 800,000 to only $10,000, whereas that of Branson Motors continued to rise, peaking at just over $ 60,000 by the end of December.VI. Decrease﹡Steady Decrease93. China experienced a steady decline in agricultural and manual work.94. The number of male smokers decreased from 21% in 1960 to 17 % in 2000.95. The consumption of hamburgers and pizza has risen steadily over the 20 year period to 1990 while the consumption of fish and chips has been in decline over that same period with a slight increase in popularity since 1985.﹡Sharp Decrease96. While women showed a steady increase, male smokers dropped sharply after 1980, but began a steady increase again after 1990.97. A sharp decline occurs in Britain after the age of about 46.98. Following a slump in sales during April to June, Queensland saw a steady rise in spending between July and October.99. However, following the sharp decline of male smokers in 1990 to 13 %, the number began to rise again, and reached 17% in 2000.100. During the years 1950-59, there were an incredible 45 % of students studying science, yet by the next decade this number had reduced dramatically to 30 %.101. This decline slowed down to 25 % in 1970 - 79, but dropped off sharply during the next ten years to 15%, and finally 4% by 1990 - 99.102. At this point the number of cases remained stable, then phummeted to zero by 1988.103. This number decreased gradually to 500 by 1974 and continued to decrease but more steeply to 250 in 1995.104. It slowly decreased to 100, and then continued its downward trend more steeply to 15.﹡Great Decrease105. There was a huge drop in car ownership in Brazil during the 1940s.106. There was a significant difference in the number of cars owned in Japan between the years 1940 and 1970.107. Far less significant change took place in Britain with the exception of a significant decline in manual jobs.108. The greatest difference occurred between 1940 and 1950 in Brazil.109. In 1990, the number of male smokers diminished significantly to only 13%,whilst the number of female smokers rose steadily to 22 %.﹡Small Decrease110. There was a slight drop/fall between 1930 and 1940 in India.111. Japan remained very low compared to the other countries, with a fall from 14% to 8% after the age of 21. This was followed by a further fall to 6 % after 30.112. The demand for energy dropped steadily between 1985 and 1990 from 5 units of energy to approximately 2 units.Ⅶ. Bottom113. The percentage of male smokers reached the bottom of 13 % in 1990.114. The number of students studying science bottomed out in 1959.115. The sale of air conditioner reached rock bottom in December, only a third of that sold in July.Ⅷ. Steadiness116. The numbers remained steady throughout the twenty-year period.117. There was little change in people's spending habits between August and November in New South Wales where it remained steady at around 35 %.118. In 1985, earnings leveled out amongst people with a Master's degree and with a Doctoral degree.119. The rate in Canada, on the other hand, increased, whilst Australia experienced no change.120. The situation in Australia and New Zealand was similar in that the imprisonment rates from 1930 to 1980 remained stable.121. From 1990 until about 1995, energy demand appeared to level off and remained constant at about two units of energy.122. Twenty years later, although the number of men remained unchanged, the number of women rose substantially to 350,000.123. Mobile phone use plateaued at 32 million in the second quarter of the year.IX. Fluctuation﹡Minor Fluctuation124. There was a minor fluctuation between 1920 and 1940 in India.125. China remained fairly steady fluctuating between 10% and 22% across all age ranges, with a slight increase to 29 % after the age of 56.Ⅺ Surprising Find126. The most surprising find is the difference between Japan and Brazil.127. A surprising find occurred in Queensland, during March to May, when people's spending increased from 27% in March to 38% in April, only to drop to 12% the following month.128. Japan remained much lower than other countries, fluctuating between 6% and 14% during the whole period, the exception being after about 55 years of age, when there was a sudden leap to 36 %.129. Whilst the trend follows a line to be expected, the sudden rise and fall in population growth in North America during the 1800s stands out as being very significant.130. Clearly, therefore, it is the change in subjects chosen by students that takes the reader by surprise.131 Whilst the overall trend in the number of accidents follows an expected course, the two anomalies, that is to say during the second quarter of 1997, and the third quarter of 1998, stand out as being significant when compared to the overall findings.Ⅺ. Percentage132. The number of male smokers in 1960 stood at 21%, compared to 16% of the female population.133. However, following the sharp decline of mate smokers in 1990 to 13~,6, the number began to rise again, and reached 17% in 2000.134. In 1900, however, the population rose sharply by more than 12 %.135. Approximately 72 % of workers in the lowest executive positions of Grade E are women.136. Here women represent 45 % and men 55 % of the workers in the category.137. From the information shown, it can be seen that rent and food account for exactly a third of the total amount spent by students, amounting to £ 100 per week.138. It is evident that absentee rates are lowest for the best remunerated jobs, with managers and administrators recording only around 3.25 % absence.139. Canada and Japan both reported rates of 99%, while Peru claimed 68 %. Zaire had a literacy rate of only 34 %.Ⅻ. Sentence Connectors* Introduce Contrasting Information140. There was little change in car ownership in Japan between 1920 and 1930. However, there was a significant difference in the number of cars owned between the years 1930 and 1940.141. Whilst car ownership in Brazil remained steady between 1920 and 1940, there was a huge drop during the 1940s.142. India, on the other hand, saw a slight increase from 230 in 1920 to 240 in 1930.143. While women showed a steady increase, male smokers dropped sharply after 1980, but began a steady increase again after 1990.144. Whereas women's unpaid hours rise to approximately 56 per week, the corresponding figure for men, 16, actually represents a decrease.145. Compared to high school leavers, university graduates earned a high salary in 1965.146. The number of male smokers in 1960 stood at 21%, compared to 16% of the female population.147. In 1965, people with a Master's or a Doctoral degree only earned slightly more than people with a Bachelor's degree. In contrast, however, university graduates earned far more than school leavers.148. Britain, on the other hand, saw an opposite trend--whilst it increased from 22 % to 26 % up to age of 21, it decreased sharply to 15 % after the age of 30.149. By contrast, the divorce rate in the US is much higher (around 5 per 1,000),although decreasing (by about 0.5 per 1,000) during the period.* Emphasize the Importance of the Information and Give Information to Show Your Statement Is True150. There was a significant difference in the number of cars owned between the years 1930 and 1940. In fact, the country experienced a massive increase during the 1930s.151. The greatest difference, however, occurred between 1940 and 1950 in Brazil. Indeed, whilst car ownership in Brazil remained steady between 1920 and 1940, there was a huge drop during the 1940s.﹡Show When a Change Took Place152. There was a massive drop in car ownership during the 1940s. This was followed by a steady increase from 100 million in 950 to around 130 million in 1980.﹡Time153. From 1990 until about 1995, energy demand appeared to level off and remained constant at about two units of energy. From this time onwards, energy demand climbed dramatically from two units of energy in 1996.154. As an overall trend, it is clear that the number of cases of the disease increased fairly rabidly until the mid-Seventies, remained constant for around a decade at 500 cases before dropping to zero in the late 1980s.155. There was a slight drop to 90, which led to a more marked decline to 50.156. It reached a peak at Christmas, which preceded a drop back to the November level of 500.﹡Shift to Another topic157. As to the other three aspects, though the growth rates were not so high, they were indeed remarkable and impressive.158. As for the photography option, more females than males are enrolled from every country except Germany.Ⅷ. Conclusion —— Summarize the Main Findings159. While people's earnings increased according to their level of education, thedifferences are far smaller than would be expected. What's more surprising, however, is that the increase in earnings amongst high school leavers was far higher than the earnings for university graduates.160. As the report indicates, what is surprising is not the increase in female smokers compared to male smokers, but the differences in the changes over the 40-year period.161. One of the most surprising finds was the amount of TV watched by people in Japan compared with most other countries. In addition, apart from a significant drop after the age of 56 in the UK, generally, the amount of TV people watch increases significantly after the age of 56.162. Overall, the chart demonstrates that in the categories for which statistics on mate leisure time were available, men enjoyed at least ten hours more leisure time than women.163. From the diagram it can be safely concluded that in the years 1978 - 1987 Florida developed much more rapidly than the United States as a whole.164. In conclusion, the men occupy a greater percentage of high executive positions in the ACME Oil Company.165. In summary, we can see that the area devoted to grain production was affected by both government policy and market forces.。
图表作文常用表达方法

1、图形种类及概述法:、图形种类及概述法:泛指一份数据图表:a data graph/chart/diagram/illustration/table 饼图:pie chart 直方图或柱形图:bar chart / histogram 趋势曲线图:line chart / curve diagram 表格图:table 流程图或过程图:flow chart / sequence diagram 程序图:processing/procedures diagram 2、常用的描述用法、常用的描述用法The table/chart diagram/graph shows (that)According to the table/chart diagram/graph As (is)shown in the table/chart diagram/graph As can be seen from the table/chart/diagram/graph/figures,figures/statistics shows (that)……It can be seen from the figures/statistics We can see from the figures/statistics It is clear from the figures/statistics It is apparent from the figures/statistics table/chart/diagram/graph figures (that)……table/chart/diagram/graph shows/describes/illustrates how……3、图表中的数据(Data)具体表达法)具体表达法数据(Data)在某一个时间段固定不变:fixed in time 在一系列的时间段中转变:changes over time 持续变化的data在不同情况下:在不同情况下:增加:increase / raise / rise / go up ……减少:decrease / grow down / drop / fall ……波动:fluctuate / rebound / undulate / wave ……/ stabilize / level off ……稳定:remain stable / stabilize / level off ……最常用的两种表达法:最常用的两种表达法:动词+副词形式(V erb+Adverb form)形容词+名词形式(Adjective+Noun form)二、相关常用词组二、相关常用词组1、主章开头、主章开头图表类型:table、chart、diagramgraph、column chart、pie graph 描述:show、describe、illustrate、can be seen from、clear、apparent、reveal、represent 内容:figure、statistic、number、percentage、proportion 2、表示数据变化的单词或者词组、表示数据变化的单词或者词组rapid/rapidly迅速的,飞快的,险峻的迅速的,飞快的,险峻的dramatic/dramatically戏剧性的,生动的戏剧性的,生动的significant/significantly有意义的,重大的,重要的有意义的,重大的,重要的sharp/sharply锐利的,明显的,急剧的锐利的,明显的,急剧的steep/steeply急剧升降的急剧升降的steady/steadily稳固的,坚定不移的稳固的,坚定不移的gradual/gradually渐进的,逐渐的渐进的,逐渐的slow/slowly缓慢的,不活跃的缓慢的,不活跃的slight/slightly轻微的、略微地轻微的、略微地stable/stably稳定的稳定的3、其它在描述中的常用到的词、其它在描述中的常用到的词significant changes图中一些较大变化图中一些较大变化noticeable trend明显趋势明显趋势during the same period在同一时期在同一时期grow/grew增长增长distribute分布,区别分布,区别unequally不相等地不相等地in the case of adv.在……的情况下的情况下in terms of / in respect of / regarding在……方面方面in contrast相反,大不相同相反,大不相同government policy政府政策政府政策market forces市场规率市场规率measure n.尺寸,方法,措施v.估量,调节估量,调节forecast n.先见,预见v.预测预测三、考研英语图表写作套句精选三、考研英语图表写作套句精选1.the table shows the changes in the number of……over the period from……to……该表格描述了在……年之……年间……数量的变化。
如何用英文描述各种图表
如何用英语描述各种图表1、图形种类及概述法:泛指一份数据图表:a data graph(曲线图)/chart/diagram/illustration/table饼图:pie chart直方图或柱形图:bar chart/histogram趋势曲线图:line chart/curve diagram表格图:table流程图或过程图:flow chart/sequence diagram程序图:processing/procedures diagram2、常用的描述用法The table/chart diagram/graph shows (that)According to the table/chart diagram/graphAs (is)shown in the table/chart diagram/graphAs can be seen from the table/chart/diagram/graph/figures,figures/statistics shows (that)……It can be seen from the figures/statisticsWe can see from the figures/statisticsIt is clear from the figures/statisticsIt is apparent from the figures/statisticstable/chart/diagram/graph figures (that)……table/chart/diagram/graph shows/describes/illustrates3、图表中的数据(Data)具体表达法数据(Data)在某一个时间段固定不变:fixed in time在一系列的时间段中转变:changes over time持续变化的data在不同情况下:增加:increase/raise/rise/go up ……减少:decrease/grow down/drop/fall ……波动:fluctuate/rebound/undulate/wave ……稳定:remain stable/stabilize/level off ……二、相关常用词组1、主章开头图表类型:table(表格)、chart(图表)、diagram(图标)、graph(多指曲线图)、column chart(柱状图)、pie graph(饼图)、tree diagram(树形图)描述:show、describe、illustrate、can be seen from、clear、apparent、reveal、represent内容:figure、statistic、number、percentage、proportion2、表示数据变化的单词或者词组rapid/rapidly 迅速的,飞快的,险峻的dramatic/dramatically 戏剧性的,生动的significant/significantly 有意义的,重大的,重要的sharp/sharply 锐利的,明显的,急剧的steep/steeply 急剧升降的steady/steadily 稳固的,坚定不移的gradual/gradually 渐进的,逐渐的slow/slowly 缓慢的,不活跃的slight/slightly 稍微的、略微地stable/stably 稳定的3、其它在描述中的常用到的词significant changes 图中一些较大变化noticeable trend 明显趋势during the same period 在同一时期grow/grew 增长distribute 分布unequally 不相等地in the case of 在……的情况下in terms of/in respect of/regarding 在……方面in contrast 相反,大不相同government policy 政府政策market forces 市场力量measuren n.尺寸,方法,措施v.估量,调节forecast n.先见,预见v.猜测三、图表描述套句精选1.the table shows the changes in the number of……over the period from……to……该表格描述了在……年之……年间……数量的变化。
英文图表描述类方法汇总

今天我们所要关注的是运动图表,无论是什么题目的运动图表,无论题出的多难,我们都要清醒的认识到,那就是考官也逃不出如下的5个范畴,它们分别是运动范畴,程度范畴,时间范畴,数据范畴与连接范畴。
(一)运动范畴中存在着如下的8种运动趋向:1、保持平稳:我们可以使用的套用结构有: stay stable/ remain steady举例:表示人口数量保持平稳的时候可以写: the number of population stayed stable。
/the number of population remained steady2、上升/增加:我们可以使用的套用结构有:rise/ climb/ increase/ ascend/mount/aggrandize(增加)举例:人口上升:the number of population increased/ascended/mounted等等。
3、下降/减少:我们可以使用的套用结构有:fall/ drop/ decrease/ descend/ decline举例:人口减少:the number of population decreased/ declined4、下降后保持平稳:这个线段前面是向下的,后面是平的,在表示这个平的时候我们就不可以使用remain steady了,我们要使用的结构是bottom out举例:人口下降后保持平稳:the number of population decreased and bottomed out5、上升后保持平稳:前面的上升我们就不用说了,但是在上升以后保持平稳,我们需要使用level off举例:人口上升后保持平稳:number of population mounted and leveled off6、复苏: 前面下降了以后,然后就上升了,这两条线段的连接点就叫复苏.英语中表达为recover举例:人口下降后复苏:number of population decreased and recovered7、波动:就像我们的心电图一样.英语中叫fluctuate 举例:人口波动:number of population fluctuated8、达到顶峰:peak/ reach its summit/reach its zenith举例:人口到达了顶峰:number of population peaked/ reached its summit/ reached its zenith但是同学们想过没有上升,下降,波动是存在程度的。
各类图表英文描述

各类图表英⽂描述1.Map(地图、天体图、布局图、专⽤图、图谱)Battle map 作战地图Highway map 公路图Genetic map 基因图谱2.Figure(图形、平⾯图)Geometric(al) figure ⼏何图形Dimension figure 尺⼨图Plane figure 平⾯图3.Pattern(图案、图型、图样)Checkboard pattern 棋盘型图案Recording pattern 录像图型Circular pattern 圆形图样4.Sketch(草图、略图、简图)Eye sketch ⽬测草图Topographic sketch 地形略图Dimensional sketch 尺⼨简图5.Scheme/shematic(图解、⽰意图、流程图、电路图)Flow scheme 流程图Induction scheme 感应电路图6.Draft(草图)Chisel draft 雕刻前在⽯头上画出边缘轮廓草图7.Curve(曲线图表)Algebraic curve 代数曲线Comfort curve 湿度舒适曲线8.Graph(曲线图表)Funtional graph 函数图(亦称plot)Bar graph 条形图(也称chart)9.View(视图)Plane view 平⾯视图10.Geometry(⼏何图)Plane geometry 平⾯⼏何Solid geometry ⽴体⼏何图11.Chart(航海图、图表)Aeronautical chart 领航图Demographic data chart ⼈⼝统计图表Pie chart 饼图Bar chart 柱图12.Drawing(⼯程图、插图)Drawing 建筑图Explanatory drawing 说明(插)图/doc/027847892.htmlyout(布局图、规划图)1、图形种类及概述法:泛指⼀份数据图表:a data graph(曲线图)/chart/diagram/illustration/table饼图:pie chart直⽅图或柱形图:bar chart/histogram趋势曲线图:line chart/curve diagram表格图:table流程图或过程图:flow chart/sequence diagram程序图:processing/procedures diagram2、常⽤的描述⽤法The table/chart diagram/graph shows (that)According to the table/chart diagram/graphAs (is)shown in the table/chart diagram/graphAs can be seen from the table/chart/diagram/graph/figures,figures/statistics shows (that)……It can be seen from the figures/statisticsWe can see from the figures/statisticsIt is clear from the figures/statisticsIt is apparent from the figures/statisticstable/chart/diagram/graph figures (that)……table/chart/diagram/graph shows/describes/illustrates3、图表中的数据(Data)具体表达法数据(Data)在某⼀个时间段固定不变:fixed in time在⼀系列的时间段中转变:changes over time持续变化的data在不同情况下:增加:increase/raise/rise/go up ……减少:decrease/grow down/drop/fall ……波动:fluctuate/rebound/undulate/wave ……稳定:remain stable/stabilize/level off ……⼆、相关常⽤词组1、主章开头图表类型:table(表格)、chart(图表)、diagram(图标)、graph(多指曲线图)、column chart (柱状图)、pie graph(饼图)、tree diagram(树形图)描述:show、describe、illustrate、can be seen from、clear、apparent、reveal、represent内容:figure、statistic、number、percentage、proportion2、表⽰数据变化的单词或者词组rapid/rapidly 迅速的,飞快的,险峻的dramatic/dramatically 戏剧性的,⽣动的significant/significantly 有意义的,重⼤的,重要的sharp/sharply 锐利的,明显的,急剧的steep/steeply 急剧升降的steady/steadily 稳固的,坚定不移的gradual/gradually 渐进的,逐渐的slow/slowly 缓慢的,不活跃的slight/slightly 稍微的、略微地stable/stably 稳定的3、其它在描述中的常⽤到的词significant changes 图中⼀些较⼤变化noticeable trend 明显趋势during the same period 在同⼀时期grow/grew 增长distribute 分布unequally 不相等地in the case of 在……的情况下in terms of/in respect of/regarding 在……⽅⾯in contrast 相反,⼤不相同government policy 政府政策market forces 市场⼒量measuren n.尺⼨,⽅法,措施v.估量,调节forecast n.先见,预见v.猜测三、图表描述套句精选1.the table shows the changes in the number of……over the period from……to……该表格描述了在……年之……年间……数量的变化。
如何用英语描述图表
如何用英语描述图表1、图形种类及概述法:泛指一份数据图表:a data graph(曲线图)/chart/diagram/illustration/table饼图:pie chart直方图或柱形图:bar chart/histogram趋势曲线图:line chart/curve diagram表格图:table流程图或过程图:flow chart/sequence diagram程序图:processing/procedures diagram2、常用的描述用法The table/chart diagram/graph shows (that)According to the table/chart diagram/graphAs (is) shown in the table/chart diagram/graphAs can be seen from the table/chart/diagram/graph/figures,figures/statistics shows (that)……It can be seen from the figures/statisticsWe can see from the figures/statisticsIt is clear from the figures/statisticsIt is apparent from the figures/statisticstable/chart/diagram/graph figures (that)……table/chart/diagram/graph shows/describes/illustrates3、图表中的数据(Data)具体表达法数据(Data)在某一个时间段固定不变:fixed in time在一系列的时间段中转变:changes over time持续变化的data在不同情况下:增加:increase/raise/rise/go up ……减少:decrease/grow down/drop/fall ……波动:fluctuate/rebound/undulate/wave ……稳定:remain stable/stabilize/level off ……二、相关常用词组1、主章开头图表类型:table(表格)、chart(图表)、diagram(图标)、graph(多指曲线图)、column chart(柱状图)、pie graph(饼图)、tree diagram(树形图)描述:show、describe、illustrate、can be seen from、clear、apparent、reveal、represent内容:figure、statistic、number、percentage、proportion2、表示数据变化的单词或者词组rapid/rapidly 迅速的,飞快的,险峻的dramatic/dramatically 戏剧性的,生动的significant/significantly 有意义的,重大的,重要的sharp/sharply 锐利的,明显的,急剧的steep/steeply 急剧升降的steady/steadily 稳固的,坚定不移的gradual/gradually 渐进的,逐渐的slow/slowly 缓慢的,不活跃的slight/slightly 稍微的、略微地stable/stably 稳定的3、其它在描述中的常用到的词significant changes 图中一些较大变化noticeable trend 明显趋势during the same period 在同一时期grow/grew 增长distribute 分布unequally 不相等地in the case of 在……的情况下in terms of/in respect of/regarding 在……方面in contrast 相反,大不相同government policy *** 政策market forces 市场力量measuren n.尺寸,方法,措施v.估量,调节forecast n.先见,预见v.猜测三、图表描述套句精选1.the table shows the changes in the number of……over the period from……to……该表格描述了在……年之……年间……数量的变化。
用英语描述图表方法

用英语描述图表方法一、图表的分类Line graphs(折线图)Bar charts(柱状图)pie charts(饼状图)二、常用描述图表的词汇increase上升 decrease下降rise 上升 decline 下降jump 跳跃式上升 dive 快速下降escalate 迅速上升 plument急速下降to reach a peak/high point 到达顶峰to reach a trough/low point 到达低点ro remain stable/constant/unchanged/static 保持稳定to level out 达到平衡点gradual 逐渐的 significant明显的slight 轻微的 dramatic 巨大的moderate平和的 sharp 尖锐的急剧的trend 趋势respectivel 分别的relative 相对greater than/less thanmore/mostless/least三、常用句子开头:The ________(什么类型的图表) illusrate the_____________(变量名)例如:The pie chart illustrate the proportion (占比)of five types of energy production in France in 1995 and 2005结尾: Overall, ___________(描述最突出的),inconstrac/while_______________(描述最不突出的),总结图表。
例如:Overall, in both years, the most significiant sources of energy were gas and coal, which together counted for over half of the production of energy in France, while nuclear and other kinds of energy sources generated the least. In All types of energy production there was a dramatic change over the 10 year period.中间部分:中间最好用两段表示,描述图表要注意一定要有引用图表中的确切数字。
如何用英文分析各种图表
From the graph, we can see the number of phone subscribers from 2006 to 2011.In 2011, the year also saw 285.12 million fixed telephone subscribers, the number is 22.5% lower than that in 2006. Mobile phone users numbered 986.25 million by the end of 2011, with 127.25 million new subscribers in the year. In total, the number of fixed and mobile phone users reached 1,271.37 million, an increase of 118.02 million as compared with that at the end of 2010. Phone coverage is 94.9 sets per 100 persons.
变化的程度(Degree of change)
• Dramatically/considerably/significantly/ moderately/slightly 变化速度(Speed of change)
• Rapidly/quickly/suddenly/gradually/stea dily/slowly
不再变动(an end to movement) • To flatten out/ level off 无变化(No change) • To remain constant/stable • To stay the same/ at the same level • To maintain/hold/keep
英语描述图表资料汇总

英语描述图表资料汇总这类图标话题或作文描述时,注意以下几点:审题时,除了要把握好图表的表层信息外,还要分析图标的深层含义,如原因、根源、可能的发展趋势等。
图表中所提供的说明文字往往是问题的切入点,一定要仔细分析。
描述数据时要抓住重点,为中心服务,不必面面俱到,切忌毫无目的地罗列图表中的数据。
如果数据较多,抓住图表中的极端点(如最大或最小、最多或最少,最好或最差)和基本相同进行描述。
主题句应明确,最好放在文章的开头,这样会使重点突出,主题明了。
常见模板第一段:总体描述图表,指明时间段,指出突出变化或不同常用句型或短语:As is clearly shown in the chart(图表)/ table(表格)/graph(线性图), ___________ According to the figures given in the table/chart/graph, ____________It can be seen from the table/chart/graph, _____________________.The figures in the table/chart reflect that ________________.especially, ________________(指出突出变化)第二段:(分析原因)There are several factors leading to this change / difference ……..There are several reasons for _____________.(引出原因)To begin with, _______(原因一)In addition, ______________(原因二)For example, _________(举例说明)Last but not the least, __________(原因三)To sum up——————————————(简要总结)第三段:(解决方法)Perhaps the best way to solve this problem is to …Many workable solutions have been found to dealing with this problemHere are some suggestions that we should …My suggestion is that …It is suggested that …提出个人观点As for meFor my partAs far as I am concernedI am in favor of…In my opinion一、词汇积累:1.各种图表的名称(Types of chart)饼状图(Pie chart):饼状图内部分成一块一块,用于表示所占分量,那一块一块就叫"segment"。
- 1、下载文档前请自行甄别文档内容的完整性,平台不提供额外的编辑、内容补充、找答案等附加服务。
- 2、"仅部分预览"的文档,不可在线预览部分如存在完整性等问题,可反馈申请退款(可完整预览的文档不适用该条件!)。
- 3、如文档侵犯您的权益,请联系客服反馈,我们会尽快为您处理(人工客服工作时间:9:00-18:30)。
今天我们所要关注的是运动图表,无论是什么题目的运动图表,无论题出的多难,我们都要清醒的认识到,那就是考官也逃不出如下的5个范畴,它们分别是运动范畴,程度范畴,时间范畴,数据范畴与连接范畴。
(一)运动范畴中存在着如下的8种运动趋向:1、保持平稳:我们可以使用的套用结构有: stay stable/ remain steady举例:表示人口数量保持平稳的时候可以写: the number of population stayed stable。
/the number of population remained steady2、上升/增加:我们可以使用的套用结构有:rise/ climb/ increase/ ascend/mount/aggrandize(增加) 举例:人口上升:the number of population increased/ascended/mounted等等。
3、下降/减少:我们可以使用的套用结构有:fall/ drop/ decrease/ descend/ decline举例:人口减少:the number of population decreased/ declined4、下降后保持平稳:这个线段前面是向下的,后面是平的,在表示这个平的时候我们就不可以使用remain steady了,我们要使用的结构是bottom out举例:人口下降后保持平稳:the number of population decreased and bottomed out5、上升后保持平稳:前面的上升我们就不用说了,但是在上升以后保持平稳,我们需要使用level off举例:人口上升后保持平稳:number of population mounted and leveled off6、复苏:前面下降了以后,然后就上升了,这两条线段的连接点就叫复苏。
英语中表达为recover举例:人口下降后复苏:number of population decreased and recovered7、波动:就像我们的心电图一样。
英语中叫fluctuate 举例:人口波动:number of population fluctuated8、达到顶峰:peak/ reach its summit/reach its zenith举例:人口到达了顶峰:number of population peaked/ reached its summit/ reached its zenith 但是同学们想过没有上升,下降,波动是存在程度的。
所以我们接下来要讨论的是程度的描述方法。
(二)程度范畴程度只有两种,缓慢和陡然。
缓慢的/轻微的:gradually/ smoothly/ steadily/ slightly陡然的/大幅度的:dramatically/ sharply/ considerably/ appreciably/ greatly1、人口大幅度攀升:number of population mounted dramatically2、人口轻微下降:number of population decreased slightly3、人口逐渐下降:number of population decreased gradually(三)数据范畴好了,我们现在已经说了两个范畴了,这个两个范畴可以帮你搞定任何线段组的描述、紧接下来我们要讨论的是如何将线段组与数据进行连接、非常简单。
注意如下的介词使用(1) remain steady/ stay stable/ level off/ bottom out/ peak/reach its pe ak/ reach its zenith后面需要使用的是at举例:1、人口在500万上保持平稳:number of population remained steady at 5 million2、人口在800万时到达了顶峰:number of population peaked at 8 million3、下降后,人口在400万保持平稳:after decreasing, number of population bottomed out at 4 million4、上升后,人口在700万保持平稳: after mounting, number of population leveled off at 7 million(2)上升/下降后面使用to(到)和by(了)举例: 1、人口下降到200万: number of population decreased to 2 million2、人口下降了200万: number of population decreased by 2 million3、人口上升到1000万: number of population increased to 10 million4、人口上升了500万: number of population increased by 5 million(3) recover的后面大家需要使用的是from举例:1. 人口在200万时开始复苏:number of population recovered from 2 million(4) fluctuate的后面大家需要连接between …and…举例:人口在2和100亿之间波动:number of population fluctuated between 2 and 10 billion (那俩人是ADAM和EVE) 我们已经搞定了三个范畴了。
剩下的两个范畴,时间与连接,我想大家就不会有很大的困难了吧。
希望大家以后多多练习对于线性图表的描述(一)上升1. 对于上升趋势的描述:a. 可以使用的动词或动词词组:to increaseto go upto riseto growto jumpto leapto soarto shootto pick upb. 可以使用的名词:an increasea growtha jumpa soaran upward trend2. 对于上升到某个位置的描述:a. 1. a. 中的动词+to+具体数据。
b. 1. a. 中的动词+to+the peak of+具体数据。
c. 1. a. 中的动词+reaching the peak of +具体数据。
d. 1. a. 中的动词+reaching + 具体数据。
e. to peak at +具体数据f. to climb to + 具体数据3. 对于上升的程度的描述:a. 1. a. 中的动词+by +具体数据。
b. 1. a. 中的动词+副词。
(见(二)下降1. 对于下降趋势的描述:a. 可以使用的动词或动词词组:to fallto decreaseto go downto slideto collapseto declineto dropb. 可以使用的名词:a collapsea decreasea falla declinea drop2. 对于下降到某个位置的描述:a. 1. a. 中的动词+to+具体数据。
b. 1. a. 中的动词+to+the bottom of+具体数据。
c. 1. a. 中的动词+reaching the bottom of +具体数据。
d. 1. a. 中的动词+reaching + 具体数据。
3. 对于下降程度的描述:a. 1. a. 中的动词+by +具体数据。
b. 1. a. 中的动词+副词。
(见(三)平稳可以使用的动词或动词词组:to hardly changeto have little changeto keep steadyto level offto remain constantto stay the same(四)表示程度的副词:1. 程度较大:considerablydramaticallygreatlymarkedlyobviouslyquicklyrapidlysharplysignificantlysuddenly2. 程度较小:slightlygraduallyslowlysteadily时间的嵌入嵌入时间时所使用的介词和介词词组:infrom……to……between…….and……during……and……at the start of ……by the end of ……over ……at the end of ……throughout ……时间’s + 具体数据(五)上升和下降趋势的组合描述(嵌入了时间和程度之后):1.先上升后下降的句型:...... increased slowly during…… and …… but fell sharply in …….A steady fall in …… during …… and …… followed the sharp increase in …….2. 先下降后上升的句型:…… fell before …… began to make a recovery ………… continue the recovery, climbing to ………… dropped during …… but increased again in ………… fell and then pick up during ………… collapsed before rising to ……at the end of ……3. 起伏波动的句型:…… fluctuated sharply all through ……4. 波动不大的句型:…… hardly changed through the period between ……and ……柱状图形的描述转换为线形图形的描述饼状图形的描述对于百分比进行描述所使用的句型:…… % the …… is/has/have/are ………… accounts for ……% of the total…… takes up ……% in the whole chart(六)趋势的比较1. 表示相似的句型(实例) :Both share prices rose sharply in January.Neither company has made a profit yet.Like X, Y fell in June.X rose just as sharply as Y.2. 表示差异的句型(实例):X fell sharply whereas/while Y remained steady.X fell quickly compared to Y.Unlike Y, X rose by 10%.X rose far more dramatically than Y.3. 表示倍数的句型:the …… doubled/tripled in …… compared with those in ……4. 客观比较的句型:…… is …… in contrast to ……(七)数据的修饰1. 表示不足的词或词组:up tobelowunderalmostnearly2. 表示超过的词或词组:overmore thanjust over3. 表示大约的词:about补充:一. 主章开头图表类型:table; chart; diagram; graph; column chart; pie graph描述:show; describe; illustrate; can be seen from; clear; apparent; reveal; represent 内容:figure; statistic; number; percentage; proportion二. 表示数据一般:have 10%; at 10%;over 10%最高(低)点:peaked; reached a peak/high(point)bottomed out; reached the bottom变化:recover 略有回升;increase; jump; rise/rose; climbdecrease; fall/fell; drop; decline; reducefluctuate 浮动,摇摆不定remained steady/stable; stay the same; little/hardly any /no change变化程度:sudden/suddenly 突然的,意外的rapid/rapidly 迅速的,飞快的,险峻的dramatic/dramatically 戏剧性的,生动的significant/significantly 有意义的,重大的,重要的sharp/sharply 锐利的,明显的,急剧的steep/steeply 急剧升降的steady/steadily 稳固的,坚定不移的gradual/gradually 渐进的,逐渐的slow/slowly 缓慢的,不活跃的slight/slightly轻微的、略微地stable/stably 稳定的表示范围:from…to… between…and… for …to …多长时间直到表示程度:almost adv. 几乎,差不多nearly adv. 几乎,密切地approximately adv. 近似的,大约about adv. 附近,大约,转向,左右,周围just over 刚超过over adv. 结束,越过,从头到尾exactly adv. 正确地,严密地precisely adv. 正好精确地;清晰地比例:20 per cent 20%one in three 1/3one out of every four 1/4三常用词significant changes 图中一些较大变化noticeable trend 明显趋势during the same period 在同一时期grow/grew 增长distribute 分布,区别unequally 不相等地pronounced 明显的average 平均no doubt 无疑地corresponding adj. 相应的,通讯的represent vt. 阐述,表现overall 总体上讲except 除外in the case of adv. 在…的情况下in contrast 相反,大不相同in conclusion adv. 最后,总之in comparison 相比之下inversely adv. 相反地,倒转地in general 通常,大体上,一般而言rang fromexcessive adj. 过多的,过分的,额外lower v.降低,跌落elapse vi.(时间)过去,消逝category n.种类government policy 政府政策market forces 市场规率measure n. 尺寸,方法,措施v.估量,调节forecast n. 先见,预见v. 预测1.有用的词上升:increase rise ascend core surge go up climb mount level up下降: decrease fall drop descend decline reduce lessen level down平稳:stable steady remain/maintain/keep/be the same as/similar to波动:fluctuate fluctuation rise and falls up and down占:occupy take up account for gain而:while however whereas on the other hand actually/in fact相比:by contract on the contrary likewise compared with最高点:the highest the top the summit the peak the most最低点:bottom less least rock bottom平均:mean average趋势:tendancy trend inclination预见:prediction达到顶峰: mount to在***中占***:***gain the percentage of有一个稳定的过程:a stable period can be seen原则:A.不可能写的很好,关键是要很稳地写清楚。