SDSM降尺度模型中文操作手册范本
基于累积分布函数的统计降尺度模型校验方法适用性研究
基于累积分布函数的统计降尺度模型校验方法适用性研究肖薇薇;许晶晶【摘要】为更精确的为区域气候模拟和预估研究提供参考,开展了基于累积分布函数的统计降尺度模型校验,在传统统计降尺度模型的基础上,使用基于累积分布函数的校验方法校正了 SDSM模型预估的A2和B2情景下中国265个站点1961~2099年逐日温度数据,校正后A2情景下,观测值和模拟值R2达到0.9999以上的比例占到85%,达到1的占6%;B2情景下,观测值和模拟值R2达到0.9999以上的比例占到87%,达到1的占19%;斜率值接近1的站点分别增加了57%和51%;截距接近0的站点分别增加了31%和16%。
校正后的模型能更好地预估出未来逐年稳定通过0℃的日期,也即生长季开始的日期。
%Abstrac:t For more accurate regional climate prediction to provide the reference, Carried out statistical downscaling model validation based on the cumulative distribution functions ( CDFs) , on the basis of traditional statistical downscaling model, using the SDSM based on the cumulative distribution functions model calibration predicted the daily temperature at 265 sites under the A2and B 2 scenarios from 1961 to 2099 in China.The result showed that the proportion of observation and simulation value R2 was above 0.9999 accounted for 85%under A2 scenarios after correction, R2 was 1 accounted for 6%;the proportion of observation and simulation value R2 was above 0.9999 accounted for 87%under B2 scenarios after correction, R2 was 1 accounted for 19%;The sites of the slope value close to 1 increased by 57%and 51%respectively;The sites of the intercept is close to 0 increased by 31%and 16%respectively.The model aftercorrection could better predict steadily through the date of the 0℃in future( the ac-curate date of the beginning of the growing season) .【期刊名称】《江西农业学报》【年(卷),期】2016(000)001【总页数】5页(P74-78)【关键词】SDSM;累计分布函数;统计降尺度;校验方法【作者】肖薇薇;许晶晶【作者单位】安康学院,陕西安康 725000; 陕西省安康市汉江水资源保护与利用工程技术研究中心,陕西安康 725000; 中国科学院遗传与发育生物学研究所农业资源研究中心,河北石家庄 050021; 中国科学院大学,北京 100049;江西省农业科学院农业经济与信息研究所,江西南昌 300020【正文语种】中文【中图分类】S03(1.安康学院,陕西安康 725000;2.陕西省安康市汉江水资源保护与利用工程技术研究中心,陕西安康 725000;3.中国科学院遗传与发育生物学研究所农业资源研究中心,河北石家庄 050021;4.中国科学院大学,北京 100049;5.江西省农业科学院农业经济与信息研究所,江西南昌 300020)统计降尺度方法是建立在气象数值统计的基础上,在历史大尺度大气变量和区域气象参数(如地表气温和降水等)之间建立统计模式,利用GCM的预测结果获取区域气候变化的信息[1-2]。
SCALE用户指南说明书

(SCALE用户指南)5.3.5 版本SCALE 团队UGC 工作区,2020 年 1 月 21 日目录1概述2 1.1简介31.1.1什么是 SCALE? (3)1.1.2SCALE-RM 结构 (5)1.2本文档中使用的符号72安装8 2.1准备92.1.1系统环境 (9)2.2编译 SCALE122.2.1下载环境设置 (12)2.2.2编译 (13)2.3编译后处理工具 (net2g)152.3.1编译 netcdf2grads (net2g) (15)3SCALE-RM 教程16 3.1操作检查和基本使用173.1.1简介 (17)3.1.2如何执行模型 (17)3.1.3后处理与绘图 (19)3.1.4后续研究指南 (20)3.2真实大气试验223.2.1概述 (22)3.2.2准备输入数据(边界数据) (23)3.2.3准备试验集 (25)3.2.4创建地形数据:pp (26)3.2.5创建初始和边界数据:init (27)3.2.6执行模拟:run (29)3.2.7快速查看模拟结果:net2g (33)第 1 部分概述第 1.1 章简介此用户手册面向初次使用区域气候/气象模型 SCALE-RM 的用户。
本手册基于 5.3.5 版本的数值程序库。
尽管当前版本的 SCALE 包含区域模型 SCALE-RM 和全球模型 SCALE- Gm,此版本用户手册仅阐述如何使用 SCALE-RM。
下一个或更后面的发行版本将阐述 SCALE-GM。
本文档的结构如下:第1 部分提供 SCALE 的概述,第2部分阐述如何安装 SCALE-RM 以及有何系统要求。
而第3 部分通过一系列教程阐述 SCALE-RM 的基本使用;第3.1 和第3.2章分别提供理想试验教程和真实大气试验。
建议 SCALE-RM 初学者仔细阅读这些章节。
有关如何更改模型配置、数据格式以及可用功能和工具的详细信息,请参考《SCALE 用户指南》英文版(EN 版本)的第 4 和第 5 部分。
两种统计降尺度方法在秦岭山地的适用性
两种统计降尺度方法在秦岭山地的适用性Liu Jiayi;Deng Lijiao;Fu Guobin;Bai Hongying;Wang Jun【摘要】基于ASD(automated statistical downscaling)统计降尺度模型提供的多元线性回归和岭回归两种统计降尺度方法,采用RCP4.5 (representative concentration pathways 4.5)和RCP8.5情景下全球气候模式MPI-ESM-LR输出的预报因子数据、NCEP/NCAR再分析数据和秦岭山地周边10个气象站观测数据,评估两种统计降尺度方法在秦岭山地的适用性及预估秦岭山地未来3个时期(2006-2040年、2041-2070年和2071-2100年)的平均气温和降水.结果表明:率定期和验证期内,两种统计降尺度方法均可以较好地模拟研究区域的平均气温和降水的变化特征,且多元线性回归的模拟效果优于岭回归.在未来气候情景下,两种统计降尺度方法预估的研究区域平均气温均呈明显上升趋势,气温增幅随辐射强迫增加而增大.降水方面,21世纪未来3个时期降水均呈不明显减少趋势,但季节分配发生变化.综合考虑两种统计降尺度方法在秦岭山地对平均气温和降水的模拟效果和情景预估结果,认为多元线性回归降尺度方法更适用于秦岭山地气候变化的降尺度预估研究.【期刊名称】《应用气象学报》【年(卷),期】2018(029)006【总页数】11页(P737-747)【关键词】气候变化;未来情景;统计降尺度;秦岭山地【作者】Liu Jiayi;Deng Lijiao;Fu Guobin;Bai Hongying;Wang Jun【作者单位】【正文语种】中文引言秦岭山地横贯我国中西部,是南北自然环境的天然分界线,有着古老的地质演化历史和复杂的自然环境。
秦岭山地不仅源源不断为关中山地提供充足的水源,还是南水北调中线工程的主要水源地,同时也对全球气候变化较为敏感[1]。
滁州市近50年冬小麦作物需水量变化特征 - 20160511

*滁州市冬小麦生育期作物需水量和降水变化特征金华星1,胡姗姗1,龚年祖1,张鑫童1(1滁州市气象局,安徽滁州239000)摘要:基于1961~2013年滁州市气象数据,运用集合经验模态分解和交叉小波分析,探究了冬小麦生育期需水量和灌溉需水量的变化特征。
结果表明:1961~2013年滁州市冬小麦生育期需水量和灌溉需水量均呈增加趋势(增势分别为:2.80 mm/a和1.48 mm/a);年代变化上,冬小麦生育期需水量逐渐增大,灌溉需水量大致呈现先减少后增加的变化特征。
冬小麦生育期作物需水量和灌溉需水量均呈现明显的多尺度变化特征,表现为多尺度的周期变化特征和趋势变化特征。
作物需水量存在2.65a、6.63a、13.25a和26.50a的周期,灌溉需水量存在3.11a、5.89a、10.60a和26.5a的周期。
研究时段,作物需水量和灌溉需水量与潜在蒸散量呈同相位分布,与降水量呈显著的反相位。
关键词:滁州市;作物需水量;灌溉蓄水量;冬小麦生育期;多尺度变化Variation of water requirement and precipitation in wheat growth stagesfrom1961 to 2013JinHuaxing, Hu Shanshan, GongNianzu, Zhang Xintong(Meteorological Bureau of Chuzhou City,Chuzhou Anhui 239000)Abstract:Based on the data from Meteorological Bureau of Chuzhou City and using ensemble empirical mode decomposition and cross wavelet analysis, the crop and irrigation water requirement of wheat growth stages were analyzed. The results showed that the crop and irrigation water requirement experienced increasing trend with the rate of 2.80 mm/aand1.48 mm/afrom 1961 to 2013, respectively. For decadal change, the crop water requirement presented gradually increasing trend, while the irrigation water requirement exhibited decreasing to increasing trend. Thecrop water requirement has the periodic of 2.65a,6.63a,13.25aand 26.50a, the irrigation water requirement has the periodic of 3.11a、5.89a、10.60aand26.5a, respectively. The crop and irrigation water requirement has in-phase relationship with evapotranspiration and significant anti-phase with precipitation.Key words:Chouzhou; cropwater requirement; irrigation water requirement; wheat growth stages; multiscale variation作物需水量是作物全生育期消耗于自身蒸腾和棵间土壤蒸发的水量总和,它是灌溉决策和水资源规划的重要基础[1]。
GMDSS实操训练手册及步骤
GMDSS模拟软件操作指南一.启动电脑,进入WINDS XP二.点击GMDSS模拟器图标三.等待软件界面上所有设备转为红色四.点击所要操作的设备,出现该设备的操作界面五.如何是彩色的界面,用鼠标操作;如果是黑白界面,用键盘操作。
六.操作时注意不能多个设备同时启动。
GMDSS智能评估系统考生端操作说明1.如何登陆系统:输入身份证号可进行考试登陆,登陆前,可点击录音按钮,对着麦克风说几句测试的话,点击停止按钮,再点击播放按钮,看看耳麦中是否有刚录到的语音,如果没有,请向监考官报告2.如何答题:看完题目后,点击“开始操作”按钮,开始进入实际答题,也可以点击“下一题”按钮,浏览整份试卷的题目,如题目未显示出来,可以点击“刷新”按钮,重新获取题目,请注意,屏幕的右上角有显示考试的剩余时间,大家操作过程中一定要注意这个时间3.如何答题:(1)进入实际操作后,当完成本题所有操作步骤后,请点击“结束操作”按钮,完成本题的操作(2)当该题操作完成后,题目的颜色将显示为绿色,如果想修改该题的操作步骤,请点击“重新操作”按钮,将重新进入到答题界面,考生可以重新将该题操作一遍(请记住,是删除所有的操作步骤,而不是某几步)4.如何回答口述题:考试的第四题是口述题,点击“开始操作”按钮,即可进入口述题回答界面(1).进入口述题界面后,首先点击“录音”按钮进行录音,确定回答完毕后,点击“停止”按钮,为了确保录音有效,请点击“播放”按钮进行聆听刚刚所录得语音答案(2).当确定录音成功后,请点击“发送语音答案”按钮,将回答的录音文件发送到服务器端,显示“发送成功”文字后,才表示答案语音已经发送成功,否则,请举手与监考官联系(3).当“第二步”显示“发送成功”后,点击“试听已经发送的语音”,在下方出现的播放器中,点击播放按钮,如能正常听到所回答的语音内容,则表示提交正确,否则请举手与监考官联系(4).当“第三步”操作完成并能听到正确语音后,点击“结束操作”按钮,完成本题回答,出现以下页面,如果确定所有题目回答完毕后,点击“结束考试”按钮,完成本场考试操作。
基于SWAT模型的气候变化条件下诺敏河流域径流变化研究

第30卷第6期2023年12月水土保持研究R e s e a r c ho f S o i l a n d W a t e rC o n s e r v a t i o nV o l .30,N o .6D e c .,2023收稿日期:2022-10-08 修回日期:2022-11-01资助项目:水利部公益性行业科研专项经费 松花江流域粮食生态安全水供求若干关键技术 (201501013) 第一作者:汪飞(1995 ),男,江苏宜兴人,硕士,研究方向为气候变化对水文水资源的影响㊂E -m a i l :1239042167@q q .c o m 通信作者:洪林(1963 ),女,安徽庐江县人,教授,研究方向为农田水利水环境㊂E -m a i l :l h o n g@w h u .c n h t t p :ʊs t b c y j .p a p e r o n c e .o r gD O I :10.13869/j.c n k i .r s w c .2023.06.035.汪飞,洪林,马田遥,等.基于S WA T 模型的气候变化条件下诺敏河流域径流变化研究[J ].水土保持研究,2023,30(6):67-77.W a n g F e i ,H o n g L i n ,M aT i a n y a o ,e t a l .S t u d y o nR u n o f fC h a n g eo fN u o m i nR i v e rB a s i n U n d e rC l i m a t eC h a n geC o n d i t i o n sB a s e do nS WA T M o d e l [J ].R e s e a r c ho f S o i l a n d W a t e rC o n s e r v a t i o n ,2023,30(6):67-77.基于S W A T 模型的气候变化条件下诺敏河流域径流变化研究汪飞1,2,洪林1,马田遥3,吐尼亚孜1,熊继东1(1.武汉大学水利水电学院,武汉430072;2.余姚市水利局,浙江宁波315400;3.宁波兴晟新能源科技有限公司,浙江宁波315400)摘 要:[目的]了解气候变化条件下诺敏河流域径流变化特征,为诺敏河流域水文水资源综合规划提供科学支撑㊂[方法]通过S D S M 统计降尺度模型和大气环流模式,生成未来不同情景模式下的气温和降水数据,运用S WA T 模型模拟计算得到了不同气候情景模式下的径流数据㊂[结果]从趋势上看:3种情景模式下径流都保持增长趋势,R C P 2.6模式下增幅最少,R C P 4.5模式其次,R C P 8.5模式下径流量增幅最大㊂从突变上看:R C P 2.6模式下,径流在未来依旧不会存在突变点;R C P 4.5模式下,径流在未来存在很大可能形成突变;而在R C P 8.5模式下,年径流将在2067年附近发生突变,突变后的径流量表现为显著的增长㊂从周期上看:R C P 2.6模式下,径流变化周期主要由56a 的主周期控制;R C P 4.5模式下,年径流变化周期主要由56a 和44a 的控制;R C P 8.5模式下周期特征和R C P 4.5模式相似,相比之下,56a 时间尺度下能量密度更为密集,该周期的控制效果得到进一步增强㊂[结论]不同气候情景模式下诺敏河流域径流差异较大,未来制定水文水资源综合规划应考虑不同气候条件的影响㊂关键词:气候变化;S WA T 模型;径流特征;诺敏河流域中图分类号:P 333;P 467 文献标识码:A 文章编号:1005-3409(2023)06-0067-11S t u d y o nR u n o f fC h a n ge o fN u o m i nR i v e rB a s i nU n d e rC l i m a t e C h a n geC o n d i t i o n sB a s e do nS W A T M o d e l W a n g F e i 1,2,H o n g L i n 1,M aT i a n y a o 3,T u n i y a z i 1,X i o n g J i d o n g1(1.S t a t eK e y L a b o r a t o r y o f W a t e rR e s o u r c e s a n d H y d r o p o w e rE n g i n e e r i n g Sc i e n c e ,W u h a n U n i v e r s i t y ,W u h a n 430072,C h i n a ;2.W a t e rC o n s e r v a n c y B u r e a uo f Y u y a o ,N i n g b o ,Z h e j i a n g 315400;C h i n a .3.N i n g b oX i n g s h e n g N e w E n e r g y T e c h n o l o g y C o .,L td .,N i n g b o ,Z he j i a n g 315400,C h i n a )A b s t r a c t :[O b j e c t i v e ]T h ea i m o f t h es t u d y ist ou n d e r s t a n dt h er u n o f fv a r i a t i o n p a t t e r no fN u o m i n R i v e r B a s i nu n d e r c l i m a t e c h a n g ea n d p r o v i d es c i e n t i f i c s u p p o r t f o r t h ec o m p r e h e n s i v e p l a n n i n g o fh y d r o l o g y a n d w a t e r r e s o u r c e s i nN u o m i nR i v e rB a s i n .[M e t h o d s ]T h e t e m p e r a t u r ea n d p r e c i pi t a t i o nd a t aw e r e g e n e r a t e d u n d e r d i f f e r e n t s c e n a r i om o d e s i nt h e f u t u r e t h r o u g hs t a t i s t i c a l d o w n s c a l i n g m o d e l ,a n dS WA T m o d e lw a s a p p l i e d t o s i m u l a t e t h e c o r r e s p o n d i n gr u n o f f d a t a u n d e r d i f f e r e n t c l i m a t e s c e n a r i om o d e s .[R e s u l t s ]F r o mt h e p e r s p e c t i v e o f t r e n d ,t h e r u n o f fm a i n t a i n s a n i n c r e a s i n g t r e n d ,w i t h a r e l a t i v e l y sm a l l i n c r e a s e u n d e rR C P 2.6m o d e ,f o l l o w e db y R C P 4.5m o d e ,a n dt h e l a r g e s t i n c r e a s eu n d e rR C P 8.5m o d e .F r o mt h e p e r s p e c t i v eo f m u t a t i o n ,t h e r ew i l l s t i l l b e n om u t a t i o n p o i n t i n r u n o f f u n d e rR C P 2.6m o d e ,a n d t h e r ew i l l b e a g r e a t po s s i -b i l i t y o f s u d d e nc h a n ge i nr u n of fu n d e rR C P 4.5m o d e ,w h i l eu n d e rR C P 8.5m o d e ,t h ea n n u a l r u n o f fw i l l s u d d e n l y c h a ng e a r o u n d 2067.F r o mth e p e r s p e c ti v e o f c y c l e ,u n d e rR C P 2.6m o d e ,t h e r u n o f f c h a n g e c yc l e i sm a i n l y c o n t r o l l e db y t h e m a i nc y c l eo f56y e a r s.U n d e rR C P4.5m o d e,t h ea n n u a l r u n o f fc h a n g ec y c l e i s m a i n l y c o n t r o l l e db y56y e a r s a n d44y e a r s.T h e c y c l e c h a r a c t e r i s t i c s o fR C P8.5m o d e a r e s i m i l a r t o t h o s e o f R C P4.5m o d e,b u t i n c o n t r a s t,t h e e n e r g y d e n s i t y i sm o r e i n t e n s i v e u n d e r t h e56-y e a r s c a l e,a n d t h e c o n t r o l e f f e c t o f t h i s c y c l e i s f u r t h e re n h a n c e d.[C o n c l u s i o n]T h e r ea r es i g n i f i c a n td i f f e r e n c e s i nr u n o f f i n N u o m i n R i v e rB a s i nu n d e r d i f f e r e n t c l i m a t e s c e n a r i o m o d e s,a n d f u t u r e c o m p r e h e n s i v e p l a n n i n g o fh y d r o l o g i c a l a n d w a t e r r e s o u r c e s s h o u l d c o n s i d e r t h e i m p a c t o f d i f f e r e n t c l i m a t e c o n d i t i o n s.K e y w o r d s:c l i m a t e c h a n g e;S WA T m o d e l;r u n o f f c h a r a c t e r i s t i c s;N u o m i nR i v e rB a s i n近年来,气候变化及其影响引起了越来越多国内外专家学者的关注和研究[1-2]㊂I P C C第五次研究报告指出[3],地表温度因受温室气体浓度增加而持续升高,降水量㊁降水强度和降水时空分布也将发生改变,从而导致水资源分布及循环发生相应变化㊂气候变化提升了极端水文事件的发生概率[4],也会对区域径流的时空特性产生不同效应[5]㊂诺敏河流域位于我国东北部地区,近年来在以气候变化为主的环境变化因素影响下,流域内水资源趋向不足,水土资源的不协调也逐渐突出㊂因此,研究气候变化对诺敏河流域径流的影响,不仅能深入了解气候变化条件下径流的演变规律,也可为流域水资源的综合管理提供参考依据㊂耦合全球气候模式与水文模型是研究气候变化对径流影响的主要方法之一[5-7]㊂刘春蓁等[8]采用4种G C M情景模式研究了我国7大流域径流和蒸发的变化可能性,并得出4种模式下松花江流域径流趋于增加;郭生练等[9]选用B C C-C S M1-1气候模式及R C P4.5排放情景,预测了长江流域气温㊁降水以及径流的变化情况;江介伦等[10]结合G W L F水文模型分析了5种大气环流模式下未来气候对径流的影响,发现丰水期水量上升而枯水期水量减小㊂以上研究虽然对径流受气候变化的影响进行了一些探究,着重得到未来气候变化条件下径流量的变化范围,但并未探究径流的突变㊁周期等特征㊂本文选取诺敏河流域作为研究对象,采用S D S M统计降尺度方法,借助大气环流模式预测流域未来的气候变化,并通过分布式水文模型S WA T模型模拟在未来气候情景下径流的相应特征㊂1研究区概况诺敏河流域位于大兴安岭东南山麓,在121ʎ45' 124ʎ35'E,48ʎ00' 50ʎ30'N范围内,流域面积25098 k m2㊂流域平均海拔1102m,最高处可达1300m,河口高程最低约为170m㊂流域春季干旱多风,夏季热而湿,秋季较短,冬季寒冷漫长,历年最高气温曾高达40.1ħ,最低气温达到-35.4ħ㊂诺敏河流域降水年内分配不均,雨量多集中在7 8月㊂流域总出口水文测站为小二沟站,控制面积占流域总面积的95%以上㊂2研究方法2.1趋势分析趋势特征通常使用线性回归㊁斯皮尔曼分析法[11]㊁M-K检验法等[12]㊂本文以线性回归为主要的研究方式,并将突变分析时使用的M-K法作为补充㊂该方法主要反映自变量和因变量的线性相关关系,公式如下:Y=a+b X(1)式中:X为自变量,此处表示年份;Y为因变量,在本文中表示研究对象,如气温㊁降水㊁径流;a,b分别为回归系数,其值通过最小二乘法求得㊂在趋势分析中,需要对研究对象和时间的相关性进行显著性检验,此处采用F检验法,统计量F的计算公式为:F=(n-2)S2RS2E(2)式中:S2R=ðni=1(ɵy i-y)2指回归平方和;S2E=ðn i=1(y i-ɵy i)2指残差平方和㊂对于给定的显著性水平α(本文选取为0.05),其显著性临界值为Fα(1,n-2)㊂对于计算的统计量F:如果FȡFα,那么回归方程所表现的相关性是显著的,即线性回归方程能够比较可信地反映序列的趋势变化;反之,则认为线性方程不显著㊂2.2突变分析突变分析采用在水文㊁气象等长时间序列的突变识别中应用较为广泛的M-K突变检验法[13-16]㊂对于样本长度为n的长序列X,构造的M-K检验秩序列如公式(3) (4)所示:S k=ðki=1r i(k=2,3, ,n)(3) r i=1x i>x j0e l s e{(j=1,2, ,i)(4)由于时间序列相互独立,定义新的统计量:86水土保持研究第30卷U F k=S k-E(S k)v a r(S k)(k=2,3, ,n)(5)式中:E(S k)为累计数S k的均值;v a r(S k)为S k的方差㊂其中,U F1=0,U F k统计量服从标准正态分布㊂查阅特征值表来得到给定的显著性水平α(本文采用α=0.05)所对应的临界值U Fα,如果统计量大于临界值,则表明该序列存在着明显的增加㊁减少的趋势,从而判断时间序列是否存在趋势变化特征,作为趋势分析的补充㊂E(S k),v a r(S k)的计算公式如下:E(S k)=n(n+1)4(6)v a r(S k)=n(n-1)(2n+5)72(7)按照时间序列逆序编排,用上述的构造过程构造新的统计序列U B k㊂绘制U B k和U B k两条曲线图,若U F k和U B k相交,且交点处的统计值在检验的上㊁下置信度区间内,可认为交点所对应的节点可能就是突变发生的时间点㊂2.3周期分析周期特征通常采用M o r l e t小波分析法,M o r l e t 小波可以凸显长序列存在的周期特征,同时能够定性地评估序列未来的变化趋势㊂其基本原理是由一组小波函数基来近似地表示所研究的特定函数,通过小波变化计算得到小波系数,再由小波系数的实部㊁模值等系列数值来分析时间序列中的变化特征㊂(1)小波函数㊂小波分析中需要构建震荡变化且最终能快速衰减到0的小波函数Ψ(t)ɪL2(R),该函数需满足:ʏ+¥-¥Ψ(t)d t=0(8)式中:Ψ(t)ɪL2(R)为基小波函数,该函数经由尺度伸缩及时间轴平移形成子小波函数系:Ψa,b(t)=a-0.5Ψ(t-b a)(9)式中:Ψa,b(t)为子小波;a为尺度因子,且aʂ0,指小波周期的长度;b为平移因子,指时间轴上的平移㊂(2)小波变换㊂在小波变换中,分别在时间和频率两个尺度上分析一维序列的信息㊂对于已知的能量有限信号f(t)ɪL2(R),子小波Ψa,b(t)的连续小波变换为:W f(a,b)=a-0.5ʏR f(t)Ψ(t-b a)d t(10)式中:W f(a,b)为小波变换系数;f(t)为平方可积函数㊂由于获得的数据是离散的,假定函数f(kΔt), (k=1,2, ,N;Δt为取样间隔),那么离散的小波变换形式为:W f(a,b)=a-0.5Δtðn k=1f(kΔt)Ψ(kΔt-ba)(11)式中:Ψ(x-b a)为Ψ(x-b a)的复共轭函数㊂由公式(11)可知,小波分析借由增减伸缩因子来获得序列的低频和高频信息,进而得到不同时间㊁空间尺度层面的局部变化特征㊂(3)小波方差㊂小波方差是将小波系数值取平方,并在整个时间轴领域内积分,如公式(12)所示:v a r(a)=ʏ+¥-¥W f(a,b)2d b(12)在不同的时间尺度下绘制小波方差变化过程,形成小波方差图,它能够体现信号波动过程中的能量汇集情况,从而凸显出序列中扰动剧烈的信息,分析判断主周期㊂3S W A T模型构建S WA T模型是由美国农业研究所开发的适用于流域尺度的半分布式水文模型[17],包含气候㊁水文㊁侵蚀㊁土地覆盖变化㊁管理措施㊁主河道变化㊁营养物质和水体运动等多个部分[18-21],能够模拟流域内多种不同的水文循环过程[22]㊂模型具有很好的适用性,可基于G I S提供的空间数据,模拟长时间段内水文过程,被广泛用于不同区域变化环境下的流域水文特征研究[23]㊂3.1数据资料本文选取诺敏河流域的小二沟站作为水文代表站点,选取流域内的8个气象站点作为研究对象㊂S WA T模型所需基础资料及来源见表1,各站点分布如图1所示㊂表1诺敏河流域基础数据信息T a b l e1B a s i c d a t a i n f o r m a t i o no fN o m i nR i v e rB a s i n 数据类型数据源数据时间序列长度D EM中国科学院地理空间数据云2015年土地利用中国科学院资源环境科学数据中心2015年土壤类型F A O HW S D土壤属性F A O HW S D气象数据国家气象科学数据中心1961 2015年水文数据各年的水文年鉴2006 2015年3.2基础数据库构建3.2.1土壤数据库本文使用F A O土壤数据库直接建立用户数据库[16]㊂模型所需的土壤物理属性参数按获取方式分为两部分:第1部分可直接从F A O96第6期汪飞等:基于S WA T模型的气候变化条件下诺敏河流域径流变化研究土壤数据库中查取;其余数据通过S P AW软件和统计分析方法计算得出[24]㊂3.2.2土地利用数据库将S WA T模型中定义使用的土地利用分布类型按照植被覆盖特征进行二级分类㊂对于不同的土地利用类型,考虑到属性表中有十几种类型,且其中有些类型可以合并为一种,因此先将它们进行重新分类,然后再得到能够直接使用的土地利用数据㊂图1诺敏河流域气象㊁水文站点分布F i g.1D i s t r i b u t i o no fm e t e o r o l o g i c a l a n dh y d r o l o g i c a ls t a t i o n s i nN o m i nR i v e rB a s i n3.2.3气象数据库按照模型所需的格式要求,对各站点日值气象数据进行整理,并计算特征值,将结果录入S WA T模型的基础数据库中㊂3.2.4空间离散数据库 S W A T模型基于流域D E M 提取河网水系并进行子流域划分,再根据不同的土地使用类型㊁土壤类型和坡度,将具有相同类型的单元进行归集,将诺敏河流域划分成273个水文响应单元㊂3.3模型参数率定与验证根据实测径流数据,选取小二沟站作为研究对象,从日尺度层面对小二沟径流进行率定和验证㊂其中,将2006 2010年作为率定期,并设置2006年为预热期;将2011 2015年作为验证期㊂选用决定系数R2以及纳什系数E n s来对S WA T 模型的拟合效果进行评价,其计算公式为公式(13) (14)㊂模型误差评价参考表见表2㊂径流拟合曲线见图2 3㊂R2=ðn i=1(Q m,i-Q m,a v g)(Q s,i-Q s,a v g) 2ðn i=1(Q m,i-Q m,a v g)2ðn i=1(Q s,i-Q s,a v g)2(13)E n s=1-ðn i=1(Q m-Q p)2ðn i=1(Q m-Q a)(14)表2模型误差评价T a b l e2M o d e l e r r o r e v a l u a t i o n可靠性R2E n s很好0.81~10.76~1良好0.71~0.80.66~0.75一般0.51~0.70.51~0.65不满足<=0.5<=0.5从径流拟合曲线来看,径流模拟值和实测值趋势一致,两条曲线较为贴合㊂率定期和验证期的R2分别为0.76,0.73,E n s分别为0.72,0.70,两者的模拟效果都表现为良好㊂因此,径流的模拟能够满足模型所需的精度要求,故可以选用调整后的敏感参数值来进行后续的径流模拟,调整后的敏感参数见表3㊂图2小二沟站率定期(2006-2010年)年日径流拟合曲线F i g.2F i t t i n g c u r v e o f a n n u a l d a i l y r u n o f f a tX i a o e r g o u s t a t i o n f r o m2006t o20104未来情景模式下径流变化规律分析对诺敏河流域而言,气温和降水是影响径流变化的最直接㊁最重要的气候因素㊂本文选择较常用㊁在我国东北地区适应性强的C a n E S M5大气环流模式,采用S D S M统计降尺度对不同排放情景模式进行统07水土保持研究第30卷计降尺度,获得诺敏河流域未来几十年的气象要素序列值,并将其输入率定后的S WA T 模型,模拟研究区域径流对气候变化的响应,并分析径流的趋势㊁突变及周期变化特征㊂4.1 气候情景设定为模拟评估未来气候变化,I P C C 第五次评估报告采用C M I P5中的气候模式,预设了温室气体排放浓度情景(R C P s)㊂其中:R C P 2.6情景假设全球能源使用发生改变,温室气体排放将显著减少;R C P 4.5情景假设可再生能源和碳捕捉系统广泛使用㊁森林储碳量增加,温室气体排放量也将显著减少;R C P 8.5情景假设无政策干预,全球人口大幅增加㊁化石燃料消耗变大,温室气体排放和浓度不断增加㊂图3 小二沟站验证期(2011-2015年)年日径流拟合曲线F i g .3 F i t t i n g c u r v e o f a n n u a l d a i l y r u n o f f a tX i a o e r go u s t a t i o n f r o m2011t o 2015表3 S W A T 模型敏感参数率定结果T a b l e 3 S e n s i t i v i t ypa r a m e t e r c a l ib r a t i o n r e s u l t s o f S W A Tm o d e l 参数含义参数值r __C N 2S C S 径流曲线数0.600v __A L P HA _B F 基流a 因子0.278v __GW _D E L A Y 地下水延迟时间96.375v __GWQMN 浅层含水层发生回归流的水位阈值(mm )0.007v __GW _R E V A P 地下水再蒸发系数0.246v __E S C O土壤蒸发补偿系数0.428v __C H _N 2主河道曼宁系数0.118v __C H _K 2支流冲积层有效渗透系数68.433r __S O L _AW C (1)第1层土壤可用含水量0.461r __S O L _K (1)第1层土壤饱和渗透系数0.450v __S F TM P 降雪温度,为降雪转化为雪或冻雨的平均温度(ħ)-3.515注:r __表示参数值进行相对变化或乘以(1+给定值);v__表示将参数替代为给定值㊂ 本文使用C M I P5中C G C M s 模式的数据集C a n E S M 5㊂该数据集包含了全球的历史数据集和全球2006 2100年R C P 2.6,R C P 4.5和R C P 8.5三种情景下的基础数据㊂4.2 气候要素分析将大气环流模式中的未来数据统计降尺度,生成3种排放情景模式下的数据㊂对2021 2100年进行分析,设定2021 2060年为21世纪中期,2061 2100年为21世纪后期㊂4.2.1 气温变化趋势分析 绘制3种模式下气温的趋势变化图并统计其特征值(图4㊁表4),3种情景模式下年均气温㊁年平均最高气温和年平均最低气温都保持增长的趋势㊂对比21世纪中㊁后期3种气温变化趋势可发现,随着时间的持续,3种排放导致的气候变暖结果差距将越来越大,尤其对于R C P 8.5模式,整个21世纪都保持很高的增长率,增幅几乎都在0.65ħ/10a 以上㊂对于R C P 2.6和R C P 4.5模式,气候变暖得到了有效控制,虽也呈现一定的增幅,但增幅明显小于R C P 8.5模式,增长速率仅为R C P 8.5模式下的1/4~1/2㊂两者相比较来看,对于21世纪中17第6期 汪飞等:基于S WA T 模型的气候变化条件下诺敏河流域径流变化研究期,R C P 2.6模式下多年平均气温稍高于R C P 4.5模式,但相差不大;而对于21世纪后期,R C P 2.6模式对气候变暖效果的控制要好于R C P 4.5模式㊂4.2.2 降水变化趋势分析 绘制3种模式下年降水的趋势图并统计特征值㊂由图5㊁表5可知,3种情景模式下年降水都保持增长的趋势㊂其中,R C P 8.5模式下降水的增幅最大,在21世纪后期增幅已经超过20mm /10a ㊂对于R C P 4.5模式,在21世纪中期,年降水的增幅为6.05mm /10a ,到了21世纪后期,降水增幅增大至12mm /10a ㊂R C P 2.6模式下,降水增幅相对较小,且21世纪后期与中期相近,增幅相比另两种情景模式有所减缓㊂图4 诺敏河流域21世纪中期和后期3种排放情景模式气温变化趋势F i g .4 T e m p e r a t u r e c h a n ge t r e n d s of t h r e e e m i s s i o n s c e n a r i om o d e s i nN o m i nR i v e rB a s i n i n t h e m i d 21s t c e n t u r y a n d l a t e 21s t c e n t u r y 表4 诺敏河流域3种排放情景模式气温特征值T a b l e 4 T e m pe r a t u r e c h a r a c t e r i s t i c v a l u e s of t h r e e e m i s s i o n s c e n a r i om o d e s i nN o m i nR i v e rB a s i n 气温类型时间段情景模式平均值/ħ最高值/ħ最低值/ħ线性趋势/(ħ/10a)21世纪中期R C P 2.61.813.590.180.19R C P 4.51.453.58-0.100.38年平均气温R C P 8.52.294.83-0.130.6421世纪后期R C P 2.61.863.260.350.24R C P 4.52.604.711.160.15R C P 8.55.107.343.170.7621世纪中期R C P 2.610.1611.808.510.20R C P 4.510.0312.058.500.35年平均最高气温R C P 8.510.6313.247.940.6721世纪后期R C P 2.610.1811.768.850.23R C P 4.511.1813.059.790.15R C P 8.513.5015.6711.380.7521世纪中期R C P 2.6-6.08-4.12-7.810.21R C P 4.5-5.71-4.16-6.890.31年平均最低气温R C P 8.5-5.63-3.35-7.380.5521世纪后期R C P 2.6-6.01-4.97-7.560.19R C P 4.5-4.91-3.46-5.970.06R C P 8.5-3.18-0.77-4.890.6727 水土保持研究 第30卷4.3 径流变化特征分析4.3.1 径流趋势特征分析 绘制3种排放情景模式下年径流的趋势变化图并统计特征值(图6㊁表6)㊂结果显示:3种情景模式下径流都保持增长趋势㊂图5 诺敏河流域21世纪中期和后期3种排放情景模式降水变化趋势F i g .5 P r e c i p i t a t i o n c h a n ge t r e n d s of t h r e e e m i s s i o n s c e n a r i om o d e s i nN o m i nR i v e rB a s i n i n t h e m i d 21s t c e n t u r y a n d l a t e 21s t c e n t u r y表5 诺敏河流域3种排放情景模式年降水特征值T a b l e 5 A n n u a l p r e c i p i t a t i o n c h a r a c t e r i s t i c v a l u e s o f t h r e e e m i s s i o n s c e n a r i om o d e s i nN o m i nR i v e rB a s i n 时间段情景模式平均值/mm 最大值/mm 最小值/mm 线性趋势/(mm /10a)21世纪中期R C P 2.6472.93645.87342.654.57R C P 4.5492.82647.37388.956.05R C P 8.5503.20725.09379.398.8121世纪后期R C P 2.6485.37584.72380.9566.63R C P 4.5518.65651.69361.6112.37R C P 8.5557.74771.62434.3020.96 其中,R C P 8.5模式下径流增幅最大,在21世纪中期保持1.15亿m 3/10a 的增速,后期以1.72亿m 3/10a 增长,因此到21世纪后期,其多年平均年径流量也最大,达到40.23亿m 3㊂R C P 4.5模式其次,在21世纪中㊁后期分别以每10年0.49亿m 3,0.96亿m 3的增速增长,到21世纪后期多年平均径量达到35.34亿m 3㊂R C P 2.6模式下径流量增长相对较少,在21世纪中期和后期增长量仅为每10年0.06亿m 3,0.27亿m 3㊂径流的增长特征与流域未来的降雨和气温关系密切,一方面,降水增加对径流有着最直接的影响,径流随着降水的增加而增加;另一方面可以看到,R C P 8.5模式下,21世纪后期降雨增加值非常大,为21世纪中期的3倍,而21世纪后期的径流增幅仅为中期的1.5倍,同样地,R C P 4.5模式和R C P 2.6模式下,降雨增幅分别为2,1.5倍,而径流增幅则分别为2倍和4倍㊂这是由于气温升高引起蒸散发增加,进而抑制了降水促进径流增加的作用㊂图6 诺敏河流域21世纪中期和后期3种排放情景模式下径流变化趋势F i g.6 R u n o f f v a r i a t i o n t r e n do f t h r e e e m i s s i o n s c e n a r i om o d e s i nN o m i nR i v e rB a s i n i n t h e m i d 21s t c e n t u r y a n d l a t e 21s t c e n t u r y4.3.2 径流突变特征分析 绘制3种情景模式下2021 2100年诺敏河流域径流的突变检验曲线(图7 9)㊂结果显示:随着气候变化,3种情景模式的径流突变特征产生了很大的差别㊂37第6期 汪飞等:基于S WA T 模型的气候变化条件下诺敏河流域径流变化研究表6 诺敏河流域3种排放情景模式下年径流特征值T a b l e 6 A n n u a l r u n o f f c h a r a c t e r i s t i c v a l u e s u n d e r t h r e e e m i s s i o n s c e n a r i om o d e s i nN o m i nR i v e rB a s i n时间段情景模式平均值/亿m3最大值/亿m3最小值/亿m 3线性趋势/(亿m 3/10a)21世纪中期R C P 2.632.3050.4921.840.06R C P 4.532.7946.1124.400.49R C P 8.533.6351.2021.861.1521世纪后期R C P 2.633.4441.0123.250.27R C P 4.535.3444.1023.050.96R C P 8.540.2352.6529.451.72对于R C P 2.6模式,正反向序列曲线存在多个交点,且所处的区间位于上下置信区间内,但从年径流的趋势变化来看,序列的正向曲线均未能够突破上下置信度线㊂结合P e t t i t t 检验曲线看,该曲线并不存在明显的最低点㊂因此可认为在R C P 2.6模式下诺敏河流域年径流在未来不会突变㊂对于R C P 4.5模式,正反向序列曲线也存在多个交点,且所处的区间位于上下置信区间内,年径流序列的正向曲线突破了上置信度线,但并不显著㊂结合P e t t i t t 检验曲线,该曲线存在一个明显的最低点㊂因此可认为在R C P 4.5模式下诺敏河流域年径流在未来存在很大的可能形成突变㊂对于R C P 8.5模式,正反向序列曲线存在1个交点,且交点位于上下置信区间内,年径流序列的正向曲线明显地突破了置信度线,交点位于2067年附近㊂结合P e t t i t t 检验曲线看,该曲线存在一个明显的最低点,对应的时间为2067年㊂因此可认为在R C P 8.5模式下诺敏河流域年径流将在2067年附近发生突变,突变后的径流表现为显著的增加㊂径流的突变特征与趋势特征也表现出了较好的一致性㊂图7 诺敏河流域R C P 2.6模式下径流M -K 法突变识别㊁P e t t i t t 法突变识别F i g.7 R u n o f fM -Ka n dP e t t i t tm e t h o dm u t a t i o n i d e n t i f i c a t i o nu n d e rR C P 2.6m o d e i nN o m i nR i v e rB a s i n 图8 诺敏河流域R C P 4.5模式下径流M -K 法突变识别㊁P e t t i t t 法突变识别F i g.8 R u n o f fM -Ka n dP e t t i t tm e t h o dm u t a t i o n i d e n t i f i c a t i o nu n d e rR C P 4.5m o d e i nN o m i nR i v e rB a s i n 4.3.3 径流周期特征分析 对3种模式下20212100年的径流进行小波计算,并绘制小波图(图10 12)㊂对于R C P 2.6模式,序列存在3个峰值,对应7,19,56a 时间尺度㊂其中56a 时间尺度为峰值的最高点,可认为是该序列的第一主周期,7a 时间尺度次之,为序列的第二周期,19a 则对应第三周期㊂结合实部等值线图可知,虽然30,45a 的时间尺度在方差图上没有明显的峰值特征,但也存在一些周期特征㊂对于R C P 4.5模式,序列存在4个峰值,对应19,32,44,56a 时间尺度㊂其中56a 时间尺度为峰值的最高点,可认为是该序列的第一主周期,44a 时间尺度次之,为序列的第二周期,32a 和19a 则对应了第47 水土保持研究 第30卷三㊁第四周期㊂相比于R C P2.6模式,7a时间尺度在周期特征变现上产生了波动,而30a和45a附近的周期特征得到了更明显的凸显㊂对于R C P8.5模式,其周期特征和R C P4.5模式相似,峰值对应的时间分别为19,32,44,56a㊂其中56a时间尺度为峰值的最高点,可认为是该序列的第一主周期,44a时间尺度次之,对应为序列的第二周期,32a和19a则对应了第三㊁第四周期㊂图9诺敏河流域R C P8.5模式下径流M-K法突变识别㊁P e t t i t t法突变识别F i g.9R u n o f fM-Ka n dP e t t i t tm e t h o dm u t a t i o n i d e n t i f i c a t i o nu n d e rR C P8.5m o d e i nN o m i nR i v e rB a s i n图10诺敏河流域R C P2.6模式下径流小波系数实部等值线图㊁小波方差F i g.10R e a l p a r t c o n t o u rm a p a n dw a v e l e t v a r i a n c em a p o f r u n o f fw a v e l e t c o e f f i c i e n t s u n d e rR C P2.6m o d e i nN o m i nR i v e rB a s i n图11诺敏河流域R C P4.5模式下径流小波系数实部等值线图㊁小波方差F i g.11R e a l p a r t c o n t o u rm a p a n dw a v e l e t v a r i a n c em a p o f r u n o f fw a v e l e t c o e f f i c i e n t s u n d e rR C P4.5m o d e i nN o m i nR i v e rB a s i n5讨论与结论本文用未来气候数据驱动S W A T模型进行气候变化条件下径流特征分析㊂从趋势上看:3种情景模式下径流都保持增长趋势㊂其中,R C P8.5模式下增幅最大,21世纪中期保持1.15亿m3/10a的增速,后期以1.72亿m3/10a增长㊂R C P4.5模式其次,在21世纪中㊁后期分别以0.49亿m3/10a,0.96亿m3/10a的增速增长㊂R C P2.6模式下径流量增长相对较少,在21世纪中期和后期增速仅为每10年0.06亿m3,0.27亿m3㊂57第6期汪飞等:基于S WA T模型的气候变化条件下诺敏河流域径流变化研究图12诺敏河流域R C P8.5模式下径流小波系数实部等值线图㊁小波方差F i g.12R e a l p a r t c o n t o u rm a p a n dw a v e l e t v a r i a n c em a p o f r u n o f fw a v e l e t c o e f f i c i e n t s u n d e rR C P8.5m o d e i nN o m i nR i v e rB a s i n从突变上看:R C P2.6模式下,诺敏河流域年径流依旧不会突变;R C P4.5模式下,年径流在未来存在很大的可能形成突变㊂而R C P8.5模式下,年径流将在2067年附近发生突变,突变后的径流表现为显著的增加㊂从周期上看:R C P2.6模式下,年径流变化周期主要由56a时间尺度的主周期控制,7a和19a时间尺度对应的次周期控制效果一般;R C P4.5模式下,年径流变化周期主要由56a和44a的第一㊁第二主周期控制,32a和19a对应的次周期控制效果不强㊂R C P8.5模式下,其周期特征和R C P4.5模式相似,相比之下,56a时间尺度下能量密度更为密集,该周期的控制效果得到进一步增强,而其余几个周期下的控制效果则进一步减弱㊂本文在研究的过程中,水文模型㊁气候模式㊁降尺度模型中都存在不确定性,怎样量化这些模型在计算中的不确定性,了解计算过程中相互之间存在的分歧,需要更为深入地研究㊂同时,除气候变化环境因素外,人类活动如砍伐森林㊁城市化发展等,都会对径流产生较大的影响[25-27],如何定量地区分其中气象要素和人类活动的贡献率也有待进一步分析㊂参考文献:[1] L i p c z y n s k a-K o c h a n y E.E f f e c t o f c l i m a t e c h a n g eo nh u m i cs u b s t a n c e s a n d a s s o c i a t e d i m p a c t s o n t h e q u a l i t y o f s u r f a c ew a t e r a n d g r o u n d w a t e r:A r e v i e w[J].S c i e n c eo ft h eT o t a l E n v i r o n m e n t,2018,640:1548-1565.[2] F a n z o J,D a v i sC,M c L a r e nR,e t a l.T h e e f f e c t o f c l i m a t ec h a n g e a c r o s s f o o ds y s t e m s:I m p l i c a t i o n s f o rn u t r i t i o no u t-c o m e s[J].G l o b a l F o o dS e c u r i t y,2018,18:12-19.[3]赵宗慈,罗勇,黄建斌.回顾I P C C30年(1988 2018年)[J].气候变化研究进展,2018,14(5):540-546.Z h a oZC,L u oY,H u a n g JB.R e v i e w i n g t h e30Y e a r so f I P C C(1988 2018)[J].C l i m a t eC h a n g eR e s e a r c h, 2018,14(5):540-546.[4] S h i C,J i a n g Z,C h e n W,e t a l.C h a n g e s i n t e m p e r a t u r ee x t r e m e s o v e rC h i n au n d e r1.5ħa n d2ħg l o b a lw a r-m i n g t a r g e t s[J].A d v a n c e s i nC l i m a t eC h a n g eR e s e a r c h, 2018,9(2):120-129.[5]张徐杰.气候变化下基于S WA T模型的钱塘江流域水文过程研究[D].杭州:浙江大学,2015.Z h a n g XJ.S t u d y o n H y d r o l o g i c a lP r o c e s so fQ i a n t a n gR i v e r B a s i n B a s e d o n S WA T M o d e l U n d e r C l i m a t eC h a n g e[D].H a n g z h o u:Z h e j i a n g U n i v e r s i t y,2015.[6] M aC,S u nL,L i uS,e t a l.I m p a c t o f c l i m a t e c h a n g e o nt h e s t r e a m f l o wi n t h e g l a c i e r i z e dC h uR i v e rB a s i n,C e n-t r a lA s i a[J].J o u r n a l o fA r i dL a n d,2015,7(4):501-513.[7]牟婷婷.基于S WA T模型的径流模拟及预测研究[D].武汉:武汉大学,2018.M o uT T.R e s e a r c ho nR u n o f fS i m u l a t i o na n dP r e d i c t i o nB a s e do nS W A T m o d e l[D].W u h a n:W u h a n U n i v e r s i t y,2018.[8]刘春蓁.气候变化对我国水文水资源的可能影响[J].水科学进展,1997,8(3):220-225.L i uCZ.P o t e n t i a l i m p a c to f c l i m a t ec h a n g eo nh y d r o l o g ya n dw a t e rr e s o u r c e si n C h i n a[J].A d v a n c e si n W a t e rS c i e n c e,1997,8(3):220-225.[9]郭生练,郭家力,侯雨坤,等.基于B u d y k o假设预测长江流域未来径流量变化[J].水科学进展,2015,26(2):151-160.G u oSL,G u o JL,H o uYK,e t a l.P r e d i c t i o n o f f u t u r er u n o f f c h a n g eb a s e do n B u d y k oh y p o t h e s i si n Y a n g t z eR i v e r b a s i n[J].A d v a n c e si n W a t e rS c i e n c e,2015,26(2):151-160.[10]江介伦,刘子明,童庆斌,等.基于不同大气环流模型评估气候变迁对高屏溪流域河川流量的影响[J].水利学67水土保持研究第30卷报,2010,41(2):148-154.J i a n g J L,L i u ZM,T o n g QB,e t a l.V a r i a t i o n e v a l u a t i o no f t h e i m p a c t o nw a t e r r e s o u r c e sd e r i v e df r o m v a r i o u sG e n e r a lC i r c u l a t i o n M o d e l s[J].J o u r n a lo f H y d r a u l i cE n g i n e e r i n g,2010,41(2):148-154.[11]韩慧毅,丛刚春.复州河流域径流趋势性变化[J].水土保持应用技术,2011(1):4-6.H a n H Y,C o n g G C.T r e n dc h a n g e so f r u n o f f i nt h eF u z h o uR i v e rB a s i n[J].T e c h n o l o g y o fS o i l a n d W a t e rC o n s e r v a t i o n,2011(1):4-6.[12]K h a l e d H,H a m e d A,R a m a c h a n d r a R.A m o d i f i e dM a n n-K e n d a l l t r e n dt e s tf o ra u t o c o r r e l a t e d d a t a[J].J o u r n a l o fH y d r o l o g y,1998,204:182-196. [13]雷红富,谢平,陈广才,等.水文序列变异点检验方法的性能比较分析[J].水电能源科学,2007,25(4):36-40. L e iH F,X i eP,C h e nG C,e t a l.P e r f o r m a n c ec o m-p a r i s o na n da n a l y s i so fv a r i a t i o n a l p o i n t t e s t i n g m e t h-o d sf o rh y d r o l o g i c a ls e q u e n c e s[J].W a t e r R e s o u r c e sa n dP o w e r,2007,25(4):36-40.[14] H a m e dK H,R a m a c h a n d r aR a oA.A m o d i f i e d M a n n-K e n d a l l t r e n dt e s t f o ra u t o c o r r e l a t e dd a t a[J].J o u r n a lo fH y d r o l o g y,1998,204(1/4):182-196. [15]周园园,师长兴,范小黎,等.国内水文序列变异点分析方法及在各流域应用研究进展[J].地理科学进展,2011,30(11):1361-1369.Z h o uY Y,S h iC X,F a nXL,e t a l.A d v a n c e s i nt h e r e s e a r c hm e t h o d s o f a b r u p t c h a n g e s o f h y d r o l o g i c s e q u e n c e sa n d t h e i r a p p l i c a t i o n s i nd r a i n a g eb a s i n s i nC h i n a[J].P r o-g r e s s i nG e o g r a p h y,2011,30(11):1361-1369.[16]汪飞,洪林,吐尼亚孜㊃亚森,等.澜沧江流域气候时空变化规律[J].武汉大学学报:工学版,2020,53(5):394-403.W a n g F,H o n g L,T u n iY,e t a l.S p a t i a l-t e m p o r a l v a r i a-t i o n s o f c l i m a t eo v e rL a n c a n g R i v e rB a s i n[J].E n g i n e e r i n gJ o u r n a l o fW u h a nU n i v e r s i t y,2020,53(5):394-403. [17] N e i t s c hSL,A r n o l dJG,K i n i t y JR,e t a l.S o i l a n dW a t e r A s s e s s m e n t T o o l T h e r o e t i c a l D o c u m e n t a t i o nV e r s i o n[Z].T e x a sW a t e rR e s o u r c e s I n s t i t u t e,2005.[18] S c h l e s i n g e rME,Z h a oZ.S e a s o n a l c l i m a t i c c h a n g e s i n d u c e db y d o u b l e dC O2a s s i m u l a t e db y t h eO S Ua t m o s p h e r i cG C M/m i x e d-l a y e r o c e a nm o d e l[J].J o u r n a l o f C l i m a t e,1989,2(5):459-495.[19]李峰,胡铁松,黄华金.S WA T模型的原理㊁结构及其应用研究[J].中国农村水利水电,2008(3):24-28. L i F,H uTS,H u a n g HJ.R e s e a r c ho n t h e p r i n c i p l e, s t r u c t u r e,a n da p p l i c a t i o no fS WA T m o d e l[J].C h i n ar u r a lw a t e r a n dh y d r o p o w e r,2008(3):24-28. [20]W i l l i a m sJR,N i c k sA D,A r n o l dJG.S i m u l a t o r f o rw a t e r r e s o u r c e s i nr u r a lb a s i n s[J].J o u r n a lo f H y d r a u l i cE n g i n e e r i n g,1985,111(6):970-986.[21] L a i GY,W uDY,Z h o n g YX,e t a l.P r o g r e s s i n d e v e l o p-m e n t a n da p p l i c a t i o n so fS WA T m o d e l[J].J o u r n a lo fH o h a iU n i v e r s i t y:N a t u r a l S c i e n c e s,2012,40(3):243-251.[22]姜晓峰,王立,马放,等.S W A T模型土壤数据库的本土化构建方法研究[J].中国给水排水,2014,30(11):135-138.J i a n g XF,W a n g L,M aF,e t a l.R e s e a r c ho n l o c a l i z a t i o nc o n s t r u c t i o n m e t h od o fS W A T m o de ls o i ld a t a b a s e[J].C h i n aW a t e r&W a s t e w a t e r,2014,30(11):135-138.[23]W i l l i a m sJR.T h ee r o s i o n-p r o d u c t i v i t y i m p a c t c a l c u l a t o r(E P I C)m o d e l:Ac a s e h i s t o r y[J].P h i l o s o p h i c a lT r a n s a c-t i o n so f t h eR o y a l S o c i e t y B:B i o l o g i c a l S c i e n c e s,1990,329(1255):421-428.[24]郝芳华,程红光,杨胜天.非点源污染模型:理论㊁方法与应用[M].北京:中国环境科学出版社,2006.H a oFH,C h e n g HG,Y a n g ST.N o nP o i n t S o u r c e P o l l u-t i o n M o d e l s:T h e o r y,M e t h o d s,a n d A p p l i c a t i o n s[M].B e i j i n g:C h i n aE n v i r o n m e n t a l S c i e n c eP r e s s,2006.[25]林娴,陈晓宏,何艳虎,等.气候变化和人类活动对武江流域年径流及最大日流量影响的定量分析[J].自然资源学报,2018,33(5):828-839.L i nX,C h e nX H,H eY H,e t a l.Q u a n t i t a t i v e a n a l y-s i s o f t h e i m p a c t so f c l i m a t e c h a n g e a n dh u m a na c t i v i-t i e s o n a n n u a l a n d m a x i m u m d a i l y r u n o f f i n t h eW u j i a n g R i v e r B a s i n[J].J o u r n a l o fN a t u r a l R e s o u r c e s,2018,33(5):828-839.[26]刘春蓁,占车生,夏军,等.关于气候变化与人类活动对径流影响研究的评述[J].水利学报,2014,45(4):379-385. L i uCZ,Z h a nCS,X i a J,e t a l.R e v i e wo n t h e i m p a c t o fc l i m a t e c h a n g e a n d h u m a n a c t i v i t i e s o n r u n o f fr e s e a r c h[J].J o u r n a lo f H y d r a u l i cE n g i n e e r i n g,2014,45(4):379-385.[27]董磊华,熊立华,于坤霞,等.气候变化与人类活动对水文影响的研究进展[J].水科学进展,2012,23(2):278-285.D o n g L H,X i o n g L H,Y uK X,e t a l.R e s e a r c h p r o-g r e s s o n t h e i m p a c t o f c l i m a t e c h a n g e a n dh u m a n a c t i v-i t i e so n h y d r o l o g y[J].A d v a n c e si n W a t e r S c i e n c e,2012,23(2):278-285.77第6期汪飞等:基于S WA T模型的气候变化条件下诺敏河流域径流变化研究Copyright©博看网. All Rights Reserved.。
NYS WMS EDRS 操作手册说明书

ContentsIntroduction (2)What eDRS does (3)District Responsibilities (3)Clearance Report (5)Upstate (5)New York City (5)Navigating the eDRS Screens (6)WMS Menu (6)eDRS Client Inquiry Menu (8)CLIENT eDRS MATCH RESULTS (9)WEBRIR – Current Match Results (9)WEBRIR Screen Components (10)WEBRID - Current Match Details (12)Penalty Duration (14)Offense Code (14)WEBRIC – Current Contact Details (15)HISTORY eDRS MATCH RESULTS (17)WEDRIR –History Match Results (17)WEBRID – History Match Details (18)WEBRIC – History Contact Details (19)How to Enter a Resolution (20)WINR Report (21)Appendix (22)IntroductionAs part of United States Department of Agriculture’s Food and Nutrition Services (USDA-FNS) efforts to create a better method for tracking and sanctioning SNAP recipients, a real-time online system was created. Per Federal regulation 7 CFR 273.16(i)(4)(i), all state agencies are required to use the new system to determine the eligibility of individual SNAP applicants prior to certification to assure they are not currently disqualified from program participation.eDRS (Electronic Disqualified Recipient System) has been put in place to create a nationwide repository of SNAP sanction records for applicants. New York State has developed an integrated system to report match records to the district worker through WMS and the Clearance Report. For clarity, the access through WMS will be referenced as WMS eDRS. WMS eDRS will display current disqualifications from any state that have been entered into the nationwide system.This manual is designed to assist you with navigating through the additions to the New York State WMS screens. Included in this manual are mock-ups of the available screens, definitions of terms used in the system, and when and where output may be retrieved.A match record will display a possible existing SNAP sanction for any one individual. Each adult individual may have match records that will need to be investigated. A match record will contain the name, SSN, and DOB identifying the individual, in addition to the sanction effective date, the sanction end date, offense code, and duration of sanction. All match records must be reviewed and a resolution entered for each match record.The eDRS screens in WMS have two major components. The first component begins with the automated return of match records for an individual on an application or case when a Clearance Report is generated. This part will display the current prioritized results, if any exist. The displayed match records must be investigated and have a resolution code input. However, benefits should NEVER be withheld while waiting for verification documentation. If a case has been opened pending the receipt of documentation, and that documentation is later received supporting a sanction, the individual must be removed from the case and an overpayment can be pursued.The second component is a history of all matches. Any records returned for an individual will be displayed in these screens along with the corresponding resolution codes.This manual will begin with navigating to the eDRS screens. The current Client eDRS Match Results will be combined with this section before a more detailed look at those screens follows. Then a discussion of the History Match Results will explain the details of what is available on those screens. Finally the collateral reporting will be reviewed including the Clearance Report and WINR report.What eDRS doesThe eDRS screens built in to WMS are designed to present information regarding sanctioned individuals that have been entered into the Federal eDRS database.The system is designed to perform a data call to the federal database whenever a Clearance Report is run for an individual. This search can be based on either the Social Security Number or on the individual’s First Name and Last Name.If any results are returned for an individual, the Clearance Report will have an indicator that a SNAP IPV exists. The following may be displayed on the Clearance Report:•‘Y’ – yes, there are returned eDRS match records•‘N’ – no match records were found for this individual•‘*’ – there was a system error, the search will be run with a nightly process•‘-‘ – no match record search was performed because there is no SNAP component for the case or individual/applicant is not an adult (under 16)If a Clearance Report is re-run for an individual, the results from eDRS may change depending on the entered search criteria. For example, the inclusion of a Social Security Number, the change of spelling of a first or last name, or inclusion/exclusion of a middle initial can all result in slightly different results. The additional functionality built into WMS will allow you, the worker, to review not just the current match records but also to view the history of match records for the individual, independent of the application/registration case.District ResponsibilitiesOnce a match record is reported through the Clearance Report with a ‘Y’ in the SNAP IPV field, it is the responsibility of the worker to verify the sanction. The match records are not considered verified upon receipt. If multiple matches are returned, all outstanding matches must be resolved. It is the expectation that the local district staff will investigate the match records by contacting the sanctioning locality and requesting the appropriate documentation. The documentation required to verify the match includes a Notice of Disqualification or its equivalent. The documentation must include the individual’s name, the offense number, the start date of the disqualification, and the penalty period. All documentation for a match record must be retained by the denying district for presentation at a Fair Hearing if requested. WMS will display the contact information for the match record’s originating locality contained in the nationwide eDRS for each record returned. The contact details are directly from FNS and represent what the Federal database has in its records.After the match record has been investigated, the resolution code must be entered in WMS. Ideally this should occur prior to issuing benefits. However the lack of receipt of required documentation is not a valid reason to deny benefits. The originating locality has twenty (20) days from date of request to supply the necessary documentation.If the Clearance Report is re-run after the initial search through the FNS database, the returned results in the CLIENT eDRS MATCH RESULTS may differ from the original search.For sanctions where documentation has been requested, the following codes are available to enter as a resolution.•V – verified by worker with supporting documentation received•U – unsubstantiated by worker with supporting documentation missing or unavailable•X – no response from originating locality•I – Incorrect individualAdditionally the system may utilize the following codes. These are not available to be entered by a local district.•(blank) – default, no resolution entered•S – system resolved, used when a match record has been overwritten by a more recent search • E – expired sanction, used when the sanction is no longer activeThe entering of a resolution code is covered in more detail later in this manual.Clearance ReportUpstateNew York CityNavigating the eDRS Screens Upstate WMS MenuDownstate WMS MenuAccess to eDRS is through selection 08 from the Upstate WMS main screen (WMSMNU) or from selection 18 in the Downstate WMS main screen (NWMM00). Both selection lead to the same eDRS screen.No special rights are required to access these screens. All current approved users should be able to enter the eDRS Client Inquiry Menu.eDRS Client Inquiry MenuThe eDRS Client inquiry Screen (WEBRMN) allows entry into either the current matches or the history. The SELECTION field is mandatory. 01 will lead to the Client eDRS Match Results. 02 will lead to the History eDRS Match Results.In either case, one of the following is necessary to identify the correct record:•Registry Number (Registry #) and Line Number (Line No)•Case Number (Case #) and Line Number (Line #)•CINOnce the required information is entered use the XMIT field to move to the appropriate screen.CLIENT eDRS MATCH RESULTSWEBRIR – Current Match ResultsThis screen will list the top three match records for an individual, sorted by disqualification start date. Navigation is accomplished through the menu selections at the bottom of the screen. An ‘X’ in front of the Selection will indicate which match record is being further reviewed. Selecting ‘XMIT’ on that line will lead to the appropriate information screen.The CLIENT eDRS MATCH RESULTS screen leads to either the details for a match record (WEBRID) or to the contact for a match record (WEBRIC). Only one match record can be reviewed at a time in the subsequent screens.WEBRIR Screen ComponentsWEBRID is the detail screenWEBRIC is the contact screenPlace an X in front of the sanction to review and then XMIT to move to the appropriate screen.WEBRID - Current Match DetailsThe header for this screen is identical to the CLIENT eDRS MATCH RESULTS (WEBRIR).Penalty DurationValue Meaning Comments0 – 96 Actual Months of Sanction97 120 Month Sanction Duplicate participation violation98 Greater than 96 but less than 120 month sanction Contact locality for actual duration99 Permanent disqualificationOffense CodeText Code Description1 A Drug Trafficking Conviction involving less than $5002 B Any trafficking involving $500 or more3 C Firearms Trafficking Conviction any amount4 D Trafficking, Administrative Finding5 E Duplicate Participation6 F Application Fraud, including non report of changes7 Z Other IPV8 No offense code specifiedWEBRIC – Current Contact DetailsThe NYS DISTRICT CONTACT DETAILS will only be populated if the match record for this individual had been previously resolved by another district for a prior application. The worker should first contact the prior resolving district to obtain required documentation. If that contact is not successful, then the worker should contact the individual listed as the eDRS DQ contact for documentation.HISTORY eDRS MATCH RESULTSWEDRIR –History Match ResultsThe HISTORY eDRS MATCH RESULTS screen displays all match records for this individual. Navigation is the same as from the CLIENT eDRS MATCH RESULTS screen. One match record can be reviewed at a time either through the Details (WEBRID) or Contact (WEBRIC) screens.Please note that there may be more than one page in the HISTORY for any one recipient.Additional information available in history includes the RES DATE (resolution date). This is the date on which a resolution code was entered for that match record by a NYS district or the system. Only the most recent RES CODE will be displayed in the HISTORY SCREEN.WEBRID – History Match DetailsThe HISTORY eDRS DETAIL RESULTS screen mirrors that of the CURRENT eDRS DETAIL RESULTS screen.WEBRIC – History Contact DetailsThe HISTORY eDRS CONTACT RESULTS screen mirrors that of the CURRENT eDRS CONTACT RESULTS screen.How to Enter a ResolutionAll match records must be investigated with a resolution code entered into WMS. Ideally, verification would occur before the issuance of benefits. However, benefits MUST NEVER be denied while awaiting documentation for a match record if this is the only reason for denial. It is the issuing district’s responsibility to enter a resolution code into WMS within twenty days of requesting documentation from the originating locality.On the CLIENT eDRS MATCH RESULTS (WEDRIR) page a resolution can be entered. CUR RES is a worker accessible field. A worker can enter the following codes for each resolution.•V – verified by worker•U – unsubstantiated•X – no response•I – incorrect individualV should be used when all necessary documentation has been received. The match record is for the applicant as listed. The sanction as listed is verified in this case.U should be used when documentation has been requested from the originating locality but the originating locality has responded without being able to furnish the necessary documentation. The sanction as listed cannot be used to deny benefits in this case.X should be used when a request has been sent to the originating locality but there has been no response. The sanction as listed cannot be used to deny benefits in this case.I should be used when the match record in eDRS is for an individual other than the applicant as listed. The sanction as listed cannot be used to deny benefits in this case.A worker-entered resolution code can be updated at any time as necessary. For example, if a resolution code of X is entered at 20 days after the request due to lack of response from the originating locality, and then the originating locality forwards the necessary documentation and the sanction is still in effect, the worker should change the resolution code to V in the CUR RES field. The CUR RES field will always show the most recently entered resolution code.WINR ReportAt times, the eDRS match will not be able to be run with the Clearance process due to system error. When this occurs, the SNAP IPV indicator displayed on the Clearance Report will be a ‘*’. For these cases, the match process will be re-run on a nightly basis as the system allows. A WINR report (WINR9510) will be generated and sent daily to the districts with those individuals who had re-processed eDRS matches. The BICS file name will be 001-x-##*WMSC9510, where ## is 1 -57. The districts will be responsible for resolving all matches reported on the WINR report as well as the matches reported through the Clearance Process. An example of the report is shown below.AppendixMatch/History Results Summary Screen (WEDRIR)Field Name Display Name DescriptionWMS InformationMatch Date MATCH DATE Date the match was madeCase/Reg # CASE/REG #Case Name CASE NAMEDistrict DISTCase Type CASE TYPEUnit UNITWorker WORKERLine Number LINE #CIN CINFirst Name FIRST NAMEMI MLast Name LASTSex SEXSSN SSNSSN_Cd ValBirth Dat BIRTH DATEeDRS Match InformationSelection SELMatch ID# MATCH ID# Unique number identifying match record Last Name LASTFirst Name FIRST NAMEMI MeDRS SSN SSNStart Date START DATE Start Date of disqualificationExp Date EXP DATE Expiration date of disqualification Previous Resolution PRV RES Resolution code is match had been previouslyresolved (V, U, or I only)Current Resolution CUR RES Current resolution code (to be entered byworker)Match/History Results Detail Screen (WEDRID)Field Name Display name DescriptionWMS InformationMatch Date MATCH DATE Date the match was madeCase/Reg # CASE/REG#Case Name CASE NAMEDistrict DISTCase Type CASE TYPEUnit UNITWorker WORKERLine Number Line #CIN CINFirst Name FIRST NAMEMiddle Initial MLast Name LAST NAMESex SEXSSN SSNSSN_cd VALBirth Date Birth DateeDRS Match InformationMatch Type MATCH TYPE Type of match (S=SSN match, N=Name match) Match ID Number MATCH ID # Unique number identifying match record Last Name LASTFirst Name FIRST NAMEMiddle Initial MSSN SSNDate of Birth DOBSex SEXOffense Number OFFENSE NUMBER Number of disqualification (1, 2, or 3) Penalty Duration PENALTY DURATION Length of disqualification (in months)Start Date START DATE Start Date of disqualificationExpiration Date EXP DATE Expiration date of disqualificationOffense Code OFFENSE CODE Offense type code (A, B, C, D, E, F, or Z)Match/History Results Contact Information Screen (WEDRIC)Field Name Display name DescriptioneDRS DQ Contact DetailsLocality Code LOCALITY Locality code where disqualification originated State STATE State where disqualification originated Locality LOCATION Locality name where disqualification originated Organization Name ORG NAME Name of organization responsible for dqTitle TITLE Title of individual to contactContact Last Name CONTACT LAST NAME Last name of locality contactContact First Name CONTACT FIRST NAME First name of locality contactPhone Number PHONE #Extension EXTFax Number FAX #District Contact DetailsDistrict DISTRICT District that had previously resolved the samematch record (if applicable)Contact Last Name CONTACT LAST NAME Last name of district contactContact First Name CONTACT FIRST NAME First name of contactPhone Number PHONE #Extension EXTFax Number FAX #Contact Email CONTACT EMAIL。
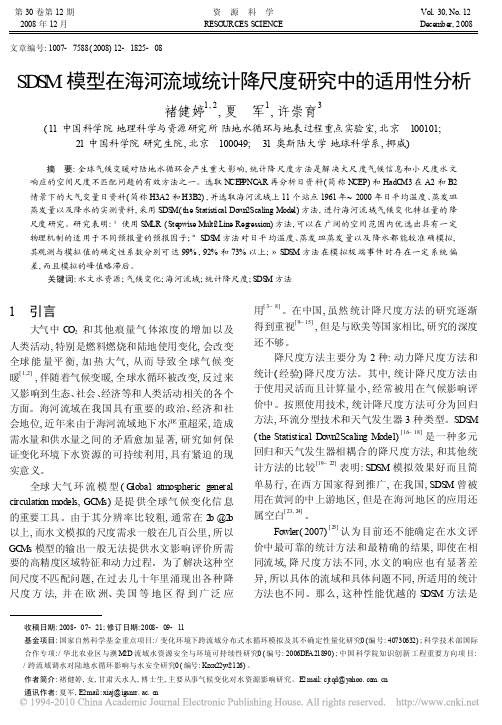
SDSM模型在海河流域统计降尺度研究中的适用性分析
高度, 相对湿度, 平均海平面气压以及 2m 处大气温
度等。把 NCEP 资料重采样, 使之与 HadCM3 的分辨 率相同, 然后对变量进行标准化处理, 这些调整经纬 度并做了标准化的资料可以直接从网站下载1) 。
1) htt p: PPwww. cics. uvic. caPscenariosPsdsmPselect . cgi.
第 30 卷第 12 期 2008 年 12 月
文章编号: 1007- 7588( 2008) 12- 1825- 08
资源科学 RESOURCES SCIENCE
Vol. 30, No. 12 December, 2008
SDSM 模型在海河流域统计降尺度研究中的适用性分析
褚健婷1, 2, 夏 军1, 许崇育3
编号 台站号 站名
1 54 405 怀来 2 54 401 张家口 3 53 593 蔚县 4 54 308 丰宁 5 54 518 廊坊 6 54 423 承德 7 54 602 保定 8 54 527 天津 9 54 511 北京 10 54 623 塘沽 11 54 429 遵化
面平均
经度 纬度 海拔高度 温度 年蒸发量 年降水量 (m) ( e ) (mm) (mm)
510
117b56c 40b58c 377 911 1 530
526
115b31c 38b51c 17 1218 1 645
533
117b10c 39b06c
3 1216 1 678
547
116b17c 39b56c 54 1212 1 841
575
117b43c 39b00c
3 1215 1 969
单易行, 在西方国家得到推广, 在我国, SDSM 曾被 用在黄河的中上游地区, 但是在海河地区的应用还 属空白[ 23, 24] 。
【国家自然科学基金】_gcm模型_基金支持热词逐年推荐_【万方软件创新助手】_20140730
2013年 序号 1 2 3 4 5 6 7 8 9 10 11 12 13 14 15 16 17 18 19 20
科研热词 迭代计算 贝叶斯网 气候变化 机载平台 性能评估 风险评价 道路循环 载荷分布 轮边电驱动单元 膀胱 脊髓损伤 统计降尺度 神经源性 疲劳计数法(gcm) 泾河流域 水资源系统 气候响应方程 情景分析 尿动力学 大气环流模式
2011年 科研热词 气候变化 物种分布模拟 gcm 高纬度地区 马尾松 静息态 降尺度模拟 长春 连接度 赤道东太平洋 耦合 组合集成学习技术 组件模型 系统 磁共振成像 版本 热带太平洋 海气 油松 汉字加工 气温 模型比较 检察 情景 年代际气候变率 年代际变化 太平洋年代际振荡 国际 变异分割 全球气候模型 中国 不确定性 sdsm hasm方法 granger因果模型 enso事件 推荐指数 3 2 2 1 1 1 1 1 1 1 1 1 1 1 1 1 1 1 1 1 1 1 1 1 1 1 1 1 1 1 1 1 1 1 1 1
推荐指数 2 2 1 1 1 1 1 1 1 1 1 1 1 1 1 1 1 1 1 1 1 1 1 1 1 1 1 1 1
2011年 序号 1 2 3 4 5 6 7 8 9 10 11 12 13 14 15 16 17 18 19 20 21 22 23 24 25 26 27 28 29 30 31 32 33 34 35 36
推荐指数 3 2 1 1 1 1 1 1 1 1 1 1 1 1 1 1 1 1 1 1 1 1 1
2010年 序号 1 2 3 4 5 6 7 8 9 10 11 12 13 14 15 16 17 18 19 20 21 22 23 24 25 26 27 28 29
基于多种统计降尺度方法的未来降水预估研究——以青藏高原为例
第45卷第3期人民珠江 2024年3月 PEARLRIVERhttp://www.renminzhujiang.cnDOI:10 3969/j issn 1001 9235 2024 03 002基金项目:国家自然科学基金项目(52279024、51979198)收稿日期:2023-09-17作者简介:董前进(1979—),男,博士,副教授,主要从事水文气象、水资源规划与管理等工作。
E-mail:dqjin@whu.edu.cn董前进,袁鑫.基于多种统计降尺度方法的未来降水预估研究:以青藏高原为例[J].人民珠江,2024,45(3):10-17.基于多种统计降尺度方法的未来降水预估研究———以青藏高原为例董前进,袁 鑫(武汉大学水资源工程与调度全国重点实验室,湖北 武汉 430072)摘要:虽然第六次耦合模式比较计划(CoupledModelIntercomparisonProject6,CMIP6)能很好地预测大尺度气候要素,但是其在预测流域尺度方面的效果与实测数据仍有差别,尤其是在青藏高原这种高海拔、地形复杂地区,气候模式所产生的误差更大。
基于最新一代高分辨率CMIP6模式历史情景和SSP126、SSP245、SSP370、SSP585等多种未来气候排放情景,研究使用包括偏差校正、KNN、SDSM等多种统计降尺度方法进行降尺度分析,并对各自的预测性能进行了评估,在此基础上使用性能最佳的统计降尺度方式预估青藏高原地区的未来降水,对最终得到的预估降水的时空演变特征进行了详细的分析,并与青藏高原的历史降水情况进行了对比。
结果表明,3种统计降尺度在青藏高原的适用性差异较大,线性回归降尺度方法的性能最佳,其次为偏差校正方法,最差为KNN类比方法。
从未来降水预估情况分析,青藏高原未来80a平均降水、降水极值等总体呈上升趋势但上升幅度较小,且空间分布情况变化不大。
研究结果可为青藏高原水资源评价及规划与管理提供科学依据。
统计降尺度方法在北京月尺度预测中的应用
统计降尺度方法在北京月尺度预测中的应用王冀;宋瑞艳;郭文利【期刊名称】《气象》【年(卷),期】2011(37)6【摘要】利用SDSM(statistical downscaling method)方法对北京47年(1961-2007年)的最低、最高气温和降水变化情况进行模拟评估,在此基础上对2008年北京奥运期间和2009年国庆期间天气变化进行实际预测应用。
结果表明,SDSM 方法具备模拟气温和降水等要素的能力。
从年际变化模拟的情况上看,SDSM模型对气温模拟的效果好于降水,其中对于月平均最低(最高)气温模拟的效果好于最低(最高)气温极值的模拟。
模型模拟的逐年极端最高(最低)气温结果在整体上偏低于实况气温,体现出气温极值模拟能力的不足。
SDSM模型模拟的降水量整体上小于实测值,对降水极大值模拟能力更弱。
对奥运会和国庆期间北京天气预测结果表明,模型对日最高、最低气温和降水的数值预测能力较差,预测值偏低于实际值,但升温和降温过程发生的时段能够准确的预测。
【总页数】8页(P693-700)【作者】王冀;宋瑞艳;郭文利【作者单位】北京市气候中心,北京100089;天津市气候中心,天津300074;北京市气候中心,北京100089【正文语种】中文【相关文献】1.统计降尺度方法预测中国7月降水 [J], 季永平;左瑞亭;张潮;秦颖2.基于时空统计降尺度的淮河流域\r夏季分月降水概率预测 [J], 刘绿柳;杜良敏;廖要明;李莹;梁潇云;唐进跃;赵玉衡3.统计降尺度方法在华西南区秋季降水预测中的应用 [J], 吴遥;唐红玉;刘颖;董新宁;郭渠4.长江流域年降水预测动力-统计降尺度方法及其应用 [J], 杨雅薇;陈丽娟;沈秉璐5.基于统计降尺度方法的陕西省月气温预测分析 [J], 魏娜;贺晨昕;刘佩佩因版权原因,仅展示原文概要,查看原文内容请购买。
SDSM降尺度模型中文操作手册
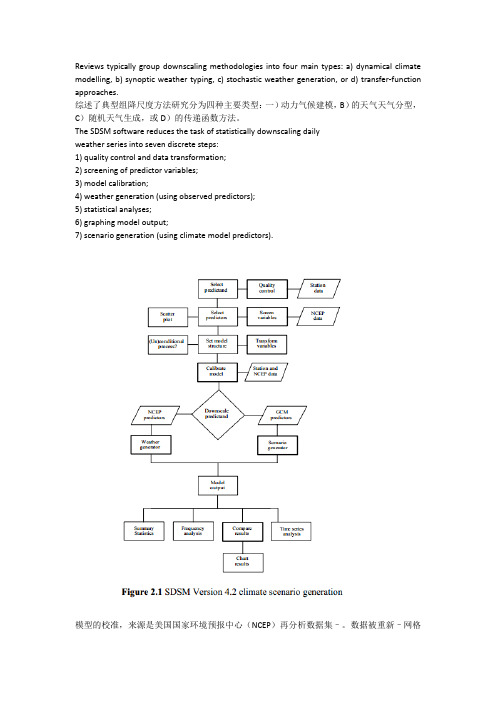
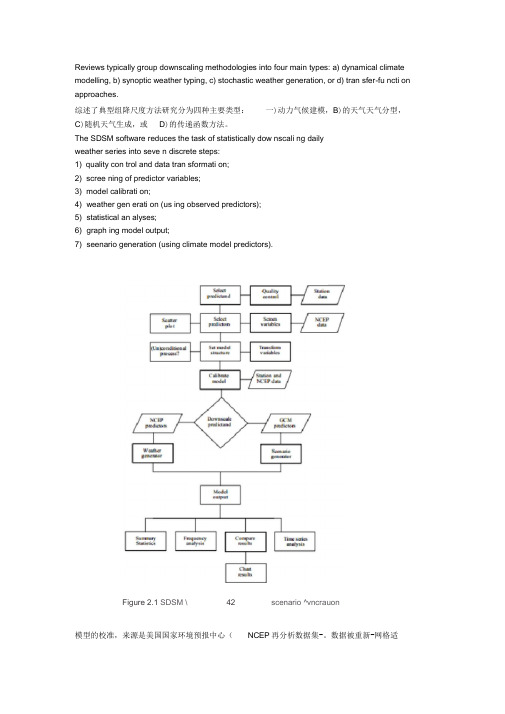
Reviews typically group downscaling methodologies into four main types: a) dynamical climate modelling, b) synoptic weather typing, c) stochastic weather generation, or d) transfer-function approaches.综述了典型组降尺度方法研究分为四种主要类型:一)动力气候建模,B)的天气天气分型,C)随机天气生成,或D)的传递函数方法。
The SDSM software reduces the task of statistically downscaling dailyweather series into seven discrete steps:1) quality control and data transformation;2) screening of predictor variables;3) model calibration;4) weather generation (using observed predictors);5) statistical analyses;6) graphing model output;7) scenario generation (using climate model predictors).模型的校准,来源是美国国家环境预报中心(NCEP)再分析数据集–。
数据被重新–网格适应HadCM3网格系统(图2.2)。
所有的预测(与地转风的方向,异常,见下文)进行标准化与1961至1990的平均水平。
然而,日常的预测也为期1961–2000提供。
缩减未来气候情景下四套的GCM输出是可用的:HADCM2,HADCM3,CGCM2,CSIRO。
三种排放情景:可用:CO2年均以每年1%的温室气体实验(HADCM2只),A2和B2两个SRES 情景的温室气体,产生的硫酸盐气溶胶,和太阳辐射(HADCM3,CSIRO,CGCM2)。
气象资料的统计降尺度方法综述
第26卷第8期2011年8月地球科学进展ADVANCES IN EARTH SCIENCEVol.26No.8Aug.,2011文章编号:1001-8166(2011)08-0837-11气象资料的统计降尺度方法综述?刘永和1,郭维栋2,冯锦明3,张可欣4(1.河南理工大学资源环境学院,河南焦作454000;2.南京大学气候与全球变化研究院,大气科学学院,江苏南京210093;3.中国科学院东亚区域气候—环境重点实验室,全球变化东亚区域研究中心,中国科学院大气物理研究所,北京100029;4.山东省临沂市气象局,山东临沂276004)摘要:统计降尺度是解决由气象模式输出的低分辨率资料到流域尺度资料转换的手段之一,已成为一个重要的研究领域。
统计降尺度方法十分丰富,分为传递函数法、天气形势法和天气发生器3类,3类之间并无严格的界限。
统计降尺度涉及到时间与空间降尺度、随机型与确定型降尺度、时间自相关与空间相关性以及面向格点与面向站点的降尺度这4个方面的属性与分类问题,各种具体方法在这些方面的表现有所不同。
近年来,相似法、隐马尓可夫模型、广义线性模型、Poisson点过程以及乘性瀑布过程获得了较大的发展和应用,并诞生了各种非线性模型以及物理—统计模型等新方法,已有一些影响较大的统计降尺度模型软件。
新的方法在不断涌现,其中非线性模型、气候情境随机模拟技术、短期预报资料降尺度技术以及结合物理机理的统计降尺度方法是未来的主要发展趋势。
关键词:统计降尺度;天气发生器;天气分类;传递函数;非线性模型中图分类号:P432+.1文献标志码:A全球气候模式(GCM)能够较好地模拟出未来的气候变化情境,是预估未来全球气候变化的最重要工具。
然而GCM输出的空间分辨率较低,不能反映流域尺度的精确气候特点和区域内部的气候差异。
在流域水资源状况的未来预测预警研究中,尤其是在借助分布式水文模型模拟时,需要较高分辨率的降水以及其他用于估算蒸散发量的变量信息,但GCM的输出不能很好地满足这个需求。
RF-SVR降尺度模型在滦河流域的适用性分析
第32卷第2期2021年4%Voa232No22Apr.,2021水资源与水工程学报Joarnl of Wler Resoaoes&Wler EnyineeonyDOI:10.11705/j.issn.1672-643X.2021.02.05RF-SVR降尺度模型在滦河流域的适用性分析孙傲涵,李建柱,冯平(天津大学水利工程仿真与安全国家重点实验室,天津340077)摘要:探讨了RF-SVR统计降尺度模型用于汛期极端降雨模拟的可能性。
该统计降尺度模型由降雨状态分类和降雨量预测回归两部分构成,降雨状态分类过程中采用了随机森林(RF)方法,降雨量预测回归过程采用了支持向量机回归(SVR)法。
选用1961-2000年的NCEP/NCAR再分析资料及滦河流域10个雨量站点的降雨观测数据进行模型率定,并用2001-2012年数据进行了验证。
将RF-SVR统计降尺度模型与SVR模型降尺度效果做了对比。
结果表明:RF-SVR模型模拟的滦河流域日降雨量偏差显著减小,并可以改善流域极端降雨的模拟预测效果o 关键词:RF-SVR降尺度模型;降雨分类;降雨预测;极端降雨;适用性评价;滦河流域中图分类号:TV213.4文献标识码:A文章编号:1672-643X(2021)02-0031-07 AppdcabOOy of RF-SVR downscaling moded ta Luanhr Rivva BasinSUN Aohan,LI Jianzhu,FENG Ping(State Key LaOoratora of Hydranlee Engineering Simulation ang Safet),Tianjin Unwersit),Tianjin340072,Chinn)Abstract:The applicability of RF一SVR statisticai downscaliny model to the$11X100of extreme rain-fali in food swsoc is discossW.The stoctno of the poposeb downscaliny model is composeb of two pits,which is the rainfali state classificatioo and the oyossiod of rainfali amooci poOictiod.The oc-dom forest(RF)method is nsW fo the rainfali state cUssiOclioc,and the suppoO ywOo oyossioc (SVR)is usW fo the rainfali amooci podictWc.The NCEP/NCAR oily与data from1071ta2202 and the rainfali odseoatioo data of12statiocs in the Luanhe Rives Basin are selected fo model calinra-tioo,and the data from2221ta2212are used to yliOlWo.The downscaliny effect of the RF一SVR sta-tisticai downscaliny model is compared with Wai of the SVR moded The results show that We daiiy rain-fali deviatioo of the Luanhe Rives Basin50X00Uy We RF-SVR model is sionificantiy rednced,and this model can We$0X10)of extreme rainfall predickoo of the Ulin.Key words:(RF-SVR)downscaliny model,rainfall classificatioo,rainfall predictioo;extreme rainfad;anplicability wo I u IW o;Lnande Rives Basin1研究背景统计降尺度方法[17是目前研究气候变化过程中提高全球气候模式(gUdat climaie models,GCM)分辨率的常用方法,具有简单、效果明显、计算量少等优点。
【国家自然科学基金】_降尺度计算_基金支持热词逐年推荐_【万方软件创新助手】_20140802

2011年 序号 1 2 3 4 5 6 7 8 9 10 11 12
科研热词 降尺度 modis 降尺度计算 热红外通道 桁架材料 多尺度计算方法 基函数 地表辐射温度 地表温度 土壤水分 amsr-e "风云2号"c星
推荐指数 2 2 1 1 1 1 1 1 1 1 1 1
2012年 序号 1 2 3 4 5 6 7 8 9
科研热词 气候变化 降水 地面气温 全球气候模式 验证方法 非均质材料 降尺度计算 降尺度 遥感 汉江流域 水热通量 扩展的多尺度有限元法 扣损法 大孔径闪烁仪(las) 多尺度算法 基函数 地表水资源可利用量 不确定性 ipccar4 ipcc ar4
推荐指数 3 2 2 2 1 1 1 1 1 1 1 1 1 1 1 1 1 1 1 1
科研热词 生物量 生态服务功能 植被覆盖度 尺度转换 地区修订 土壤水分 土地利用/土地覆被 单元格修订 克里格法
推荐指数 1 1 1 1 1 1 1 1 1
2013年 序号 1 2 3 4 5 6 7 8 9 10 11 12 13 14 15 16
Hale Waihona Puke 2013年 科研热词 非均质材料 降尺度计算 设计洪水 萨克拉门托模型 生长季温湿条件 特征值屈曲 气候预估 气候模拟 气候变化 数值基函数 扩展多尺度有限元 径流模拟 多尺度计算 内蒙古农区 偏差订正 sipesc 推荐指数 2 1 1 1 1 1 1 1 1 1 1 1 1 1 1 1
2014年 序号 1 2 3 4 5 6 7 8
科研热词 气候变化 统计降尺度 石羊河流域 海河流域 未来情景 参考蒸发蒸腾量 参考作物蒸发蒸腾量 sdsm
推荐指数 2 1 1 1 1 1 1 1
SDSM降尺度模型中文操作手册范本
Reviews typically group downscaling methodologies into four main types: a) dynamical climate modelling, b) synoptic weather typing, c) stochastic weather generation, or d) tran sfer-fu ncti on approaches.综述了典型组降尺度方法研究分为四种主要类型: 一)动力气候建模,B )的天气天气分型,C )随机天气生成,或D )的传递函数方法。
The SDSM software reduces the task of statistically dow nscali ng daily weather series into seve n discrete steps: 1) quality con trol and data tran sformati on; 2) scree ning of predictor variables; 3) model calibrati on;4) weather gen erati on (us ing observed predictors); 5) statistical an alyses; 6) graph ing model output;7) seenario generation (using climate model predictors).模型的校准,来源是美国国家环境预报中心( NCEP 再分析数据集-。
数据被重新-网格适Figure 2.1 SDSM \42 scenario ^vncrauon应HadCM :网格系统(图 22 )。
所有的预测(与地转风的方向,异常,见下文)进行标准化 与1961至1990的平均水平。
然而,日常的预测也为期1961 - 2000提供。
基于CMIP6的气候变化下资水流域径流响应研究
基于CMIP6的气候变化下资水流域径流响应研究隆院男;张雨林;蒋昌波;莫军成;黄春福;宋昕熠【期刊名称】《水土保持研究》【年(卷),期】2024(31)4【摘要】[目的]探究未来气候变化情景下资水流域的径流响应情况,为实现流域可持续发展、制定防洪抗旱决策提供科学支持。
[方法]基于3个CMIP6全球气候模式,通过构建流域SDSM降尺度模型和SWAT水文模型,预估了SSP1-2.6,SSP2-4.5和SSP5-8.5气候情景下资水流域2030—2089年的气温与降水变化,并进一步探究流域径流对气候变化的响应。
[结果]未来资水流域呈较显著暖湿化趋势,空间上流域全范围升温且以新宁、邵阳站附近增幅最大;降水增加区域主要集中在以冷水江为中心的中下游地区,减少区域位于洞口站以西。
在此背景下,未来桃江站与邵阳站年均径流与流域降水的变化趋势基本一致,邵阳站以上的上游区域可利用水资源量减小的可能性较大。
枯水期流域水资源将面临更加紧缺的风险,且汛期有提前的趋势,主汛期水资源分配的均匀程度将上升。
[结论]在气候暖湿化的背景下,资水流域水资源管理将遭遇更严峻的挑战,应加强水资源保护和流域综合管理。
【总页数】12页(P114-125)【作者】隆院男;张雨林;蒋昌波;莫军成;黄春福;宋昕熠【作者单位】长沙理工大学水利与环境工程学院;洞庭湖水环境治理与生态修复湖南省重点实验室;湖南省水利水电勘测设计规划研究总院有限公司【正文语种】中文【中图分类】P333.1;P467【相关文献】1.气候变化下石羊河流域上游产流区的径流响应研究2.基于CMIP5 RCP情景的清江流域径流对气候变化的响应研究3.气候变化与人类活动影响下大清河流域上游河流径流响应研究4.基于SWAT模型的修河上中游流域径流与气候变化响应研究5.基于流域气候水文模型的白龙江径流对气候变化的响应研究因版权原因,仅展示原文概要,查看原文内容请购买。
基于统计降尺度的长春市未来气候变化趋势分析
摘要:应用统计降尺度模型SDSM(Statistical Downscaling Model),对GCM 输出序列进行降尺度处理,生成长春市未来气候变化情景,并利用线性趋势、滑动平均、Mann-Kendall趋势分析等方法分析对2020s(2010-2039年)、2050s(2040-2069年)和2080s(2070-2099年)3个时期的气温和降水的变化特征进行了分析。
模拟结果表明,验证期(1976-1990年)内,长春市月平均日最高气温的实测值和模拟值拟合的很好,SDSM 模型能够较好的模拟生成长春市未来气候变化情景。
与基准期相比,2020s,2050s和2080s 最高气温平均分别上升1.67℃、3.44℃、5.65℃,最低气温平均分别上升1.07℃、2.68℃、4.69℃,平均日气温倾向率变化为0.63℃/10年;年降雨量也呈增加趋势,倾向率变化为11mm/10年;研究区未来气温和降雨量年内变化情况呈现不均匀性,春季降水量呈下降趋势,夏季降雨量呈现显著增加趋势,倾向率变化为12.7mm/10年,且相对于其他季节,夏季对全年降雨量的增加贡献最大,秋季降雨变化不显著,冬季增加趋势较平稳;与其他各季相比,气温在夏季的增幅最显著。
分析成果为进一步研究未来气候变化情境下长春市水资源状况提供理论基础。
关键词:气候变化;GCM;SDSM;长春中图分类号:TV124;P339 文献标识码:A 文章编号:1007-2284(2011)10-0047-04Climate Change Trends of Changchun City Using Statistical Downscaling Method in t he FuturezHAO Hui 1,zHANG Jing-ren2Abstract:The Statistical Downscaling Model(SDSM)is used to downscale the outputs of GCM togenerate fu climate change scenarios in Changchun Ci ty.And the characteristics of fu climatechange are analyzed by using linear trends,moving average and Mann-Kendall trend analysis methodsduring the 2020s(2010-2039),2050s (2040-2069),and 2080s(2070-2099).The results show thatit shows a good agreement between the observed and sim ulated mean daily maximum and minimumtemperatures,daily precipitation for every month of the year.The SDSM model can better simulatefu climate c hange scenarios in the research area.Compared with the baseline data of 1961-1990,the maximum temperature would increase by an average of 1.67℃,3.44℃,5.65℃in 2020s,2050sand 2080s,respectively,and the minimum temperature increases by an average of1.07℃,2.68℃,4.69℃.And climate trend rate is 0.63℃/10a.Yearly rainfall also showssignificantly increasing trend and climate trend rate reaches 11mm /10a.The monthly changes oftemperature and precipitation show heterogeneity in the fu.The pr ecipitation in spring showsdeclining trend,while it shows an increasing trend in summer,the climate trend rate reaches12.7mm/10a.And compared to other seasons,summer contributes to the maximum increase in theannual rainfall.Precipitation does not change significantly in autumn,and presents a steadilyincreasing trend in winter.The mean temperature shows a significantly inc reasing trend in thefu,especially insummer.The results serve as a scientific reference to further investigate theimpact of the climate change on water resources in Changchun City.Key words:climate change;GCM;SDSM;Changchun City目前,全球气候变化已引起了全世界各国政府和国内外学者的广泛关注。
- 1、下载文档前请自行甄别文档内容的完整性,平台不提供额外的编辑、内容补充、找答案等附加服务。
- 2、"仅部分预览"的文档,不可在线预览部分如存在完整性等问题,可反馈申请退款(可完整预览的文档不适用该条件!)。
- 3、如文档侵犯您的权益,请联系客服反馈,我们会尽快为您处理(人工客服工作时间:9:00-18:30)。
Reviews typically group downscaling methodologies into four main types: a) dynamical climate modelling, b) synoptic weather typing, c) stochastic weather generation, or d) transfer-function approaches.综述了典型组降尺度方法研究分为四种主要类型:一)动力气候建模,B)的天气天气分型,C)随机天气生成,或D)的传递函数方法。
The SDSM software reduces the task of statistically downscaling dailyweather series into seven discrete steps:1) quality control and data transformation;2) screening of predictor variables;3) model calibration;4) weather generation (using observed predictors);5) statistical analyses;6) graphing model output;7) scenario generation (using climate model predictors).模型的校准,来源是美国国家环境预报中心(NCEP)再分析数据集–。
数据被重新–网格适应HadCM3网格系统(图2.2)。
所有的预测(与地转风的方向,异常,见下文)进行标准化与1961至1990的平均水平。
然而,日常的预测也为期1961–2000提供。
缩减未来气候情景下四套的GCM输出是可用的:HADCM2,HADCM3,CGCM2,CSIRO。
三种排放情景:可用:CO2年均以每年1%的温室气体实验(HADCM2只),A2和B2两个SRES情景的温室气体,产生的硫酸盐气溶胶,和太阳辐射(HADCM3,CSIRO,CGCM2)。
3。
开始启动SDSM,在Windows桌面上的开始按钮,然后在程序,然后在SDSM(出现在上的一个小雨云可用的程序)。
下面的屏幕会出现:飞溅屏幕出现在未来(IE主菜单屏幕,将开始出现在盒子SDSM)单击“不再显示此屏幕再次。
如果进一步的信息在任何时间,在每个屏幕的顶部,请单击“帮助”按钮(用户可以通过关键词或任务搜索帮助的容)。
SDSM是由在每个屏幕的顶部栏中选择适当的按钮导航。
这些设置在同一逻辑顺序为SDSM关键功能。
在降尺度,用户应该检查的日期围,所有输入的数据类型和完整性。
建立工作环境点击扳手符号在主菜单的顶部(或任何其他屏幕顶部)访问settingsscreen(图3.3)。
3.2高级设置先进的设置是通过设置屏幕点击高级按钮在屏幕的顶部。
高级设置屏幕允许用户更改并保存偏好进一步降尺度模型(图3.4):模型转换:指定的变换应用在有条件的模型预测。
默认的(不)时使用的预测通常是分布式的(通常为每日温度的情况下)。
替代(第四根,自然对数逆正常)时使用的数据是倾斜的(如在日降水的情况下)。
请注意,逆正态变换采用观测预报量条件采样(见Wilby等。
2003)。
改造型记录在*。
PAR和*。
SIM文件来保证数据的一致处理后续方案和数据分析程序中。
方差膨胀:控制在缩减日常天气变量的方差膨胀幅度。
此参数变化的方差增加/减少的“白噪声”应用于局部过程模型的估计。
默认值产生近似正态方差膨胀(任何转换前)。
较大的值增加收缩性质的变化。
方差膨胀的–通过设置参数为零活性。
请注意,第四根和自然对数模型转换(见上文),这个参数也影响均值的变化。
偏置校正补偿任何倾向于过分–或在–估计条件过程均值的降尺度模型(例如,平均日降雨量)。
默认值是1,表示没有偏差校正。
条件选择:调整条件处理的方式(例如,降水量)进行采样。
默认的(随机)允许的结果是完全基于机会。
固定阈值允许用户增加一个条件事件的机会(通过设置阈值接近零),或减少的机会(通过设置接近1)。
优化算法:SDSM 4.2提供的优化模型–对偶单纯形的两种方法(如在早期版本的SDSM)和普通最小二乘法。
虽然这两种方法都给出了类似的结果,普通最小二乘法快得多。
用户也可以适当的方格打勾选择逐步回归模型。
逐步回归工作逐步包括更多的变量和选择根据一个或两个指标–Akaike信息准则的预测最简约的模型(AIC)和贝叶斯信息准则(BIC)。
设置文件:位于标准和先进的设置在一个用户定义的参考文件和目录举行。
一个新的或更新的设置文件被创建时,单击“保存”按钮在屏幕的顶部。
C:\ sdsm.ini设置文件自动加载时,SDSM启动。
按下重置随时重新加载原始设置,或回到设置屏幕,随后再返回上一屏幕。
4。
质量控制与数据转换一些气象站已完成和/或完全准确的数据集。
缺失和不完善的数据处理是最实用的情况下有必要。
在某些情况下,可能还需要变换数据模型校准之前。
SDSM使质量控制和数据转换。
4.1质量控制检查输入文件的丢失的数据和/或可疑值,从任何的主屏幕上点击按钮的质量控制。
下面的屏幕会出现:在“选择文件”按钮单击。
将一个打开的文档窗口–浏览直到你找到要在这个例子blogsville每日最高温度检查–目录和文件,tmax.dat。
在所需的数据文件然后点击打开。
激活的质量控制程序,在屏幕上检查filebutton点击。
以下确认将出现:点击OK按钮查看质量控制信息。
在这个例子中,有10957个值没有丢失的数据(即,没有缺失值的代码©Wilby和道森,2007页25 94–999进行检测)。
从6.7到34.8–ºC的数据围,并有一个平均13.1871ºC(见图4.3)。
点击重置按钮来清除屏幕的条目,或选择另一个文件来执行一个新的质量检查。
4.2数据转换数据进行变换,对变换数据按钮从任何的主屏幕上点击。
下面的屏幕会出现:在选择输入文件按钮。
一个打开的文档窗口将出现。
浏览到你处被转化–例如表面涡在英格兰东部的目录和文件,ncepp__zee.dat。
在所需的文件,单击。
如果有多个列输入数据(如天气发生器产生的合奏模拟的案例或生成场景的功能,见第7和10)输入输入文件框中的适当数量的列。
为了使变换后的数据与多个列的数据处理分析功能(8节),检查框下创建SIM文件。
如果用户希望从一个多列数据文件检查此屏幕上的液箱中提取单个集合成员。
进入乐团成员的数量要求和数据将被写入到所选择的保存文件。
请注意,在这种情况下,没有变换应用到提取的成员。
通过检查相应的按钮选择变换。
可变换包括:自然对数和log10,广场,立方体,第四大国,反演,滞后区间和二项式,连同上述的逆转换在适当的地方。
如果包选择(滞后N)的最后一个值作为滞后变换的第一个值;否则,丢失的数据标识符插入(注意负滞后值将数据转发,一个积极的滞后值将数据返回)。
落后的更改按钮是用来计算连续天之间的差异。
所有的转换可以应用到标准的预测变量的模型校准之前(6节),产生非–线性回归模型(例如,使用功率变换的多项式模型)。
在英格兰东部的数据,选择滞n,输入“–1”框中,并检查包装箱(这将产生一个没有缺失数据的变量的滞后–1系列)。
在“选择输出文件按钮。
将一个打开的文档窗口–浏览到所需的目录位置,输入转换数据的文件名,在这种情况下ncepzlagee.dat(即,在前一天的涡度),然后点击保存。
警示:用于转换文件的名称必须完全遵守本协议第2.4.1描述。
启动程序,对变换按钮在屏幕的顶部单击。
以下确认将出现:点击OK按钮回到变换数据文件屏幕。
点击重置按钮来清除屏幕的条目,或执行一个新的转型。
5。
筛选的降尺度预测变量识别之间的经验关系式预测指标(如平均海平面气压)和单站预报对象(如站降水)是所有的统计降尺度方法中往往是最次的过程中消耗的一步。
屏幕的变量选择的目的是帮助用户在模型校准适当的降尺度预测变量的选择(第6节)。
SDSM执行三个配套任务:季节相关性分析,偏相关分析,和散点图。
最终,然而,用户必须决定是否或不确定的关系,为的身体感(S)和预测量的问题。
在这件事情上,是无可取代的地方性知识。
探讨潜在的有用的预测–预报量的关系,从任何的主屏幕按钮单击屏幕上的变量。
下面的屏幕会出现:5.1安装程序在变量筛选操作的第一步是选择的预报量和预测的文件。
预报量的文件(例如,观察到的日最高气温,日降水总量,等)必须由用户提供,在SDSM格式(见2.4节)。
在“选择文件”按钮单击预测。
将一个打开的文档窗口–浏览到适当的目录已经找到了。
例如在预测数据文件–点击,最高气温在blogsville,tmax.dat,位于C:\ \ \ observed1961-90 blogsville SDSM。
遵循类似的程序,找到并选择所需的预测变量从下拉在屏幕中心窗口选择正确的驱动。
该驱动器上的可用的目录将出现在窗口的拖动窗口上方。
浏览直到适当的目录位于。
所有*。
此目录中的DAT文件然后是列出的在上面的窗口。
选择预测器,只需点击文件名–将高亮的蓝色。
所选择的变量的一个简短的定义是在预测描述窗口了。
对选择一个文件,点击它再次,它将不再被高亮显示。
预测变量选择的数显示在这个窗口(最多12个)。
在左–右边的屏幕屏幕菜单允许变量数据的分析周期的开始和结束日期必须改变。
默认的日期是在设置屏幕举行(见3.1节),在这种情况下,1961–1990。
如果开始日期和结束日期不在允许围,用户将被提示输入新值。
用户也必须选择季节性的子集从下拉窗口下选择分析周期。
可用的选项是年度(没有季节性亚–设置),冬季(十二月–二月),春季(3月–可能),夏季(六月–八月),秋季(九月–十一月),和个人的月。
三更多的行动是必要的分析之前发生。
首先,必须指定类型的过程。
如果预测–预测过程是不通过中间过程的调节(如在最高温度的情况下)然后点击无条件,否则选择条件(如沉淀在量取决于湿–天发生)。
其次,显著性水平的修改的要求。
这个值是用来测试预测的相关性–预测的意义。
默认情况下,P<0.05(5%)。
最后,如果用户想自回归项被包括在计算中的自回归模型的选择应选择。
一旦上述已被指定,SDSM准备分析所选用的预测预报量的关系–(S),用于指定子–期(S)。
5.2时间变化的预测强度分析按钮是用来研究变异的具体预测–预测器对解释的百分比。
个人的预测强度经常变化明显的逐月的基础上(参见图5.2)。
用户应该是明智的,因此,关于最适当的组合(S)的预测(S)对于一个给定的季节预报系统。
如上所述,当地的知识基础,也是宝贵的确定合理组合预测时。