netapp system health check
NetApp 数据存储指南说明书
Our customers are doing life-saving, game-changing, culture-shifting work. They have to get data storage right. There’s no time for do-overs.Read on to learn how to dodge a data storage do-over.Get startedThe do’s and don’ts of data storage – from our customers’ point of viewThe wise guide:030405060708091011121314Table of contentsOverviewYour data experts Story | Be The Match Protected & secure Story | Shibaura Institute Efficiency & sustainability Story | AMDStorage that evolves C-Series A-SeriesEF-Series | All-SAN Get data storage rightData challenges are more demanding than ever.These days, you’re expected to:The only way to dodge a data storage do-over is a partnership with NetApp.Do more with less investment Stay ahead of cyber riskActualize every opportunity for efficiency and sustainabilityWe’ve never met a data challenge we didn’t likeDo more with less investment Stay ahead ofcyber riskActualize everyopportunity forefficiency and“We have over a petabyte of datathat we’ve pulled in out fromunder the desks of researchersand into the data center— givingresearchers data performance,reliability, and availability.”Eric SedoreChief Technology Officer,Syracuse UniversityCustomerThe undertaking:Helping patients diagnosed with blood cancer match up with a bone marrow transplant donorThe means:Matching patients to 41 million potentially life-saving donorsThe technology:NetApp® A-Series AFF A700 array and ONT AP® and SnapCenter® software power this global registryThe upshot:Twice as many matches per year with NetAppBe The MatchIncreasing the potential for blood cancer cures41 millionpotential donors120,000+bone marrow transplants2xmatches per yearDo #1Reduce complexity for your IT teams. NetApp helped Be The Match migrate from legacy systems, increasing overall efficiency. Care teams can now easily search global databases for possible donor matches.Do #2:Make sure that sensitive data is secure with the built-in security features of NetApp ONT AP . Be The Match protects patient and donor data, safeguarding its mission from potentially devastating data breaches.Don’t #1:Don’t forget that everything comes back in style. Ten years ago, Be The Match rebuilt their data infrastructure withNetApp. Fast forward to today , and NetApp has taken its deep understanding of Be The Match’s operations and deployed AFF A-series systems, facilitating even more life-saving matches.Don’t #2:Don’t needlessly complicate your team members’ lives.Because Be The Match had a history with NetApp, their team was completely familiar with the software. What does that mean? IT can now replicate and back up data with a simple click of a button, saving time—which ultimately saves lives.Multilayered protection for multilayered cyberthreatsEncrypt data in flight and at rest and prevent data destruction with efficient, immutable, and indelible copies to secondary orobject storage Quickly detectanomalies throughAI-powered monitoringand immediatelyrespond to threatswith snapshotrecovery pointsRestore data inseconds or minutes toget back online – whileconducting detailedforensic analysis toidentify and closesecurity gaps“We want our users to beunaware of IT and just be able toaccess and store theirdata—today, tomorrow, or 5 yearsfrom now. NetApp solutions justrun, and the data is safe. We canmeet the high demands of adata-driven hospital with a smallteam. That’s worth a mint.”Maria StreyHead of IT,Klinikum Freising Medical System06Do #1Learn from the past. Shibaura suffered a debilitatingransomware attack in 2016, which prompted them to modernizetheir IT infrastructure with NetApp all-flash storage. This solution incorporates cybersecuritytechnology to protect information where it counts—at the data layer.Do #2:Employ AI technology where it can make the most impact. NetApp AI capabilities learn to assesspatterns and can detect unusual user behavior, triggering an instant data backup withSnapshot™ software protecting sensitive data in case of a breach.Don’tDon’t assume that someone else is protecting you from hackers. Ransomware attacks jumped an alarming 57% in Japan in one year . Shibaura partners with NetAppbecause they trust its cybersecurity technology and are confident that it will evolve along with the institute’s hybrid cloud environment,protecting students and faculty today and well into the future.The undertaking:Protect 10,000+ students andfaculty of the renowned Japanese university from cyberattacks when threats are at an all-time high The means:Implement multilayered storage security and AI technology at the server level to safeguard user data60%data reduction10,000+students & faculty protectedCustomerShibaura Institute of TechnologyDeveloping engineers for a more innovative worldStory 01Operate a more efficient & sustainable data centerMaximize data center efficiency and reduce rack space by up to 95%Right-size data storagein the cloud andon-prem to save up to40% on TCOCut your carbonfootprint and reducepower and coolingcosts by up to 85%“Glass production is a high-energybusiness, and SCHOTT aims forclimate neutrality by 2030. NetAppstorage needs less space andenergy so that IT can contribute aswell to our zero-carbon target”Michael SchachingerIT Location Manager,SCHOTT Schweiz AG08CustomerThe undertaking:Leverage cloud-based electronic design automation (EDA) to increase productivity and foster innovation The means:Transform data centers to accelerateAMD’s time-to-market and increase itsability to run more efficient optimizedsimulations and drive top-line growthThe technology:Azure NetApp Files, NetApp EDA DesignAnywhere, and NetApp Advancesolutions enable teams to innovate fromedge to core to cloudThe upshot:AMD upholds its market leadershipposition through its most efficientsemiconductor production to dateAMDPowering modern computing through leading-edge semiconductor designfast + easy migration with Azure NetApp Files Story 01Story 02Story 03NextBack09Storage thatevolves as you grow the business "We’re ready to pursue a trulycloud-first approach, but without compromising on cost or security. And NetApp enables that. It enables freedom of choice."Daniel McLoughlanTechnical Services Manager,Westfund Health Insurance10Reduce up to 95% of rack space with high-density capacity flashBuild efficiency with data reduction:4:1 for SAN workloads 1.5:1 for NAS workloads 3:1 for VMware, Hyper V , and KVM workloads on NASSafeguard your data with autonomousransomware protection and preemptive detection against attacksThe capacity flash collectionDiscover C-SeriesC-SeriesThe high-performance flash collection A-SeriesSet up and configure a complete system and serve data within 10 minutes Minimize your data center footprint by storing up to 2PB of data in a 4U compact system Save SSD storage by 5 to 10 times with inline data reduction technologiesDiscover A-SeriesSeamlessly apply any automation built for your unstructured data environment to your block environmentGet a 99.9999%availability guarantee – at no additional costEnsure your mission-critical data is secure and always available, backed by NetApp’s SixNines Data Availability *Modernize your SAN with the powerful performance that’s ready for any workload.Streamline provisioning and simplify SAN workload management whileenjoying storage savings with 4:1 storageefficiency – guaranteed*The simple, dedicated block storage collectionDiscover All-Flash SAN ArraysThe Six 9s Data Availability Guarantee is subject to terms and conditions.*Terms and conditions apply.All SAN ArraysIt’s never too late to get data storage right.We’re always up for some friendly competition.See for yourself how NetApp can help you dodge the data storage do-over.Pure vs. NetAppData storage solutionsThings to consider:Can your data keep up with performance demands?How cyber resilient is your storage environment?Are you keeping your TCO in check?Is your IT infrastructure designed to evolve?Connect with a flash specialistNext Back14About NetAppIn a world full of generalists, NetApp is a specialist. We’re focused on one thing, helping your business get the most out of your data. NetApp brings theenterprise-grade data services you rely on into the cloud, and the simple flexibility of cloud into the data center. Our industry-leading solutions work across diverse customer environments and the world’s biggest public clouds.As a cloud-led, data-centric software company, only NetApp can help build your unique data fabric, simplify and connect your cloud, and securely deliver the right data, services, and applications to the right people—anytime, anywhere.©2023 NetApp, Inc. All Rights Reserved. NET APP, the NET APP logo, and the marks listed at /TM are trademarks of NetApp, Inc. Other company and product names may be trademarks of their respective owners. NA-1041-0523Back15。
TCPIP 网络编程-Health check服务端

nCol表示要插入列的列号。 (从0开始) 表示要插入列的列号。 开始) 表示要插入列的列号 开始 lpszcolumnHeading 为列标题的字符串 nFormat 指定列对齐方式的整数 缺省值是左对齐。 指定列对齐方式的整数,缺省值是左对齐 缺省值是左对齐。 (LVCFMT_LEFT,LVCFMT_RIGHT或LVCFMT_CENTER) , 或 ) nWidth 以像素为单位的列宽。缺省值为-1,表示没有设置列宽。 以像素为单位的列宽。缺省值为 ,表示没有设置列宽。 nSubItem 与列相关联的子项的索引。缺省值为 ,表示没有子项与 与列相关联的子项的索引。缺省值为-1, 列相关。 列相关。
Page 15
常州信息职业技术学院
1. 添加列表控件
将List Control 控件拖到对话框上
Page 16
常州信息职业技术学院
2. 修改属性为 修改属性为Report
将该控件的视图类型修改为Report, , 将该控件的视图类型修改为 这样控件看上去想一个报告表格
Page 17
常州信息职业技术学院
常州信息职业技术学院
1. 列表控件 简介 列表控件-简介
列表控件主要用于显示
数据报表 列表信息 图标信息
Page 13
常州信息职业技术学院
1. 列表控件 简介 列表控件-简介
第0行
第0列
Page 14
第4列
常州信息职业技术学院
健康检查器应用程序用户指南说明书

Health Inspector – User GuideOverview (3)Health Inspector Installation (4)Health Inspector App (4)Health Inspector Results (4)Files (5)Health Inspector Configuration (6)Test Class Audit Parameter (Test_Class_Audit_Parameters__mdt) (6)Global Settings (Global_Settings__c) (12)Scheduling Health Inspector (14)Create Custom Class to Schedule (14)Create Schedule (14)Additional Configuration Options (16)Executing Batch Manually (16)Implement Extension Class (16)Re-Run Last Test Generated (17)Best Practices (18)Page | 2The Health Inspector application was designed to notify a defined set of users of the general “health” of your Salesforce instance’s test classes and code coverage. The Health Inspector is an extremely lightweight application that sends an email notification, at a customizable interval, which documents: •Any test class failures•Confirmation of test classes running longer than a configurable second count•The overall code coverage of the environment and whether it is below a user defined threshold •Flow code coverageLastly it documents the long running Apex Classes & Methods which can be used not only as a reference but also as a baseline for future executions.The Health Inspector app not only notifies a defined set of users but it can also generate a file which contains the results of the execution so you can monitor your results over time or refer back to any previous executions.The application was designed to be administered with simple configuration updates, rather than via code, and can be completely managed via the Salesforce setup menu.Page | 3Page | 4Health Inspector InstallationThe Health Inspector package can be installed from the following AppExchange listing:https:///appxListingDetail?listingId=a0N3A00000FMkhsUAD During the installation process, leave all selected defaults and install for Administrators only. Health Inspector AppAfter installing Health Inspector, you will be able to select the Health Inspector app from the App Launcher:There are two tabs by default in this app – ‘Health Inspector Results ’ & ‘Files ’.Health Inspector ResultsThe Health Inspector Results tab is designed to be the “one stop shop” for managing the application. This screen provides information relevant to:• The last execution of the Health Inspector app (pass or fail)• The resulting status of the last execution• Easy way to view all available configurations• Quick links to manage all configurations or edit individually• Ability to run a one-off execution of a configuration• Quick access to any files generated from executionsPage | 5FilesThis is the native Salesforce Files tab. If you have set Health Inspector to generate files on success/failure, you will be able to see those records on this tab.Health Inspector ConfigurationUpon installation of the Health Inspector application, one Custom Metadata Type record is created: •Test Class Audit Parameter (Test_Class_Audit_Parameters__mdt)Additionally, there is one Custom Setting that can be configured to store details around the last execution of the application:•Global Settings (Global_Settings__c)Below is a summary of the Custom Metadata Type & Custom Setting and how they are used in conjunction with the application.Test Class Audit Parameter (Test_Class_Audit_Parameters__mdt)The ‘Test Class Audit Parameter’ Custom Metadata Type (CMDT) is used to drive the core functionality of the Health Inspector application. Within this CMDT, the following can be configured: •Cadence of the app’s execution•Recipients of the email notifications•Code coverage tolerance amount•Contents of the success & failure email alerts•Code coverage running user•Generation of success or failure File creationUpon installation of the application, two entries will be created: ‘Default’& ‘DefaultWithFlow’. The difference between these two are that the ‘DefaultWithFlow’ entry contains language in the template to support the Flow Code Coverage functionality. Whereas the ‘Default’ entry has language specific to standard code coverage – not including flow. These entries are fully customizable so they can be modified to your exact use case. There is also the option of creating a new entry to support your individual requirements.To create a new or update the existing CMDT entries, na vigate to the Setup menu and type in ‘Custom Metadata Types’ in the search box and select that from the menu. In the resulting screen, find the ‘Test Class Audit Parameter’custom metadata type and click the ‘Manage Records’ link next to it:From the resulting screen, to create a new entry click the New button or to edit one of the existing, click the Edit link to the left of the ‘Default’ or ‘DefaultWithFlow’ entry. For most organizations, one of the Default entries should be used, as it contains the HTML for both the Health Inspector success and failure email templates. For users who are comfortable with HTML, you can feel free to create a new CMDT record and create your own email content.Page | 6Page | 7In the next screen, the following field should be populated based on your requirements:•Information Section o Label - (Required )▪ Enter an intuitive name for the Health Inspector entryo Test Class Audit Parameter Name – (Required )▪ This will default based on the Label value that was provided▪ Note: you will need this value to schedule the Health Inspector in a subsequentstepo Duration Tolerance (seconds)▪ This should be the number of seconds the test should run – for example, if thetest runs longer than X seconds, include it in the notification▪ For reference, 10 seconds is usually a baseline that can be used to determine ifthere is a long running classo Email Distribution▪ Enter the email address or addresses (comma delimited) that should receive theHealth Inspector email resultso Ignore Errors▪ Enter any errors that should be ignored by the Health Inspector logic. Forexample, NO_MAIL_PERMISSION, NO_MASS_EMAIL, etc.o Check Audit Increments – (Required )▪ Enter the minute(s) on the hour that the Health Inspector should be run▪ For example, a value in this field of “1;15;30;45” during the 12:00 hour willexecute at 12:01, 12:15, 12:30 & 12:45o Code Coverage Tolerance*** Important Note ***When upgrading Health Inspector, it will not add newly created fields to existing page layouts. If you don’t see any of the fields listed below on your CMDT setup, it’s likely because they just need to be added via the page layout.▪Enter a numeric value (up to 100) that indicates the code coverage percentage that should be used as a baseline to compare the org’s overa ll test class coverageagainst.▪For example, a value of “90” in this field would mean that if the overall code coverage of the org falls below 90%, this will also show as a notification in theHealth Inspector email alerto Flow Code Coverage Tolerance▪Only applicable if ‘Flow Code Coverage’ is enabled▪Enter a numeric value (up to 100) that indicates the flow code coverage percentage that should be used as a baseline to compare the org’s overall flowcode coverage against.▪For example, a value of “90” in this field would mean that if the overall flow code coverage of the org falls below 90%, this will also show as a notification in theHealth Inspector email alerto Extension Class▪If desired, an extension class can be referenced here which allows the data that is collected as part of the execution can be used in a post process o Administrator Email▪Enter the email address of your primary Salesforce administrator. This information will appear in the footer of the email message that is sent.o Administrator Name▪Enter the name of your primary Salesforce administrator. This information will appear in the footer of the email message that is sent.o Administrator Title▪Enter the title address of your primary Salesforce administrator. This information will appear in the footer of the email message that is sent.o Save File on Success▪If checked, when the app runs, it will create a date & time stamped Salesforce File which includes the contents of the success email that is generated on the specificexecutiono Save File on Failure▪If checked, when the app runs, it will create a date & time stamped Salesforce File which includes the contents of the failure email that is generated on the specificexecutiono Protected Component▪Leave the default value of false/unchecked•Failure Email Sectiono Fail Email Subject▪Enter the Subject line of the email that is sent with the Health Inspector failure resultso Send Email on FailurePage | 8▪Indicates whether an email should be sent if a failure is foundo Fail Email Template▪Contains the HTML body of the failure email message that will be sent via the Health Inspector app▪The ‘Default’ CMDT record contains a preconfigured template howev er this can be adjusted to meet your specific needs•Success Email Sectiono Success Email Subject▪Enter the Subject line of the email that is sent with the Health Inspector success resultso Send Email on Success▪Enter the Subject line of the email that is sent with the Health Inspector failure resultso Success Email Template▪Contains the HTML body of the success email message that will be sent via the Health Inspector app▪The ‘Default’ CMDT record contains a preconfigured template however this can be adjusted to meet your specific needs•Code Coverage Section (optional)o Calculate Flow Code Coverage▪Indicates whether a calculation of flow code coverage should be done as part of the Health Inspector execution▪Important Note: Requires a Connected App, Auth Provider & Named Credentials to be created to work as intended•Creating a Connected App:https://sforce.co/2D71HWd•Setup an Auth Provider:https://sforce.co/333ZZQ3•Create Named Credentials: https://sforce.co/37mxpwLo Calculate Code Coverage▪Indicates whether a calculation of code coverage should be done as part of the Health Inspector execution▪Important Note: Requires a Connected App, Auth Provider & Named Credentials to be created to work as intended•Creating a Connected App:https://sforce.co/2D71HWd•Setup an Auth Provider:https://sforce.co/333ZZQ3•Create Named Credentials: https://sforce.co/37mxpwLo Named Credential▪Enter the name of the Named Credential that was created to support the Calculate Code Coverage functionality▪Only required if using this functionalityOnce all the information has been entered, click the Save button.Page | 9Page | 10If you are creating more than one configuration for the Health Inspector app, simply repeat these steps until a custom metadata type record has been created for each individual scenario.Sample email result when using the ‘DefaultWithFlow’ option provided within the app:Page | 11Page | 12Global Settings (Global_Settings__c)The ‘Global Settings ’ Custom Setting is used to house the last successful run date/time and status of the Health Inspector application.T he application will automatically create a Custom Setting record on its initial run however if you’d like to set initial values, navigate t o the Salesforce Setup menu and type in ‘Custom Settings’ in the search box and select that from the menu. In the resulting screen, click on the Manage link to the left of the ‘Global Settings’ entry:Next, click on the ‘New’ button at the top of the screen. Do not click the ‘New’ button found right above the list view as these two buttons result in varying setups.After clicking ‘New’, you will be brought to a screen that shows a ‘Last Run Date/Time’ field and a ‘Last Run Status’ field. You can leave both fields null and just click the ‘Save’ button.Page | 13As you finalize the Health Inspector setup and the app runs, the values from your execution will write back to this Custom Setting. In doing so, those values will then be shown on the ‘Health Inspector Results’ tab found within the application.Scheduling Health InspectorCreate Custom Class to ScheduleIn order to schedule the Health Inspector application to run on a custom CMDT entry: •Go to the Developer Console → File → New → Apex Class•Enter a name for the classo For example, if you’re CMDT entry is called ‘MyTest’, then perhaps give it a name of ‘HealthInspector_MyTest’•Click OK•Overwrite the default class text with the following:*The “HealthInspector_MyTest’ value should be replaced with the name you gave the class in the second step**The “Default” value in the above snippet should be replaced with the name of the CMDT that was configured as part of the setup process.Create ScheduleTo schedule the ‘Default’or ‘DefaultWithFlow’ entry:•Go to the Salesforce Setup menu•Search for ‘Apex Classes’ in the left-hand navigation and select it•Click on the ‘Schedule Apex’ button•From the resulting screen, enter the following information:o Job Name = <Enter intuitive name for the schedule>Page | 14o Class Name▪If you are using the ‘Default’ CMDT, then se lectHealthInspectorScheduler_Default▪Else, if you are using the ‘DefaultWithFlow’ CMDT, then selectHealthInspectorScheduler_DefaultWithFlow▪Otherwise, you’ll want to select the class that was defined/deployed in the ‘Create Custom Class to Schedule’ section.o Select the appropriate frequency for executiono Click SavePage | 15Additional Configuration OptionsThere are a few additional configuration options available in the Health Inspector application – executing the batch manually, implementing an extension class and re-running the last test that was generated.Executing Batch ManuallyIn some instances, you may want to manually execute the Health Inspector app to verify your configuration before putting it on a scheduled frequency. In order to do this, simply go to the Developer Console → Debug → Open Execute Anonymous Window and paste the following:*The “CMDT Name” value in the above snippet should be replaced with the name of the CMDT that was configured as part of the setup steps.Implement Extension ClassIn some instances, you may want to take the data collected by the Health Inspector application and use that in a secondary process. The application allows you to do this by referencing an Extension Class which is configured in the Test Class Audit Parameter CMDT. The Extension Class should reference the processResults method to return this information. For example:*The “SAMPLE DEBUG” value in the above snippet can be replaced with any debug information that should be written out at the time of its executionPage | 16Re-Run Last Test GeneratedIn some instances, you may want to re-rerun the last test that was generated. In order to do this, you can simply run the following snippet via the Developer Console:*The “Default” value in the above snippet should be replaced with the name of the CMDT that was configured as part of the setup process.Page | 17Best PracticesIn some cases, you may find that the Health Inspector executions result in a ‘UNABLE_TO_LOCK_ROW’ error which is caused by tests attempting to run in parallel and ultimately caused by record contention between more than one test. To alleviate this issue, follow the steps found at the following link under the ‘Best Practices for Parallel Test Execution’ section:•https:///docs/atlas.en-us.apexcode.meta/apexcode/apex_testing_best_practices.htmPage | 18。
10netapp存储配置练习_检查健康状态与性能
NetApp存储基础学习汇总(第十部分)目录一、检查状态及性能 (1)1.1、概述 (1)1.2、几个有用的管理命令 (13)1.3、使用statit命令 (15)1.4、执行特殊的BOOT命令 (17)二、检查状态及性能管理 (25)2.1、检查系统 (25)2.1.1、sysconfig (25)2.1.2、sysstat (28)2.1.3、与优化CPU性能的options命令 (28)一、检查状态及性能1.1、概述●识别管理权限命令(priv admin)●解释管理权限命令的功能●定义一些对于管理员非常有用的普通命令命令行提供4种类型的命令用于基本的系统管理或者排错。
●普通权限的管理命令用于日常管理●高级权限的管理命令用于特殊任务,比如系统调优、测试、统计等。
这种命令如果使用不当可能毁坏数据,所以推荐别在高级权限模式长时间停留。
●Options类的命令●Flash启动命令在设备启动阶段可以获得普通权限的命令在命令行打问号可以获得提示,主要是为了磁盘管理、网络和系统管理、物理或者虚拟接口管理等。
下面是一系列普通权限的命令:Configuration类—黄色的是这一类命令一些命令解释(software、source):Disk Management类一些命令解释,storage命令详解:System and networking Management类一些命令解释:Service and protoocls类Files and diretories类Device control类1.2、几个有用的管理命令1.3、使用statit命令Statit命令生成一个报告,内容是详细的系统利用率,由于输出内容很多,所以最好捕捉输出到文件或者可滚动的屏幕。
只有在高级管理状态才可以使用此命令。
statit命令可以查看以下内容:●CPU statistics●Multiprocessor statistics●CSMP domain switches●Miscellaneous statistics●WAFL® statistics●RAID statistics●Network interface statistics●Disk statistics●Aggregate statistics●Spares and other disks●FCP statistics●iSCSI statistics●Tape statistics1.4、执行特殊的BOOT命令如何访问特殊boot命令,当执行了halt或者reboot命令后,按CTRL+C后就可以进入特殊boot命令。
如何在Docker中实现容器的健康检查
如何在Docker中实现容器的健康检查在当前快速发展的云计算和容器技术领域,Docker作为最流行的容器化解决方案,已成为软件开发和部署的首选。
然而,对于任何运行中的应用程序而言,如何保证其持续可用性和健康状态自然是一个重要问题。
在Docker中实现容器的健康检查,成为了容器管理的关键环节。
容器的健康检查可以通过多种方式实现,本文将探讨几种常见和有效的方法。
1. 内置的健康检查功能Docker自身提供了内置的健康检查功能,通过在Dockerfile中添加HEALTHCHECK指令,可以自定义容器的健康检查逻辑。
例如,在一个Web应用容器中,可以通过在Dockerfile中添加HEALTHCHECK指令,来检查HTTP服务的可用性。
通过指定检查间隔和超时时间等参数,Docker将周期性地执行指定的命令或脚本,以检查容器健康状态。
如果命令执行成功,返回值为0,表示容器健康;否则,返回非零值,表示容器不健康。
2. 使用第三方工具除了Docker自带的健康检查功能外,还可以使用一些第三方工具来实现更加复杂和灵活的健康检查。
例如,Prometheus是一种流行的监控和告警工具,它可以通过HTTP接口来检查容器的健康状态。
通过在容器内置一个轻量级的Prometheus 客户端,可以提供更加灵活的健康检查功能。
此外,还有一些专门用于容器健康检查的开源工具,例如Consul、Nagios等,它们可以提供更加细粒度和全面的健康检查方案。
3. 结合容器编排工具在大规模容器集群的管理中,使用容器编排工具如Kubernetes可以更方便地实现容器的健康检查。
Kubernetes提供了灵活而丰富的健康检查配置选项,包括使用HTTP请求、TCP连接和执行命令等方式来检查容器的健康状态。
通过在容器的配置文件中定义这些检查方式和参数,Kubernetes可以根据实际情况自动检测和更新容器的健康状态,并根据结果进行相应的调度操作。
NetApp常用检查命令

vol status 查看卷状态
vol status -r 查看卷详情
lun show
lun show -v 查看LUN信息
igroup show 查看igroup信息
df -Vh 查看卷空间
df -Ah 查看aggr空间
snap list 查看快照情况
rdfile /etc/messages 查看系统日志信息
*************************************
关于控制器切换接管:(会发生Ip切换)
再通过partner命令进入另一控制器,输入上面所有命令
cf takeover -f 接管对端
cf giveback -f 恢复对端
fcp status 查看FCP服务是否开启
fcp show initiator 查看FCP连p show 查看map情况
igroup show -v 查看map详情
lun show -m 查看lun的map情况
sysstat -x 2 查看系统当前性能信息
常用检查命令
environment status 查看环境信息
version 查看OS版本
sysconfig -v 查看系统信息(设备序列号 系统软、硬件信息等)
sysconfig -a 查看系统信息详情
sysconfig -av
sysconfig -r 查看RAID信息(spare盘及故障硬盘会在这里显示)
halt 关闭
reboot 重启系统
license 查看许可信息
cf status 查看HA状态
使用Docker技术进行容器健康检查指南
使用Docker技术进行容器健康检查指南随着云计算和容器化技术的快速发展,Docker已成为最受欢迎的容器化解决方案之一。
然而,为了确保应用程序在容器中的可靠性和稳定性,进行容器健康检查变得至关重要。
本文将介绍如何使用Docker技术进行容器健康检查,以确保您的应用程序始终保持健康。
一、理解容器健康状态在开始进行容器健康检查之前,我们首先要理解容器健康状态的概念。
Docker 容器具有健康状态,用于指示容器是否正常运行。
健康状态有三种:健康(healthy)、正在进行健康检查(starting)和不健康(unhealthy)。
当容器处于健康状态时,表示应用程序正常运行。
当容器正在进行健康检查时,表示容器正在启动过程中。
当容器不健康时,则可能出现了故障或应用程序崩溃。
二、实施容器健康检查1. 使用健康检查命令Docker提供了健康检查命令,可以使用这些命令执行容器健康检查。
通过在Dockerfile中添加健康检查命令,可以在创建容器时自动执行检查。
例如,可以通过以下命令检查一个Web服务器容器是否能够正常响应HTTP请求:`HEALTHCHECK CMD curl --fail http://localhost:80 || exit 1`该命令使用curl命令检查localhost的80端口是否可以成功访问,如果无法正常访问,则健康检查失败。
2. 设置健康检查间隔除了执行健康检查命令外,还可以设置健康检查的间隔时间。
默认情况下,Docker每30秒执行一次健康检查。
可以通过在Dockerfile中添加`HEALTHCHECK`指令来自定义检查间隔时间。
例如,可以使用以下指令设置每10秒执行一次健康检查:`HEALTHCHECK --interval=10s`3. 设置健康检查重试次数为了增加容器健康检查的可靠性,可以设置健康检查的重试次数。
默认情况下,Docker重试健康检查3次,如果连续3次都失败,则将容器标记为不健康状态。
NetApp E-Series CLI命令手册说明书
命令A-ZSANtricity commandsNetAppJuly 28, 2023This PDF was generated from https:///zh-tw/e-series-cli/commands-a-z/activate-asynchronous-mirroring.html on July 28, 2023. Always check for the latest.目錄命令A-Z. . . . . . . . . . . . . . . . . . . . . . . . . . . . . . . . . . . . . . . . . . . . . . . . . . . . . . . . . . . . . . . . . . . . . . . . . . . . . . . . 1答. . . . . . . . . . . . . . . . . . . . . . . . . . . . . . . . . . . . . . . . . . . . . . . . . . . . . . . . . . . . . . . . . . . . . . . . . . . . . . . . . . . 1c. . . . . . . . . . . . . . . . . . . . . . . . . . . . . . . . . . . . . . . . . . . . . . . . . . . . . . . . . . . . . . . . . . . . . . . . . . . . . . . . . . . 18D. . . . . . . . . . . . . . . . . . . . . . . . . . . . . . . . . . . . . . . . . . . . . . . . . . . . . . . . . . . . . . . . . . . . . . . . . . . . . . . . . . 126e. . . . . . . . . . . . . . . . . . . . . . . . . . . . . . . . . . . . . . . . . . . . . . . . . . . . . . . . . . . . . . . . . . . . . . . . . . . . . . . . . . 177G. . . . . . . . . . . . . . . . . . . . . . . . . . . . . . . . . . . . . . . . . . . . . . . . . . . . . . . . . . . . . . . . . . . . . . . . . . . . . . . . . . 186我. . . . . . . . . . . . . . . . . . . . . . . . . . . . . . . . . . . . . . . . . . . . . . . . . . . . . . . . . . . . . . . . . . . . . . . . . . . . . . . . . 187 l. . . . . . . . . . . . . . . . . . . . . . . . . . . . . . . . . . . . . . . . . . . . . . . . . . . . . . . . . . . . . . . . . . . . . . . . . . . . . . . . . . . 189 R. . . . . . . . . . . . . . . . . . . . . . . . . . . . . . . . . . . . . . . . . . . . . . . . . . . . . . . . . . . . . . . . . . . . . . . . . . . . . . . . . . 191 S. . . . . . . . . . . . . . . . . . . . . . . . . . . . . . . . . . . . . . . . . . . . . . . . . . . . . . . . . . . . . . . . . . . . . . . . . . . . . . . . . . 243 V. . . . . . . . . . . . . . . . . . . . . . . . . . . . . . . . . . . . . . . . . . . . . . . . . . . . . . . . . . . . . . . . . . . . . . . . . . . . . . . . . . 620命令A-Z答啟動非同步鏡射「activate storageArray facture’命令會啟動「非同步鏡射」功能。
在.NETCore中实现健康检查

在.NETCore中实现健康检查在.NET Core 中实现健康检查.NET Core中提供了开箱即⽤的运⾏状况检查,⾸先,我将在.NET Core API应⽤程序中执⾏运⾏状况检查,接下来,我们将使⽤DbContext集成SQL Server或数据库的运⾏状况检查,最后是如何实现⾃定义服务的运⾏状况检查。
在 Core中实现健康检查要实现运⾏状况检查,您需要在项⽬中安装Microsoft.AspNetCore.Diagnostics.HealthChecks。
接下来,在ConfigureServices⽅法中添加运⾏状况检查中间件。
public void ConfigureServices(IServiceCollection services){services.AddHealthChecks();services.AddControllers();}然后修改Configure⽅法,使⽤中间件:public void Configure(IApplicationBuilder app, IWebHostEnvironment env){eEndpoints(endpoints =>{endpoints.MapControllers();endpoints.MapHealthChecks("/health");});}现在,准备⼯作完成,运⾏程序然后访问 /health, 您将看到下边结果:HealthCheckService.NET Core提供了⼀个HealthCheckService类,我们可以把健康检查的放到我们的控制器中,就像这样:public class HealthController : ControllerBase{private readonly ILogger<HealthController> _logger;private readonly HealthCheckService _healthCheckService;public HealthController(ILogger<HealthController> logger,HealthCheckService healthCheckService){_healthCheckService = healthCheckService;_logger = logger;}[HttpGet]public async Task<IActionResult> Get(){var report = await _healthCheckService.CheckHealthAsync();return report.Status == HealthStatus.Healthy ? Ok(report) :StatusCode((int)HttpStatusCode.ServiceUnavailable, report);}}现在,如果您尝试访问/health,您将看到相同的结果。
NetCheck使用说明书
NetCheck使用说明一、原理Netcheck是CTI平台开发的网络检测工具,用于检测两台机器之间网络是否正常。
平台各服务器间使用ICDCOMM通迅,ICDCOMM底层用TCP/IP通迅,因此检查出TCP/IP通迅不畅后即可定位为网络问题而不是平台程序问题。
netcheck分服务端和客户端,相互间通过TCP/IP通迅。
客户端向服务端的监听端口发起连接,客户端连到服务端后匀速向服务端发消息,具体过程是发完一个消息后延时50ms再发另一消息,即一秒钟最多能发20条消息,每条消息有唯一的序列号标识,标识从0开始每次加1。
服务端收到客户端的消息后判断1秒内收到消息的条数,当条数在20条左右时认为正常,具体是多少条为正常在配置文件中配置。
因不同网络传输时延有所不同,机器处理性能也有所不同,因此收到合法条数的下限有区别,如有的网络每秒只能收到16条消息包,但有的网络每秒可收到17条消息包。
NetCheck服务端最多支持八个客户端连接,消息从客户端发往服务端,服务端不会发消息到客户端。
一个目录下的netcheck只能启一个netcheck程序,需要运行多个netcheck程序时需新建目录将netcheck.exe、netcheck.log文件拷入,并修改配置文件后再运行。
目的是为了每个netcheck都能正确的记录下日志。
二、配置配置文件与可执行程序在同一目录,文件名为netcheck.ini。
配置文件中有各配置项说明,在此强调三点:a.服务器端口配置时不能配置为icdcomm使用的端口,否则可能会引起icdcomm异常。
b.消息内容长度字段必须保证服务端与客户端一致,否则netcheck检查消息内容时会出错。
一般用默认值34就可以了,不必修改。
需要修改时最好保持DataLen值加上14(消息头长度)的和能被16整除,这样有利于分析抓包结果。
c.客户端需要配置客户端IP地址,因为机器可能有多个IP,当不指定IP时系统默认用第一个IP,而此IP并不是用户想检查的IP。
NetApp维护手册

netapp存储系统维护手册目录目录NetApp存储系统 (3)系统基本维护指南 (4)系统基本状态查看 (4)管理License (4)配置、触发、查看Autosupport (4)设置时区、时间和日期 (5)停机及重新启动 (5)管理及创建卷 (5)管理及创建Qtree (6)磁盘配额 (7)SnapShot的配置和管理 (7)CIFS的相关信息 (8)CIFS共享 (10)启用home directory功能 (10)ISCSI连接Windows (11)网络端口的管理 (14)更改root用户密码 (15)系统实时状态监控 (16)附录一:磁盘更换步骤 (16)附录二:时间同步服务器的设置 (17)附录三:常见故障处理 (17)NetApp存储系统NetApp 系统为各种不同平台上的用户提供了对全部企业数据的无缝访问。
NetApp全系列光纤网络存储系统在文件访问方面支持NFS 和CIFS,在块存储访问方面支持FCP 和iSCSI,确保您可以非常方便地将NetApp 存储系统集成到NAS 或SAN 环境中,并且保护原来的信息。
NetApp 的设计为专用访问环境中的应用程序服务器和服务器集群以及多用户环境中的用户提供了经过优化和整合的高性能数据访问方式。
NetApp 存储系统提供了经过实践考验的、超过99.998% 的数据可用性,减少了代价高昂的停机时间(无论是计划内的还是计划外的),最大限度地保障了对关键数据的访问。
它们在一个简单、易用的环境中实现了数据的可管理性、可扩展性、互操作性和可用性,从而降低了您的总拥有成本,加强了竞争优势。
NetApp系列产品具备真正的“统一引擎”功能,使您可以同时支持文件级和块级数据访问—而以前需要有多个系统才能完成这些过程存储访问协议包括NFS、CIFS、iSCSI、FCP 和HTTP,可运行在GbE、光纤通道以及SCSI(用于备份)等标准类型的连接上。
这一功能使得企业可以在一个基础设施下管理所有数据,它还向用户提供了管理其块级数据的功能,而这些功能以前仅可用于文件级数据。
NetApp Storage Admin SMB CIFS ACLs Guide
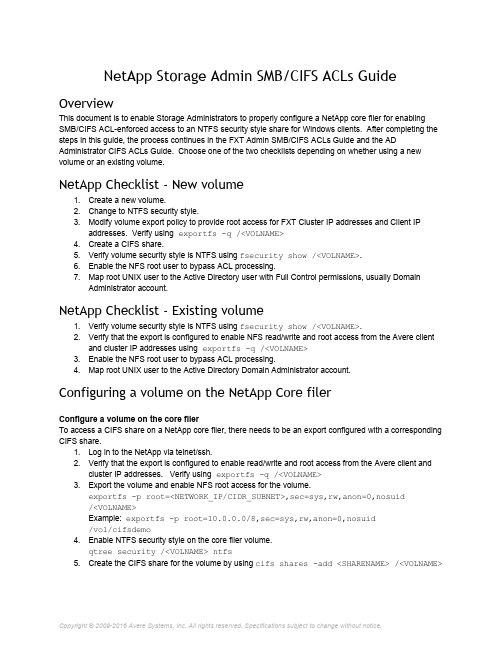
NetApp Storage Admin SMB/CIFS ACLs GuideOverviewThis document is to enable Storage Administrators to properly configure a NetApp core filer for enabling SMB/CIFS ACLenforced access to an NTFS security style share for Windows clients. After completing the steps in this guide, the process continues in the FXT Admin SMB/CIFS ACLs Guide and the AD Administrator CIFS ACLs Guide. Choose one of the two checklists depending on whether using a new volume or an existing volume.NetApp Checklist ‐ New volume1.Create a new volume.2.Change to NTFS security style.3.Modify volume export policy to provide root access for FXT Cluster IP addresses and Client IPaddresses. Verify using e x p o r t f s q /<V O L N A M E>4.Create a CIFS share.5.Verify volume security style is NTFS using f s e c u r i t y s h o w /<V O L N A M E>.6.Enable the NFS root user to bypass ACL processing.7.Map root UNIX user to the Active Directory user with Full Control permissions, usually DomainAdministrator account.NetApp Checklist ‐ Existing volume1.Verify volume security style is NTFS using f s e c u r i t y s h o w /<V O L N A M E>.2.Verify that the export is configured to enable NFS read/write and root access from the Avere clientand cluster IP addresses using e x p o r t f s q /<V O L N A M E>3.Enable the NFS root user to bypass ACL processing.4.Map root UNIX user to the Active Directory Domain Administrator account.Configuring a volume on the NetApp Core filerConfigure a volume on the core filerTo access a CIFS share on a NetApp core filer, there needs to be an export configured with a corresponding CIFS share.1.Log in to the NetApp via telnet/ssh.2.Verify that the export is configured to enable read/write and root access from the Avere client andcluster IP addresses. Verify using e x p o r t f s q /<V O L N A M E>3.Export the volume and enable NFS root access for the volume.e x p o r tf s p r o o t=<N E T W O R K_I P/C I D R_S U B N E T>,s e c=s y s,r w,a n o n=0,n o s u i d/<V O L N A M E>Example: e x p o r t f s p r o o t=10.0.0.0/8,s e c=s y s,r w,a n o n=0,n o s u i d/v o l/c i f s d e m o4.Enable NTFS security style on the core filer volume.q t r e e s e c u r i t y /<V O L N A M E> n t f s5.Create the CIFS share for the volume by using c i f s s h a r e s a d d <S H A R E N A M E> /<V O L N A M E>6.Verify the Effective security style is NTFS with “Everyone” having “Full Control” of the root of theexport. Example:f s e c u r i t y s h o w /<V O L N A M E>Example output (red font added for emphasis):[/v o l/c i f s d e m o D i r e c t o r y (i n u m 64)]S e c u r i t y s t y l e: N T F SE f f e c t i v e s t y l e: N TF SD O S a t t r i b u t e s: 0x0030 (A D)U n i x s e c u r i t y:u i d: 0 (r o o t)g i d: 0 (w h e e l)m o d e: 0777 (r w x r w x r w x)N T F S s e c u r i t y d e s c r i p t o r:O w n e r: B U I L T I N\A d m i n i s t r a t o r sG r o u p: B U I L T I N\A d m i n i s t r a t o r sD A C L:A l l o w E v e r y o n e 0x001f01f f (F u l l C o n t r o l)A l l o w E v e r y o n e 0x10000000 O I|C I|I O7.Avere OS utilizes NFSv3 for data path communications. To accomplish this, we require the UNIXroot user to bypass ACL processing. We recommend isolating root access to Avere client cluster IPs and management hosts. Use export policies to restrict root user access to NTFS volumes that are exported via NFS. Use the global command o p t i o n s c i f s.n f s_r o o t_i g n o r e_a c l o n8.Map the root user to the Domain Administrator account, where <DOMAIN> is substituted with thereal Active Directory domain name.Check if this mapping exists:r d f i l e /v o l/v o l0/e t c/u s e r m a p.c f gTo write the change to the file:w r f i l e a /v o l/v o l0/e t c/u s e r m a p.c f g "<D O M A I N>\A d m i n i s t r a t o r == r o o t"9.Exit t he telnet/ssh session using Ctrl D.Steps to verify everything is workingExample NetApp commands to test LDAP configuration:priv set advancedgetXXbyYY getpwbyname_r "AvereUser"getXXbyYY getpwbyuid_r ${UID_ASSIGNED_TO_AVEREUSER}getXXbyYY getgrbyname "Domain Users"getXXbyYY getgrbygid ${GID_ASSIGNED_TO_DOMAIN_USERS}wcc u "AvereUser"wcc s "AvereUser"cifs lookup "AvereUser"cifs lookup "Domain Users"note that the getXXbyYY command requires "priv set advanced" to be active.。
systemhealth critical故障解决方法

systemhealth critical故障解决方法系统健康状态对于一个组织或企业的正常运行至关重要,而当系统健康状态被标记为“critical(关键)”时,需要及时采取措施来解决故障。
在这篇文章中,我们将介绍几种解决系统健康问题的常见方法。
1. 定位问题:首先,我们需要确定导致系统健康状态关键的具体问题是什么。
这可以通过查看系统日志、错误报告、监控工具等来实现。
通过仔细分析这些信息,我们可以定位到具体的故障原因,从而为解决问题提供指引。
2. 制定应急计划:解决关键故障的第一步是制定一个应急计划。
这个计划应该包括识别到的问题、解决方案和可能的替代解决方案。
应急计划还应包括一个时间表,列出解决问题的优先级,以便团队成员可以有条不紊地处理故障。
3. 与供应商联系:如果系统健康状态关键的问题与硬件或软件供应商有关,我们应该立即联系他们来寻求技术支持。
供应商通常可以提供技术专家的帮助,他们有经验来解决特定系统的问题。
他们可能需要远程访问系统来进行故障排除,或者可能会提供一些修复建议。
4. 升级补丁和更新:系统中的更新和补丁通常包含会修复已知问题的解决方案。
如果系统健康状态关键的问题是因为软件版本过旧或存在已知的漏洞,那么我们应该尽快应用最新的补丁和更新。
这些更新通常可以提高系统的稳定性,并解决可能导致关键故障的潜在问题。
5. 运行系统诊断工具:系统诊断工具可以帮助我们检测系统中的各种问题,从硬件故障到网络问题。
这些工具可以分析系统的运行状况,并提供有关可能导致关键故障的问题的信息。
通过运行这些诊断工具,我们可以更好地了解系统的健康状况,并针对问题采取适当的解决方案。
6. 备份和恢复:如果关键故障导致数据丢失或系统完全崩溃,备份和恢复就成为解决问题的关键步骤。
在解决问题之前,我们应该确保系统的重要数据已经进行了备份。
然后,我们可以使用备份数据来恢复系统,并确保关键故障不会继续影响系统的正常运行。
7. 定期维护和监控:关键故障的发生通常与系统未经过定期维护和监控有关。
使用健康app监测身体健康的英语作文
使用健康app监测身体健康的英语作文In today's digital age, the use of health apps to monitor our physical well-being has become increasingly popular. These apps offer a convenient way to track various aspects of our health, such as exercise, diet, sleep, and even mental well-being. They provide users with real-time data and personalized insights to help them make informed decisions about their health.One of the key benefits of using health apps is the ability to set and track fitness goals. Users can input their exercise routines, calorie intake, and weight measurements, and the app will analyze this data to provide feedback on their progress. This can help individuals stay motivated and accountable in achieving their health and fitness goals.Furthermore, health apps often come with features such as reminders for medication, hydration, and appointments with healthcare providers. These reminders can help users stay on top of their health routines and ensure they are taking necessary steps to maintain their well-being.However, it is important to note that while health apps can be useful tools for monitoring health, they should notreplace professional medical advice. It is essential to consult healthcare professionals for proper diagnosis and treatment of any health concerns.Overall, health apps can be valuable tools for promoting a healthier lifestyle and increasing awareness of one's well-being. By using these apps in conjunction with regular medical check-ups and consultations, individuals can take proactive steps towards maintaining and improving their health.中文翻译:在当今数字时代,使用健康应用监测我们的身体健康状况变得越来越流行。
在Docker技术中使用容器的健康检查和自动恢复策略

在Docker技术中使用容器的健康检查和自动恢复策略使用Docker技术的健康检查和自动恢复策略Docker是一种开源的容器化平台,它提供了轻量级、可移植和可扩展的容器化解决方案。
在使用Docker进行应用程序部署时,容器的健康检查和自动恢复策略起到非常重要的作用。
本文将介绍在Docker技术中使用容器的健康检查和自动恢复策略的方法和步骤。
一、容器健康检查容器健康检查用于监控容器的状态,包括容器启动、运行和停止等。
通过定期对容器进行健康检查,我们可以及时发现容器是否正常运行,并采取相应的措施进行修复或者替换,以保证应用程序的稳定性和可靠性。
1. 容器健康状态检查方式Docker提供了多种容器健康检查的方式,包括:- CMD检查:使用CMD命令执行应用程序的健康检查,并根据检查结果返回0或者非0的退出码。
例如,我们可以在Dockerfile中添加如下命令:`CMD [ "python3", "/app/healthcheck.py" ]`,其中healthcheck.py是一个自定义的健康检查脚本,根据实际应用程序的需求编写。
- HTTP检查:容器监听一个特定的HTTP端口,并根据HTTP响应码来判断容器的健康状态。
例如,我们可以在Dockerfile中添加如下命令:`HEALTHCHECK --interval=5s --timeout=3s CMD curl -f http://localhost:8080/ || exit 1`,其中的curl命令用于发送HTTP请求,并根据返回结果判断容器的健康状态。
- 自定义脚本检查:通过自定义脚本来检查容器的健康状态。
例如,我们可以在Dockerfile中添加如下命令:`HEALTHCHECK --interval=5s --timeout=3s CMD /app/healthcheck.sh`,其中healthcheck.sh是一个自定义的健康检查脚本。
如何进行Docker容器的健康检查和自动修复

如何进行Docker容器的健康检查和自动修复Docker容器的健康检查和自动修复是保障容器稳定性和可靠性的重要环节。
通过定期检查和自动修复,可以有效避免因容器故障而造成的系统不稳定和服务中断。
本文将介绍如何进行Docker容器的健康检查和自动修复。
一、Docker容器的健康检查Docker容器的健康检查是指通过监控容器的状态和指标,判断容器的运行情况是否正常。
这些指标可以是容器的CPU使用率、内存使用率、网络连接状态等。
根据实际情况,可以定制化定义健康检查的指标和阀值。
1. 使用Docker健康检查命令Docker提供了一系列的命令来检查容器的健康状态。
比如,可以使用"docker inspect"命令来查看容器的详细信息,包括容器的健康状态。
使用"docker stats"命令可以实时监控容器的各项指标。
通过这些命令可以快速了解容器的健康情况。
2. 自定义健康检查脚本除了使用Docker提供的命令,还可以自定义健康检查脚本来对容器进行健康检查。
通过编写脚本,可以根据实际情况对容器运行情况进行更加细致的监控和判断。
比如,可以编写一个脚本定时检查容器的CPU使用率,如果超过设定的阀值,则认为容器不健康。
二、Docker容器的自动修复当容器的健康检查结果不正常时,需要采取相应的措施来修复容器,以保证服务的连续性和稳定性。
下面介绍几种常见的自动修复方法。
1. 重启容器当容器的健康检查结果为不健康时,可以通过重启容器的方式来修复容器。
可以编写一个脚本,监控容器的健康状态,当发现容器不健康时,自动执行"docker restart"命令来重启容器。
重启容器后,容器的状态会重新回到健康状态。
2. 迁移容器除了重启容器,还可以采用容器迁移的方式进行修复。
当容器的健康检查结果不正常时,可以将容器迁移至另外一台宿主机上。
通过迁移容器,可以将故障节点上的容器迁移到健康节点上,从而保证服务的连续性。
中再资产_sophis系统数据库健康检查报告(sophis)2017(第三季度)
HS Oracle Health-Check Report中再资产sophis系统数据库系统健康检查报告创建日期:2017-10-31服务起讫日期:2017-10-30至2017-10-31服务总共时间:2天服务工程师:霍新国客户联系人:黄盛服务方式:现场目录第一章数据库健康检查 (3)**.检查总结 (2)**.性能分析 (2)**.检查方式 (2)**.检查内容及标准 (3)**.数据库维护专员情况 (4)第二章数据库目前备份情况6第三章系统和数据库配置 (7)**.硬件配置 (6)**.数据库配置 (6)**.基于O RACLE的应用 (7)第四章系统和数据库的可用性9**.备份 (8)**.恢复 (8)**.升级/安装/移植 (8)**.操作系统参数配置 (8)**.表空间 (10)**.数据文件 (11)**.控制文件 (11)**. REDO文件 (11)**.归档配置 (12)**.资源参数配置 (12)**.回滚表空间配置 (12)**.临时表空间配置 (13)**.安全性管理 (13)**.告警日志管理 (13)**.数据库监听管理 (14)第五章总结和建议22**.应立即解决的问题 (16)**.近期应解决的问题 (16)**.将来应解决的问题 (16)第六章已经做过的调整23第一章数据库健康检查1.1.检查总结从本次巡检的情况来看,整体表现比较平稳。
表空间利用率都很低,处于报警水平以下。
通过AWR和RDA报告分析,CPU和IO的利用率在交易高峰期都不高,数据库的性能总体表现良好,没有大的等待事件发生,属于正常的范围之类。
但性能问题是一个需要长期关注的问题,尤其是在清算时段注意数据同步的实时情况及时检查,性能将是不能忽略的问题。
存在问题描述解决办法数据库表空间使用率超过阀值SOPHIS表空间使用率超过80%,需要注意观察可以通过增加数据文件进行扩容1.2.性能分析基础信息操作系统版本:Redhat Linux 6.7 数据库版本:11.2.0.4 数据库架构:Single nodes 数据库大小:23G建议:7天负载曲线1.3.检查方式本次数据库健康检查方式如下:a)使用RDA(REMOTE DIAGNOSTIC AGENT)进行系统和数据库主要信息收集。
- 1、下载文档前请自行甄别文档内容的完整性,平台不提供额外的编辑、内容补充、找答案等附加服务。
- 2、"仅部分预览"的文档,不可在线预览部分如存在完整性等问题,可反馈申请退款(可完整预览的文档不适用该条件!)。
- 3、如文档侵犯您的权益,请联系客服反馈,我们会尽快为您处理(人工客服工作时间:9:00-18:30)。
4.#sysconfig -v //检查所有硬件,有无failed,error,warning
5 #ping filername //有无丢包现象
6 #ifconfig -a //主要网口状态为up
1:netapp1> cf enable
2:netapp2>cf enable
3:Netapp1> Cf takeover 把另外一个机头的服务接过来
4:Netapp1(takeover)> 当前是已接过来状态
5:Netapp1(takeover)> vfiler status 当前netapp1机头所运行的服务
> options autosupport.doit test
> options autosupport.enable off
NAS*> ls /etc/log/autosupport/201103071159.1.files
NAS*> rdfile /etc/log/autosupport/201103071159.1.files/201103071159.1
0b.18 netapp2 (84204112 ) Pool0 3KR0YZBM00007608Y7DE
0b.19 netapp2 (84204112 ) Pool0 3KR0VJ2900007609L45P
Netapp1>disk show –a
2) 分配硬盘到到270c其中一个机头模块上
neapp1> disk assign 0b.20 0b.21 ? (硬盘分配到当前270c机头使用)
neapp1> disk assign 0b.22 0b.23 0b.24 –o netapp2 (指定这三个硬盘分配到另外的一个270c机头上使用)
vfiler1 running
7:上面操作已经常可以正常接管了,现在 将接管的服务 应用还给另外那台机头来运行操作如下:
netapp1(takeover)> cf giveback –f 在接管模式下,将服务返回给原节点
0b.24 Not Owned NONE 3KR0X0AA000076099RFK
0b.18 netapp2 (84203626) Pool0 3KR0YZBM00007608Y7DE
0b.19 netapp2 (84203626) Pool0 3KR0VJ2900007609L45P
7 #vif status //vif所有端口是否正常,single和multi两种模式
8 #cf status //检查Cluster状态是否正常,正常两个节点为enable
9 #df //检查空间使用状况,Capacity小于等于80%正常,高于80%不正常
Netapp2>Disk show –v
DISK OWNER POOL SERIAL NUMBER
0b.16 netapp1 (84203626) Pool0 3KR0YZBM00007608Y7DE
spare 0b.24 8b 2 2 FC:B 0 68444/140174232
注:
如果硬盘坏了 换新的硬盘时 如果系统当时没有分配的话 则输入如下指令 重新分配给所需的机头既可:
Disk assign xx xx xx
目测
现场首先进行指示灯和LCD 面板检查,判断是否有异常情况发生。
14 #cifs stat //cifs操作情况
15 #nfsstat //nfs操作情况
16 #netstat ifstat //网络流量统计;网络接口性能统计
17 #environment status //设备环境状态检查
0b.22 netapp2 (84204112) Pool0 3KR0X63B00007609ME5J
0b.23 netapp2 (84204112) Pool0 3KR0XE38000076099U4L
0b.24 Not Owned NONE 3KR0X0AA000076099RFK
? 检查CLUSTER 状态是否正常
0b.22 netapp2 (84204112) Pool0 3KR0X63B00007609ME5J
0b.23 netapp2 (84204112) Pool0 3KR0XE38000076099U4L
0b.24 netapp2 (84204112 ) Pool0 3KR0X0AA000076099RFK
0b.16 netapp1 (84203626) Pool0 3KR0YZBM00007608Y7DE
0b.17 netapp1 (84203626) Pool0 3KR0VJ2900007609L45P
0b.20 Not Owned NONE 3KR0XE240000760926CP
10 #sysstat 3 //CPU利用率应该在80%以下
11 #vifstat 3 //vif流量是否均衡
12 #rdfile /etc/messages //有无warning,error,failed
13 #disk show -v //显示磁盘分配的Owner情况
4)如果当netapp1机头没有spare 盘,而netapp2还有三个spare硬盘,可把netapp2的其中一个spare盘 重新分配给netapp1机头当作spare盘操作如下:
Netapp2>disk assign –f 0b.24 –s unowned 把0b.24硬盘重新指定为末分配过的硬盘权限 如下:
则:Netapp1>disk show 显示如下
3)neapp1> disk show
DISK OWNER POOL SERIAL NUMBER
0b.16 netapp1 (84203626) Pool0 3KR0YZBM00007608Y7DE
0b.17 netapp1 (84203626) Pool0 3KR0VJ2900007609L45P
0b.20 netapp1 (84203626) Pool0 3KR0XE240000760926CP
0b.21 netapp1 (84203626) Pool0 3KR0X0J400007609MC22
? 检查网络是否正常
使用ping 存储设备IP 地址,输入: >ping FILERNAME 检查FILERNAME 机头的网络连通性。正常情况:有相应,无丢包。非正常情况:ping 不通或者丢包严重。
Filer>ifconfig –a 主要网口状态应为up
Filer>vif status VIF所有端口是否正常
Netapp2>disk assign 0b.24 –o netapp1
Netapp1>sysconfig –r 则会显示0b.24 自动成为spare盘
netapp1>D Disk HA.ID HA SHELF BAY CHAN Used (MB/blks) Phys (MB/blks)
0b.21 Not Owned NONE 3KR0X0J400007609MC22
0b.22 Not Owned NONE 3KR0X63B00007609ME5J
0b.23 Not Owned NONE 3KR0XE38000076099U4L
1.#storage show disk -p //查看硬盘状态
#sysconfig -r
#vol status -r
2.#priv set advanced //进入advance模式
#blink_on 2a.18 //使2a.18硬盘灯亮起
#priv set admin //退出advance模式
0b.17 netapp1 (84203626) Pool0 3KR0VJ2900007609L45P
0b.20 netapp1 (84203626) Pool0 3KR0XE240000760926CP
0b.21 netapp1 (84203626) Pool0 3KR0X0J400007609MC22
vfiler0 running
6:Netapp1(takeover)>partner vfiler status ,显示正常,说明cluster 已经成功的运行能接管所运行的服务
vfiler0 running
0b.18 netapp2 (84204112 ) Pool0 3KR0YZBM00007608Y7DE
0b.19 netapp2 (84204112 ) Pool0 3KR0VJ2900007609L45P
上面0b.24为末分陪的状态;重新指定给netapp1机头使用,操作如下:
? 硬件状态检查
Filer>sysconfig –r 检查磁盘情况正常情况:发现所有磁盘,每个机头都有一个或多个spare disk。非正常情况:任何一个机头一个spare disk都没有,就是非正常情况。
Filer>sysconfig –v 检查所有硬件以上显示结果应该没有failed,error,warning 等字样.
8:netapp1> 服务和应用已还给netapp2了,
双机cluster 运行状态正常 能正常接管冗余服务
显示硬盘的分配owned情况: disk show –v
如:1) neapp1> disk show -v
DISK OWNER POOL SERIAL NUMBER
18 #uptime //上线时间