Stata讲义精要-聂辉华
Stata讲义

expand和contract的用法
• 该命令可以把数据库按照要求进行扩展。 • use score,clear • sum score • sum score [weight=number] • edit • expand number • edit • sum score • contract score [缺省的情况下,做频数,当然也
– collapse price mpg,by(foreign) 国产车和进口 车分别计算均值,当然也可以计算方差等。
• 注意:
– 该命令对数据有巨大的破坏作用,尽量不用 save, replace
– 在实际应用中,该命令常跟outsheet一起使用
– outsheet using mean.xls
• save数据保存命令
– save,replace
• erase 删除数据命令
– 一定要加上扩展名
• describe 数据一般描述命令 • codebook 展示各变量情况的命令 • sum 展示各变量数量情况的命令 • generate 生成新变量命令 • rename 变量重命名命令 • drop 删除变量或观察值的命令 • keep 保留变量或观察值的命令 • sort 对某些变量按观察值大小进行排序的命令
– 两个数据库都要排序。 – _merge的含义同上。有的时候这个变量很管用。
collapse命令的用法
• 这个命令非常有用,一定要记住。它可以 直接得到绝大多数变量的常用统计量。
– use auto,clear – sum price mpg – collapse price mpg – collapse (mean) price mpg – collapse (sd) price – collapse (mean) price (sd) mpg – collapse (mean) price (sd) sdprice=price
Stata讲义精要-聂辉华

5
二、数据管理
变量管理:对变量进行改变 最重要的是产生新变量的命令generate or gen or g 表示运算的符号:等于、加、减、乘、除、乘 方、指数、对数、滞后、领先和差分分别对应 于=, +, -, *, / ,^ , exp, log, l., f., d.)。 表示逻辑关系的符号:&表示and,|表示or,!= 表示不等,= =表示相等。 表示大小关系的符号:>,<,>=,<=。 表示条件关系的命令:if
四、计量分析
5、动态面板数据(Dynamic Panel Data) 方程右边包含了因变量的滞后项(可以推广到 多阶滞后),因此称之为动态面板模型。 估计方法为GMM,包括差分GMM和系统 GMM 命令结构为:xtabond2 depvar varlist [if exp] [in range] [weight] [, level(#) twostep robust noconstant small noleveleq orthogonal gmmopt [gmmopt ...] ivopt [ivopt ...] artests(#) arlevels h(#) nodiffsargan nomata]
15
Cont’d
其他选项的说明:
level(#)表明了置信度,默认值为95% beta 表示去均值和标准差之后的beta系数 noconstant 无截距项回归 robust 产生一致性的标准差 (Huber/White/sandwich)
其它回归命令 多方程回归:for var y1-y10 z1-z5:reg x x1x22,因变量分别为y1-y10 z1-z5,自变量均为 x1-x22,共有15个回归方程。 分年度回归:by year: reg y x1 x2
STATA基本操作入门PPT课件
6.2查看变量的统计特征
• 如果要查看满足q≥10000的子样本的统计指标。方法:输入summarize q if q >=10000 • 或者su q if q >=10000
第9页/共23页
6.3 查看变量的统计特征
• 如果要查看更多的统计指标 • 方法:输入 su q,detail • 显示了百分位数, 方差,偏度与峰度
第21页/共23页
9.6 图像合并展示
• 将线性拟合和二次拟合这两个图像在一起展示 • 方法:输入graph combine scatter1.gph scatter2.gph
第22页/共23页
谢谢您的观看!
第23页/共23页
第10页/共23页
6.4 查看变量的统计特征
• 如果summarize 后面不输入具体变量,则展示所有变量的统计指标 • 方法:输入summarize 或 su
第11页/共23页
7.经验累积分布函数
• 如果要查看q的经验累积分布函数 • 方法:tabulate q 或则 ta q
第12页/共23页
• 展示满足q>=10000的q的数据 • 方法:list q if q >=10000 • 展示满足q>=10000的q和tc的数据 • 方法:list q tc if q >=10000
第7页/共23页
6.1查看变量的统计特征
• 查看变量q的统计特征: • 方法:输入summarize q 或 su q • 展示变量q的样本容量,平均值,标准差,最小值,最大值
8.相关系数
• 如果要显示PL,PF两个变量的相关系数 • 方法:pwcorr pl pf
第13页/共23页
Stata教程剖析
第一章 Stata 概貌§1.1 Stata的功能、特点和背景Stata是一个用于分析和管理数据的功能强大又小巧玲珑的实用统计分析软件,由美国计算机资源中心(Computer Resource Center)研制。
从1985至1998的十四年时间里,已连续推出1.1,1.2,1.3,1.4,1.5,……及2.0,2.1,3.0,3.1,4.0,5.0,6.0等多个版本,通过不断更新和扩充,内容日趋完善。
它同时具有数据管理软件、统计分析软件、绘图软件、矩阵计算软件和程序语言的特点,又在许多方面别具一格。
Stata融汇了上述程序的优点,克服了各自的缺点,使其功能更加强大,操作更加灵活、简单,易学易用,越来越受到人们的重视和欢迎。
Stata的突出特点是只占用很少的磁盘空间,输出结果简洁,所选方法先进,内容较齐全,制作的图形十分精美,可直接被图形处理软件或字处理软件如WORD等直接调用。
一、 Stata的数据管理能力1.Stata的数据管理空间受计算机的操作系统和计算机扩展内存的影响。
对640k内存的微机,3.1版本的Stata可以管理2400个记录×99个变量,并随计算机扩展内存的增加而增加;对4.0的WINDOWS版本,Stata可以管理4800个记录×99个变量;对WINDOWS 95下的5.0版本,可根据计算机的配置情况设置变量数和记录数,如32M扩展内存的计算机,可处理2千万个数据。
变量数和记录数可以互相交易(trade),即减少记录数可以增加变量数,减少变量数可以增加记录数。
2.可以将分组变量转换成指示变量(哑变量),将字符串变量映射成数字代码。
3.可以对数据文件进行横向和纵向链接,可以将行数据转为列数据,或反之。
4.可以恢复、修改执行过的命令。
5.可以利用数值函数或字符串函数产生新变量。
6.可以从键盘或磁盘读入数据。
二、 Stata的统计功能Stata的统计功能很强,除了传统的统计分析方法外,还收集了近20年发展起来的新方法,如Cox比例风险回归,指数与Weibull回归,多类结果与有序结果的logistic回归,Poisson回归、负二项回归及广义负二项回归,随机效应模型等。
STATA_讲义

STATA 讲义目录Stata入门教程:Stata概貌Stata 第一章数据输入,存盘和调用文件命令以及数据管理命令Stata第二章 描述性统计命令与输出结果说明Stata第三章 正态检验与作图命令Stata第四章 t检验和单因素方差分析(上)Stata第四章 t检验和单因素方差分析(下)Stata第五章 多组计量资料比较的非参数检验命令与输出结果说明Stata第六章 卡方检验Stata第七章 相 关 分 析Stata第八章 单 因 素 生 存 分 析Stata第九章 多因 素 方 差 分 析 命 令 与 输 出 结 果 说 明Stata第十章 线 性 回 归 和 逐 步 回 归 命 令 和 输 出 结 果 说 明Stata第十一章 Logistic回归分析命令与输出结果说明Stata第十二章 Cox回归分析命令与输出结果说明第一章 Stata 概貌§1.1 Stata的功能、特点和背景Stata是一个用于分析和管理数据的功能强大又小巧玲珑的实用统计分析软件,由美国计算机资源中心(Computer Resource Center)研制。
从1985至1998的十四年时间里,已连续推出1.1,1.2,1.3,1.4,1.5,……及2.0,2.1,3.0,3.1,4.0,5.0,6.0等多个版本,通过不断更新和扩充,内容日趋完善。
它同时具有数据管理软件、统计分析软件、绘图软件、矩阵计算软件和程序语言的特点,又在许多方面别具一格。
Stata融汇了上述程序的优点,克服了各自的缺点,使其功能更加强大,操作更加灵活、简单,易学易用,越来越受到人们的重视和欢迎。
Stata的突出特点是只占用很少的磁盘空间,输出结果简洁,所选方法先进,内容较齐全,制作的图形十分精美,可直接被图形处理软件或字处理软件如WORD等直接调用。
一、 Stata的数据管理能力1. Stata的数据管理空间受计算机的操作系统和计算机扩展内存的影响。
stata讲义
Stata介绍作为流行的计量经济学软件,Stata的功能十分地全面和强大。
可以毫不夸张地说,凡是成熟的计量经济学方法,在Stata中都可以找到相应的命令,而这些命令都有许多选项以适应不同的环境或满足不同的需要。
即使是最详细的Stata手册,也难免有遗珠之憾,更何况本文仅是一个粗浅的介绍。
掌握Stata最好的办法是在实践中学习:Stata 本身提供了非常强大的帮助系统,并且关于Stata的书籍和网络资源都不少。
本文拟根据如下顺序介绍Stata:1.界面;2.文件和数据;3.语法和命令;4.数据管理;5.描述统计;6.画图;7.回归和回归分析;8.常用命令。
第3和第4部分是最体现Stata灵活性的地方,也是应用Stata的基础。
第5和第6部分介绍如何用Stata完成基本的统计功能。
Stata的功能很多,比如回归,曲线拟合,生存分析,主成分分析,因子分析,聚类分析,时间序列分析等等。
但回归无疑是其中最重要的功能。
第7部分介绍如何用Stata作线性回归和Logistic回归。
本文第2和第3部分包含了作者的观点,难免有偏颇之处。
其余部分主要来自文献的归纳和总结。
限于水平有限,错误在所难免,敬请原谅。
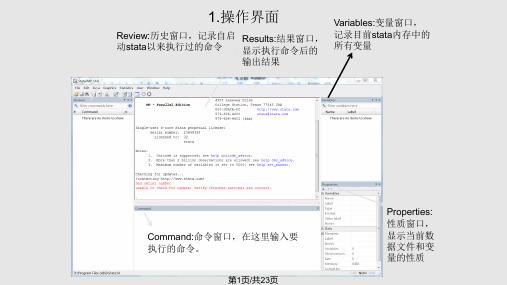
1.界面图1 Stata界面Stata有4个窗口:1. Stata Command(右下)用于向Stata输入命令;2. Stata Results(右上)用于显示运行结果;3. Review(左上)记录使用过的命令;4. Variables(左下)显示当前memory中的所有变量。
窗口上方是工具栏,其上的按钮依次为(从左到右)Open, Save, Print Graph/Print Log, Log Start/Stop/Suspend, Bring Log to Front, Bring Graph to Front, Do-file Editor, Data Editor, Data Browser, Clear –more- condition, Break。
高级计量经济学讲义(北大CCER)--STATA_NOTE

STATA BASIC COMMANDS(notes for Junsoo Lee)I. BASICclearset memory 80mcd c:cd \work\statainsheet using water.txtsave water.dta* use water.dtalog using water, replacesummarize _alldescribe _allII. MORE on BASICMemoryC:\stata\wstata /k5000C:\stata\wstata /k5000 set matsize 100C:\stata\wstata /k5000 run c:\data\profile.doData filesInfile x1 x2 x3 using test.txt* only text fileInsheet x1 x2 x3 using text.txt* if saved by spreadsheetsave test, replacesave test, appenduse testlistdescribeLog FileLog using test.logLog using test.log, replaceLog using test.log, appendLog closeLog using test.log, noprocBreakCtrl-K Ctrl-breakRegressionRegress y x1 x2Predict yhatRegress y x1 x2, robustvce* variance-covariancevce, corrmatrix v = get(vce)coeff & predgent asif = _b[const] + _b[ed]*ed + _b[tenure]*tenure testregress y x1 x2test x1 = x2* b1 = b2joint restrictionstest 2*(x1+x2) = 3*x3test x4+x5 = 0, accum* two joint restrictionslr testregress y x1 x2lrtest, saving(0)regress y x1 x2 x3lrtestnon-linear restrictionsregress y x1 x2 x3eq one: 3*_b[x2]^2 = _b[x3]eq two: _b[x3] / _b[x2] = 2testnl one twoBy region: regress y x1 x2By foreign: regress y x1 x2Graph y x1 x2 if foreign ==0, correct(.1) symbol(oi)Graph y x1 x2 if foreign ==1, correct(.1) symbol(oi)t-testttest mpg, by(foreign)* Ho: diff = 0 where foreign is a dummy variableCii 97 24 6* n=97 mean=24 std=6 95 c.i.ttest 97 24 6 22* test Ho: mu = 22ListList x1 if x2 > 20List x1 – x5List x1 x2 if x4 > 10 | (x5>3 & x6 > 10)* ~ = not equal & and | or ~ not >= greater than or equal SortSort mpgCreating new variablesgen lx1 = ln(x1)* if same variable is uses, use “replace”.replace x1 = x1 / 1000Gen x3 = 1.05 * x1 if foreign == 0Replace x3 = 1.20 * x1 if foreign == 1ClearDrop _allMoreSet more offSet more onDescriptive statistics SummarizeSum if mpg > 20Sum if foreign == 0Sum x1, detailBy region: summarize x1 x2 CountCount if x == 1Count if y = float(1.1)* precision issueTabulateTab foreignTab x2 foreignTab x2 foreign, chi2* Pearson chi-square test (df=n-1) CorrelateCorr x1 x2Corr x1 x2 if foreign == 0GraphGraph x1 x2Sort foreignGraph x1 x2, by(foreign) total* three graphs; 0, 1, totalTutorial introTutorial graphicsTutorial survivalTutorial logitLong Line* semi-colon should be used.#delimit;summarize x1 x2if foreign == 1;gen x3 = x1 + x2;#delimit crDo fileDo myjobDo myjob.doDo myjob, nostop* don’t stop even with errorsBatch Jobs* at DOSc:\stata\wstata /b do bigjob.doADO filesWhich fitType c:\stata\ado\f\fit.adoType c:\stata\ado\f\fit.hlpThree places to putOfficial C:\stata\adoPersonal C:\adoCurrent .Global S_ADO “C\stata\ado;d:\ado;.”* to refine pathsmacro list S_ADOCDCd d:Cd \work\dataCd “\work\detailed data”Lags and LeadsGen xlag1 = x[_n-1]Gen xlead1 = x[_n+1]Procedures (Program)Program define helloDisplay “hi there”EndDo helloScoreProbit y x1, x2, score(u)* will be stored in UPoisson Regression (Example provided by Todd)#delimit ;* Poisson regression (Ex. 5.3, Greene, p. 208); * For Junsoo Lee;input id y x ;1 6 1.5;2 7 1.8;3 4 1.8;4 10 2.0;5 10 1.3;6 6 1.6;7 4 1.2;8 7 1.9;9 2 1.8;10 3 1.0;11 6 1.4;12 5 0.5;13 3 0.8;14 3 1.1;15 4 0.7;end;list;* Poisson regression;poisson y x ;Poisson MLE (Example provided by David/Todd)clearinsheet using c:\temp\poisson_data.txtlog using c:\temp\poisson_output.log, replace/* this is the "canned" routine that estimates the poisson regression */ poisson y x/* this maximizes lnL directly, using logged factorial of y */program define poisreg1args lnf thetaquietly replace `lnf' = -exp(`theta') + $ML_y1*(`theta') - lnfact($ML_y1) endml model lf poisreg1 (y=x)ml maximize/* this maximizes lnL directly, using the logged gamma function */program define poisreg2version 6args lnf thetaquietly replace `lnf' = -exp(`theta') + $ML_y1*(`theta') - lngamma($ML_y1 + 1)endml model lf poisreg2 (y=x)ml maximizePanel Estimationclearset memory 40mset more offset matsize 350log using panel.log, replaceuse panel.dta, cleartsset state yearregress y x1 x2 state2-state51 yr82-yr95xtivreg y l1.y x1 x2 yr82-yr95 (l.y = l2.y), i(state) fextivreg y l1.y x1 x2 yr82-yr95 (l.y = l2.y), i(state) fdxtivreg y l1.y x1 x2 yr82-yr95 (l.y = l2.y), i(state) re ec2slsxtabond y x1 x2 yr82-yr95, lags(1)xtabond y x1 x2 yr82-yr95, lags(1) twostep log closeOn-line HelpH weibullHelp for ^brier^。
Stata操作讲义_经济学_高等教育_教育专区

Stata操作讲义第一讲Stata操作入门第一节概况Stata最初由美国计算机资源中心(Computer Resource Center)研制,现在为Stata公司的产品,其最新版本为7.0版。
它操作灵活、简单、易学易用,是一个非常有特色的统计分析软件,现在已越来越受到人们的重视和欢迎,并且和SAS、SPSS一起,被称为新的三大权威统计软件。
Stata最为突出的特点是短小精悍、功能强大,其最新的7.0版整个系统只有10M左右,但已经包含了全部的统计分析、数据管理和绘图等功能,尤其是他的统计分析功能极为全面,比起1G以上大小的SAS系统也毫不逊色。
另外,由于Stata在分析时是将数据全部读入内存,在计算全部完成后才和磁盘交换数据,因此运算速度极快。
由于Stata的用户群始终定位于专业统计分析人员,因此他的操作方式也别具一格,在Windows席卷天下的时代,他一直坚持使用命令行/程序操作方式,拒不推出菜单操作系统。
但是,Stata的命令语句极为简洁明快,而且在统计分析命令的设置上又非常有条理,它将相同类型的统计模型均归在同一个命令族下,而不同命令族又可以使用相同功能的选项,这使得用户学习时极易上手。
更为令人叹服的是,Stata语句在简洁的同时又拥有着极高的灵活性,用户可以充分发挥自己的聪明才智,熟练应用各种技巧,真正做到随心所欲。
除了操作方式简洁外,Stata的用户接口在其他方面也做得非常简洁,数据格式简单,分析结果输出简洁明快,易于阅读,这一切都使得Stata成为非常适合于进行统计教学的统计软件。
Stata的另一个特点是他的许多高级统计模块均是编程人员用其宏语言写成的程序文件(ADO文件),这些文件可以自行修改、添加和下载。
用户可随时到Stata网站寻找并下载最新的升级文件。
事实上,Stata的这一特点使得他始终处于统计分析方法发展的最前沿,用户几乎总是能很快找到最新统计算法的Stata程序版本,而这也使得Stata自身成了几大统计软件中升级最多、最频繁的一个。
Stata命令语法和基本命令语法的基本教程,以及控制数据列表的外观说明书

10Listing data and basic command syntaxCommand syntaxThis chapter gives a basic lesson on Stata’s command syntax while showing how to control the appearance of a data list.As we have seen throughout this manual,you have a choice between using menus and dialogs and using the Command window.Although many find the menus more natural and the Command window baffling at first,some practice makes working with the Command window often much faster than using menus and dialogs.The Command window can become a faster way of working because of the clean and regular syntax of Stata commands.We will cover enough to get you started;help language has more information and examples,and [U ]11Language syntax has all the details.The syntax for the list command can be seen by typing help list :list varlistif in ,optionsHere is how to read this syntax:•Anything inside square brackets is optional.For the list command,a.varlist is optional.A varlist is a list of variable names.b.if is optional.The if qualifier restricts the command to run only on those observations for which the qualifier is true.We saw examples of this in [GSW ]6Using the Data Editor .c.in is optional.The in qualifier restricts the command to run on particular observation numbers.d.,and options are optional.options are separated from the rest of the command by a comma.•Optional pieces do not preclude one another unless explicitly stated.For the list command,it is possible to use a varlist with if and in .•If a part of a word is underlined,the underlined part is the minimum abbreviation.Any abbreviation at least this long is acceptable.a.The l in list is underlined,so l ,li ,and lis are all equivalent to list .•Anything not inside square brackets is required.For the list command,only the command itself is required.Keeping these rules in mind,let’s investigate how list behaves when called with different arguments.We will be using the dataset afewcarslab.dta from the end of the previous chapter.list with a variable listVariable lists (or varlist s)can be specified in a variety of ways,all designed to save typing and encourage good variable names.•The varlist is optional for list .This means that if no variables are specified,it is equivalent to specifying all variables.Another way to think of it is that the default behavior of the command is to run on all variables unless restricted by a varlist .•You can list a subset of variables explicitly,as in list make mpg price .•There are also many shorthand notations:m*means all variables starting with m .price-weight means all variables from price through weight in the dataset order.ma?e means all variables starting with ma ,followed by any character,and ending in e .12[GSW]10Listing data and basic command syntax•You can list a variable by using an abbreviation unique to that variable,as in list gear r~o.If the abbreviation is not unique,Stata returns an error message..listmake price mpg weight gear_r~o foreign1.VW Rabbit4697251930 3.78foreign2.Olds988814214060 2.41domestic3.Chev.Monza3667.2750 2.73domestic4.4099222930 3.58domestic5.Datsun5105079242280 3.54foreign6.Buick Regal5189203280 2.93domestic7.Datsun8108129.2750 3.55foreign.l make mpg pricemake mpg price1.VW Rabbit2546972.Olds982188143.Chev.Monza.36674.2240995.Datsun5102450796.Buick Regal2051897.Datsun810.8129.list m*make mpg1.VW Rabbit252.Olds98213.Chev.Monza.4.225.Datsun510246.Buick Regal207.Datsun810..li price-weightprice mpg weight1.46972519302.88142140603.3667.27504.40992229305.50792422806.51892032807.8129.2750[GSW]10Listing data and basic command syntax3.list ma?emake1.VW Rabbit2.Olds983.Chev.Monza4.5.Datsun5106.Buick Regal7.Datsun810.l gear_r~ogear_r~o1. 3.782. 2.413. 2.734. 3.585. 3.546. 2.937. 3.55list with ifThe if qualifier uses a logical expression to determine which observations to use.If the expression is true,the observation is used in the command;otherwise,it is skipped.The operators whose results are either true or false are<less than<=less than or equal==equal>greater than>=greater than or equal!=not equal&and|or!not(logical negation;~can also be used)()parentheses are for grouping to specify order of evaluationIn the logical expressions,&is evaluated before|(similar to multiplication before addition in arithmetic).You can use this in your expressions,but it is often better to use parentheses to ensure that the expressions are evaluated in the proper order.See[U]13.2Operators for complete details.4[GSW]10Listing data and basic command syntax.listmake price mpg weight gear_r~o foreign1.VW Rabbit4697251930 3.78foreign2.Olds988814214060 2.41domestic3.Chev.Monza3667.2750 2.73domestic4.4099222930 3.58domestic5.Datsun5105079242280 3.54foreign6.Buick Regal5189203280 2.93domestic7.Datsun8108129.2750 3.55foreign.list if mpg>22make price mpg weight gear_r~o foreign1.VW Rabbit4697251930 3.78foreign3.Chev.Monza3667.2750 2.73domestic5.Datsun5105079242280 3.54foreign7.Datsun8108129.2750 3.55foreign.list if(mpg>22)&!missing(mpg)make price mpg weight gear_r~o foreign1.VW Rabbit4697251930 3.78foreign5.Datsun5105079242280 3.54foreign.list make mpg price gear if(mpg>22)|(price>8000&gear<3.5)make mpg price gear_r~o1.VW Rabbit254697 3.782.Olds98218814 2.413.Chev.Monza.3667 2.735.Datsun510245079 3.547.Datsun810.8129 3.55.list make mpg if mpg<=22in2/4make mpg2.Olds98214.22In the listings above,we see more examples of Stata treating missing numerical values as large values, as well as the care that should be taken when the if qualifier is applied to a variable with missing values.See[GSW]6Using the Data Editor.[GSW]10Listing data and basic command syntax5 list with if,common mistakesHere is a series of listings with common errors and their corrections.See if you canfind the errors before reading the correct entry..listmake price mpg weight gear_r~o foreign1.VW Rabbit4697251930 3.78foreign2.Olds988814214060 2.41domestic3.Chev.Monza3667.2750 2.73domestic4.4099222930 3.58domestic5.Datsun5105079242280 3.54foreign6.Buick Regal5189203280 2.93domestic7.Datsun8108129.2750 3.55foreign.list if mpg=21=exp not allowedr(101);The error arises because“equal”is expressed by==,not by=.Corrected,it becomes.list if mpg==21make price mpg weight gear_r~o foreign2.Olds988814214060 2.41domesticOther common errors with logic:.list if mpg==21if weight>4000invalid syntaxr(198);.list if mpg==21and weight>4000invalid’and’r(198);Joint tests are specified with&,not with the word and or multiple if s.The if qualifier should be if mpg==21&weight>4000,not if mpg==21if weight>4000.Here is its correction:.list if mpg==21&weight>4000make price mpg weight gear_r~o foreign2.Olds988814214060 2.41domestic6[GSW]10Listing data and basic command syntaxA problem with string variables:.list if make==Datsun510Datsun not foundr(111);Strings must be in double quotes,as in make=="Datsun510".Without the quotes,Stata thinks thatDatsun is a variable that it cannotfind.Here is the correction:.list if make=="Datsun510"make price mpg weight gear_r~o foreign5.Datsun5105079242280 3.54foreignConfusing value labels with strings:.list if foreign=="domestic"type mismatchr(109);Value labels look like strings,but the underlying variable is numeric.Variable foreign takes on values 0and1but has the value label that attaches0to“domestic”and1to“foreign”(see[GSW]9Labeling data).To see the underlying numeric values of variables with labeled values,use the label list command(see[D]label),or investigate the variable with codebook varname.We can correct the error here by looking for observations where foreign==0.There is a second construction that also allows the use of the value label directly..list if foreign==0make price mpg weight gear_r~o foreign2.Olds988814214060 2.41domestic3.Chev.Monza3667.2750 2.73domestic4.4099222930 3.58domestic6.Buick Regal5189203280 2.93domestic.list if foreign=="domestic":originmake price mpg weight gear_r~o foreign2.Olds988814214060 2.41domestic3.Chev.Monza3667.2750 2.73domestic4.4099222930 3.58domestic6.Buick Regal5189203280 2.93domestic[GSW]10Listing data and basic command syntax7 list with inThe in qualifier uses a numlist to give a range of observations that should be listed.numlist s have the form of one number orfirst/last.Positive numbers count from the beginning of the dataset.Negative numbers count from the end of the dataset.Here are some examples:.listmake price mpg weight gear_r~o foreign1.VW Rabbit4697251930 3.78foreign2.Olds988814214060 2.41domestic3.Chev.Monza3667.2750 2.73domestic4.4099222930 3.58domestic5.Datsun5105079242280 3.54foreign6.Buick Regal5189203280 2.93domestic7.Datsun8108129.2750 3.55foreign.list in1make price mpg weight gear_r~o foreign1.VW Rabbit4697251930 3.78foreign.list in-1make price mpg weight gear_r~o foreign7.Datsun8108129.2750 3.55foreign.list in2/4make price mpg weight gear_r~o foreign2.Olds988814214060 2.41domestic3.Chev.Monza3667.2750 2.73domestic4.4099222930 3.58domestic.list in-3/-2make price mpg weight gear_r~o foreign5.Datsun5105079242280 3.54foreign6.Buick Regal5189203280 2.93domesticControlling the list outputThefine control over list output is exercised by specifying one or more options.You can use sepby()to separate observations by variable.abbreviate()specifies the minimum number of characters to abbreviate a variable name in the output.divider draws a vertical line between the variables in the list.8[GSW]10Listing data and basic command syntax.sort foreign.list ma p g f,sepby(foreign)make price gear_r~o foreign1.Olds9888142.41domestic2.Chev.Monza3667 2.73domestic3.Buick Regal5189 2.93domestic4.4099 3.58domestic5.Datsun5105079 3.54foreign6.VW Rabbit4697 3.78foreign7.Datsun8108129 3.55foreign.list make weight gear,abbreviate(10)make weight gear_ratio1.Olds9840602.412.Chev.Monza2750 2.733.Buick Regal3280 2.934.2930 3.585.Datsun5102280 3.546.VW Rabbit1930 3.787.Datsun8102750 3.55.list,dividermake price mpg weight gear_r~o foreign1.Olds9888142140602.41domestic2.Chev.Monza3667.2750 2.73domestic3.Buick Regal5189203280 2.93domestic4.4099222930 3.58domestic5.Datsun5105079242280 3.54foreign6.VW Rabbit4697251930 3.78foreign7.Datsun8108129.2750 3.55foreignThe separator()option draws a horizontal line at specified intervals.When not specified,it defaults to a value of5.[GSW]10Listing data and basic command syntax9.list,separator(3)make price mpg weight gear_r~o foreign1.Olds9888142140602.41domestic2.Chev.Monza3667.2750 2.73domestic3.Buick Regal5189203280 2.93domestic4.4099222930 3.58domestic5.Datsun5105079242280 3.54foreign6.VW Rabbit4697251930 3.78foreign7.Datsun8108129.2750 3.55foreignMoreWhen you see a more prompt at the bottom of the Results window,it means that there is more information to be displayed.This happens,for example,when you are list ing many observations..list make mpgmake mpg1.Linc.Continental122.Linc.Mark V123.Cad.Deville144.Cad.Eldorado145.Linc.Versailles146.Merc.Cougar147.Merc.XR-7148.Peugeot604149.Buick Electra1510.Merc.Marquis1511.Buick Riviera1612.Chev.Impala1613.Dodge Magnum1614.Olds Toronado1615.AMC Pacer1716.Audi50001717.Dodge St.Regis1718.Volvo2601719.Buick LeSabre1820.Dodge Diplomat18moreIf you want to see the next screen of text,you have a few options:press any key,such as the Spacebar;click on the More button,;or click on the blue more at the bottom of the Results window.To see just the next line of text,press Enter.10[GSW]10Listing data and basic command syntaxBreakIf you want to interrupt a Stata command,click on the Break button,.If you see a more prompt at the bottom of the Results window and wish to interrupt it,click on the Break button or press q..list make mpgmake mpg1.Linc.Continental122.Linc.Mark V123.Cad.Deville144.Cad.Eldorado145.Linc.Versailles146.Merc.Cougar147.Merc.XR-7148.Peugeot604149.Buick Electra1510.Merc.Marquis1511.Buick Riviera1612.Chev.Impala1613.Dodge Magnum1614.Olds Toronado1615.AMC Pacer1716.Audi50001717.Dodge St.Regis1718.Volvo2601719.Buick LeSabre1820.Dodge Diplomat18breakr(1);It is always safe to click on the Break button.After you click on Break,the state of the system is the same as if you had never issued the original command.。
stata入门中文讲义_经济学_高等教育_教育专区
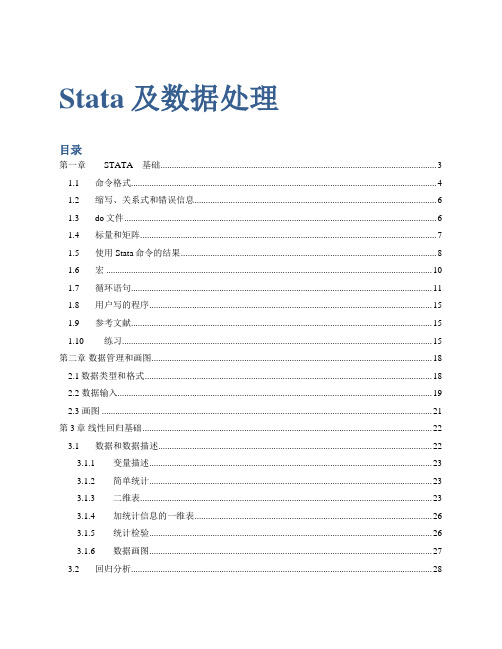
Stata及数据处理目录第一章STATA基础 (3)1.1 命令格式 (4)1.2 缩写、关系式和错误信息 (6)1.3 do文件 (6)1.4 标量和矩阵 (7)1.5 使用Stata命令的结果 (8)1.6 宏 (10)1.7 循环语句 (11)1.8 用户写的程序 (15)1.9 参考文献 (15)1.10 练习 (15)第二章数据管理和画图 (18)2.1数据类型和格式 (18)2.2 数据输入 (19)2.3 画图 (21)第3章线性回归基础 (22)3.1 数据和数据描述 (22)3.1.1 变量描述 (23)3.1.2 简单统计 (23)3.1.3 二维表 (23)3.1.4 加统计信息的一维表 (26)3.1.5 统计检验 (26)3.1.6 数据画图 (27)3.2 回归分析 (28)3.2.1 相关分析 (28)3.2.2 线性回归 (29)3.2.3 假设检验 Wald test (30)3.2.4 估计结果呈现 (30)3.3 预测 (34)3.4 Stata 资源 (35)第4章数据处理的组织方法 (36)1、可执行程序的编写与执行 (36)方法1:do文件 (36)方法2:交互式-program-命令 (36)方法3:在do文件中使用program命令 (38)方法4:do文件合并 (39)方法5:ado 文件 (40)2、do文件的组织 (40)3、数据导入 (40)4、_n和_N的用法 (44)第一章STATA基础STATA的使用有两种方式,即菜单驱动和命令驱动。
菜单驱动比较适合于初学者,容易入学,而命令驱动更有效率,适合于高级用户。
我们主要着眼于经验分析,因而重点介绍命令驱动模式。
图1.1Stata12.1的基本界面关于STATA的使用,可以参考Stata手册,特别是[GS] Getting Started with Stata,尤其是第1章A sample session和第2章The Stata User Interface。
stata操作介绍之基础部分(一)讲述

录入相应的数值
2.用STATA的数据编辑器 ①进入数据编辑器 进入stata界面,在命令栏键入edit或在stata的window下拉菜单中单击data editor 编辑图标 (注意: 是浏览图标,点击后只能浏览,不能编辑)即可进入 stata数据编辑器。 ②数据编辑 stata 数据编辑器界面:此时进入了数据全屏幕编辑状态。
3、绘图功能 4、与其他软件的区别
1.5 工具书、论坛推荐
• Stata工具书: 1、Stata实用教程——王天夫、李博柏著(基础教程) 2、应用Stata做统计分析——汉密尔顿著;郭志刚等译(最全教程) • Stata学习相关资料 1、经管之家论坛:/forum-67-1.html 2、Stata官方论坛:/links/resources.html
• 命令回顾窗口:即 review 窗口,位于界面左上方,所有执行过的 命令会依 次在该窗口中列出,选中某一行单击后命令即被自动拷 贝到命令窗口中;如果需 要重复执行,用鼠标双击相应的命令行 即可。
• 变量名窗口:位于界面左下方,列出当前数据集中的所有变量名 称,。 除以上四个默认打开的窗口外,在 Stata 中还有数据编辑 窗口、程序文件编 辑窗口、帮助窗口、绘图窗口、Log 窗口等, 如果需要使用,可以用 Window 或 Help 菜单将其打开。
有点stata数据编辑器第一格即可复制全部数据。复制会问你是否把第一行作为变量。
方法二:导入的方式 先做好excel数据文件,并以“xml 表格(*.xml)”的形式保存,注意不能以“xml 数据(*.xml)”的形 式保存。而且注意,保存时不能在第一行中输入变量名,只能全部为数据。
• 数据的输出可通过命令直接输出和使用菜单栏输出: 1、命令输出格式 outsheet [ varlist ] using filename [ if ] [ in ] [ ,opt ] 2、使用菜单栏输出 File>>Export>>Excel spreadsheet(*.xls,*xlsx)>>选中要输出的,设 置文件名,再点击确认即可(也可以选择其它输出格式)。
STATA学习系列 ppt课件

Source | SS df -------------+-----------------------------Model | .00005593 3 Residual | .000027249 46 -------------+-----------------------------Total | .000083179 49
( 1) medage - 2.0 medagesq = 0.0
F( 1, 46) = 0.15 Prob > F = 0.7021
医学资料
8
1.Census数据,对模型分析
. vce
| medage medagesq pcturban _cons -------------+-----------------------------------medage | 1.5e-06 medagesq | -2.5e-08 4.2e-10 pcturban | 3.2e-07 -5.7e-09 6.9e-07 _cons | -.000022 3.7e-07 -5.0e-06 .00032
-----------------------------------------------------------------------------drate | Coef. Std. Err. t P>|t| -------------+---------------------------------------------------------------medage | .0006238 .0000658 9.48 0.000 pcturban | -.0035028 .0007731 -4.53 0.000 _cons | -.0076466 .0019034 -4.02 0.000 -----------------------------------------------------------------------------医学资料
stata1-5讲义
(2)然后点击倒数第四个按扭 图标,弹出一个数据库窗口,显示的是 auto 数据文件包含的具体内容。
中国人民大学 陈传波
11
chrisccb@
STATA 十八讲1入门
该数据集共有 12 列 74 行,每一列为一个变量,如第一列为汽车品牌,第二 列为价格等;每一行为一辆汽车的相关信息,如第一行的汽车是 AMC Concord, 价格为 4099 美元。
中国人民大学 陈传波
8
chrisccb@
STATA 十八讲1入门
1 STATA 入门
Stata 统计软件包是目前世界上最著名的统计软件之一,与 SAS、SPSS 一起 被并称为三大权威软件。它广泛的应用于经济、教育、人口、政治学、社会学、 医学、药学、工矿、农林等学科领域,同时具有数据管理软件、统计分析软件、 绘图软件、矩阵计算软件和程序语言的特点,几乎可以完成全部复杂的统计分析 工作。其功能非常强大且操作简单、使用灵活、易学易用、运行速度极快,在许 多方面别具一格。
Stata 的另一个特点是他的许多高级统计模块均是编程人员用宏语言写成的 程序文件(ADO 文件),这些文件可以自行修改、添加和下载。用户可随时到 Stata 网站寻找并下载最新的升级文件。这一特点使得 STATA 始终处于统计分析 方法发展的最前沿,用户几乎总是能很快找到最新统计算法的 Stata 程序版本, 而这也使得 Stata 自身成了几大统计软件中升级最多、最频繁的一个。
《stata基础》PPT课件

a
2
Stata有什么优势?
1。Stata 可以通过菜单和命令两种方式操作,命令语句简 洁明快,易学易记。
2。强大的帮助信息。 本地帮助 Help 命令名 在线帮助Findit 命令名
3。始终处于计量经济学和统计学的最前沿。许多Stata 程 序员会针对计量经济学发展编写一些最新的程序(ADO 文 件), Stata提供了严谨、简练而灵活的程序语句,用户可 以编写自己的命令和函数,同时可随时到Stata 网站寻找并 下载最新的升级文件。下载后可以直接使用,也可以自行修 改、添加功能。
describe------des 得到正确命令缩写的简单方法:看help。
a
17
几条最简单的命令
use 打开数据文件,一般加clear选型清空 内存中现有数据。 sysuse 打开系统数据文件。 describe 描述数据 edit 利用数据编辑器进行数据编辑 list 类似于edit,但只能显示不能修改数据。
a
3学习有Biblioteka 么困难?1。不同于以往的软件较多的运用菜单, Stata较多运用命令操作。(菜单很难记住和 找到)。
2。目前国内相关教材较少。
3。有些计量方法需要编程(如极大似然估 计),编程需要一定的计算机基础(不是我 们学习的重点)。
a
4
版本说明
最新版本Stata 12
我们使用的 Stata10
cd "D:\abc” 或者直接 file------open
a
16
Stata命令格式
1。Stata的命令一定要区分大小写,除了极 个别的情况下,stata命令全部用小写。 2。大部分命令可以缩写。 使用缩写可以使stata的命令书写大为简化: 例如: display-------di
STATA第五讲

&
“与” 或“和” 或 “非” 或“不”
>
大于
– 运算的优先级(从高到 低):!(或~),^,-(负 号),/,*,-(减), +,!=(或 ~=),>,<,<=,>=,==,&,| 当 忘记或者无法确定优先序的 时候,最好用括号将优先序 表达出来,在最里层括号中 的表示式将被优先执行
* /
| ~ !
第五讲、命令语句结构与运算符
• 字符运算
– 当需要把两个字符进行连接时,同样可以用加号(+)来完成。比如,把 “我”和“爱你”合并在一起,命令为: – scalar a= “I”+ “Love U”//将字符I和Love U连接并赋予a。注意:引 号必须是在英文半角状态,否则出错。 – scalar list a// 显示a的内容 – 不可以将不同类型的数据进行相加,否则将出错。例如,把数值型数据2 和字符型数据3相加就会出错。 – scalar a= 5+ “3”//将数值2和字符3相加,结果出错 – type mismatch – r(109);
第五讲、命令语句结构与运算符
• 条件语句(if exp)
– [by varlist:] command [varlist] [=exp] [if exp] [in range] [weight] [, options] 当我们 只想对满足某些条件的数据进行某类操作时,则应当考虑使用条件语句。 – 例1:假定某客户只想查看进口车的价格 – cd d:/mystata – use myauto.dta, clear – list price if foreign==1 – 例2:假定某客户只想查看价格高过10000的进口汽车信息 – list if (price>10000)&(foreign==1) – 例3:假定某客户想分类查看价格高过10000或低于6000的进口汽车和国产汽车信息 – by foreign: list if (price>10000)|(price<6000)
STATA简明讲义

中国经济研究中心 王非
一、Stata 长什么样?
首先,让我们看看 Stata 长什么样。我们以 Stata 9.1(以下简称 Stata)为例。点 击可执行文件“wstata.exe”,即可看到 Stata 的基本界面:
中间黑色背景的区域就是 Stata 的基本显示界面,数据分析的结果一般显示在这 一区域中。在我看来,黑色的背景有助于减缓视觉疲劳。如果你不喜欢这种显示 方式,可以把鼠标放在这一区域中,点击鼠标右键,进而设定自己喜欢的显示方 式。
接下来便是开启新的 log 文件的命令。“log using”命令用来开启一个 log 文件, 命令后面是 log 文件的路径和名称。值得强调的是,Stata 命令中出现文件的路径 和名称时,可以用双引号包裹起来,也可以不用。命令最后“replace”的意思是: 如果在那个路径下已经存在一个这样的文件,那么新开启的 log 文件把原文件完 全覆盖;如果你想在已经存在的 log 文件后面继续记录,可以把“replace”换成 “append”。log 文件的操作还有其他常用命令。直接运行“log”命令可以查询 当前 log 文件的工作状态;“log off”命令可以暂停 log 文件的运行,就像把录像 机暂时关掉;“log on”可以重新开始 log 文件的运行,就像重新开动录像机;如 果想查看 log 文件记录的内容,可以在“view”命令后面加上 log 文件的路径和
名称。此外,点击图标栏的 图标,也可以对 log 文件进行一系列的操作。
接下来就是导入数据、进行各种操作了。后文会逐步介绍相关的内容。
那么,怎样写这样一个 do 文件呢?主要有两种方法:一、打开一个记事本文件,
5
Stata 简明讲义
中国经济研究中心 王非
- 1、下载文档前请自行甄别文档内容的完整性,平台不提供额外的编辑、内容补充、找答案等附加服务。
- 2、"仅部分预览"的文档,不可在线预览部分如存在完整性等问题,可反馈申请退款(可完整预览的文档不适用该条件!)。
- 3、如文档侵犯您的权益,请联系客服反馈,我们会尽快为您处理(人工客服工作时间:9:00-18:30)。
Cont’d
Hausman检验 xtreg y x1 x2, fe est store fixed xtreg y x1 x2, re hausman fixed . 若卡方概率小于0.05,则用固定效应模型 (原假设为FE和RE不存在系统性差别)
23
18
Cont’d
1.4 回归诊断 检验多重共线性:vif,方差膨胀因子 (均值小于10) 检验异方差:hettest,BP检验;或者 whitetst,怀特检验 其它检验:dwstat,durbina, bgodfrey,但它们仅用于时间序列,不可 用于横截面数据。
19
STATA讲义精要
基于互联网材料改编
中国人民大学 聂辉华
2011.2.26
1
一、STATA简介
1、Stata9.0及以上版本 优点:(1)运算速度非常快;(2)简单与灵 活性兼备(命令与编程);(3)更新速度 快,可扩展性强(自行下载更新);(4)面 板数据和离散模型的分析功能非常强大,特别 适用于微观计量经济学。 缺点:数据限制,非线性估计的直观性,做图 功能差
16
Cont’d
1.2预测命令:predict [type] newvarname [if exp] [,statistic],其中的statistic常用的有以下几种:
– xb 因变量的拟合值; – resid 产生残差序列,可命名为e或uhat – stdf 残差的标准差 – covratio 产生协方差比 – dfbeta(varname) 衡量某一观测值加入前后对回归系
11
三、统计分析
1、描述性统计 (1)描述:sum var1 var2, detail,详细描 述变量的观测值个数、均值、标准差等 基本统计特征(其它选项参考help命令)。 分类描述:by year: sum var1 var3 (2)列表描述:tab或tabstat。例如, tabstat lwage educ, stats(mean median sum max min sd var skewness kurtosis)
4
二、数据管理
录入数据:点击菜单栏中的Data editor,可以手工录入 数据,并更改变量名称或属性,然后点击菜单栏中的 Save,保存为默认的.dta格式。 读取已有数据:using c:\aa.dta(或者通过菜单file-open 打开)。 从Excel中复制数据:选定并复制数据后,打开Stata的 Data editor,在左上角第一个框内ctrl+v。 导入其它格式的数据:使用Stata transfer软件,可以将 各种格式的数据转换为.dta(Stata专用)格式文件。 变量名称最好用英文字母,因为有时转换后会丢失中 文,或者变成var1、var2等。
14
四、计量分析
1、线性回归分析 1.1 语法格式:regress depvar [varlist] [weight] [if exp] [in range] [,level(#)] beta noconstant robust] 所有命令的格式通常都是:命令 被解释 变量 解释变量 条件 范围,选项;具体参 见help中的reg 例如: reg y x1 x2 if y>50,robust
10
二、数据管理
(10)进行数字计算(计算器):disp 10^(1/3),对10开 三次方 (11)(按时间)纵向合并两个数据库: – use file1 – sort varname1 – save “xx.dat” – use file2 – sort varname1 – append using file2 这样就把文件2合并到文件1的后面,前提是两者有相 同的变量,合并增加了观测值的个数。 横向合并:最后一行命令改为:merge varname1 using file1
3
一、STATA简介
3、网络帮助资源
(1)Stata 公司主页上有相关的帮助信息。 /support/faqs/, /links/resources.html, 是一些常见的问题和相关 的资源。 (2)UCLA 网站上有大量的例子可供参考。 /stata/。 (3)Boston college 经济系有相关的程序文件可以下载使用。 http://ideas.uqam.ca/ideas/data/bocbocode.html,有些有限制。 (4)其他资源:/stats/stata 。 这些网络资源非常重要,在上述网页上可以搜索到许多STATA中 所没有的程序。
8
二、数据管理
(4)计算观测值个数:count if var>=10,if后面 的条件可选 (5)排序: sort var1 var2(默认为升序)。 (6)改名:rename var1 var2,将变量1改为2。 (7)替换:replace var1=var2 [if] ,对变量重新 赋值。 (8)recode var2 1=2 5= 6 *=3,修改变量2中的 值,如1改为2,5改为6,其余各值改为3。
21
四、计量分析
4、面板数据(panel data) 编制面板:tsset id time,当然横轴也可 以是地区、行业或其它维度 命令结构:在reg之前加xt,例如xtreg、 xtlogit、xtivreg等 固定效应模型:xtreg y x1 x2, fe 随机效应模型:xtreg y x1 x2, re,缺少选 项默认为随机效应模型
四、计量分析
5、动态面板数据(Dynamic Panel Data) 方程右边包含了因变量的滞后项(可以推广到 多阶滞后),因此称之为动态面板模型。 估计方法为GMM,包括差分GMM和系统 GMM 命令结构为:xtabond2 depvar varlist [if exp] [in range] [weight] [, level(#) twostep robust noconstant small noleveleq orthogonal gmmopt [gmmopt ...] ivopt [ivopt ...] artests(#) arlevels h(#) nodiffsargan nomata]
5
二、数据管理
变量管理:对变量进行改变 最重要的是产生新变量的命令generate or gen or g 表示运算的符号:等于、加、减、乘、除、乘 方、指数、对数、滞后、领先和差分分别对应 于=, +, -, *, / ,^ , exp, log, l., f., d.)。 表示逻辑关系的符号:&表示and,|表示or,!= 表示不等,= =表示相等。 表示大小关系的符号:>,<,>=,<=。 表示条件关系的命令:if
9
二、数据管理
(9)通过其他方式产生新变量: 产生均值或总值:by id: egen y=total(x)或by id: egen mx=mean(x) 产生单个虚拟变量:gen x=(age>60),大于60 岁的赋值为1,否则为0。 产生系列虚拟变量:xi[, prefix(string)] i.year, 生成诸如1999y、2000y等。 将文字格式转换为数值格式:encode/destring var1, replace
12
Cont’d
相关性分析:corr or pwcorr。例如,cor y x1 x2 x3,就生成了相关系数矩阵。 偏相关性分析:pcorr。例如,pwcorr x y z, sig star(0.01),可以观察相关度是否在 1%的水平上显著 t检验:ttest x, by(treatment) ,其中 treatment为虚拟变量
20
四、计量分析
3、工具变量 工具变量的思想与两阶段OLS类似 命令结构为:ivreg depvar [var1] (var2 = var_iv) [if] [in] [weight] [, options],此时 var_iv是var2的工具变量 此时通常需要进行内生性检验(残差检 验)以及过度识别检验
四、计量分析
2、非线性回归分析 限值因变量模型:logit/probit y x1 x2,此时因 变量为二元虚拟变量 截断模型:tobit y x1 x2,此时因变量为超过某 个临界值的数值 计数模型:poisson,此时因变量为离散的正数 多元限值因变量模型:mlogit/ologit 以上命令详见Stata之help
6
二、数据管理
生成序列号id 非面板序列:sort var1,然后gen id=_n; 面板序列:先是sort var1,然后根据相同 的var1再顺序赋予id,即egen id=group(var1),然后排列成面板,tsset id year。或者在录入时,按照id1、 time1,id2、time2的顺’d
1.3 各种基本检验 test varlist (F检验) test indepvarname (t检验) test indepvar1=indepvar2[=indepvar3….] 举例:test x1 x2,检验x1和x2是否同时 为0,等价于x1=x2=0 详见help中的test
2
一、STATA简介
2、学习使用 可以通过工具栏操作,但最好输入命令(只认 小写英文),按回车键运行 Stata的命令起始语通常可以简写为前三个字 母,如regress与reg等同 设定内存
set memory 500m, perm set maxvar 1000
充分利用工具栏的help,尤其是其中的Stata command或search
7
二、数据管理
解释与应用
(1)生成新变量: gen x2=(x1+10)/2,gen lnx=log(x),gen l_x=l.x, gen y=x^2。 (2)列举:list [variablenames] in n1/n2,列出数据库中变 量从第n1到第n2个观测值。 list [variablenames] in n1/l, 列出从第n1到最后一个的 观测值。 list if salary>=5000,列出工资超过5000的观测值。 (3)删除:drop if salary==. | salary==0,删除某些观测 值。 (4)保留:keep if year>2008,保留2008年以后的观测 值;keep var1 var2 var4,只保留变量1、2、4。