厦门大学化学化工学院FLS980 稳态瞬态荧光光谱仪样品检测申请登记表
荧光分光光度计申请购置论证报告.doc-贵州大学

贵州大学申请购置大型贵重仪器设备论证报告设备名称:荧光分光光度计申请单位(公章):化学与化工学院设备购置责任人:肖仁贵设备管理实验室名称:大学化学教学与实验中心填表时间:2014年8月4日注: 1. 凡购置大型贵重仪器设备用于实验教学的,需附教学计划、教学大纲等有关资料。
2. 凡教育部管23种仪器设备及单价10万元及以上大型贵重仪器设备需认真填写此表,一式三份。
贵州大学申请购置大型贵重仪器设备论证报告(表1)申请单位:(公章)化学与化工学院设备购置责任人:肖仁贵贵州大学申请购置大型贵重仪器设备论证报告(表2)申请单位:(公章)化学与化工学院设备购置责任人:肖仁贵填表说明:“年均人数”为可能使用拟购置设备的专业学生人数;“学时/年”为利用该设备所开实验的预计年学时数;“计划人时数”=“年均人数”ד学时/年”。
贵州大学申请购置大型贵重仪器设备论证报告(表3)申请单位:(公章)化学与化工学院设备购置责任人:肖仁贵贵州大学申请购置大型贵重仪器设备论证报告(表4)申请单位:(公章)化学与化工学院设备购置责任人:肖仁贵贵州大学申请购置大型贵重仪器设备论证报告(表5)申请单位:(公章)化学与化工学院设备购置责任人:肖仁贵贵州大学申请购置大型贵重仪器设备论证报告(表6)申请单位:(公章)化学与化工学院设备购置责任人:肖仁贵附表1政府采购进口产品申请表附表2政府采购进口产品所属行业主管部门意见政府采购进口产品专家论证意见附:技术指标:荧光分光光度计一.设备的主要用途、功能及特点该设备可用于食品、饲料、生化样品、药品以及环境样品中荧光物质的定性定量分析。
可同时测定荧光、磷光、化学和生物发光。
软件具有扫描(激发光谱、发射光谱、三维光谱、同步光谱、等高线图)、浓度、动力学、时间分辨以及仪器校准、性能认证等功能。
二.技术参数及指标(带*者为必须具备指标)*2.1、光源:闪烁式氙灯,脉冲半峰宽小于2微秒,功率相对于连续发光时的75KW,氙灯只在工作时才闪烁;2.2、水平狭缝光路,采用标准比色皿(1cm光程)测试样品量最少体积0.5mL;2.3、切尼-特纳型单色器,超低杂散光。
EI操作手册稳态瞬态荧光光谱仪(FLS 920)操作说明书
Edinburgh InstrumentFLS920User Manual目录一、开机步骤 (2)二、实验操作 (4)1、实验前准备 (4)2、稳态实验 (6)A、发射光谱实验 (6)B、激发光谱实验 (9)C、同步谱 (10)D、Map (11)E、偏振光谱 (12)3、低温实验 (17)A、液氮冷却系统(Oxford) (17)B、ARS冷却系统 (19)4、样品衰减操作 (22)A、纳秒、皮秒级衰减 (22)纳秒灯为光源 (22)激光器为光源 (27)B、微妙、毫秒级衰减 (29)三、数据处理 (32)1、数据一般处理 (32)2、稳态光谱 (33)3、瞬态光谱 (33)四、附录 (36)1、氢灯清洗方法 (36)一、开机步骤1、打开总电源(开之前保证所有仪器开关关闭)2、开启PH13、开启PMT制冷电源CO14、开启光谱仪控制电源CD920(控制盒)或样品室下方的控制板电源此为控制盒此为控制板5、根据需要的光源开启氙灯或是其它灯源电源此为氙灯电源此为氢灯电源6、开启电脑,同时将谱仪样品室上方盖子移开。
待进入操作系统后进入F900软件。
二、实验操作 1、实验前准备在做实验前有几点需要注意:A 、 对于红敏PMT (R928),其制冷必须达到一定温度,一般为室温-40℃左右。
待C O 1显示在-17℃左右的时候,在软件的S i g n a l R a t e 窗口里观察E m 1的C P S 读数显示。
若其读数维持在50C P S 以下,则表明读数正常,P M T 制冷达到工作状态,可以用该探测器进行实验。
Fig.2.1 B 、 对于近红PMT (5509),其必须准备以液氮杜瓦罐(约15升左右),将制冷部件的管子插入罐中,开启制冷电源Fig.2.2制冷电源杜瓦罐通气管道电源开启后,其显示屏上有两行显示,一行为设定的80k,一行为PMT的温度显示。
PMT温度显示会很快显示为80k(约一分钟内)。
仪器预约单
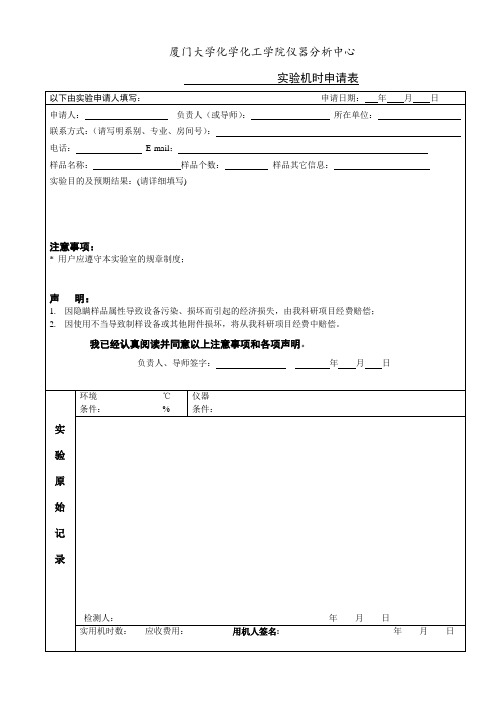
实验机时பைடு நூலகம்请表
以下由实验申请人填写:申请日期:年月日
申请人:负责人(或导师):所在单位:
联系方式:(请写明系别、专业、房间号):
电话:E-mail:
样品名称:样品个数:样品其它信息:
实验目的及预期结果:(请详细填写)
注意事项:
*用户应遵守本实验室的规章制度;
声明:
1.因隐瞒样品属性导致设备污染、损坏而引起的经济损失,由我科研项目经费赔偿;
2.因使用不当导致制样设备或其他附件损坏,将从我科研项目经费中赔偿。
我已经认真阅读并同意以上注意事项和各项声明。
负责人、导师签字:年月日
实
验
原
始
记
录
环境℃
条件:%
仪器
条件:
检测人:年月日
实用机时数:应收费用:用机人签名:年月日
稳态瞬态荧光光谱仪(FLS 920)操作说明书

稳态/瞬态荧光光谱仪(FLS 920)操作说明书中级仪器实验室一、仪器介绍1.FLS 920稳态/瞬态荧光光谱仪具有两种功能稳态测量:激发光谱(荧/磷光强度~激发波长)、发射光谱(荧/磷光强度~发射波长)、同步扫描谱(固定波长差、固定能量差、可变角)。
瞬态测量:荧光(磷光)寿命(100ps—10s)。
适合各类液体和固体样品的测试。
2.主要应用高分子和天然高分子自然荧光的研究溶液中大分子分子运动的研究固体高分子取向的研究高聚物光降解和光稳定的研究光敏化过程的研究3.主要性能指标光谱仪探测范围:(光电倍增管, 190-870nm;Ge探测器,800-1700nm)荧光寿命测量范围:100ps-10s信噪比:6000:1(水峰Raman)可以配用制冷系统,为样品提供变温环境液氮系统(77K-320K)使用Glan棱镜,控制激发光路、发射光路的偏振状态使用450W氙灯和纳秒、微秒脉冲闪光灯做激发光源F900系统软件:控制硬件,包括变温系统,数据采集、分析4. 仪器主要部分结构图5.仪器光路图二、仪器测试原理(SPC)时间相关单光子计数原理是FLS920测量荧光寿命的工作基础。
时间相关单光子计数法(time-correlated single photon counting)简称“单光子计数(SPC)法”,其基本原理是,脉冲光源激发样品后,样品发出荧光光子信号,每次脉冲后只记录某特定波长单个光子出现的时间t,经过多次计数,测得荧光光子出现的几率分布P(t),此P(t)曲线就相当于激发停止后荧光强度随时间衰减的I(t)曲线。
这好比一束光(许多光子)通过一个小孔形成的衍射图与单个光子一个一个地通过小孔长时间的累计可得完全相同的衍射图的原理是一样的。
三、测量之前需要特别注意的事项1. 在切换光源、修改设置或放样品之前必须把狭缝(Δλ)关到最小(0.01nm),否则会损坏光电倍增管!如果打开样品室盖子之后,Em1的Signal Rate增加,请停止实验并立即与工作人员联系!2. 测量样品的瞬态性质之前,请用F4500荧光光谱仪对样品的稳态性质进行表征,了解样品的激发光谱和发射光谱及最佳激发波长和发射波长;3. 用PMT检测时,必须等稳压电源CO1的温度示数在-17℃以下才可以开始采集数据;4. 严禁用稳态瞬态荧光光谱仪测量未知样品紫外可见区的稳态光谱!5. 狭缝范围0.01~18nm,调节时注意不要超过其上限;6. 每次设置完参数后都要点击Apply或者回车键确定;7. 文件保存路径为:C:\users\导师\自己文件夹;8. 用未开封的新软盘拷贝数据;9. 如实填写仪器使用记录,爱护仪器。
XPS光电子能谱仪测试申请表20170505
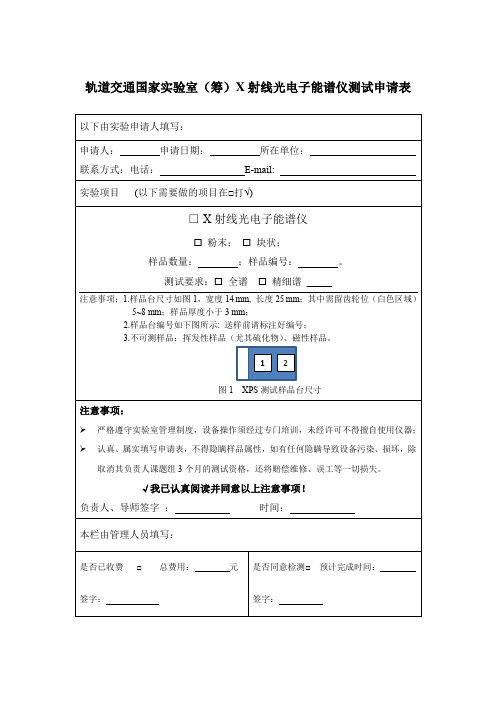
3.不可测样品:挥发性样品(尤其硫化物)、磁性样品。
图1XPS测试样品台尺寸
注意事项:
严格遵守实验室管理制度,设备操作须经过专门培训,未经许可不得擅自使用仪器;
认真、属实填写申请表,不得隐瞒样品属性,如有任何隐瞒导致设备污染、损坏,除取消其负责人课题组3个月的测试资格,还将赔偿维修、误工等一切损失。
轨道交通国家实验室(筹)
以下由实验申请人填写:
申请人:申请日期:所在单位:
联系方式:电话:E-mail:
ቤተ መጻሕፍቲ ባይዱ实验项目(以下需要做的项目在□打√)
□X射线光电子能谱仪
粉末;块状;
样品数量:;样品编号:。
测试要求:全谱精细谱_____
注意事项:1.样品台尺寸如图1,宽度14mm,长度25mm;其中需留齿轮位(白色区域)5~8mm;样品厚度小于3mm;
√我已认真阅读并同意以上注意事项!
负责人、导师签字:时间:
本栏由管理人员填写:
是否已收费□总费用:元
签字:
是否同意检测□预计完成时间:
签字:
东华大学化工学院荧光光谱仪评标结果公告
东华大学化工学院荧光光谱仪评标结果公告
东华大学资产管理处就东华大学化工学院金相显微镜购置项目(招标编号:DHDXSB2014009)进行公开招标。
2014年6月16日和6月23日在东华大学资产管理处网上公开发布招标信息,至投标截止时间2014年6月30日14∶30分止,共有1家单位准时递交了投标文件。
2014年7月4日上午,资产管理处组织召开了开标/评标会议。
现将本次评标结果公布如下:
中标单位:天美科技有限公司
中标金额:59300美元
如对本次中标结果有异议,请于评标结果公布之日起5个日历天内以书面形式向东华大学监察审计处提出质疑。
资产管理处
2014年7月4日。
FLS920操作手册
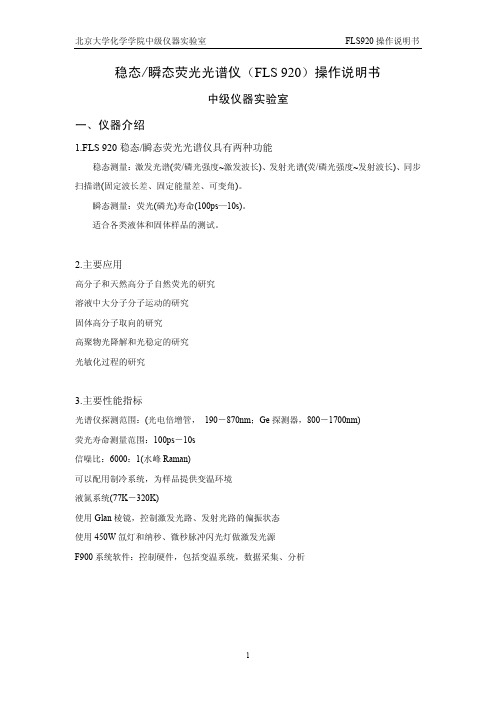
稳态/瞬态荧光光谱仪(FLS 920)操作说明书中级仪器实验室一、仪器介绍1.FLS 920稳态/瞬态荧光光谱仪具有两种功能稳态测量:激发光谱(荧/磷光强度~激发波长)、发射光谱(荧/磷光强度~发射波长)、同步扫描谱(固定波长差、固定能量差、可变角)。
瞬态测量:荧光(磷光)寿命(100ps—10s)。
适合各类液体和固体样品的测试。
2.主要应用高分子和天然高分子自然荧光的研究溶液中大分子分子运动的研究固体高分子取向的研究高聚物光降解和光稳定的研究光敏化过程的研究3.主要性能指标光谱仪探测范围:(光电倍增管, 190-870nm;Ge探测器,800-1700nm)荧光寿命测量范围:100ps-10s信噪比:6000:1(水峰Raman)可以配用制冷系统,为样品提供变温环境液氮系统(77K-320K)使用Glan棱镜,控制激发光路、发射光路的偏振状态使用450W氙灯和纳秒、微秒脉冲闪光灯做激发光源F900系统软件:控制硬件,包括变温系统,数据采集、分析4. 仪器主要部分结构图5.仪器光路图二、仪器测试原理(SPC)时间相关单光子计数原理是FLS920测量荧光寿命的工作基础。
时间相关单光子计数法(time-correlated single photon counting)简称“单光子计数(SPC)法”,其基本原理是,脉冲光源激发样品后,样品发出荧光光子信号,每次脉冲后只记录某特定波长单个光子出现的时间t,经过多次计数,测得荧光光子出现的几率分布P(t),此P(t)曲线就相当于激发停止后荧光强度随时间衰减的I(t)曲线。
这好比一束光(许多光子)通过一个小孔形成的衍射图与单个光子一个一个地通过小孔长时间的累计可得完全相同的衍射图的原理是一样的。
三、测量之前需要特别注意的事项1. 在切换光源、修改设置或放样品之前必须把狭缝(Δλ)关到最小(0.01nm),否则会损坏光电倍增管!如果打开样品室盖子之后,Em1的Signal Rate增加,请停止实验并立即与工作人员联系!2. 测量样品的瞬态性质之前,请用F4500荧光光谱仪对样品的稳态性质进行表征,了解样品的激发光谱和发射光谱及最佳激发波长和发射波长;3. 用PMT检测时,必须等稳压电源CO1的温度示数在-17℃以下才可以开始采集数据;4. 严禁用稳态瞬态荧光光谱仪测量未知样品紫外可见区的稳态光谱!5. 狭缝范围0.01~18nm,调节时注意不要超过其上限;6. 每次设置完参数后都要点击Apply或者回车键确定;7. 文件保存路径为:C:\users\导师\自己文件夹;8. 用未开封的新软盘拷贝数据;9. 如实填写仪器使用记录,爱护仪器。
厦门大学化学化工学院
厦门大学化学化工学院
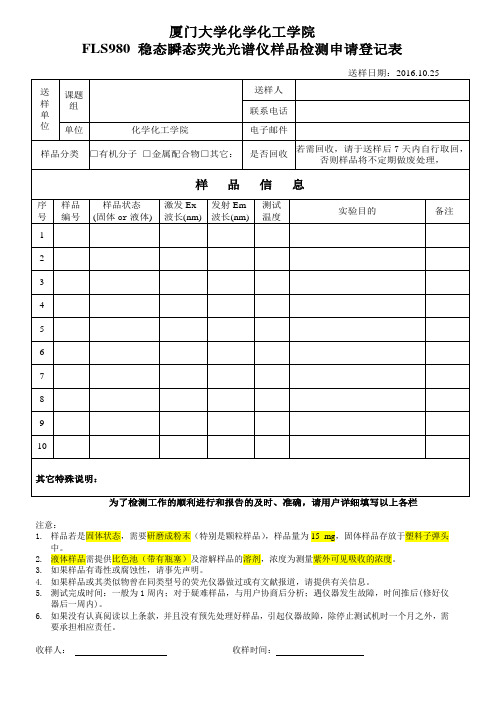
FLS980 稳态瞬态荧光光谱仪样品检测申请登记表
注意:
1.样品若是固体状态,需要研磨成粉末(特别是颗粒样品),样品量为15 mg,固体样品存放于塑料子弹头
中。
2.液体样品需提供比色池(带有瓶塞)及溶解样品的溶剂,浓度为测量紫外可见吸收的浓度。
3.如果样品有毒性或腐蚀性,请事先声明。
4.如果样品或其类似物曾在同类型号的荧光仪器做过或有文献报道,请提供有关信息。
5.测试完成时间:一般为1周内;对于疑难样品,与用户协商后分析;遇仪器发生故障,时间推后(修好仪
器后一周内)。
6.如果没有认真阅读以上条款,并且没有预先处理好样品,引起仪器故障,除停止测试机时一个月之外,需
要承担相应责任。
收样人:收样时间:。
厦门大学研究、教学、测试用实验动物申请使用表
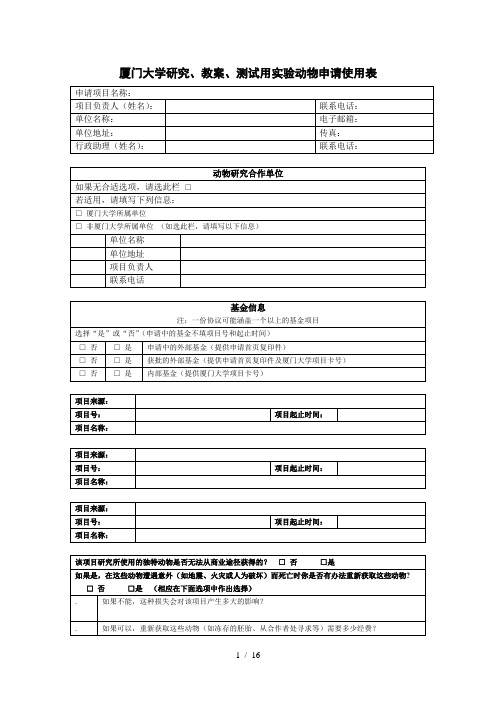
厦门大学研究、教案、测试用实验动物申请使用表申请项目名称:项目负责人(姓名):联系电话:单位名称:电子邮箱:单位地址:传真:行政助理(姓名):联系电话:动物研究合作单位如果无合适选项,请选此栏□若适用,请填写下列信息:□厦门大学所属单位□非厦门大学所属单位(如选此栏,请填写以下信息)单位名称单位地址项目负责人联系电话基金信息注:一份协议可能涵盖一个以上的基金项目选择“是”或“否”(申请中的基金不填项目号和起止时间)□否□是申请中的外部基金(提供申请首页复印件)□否□是获批的外部基金(提供申请首页复印件及厦门大学项目卡号)□否□是内部基金(提供厦门大学项目卡号)项目来源:项目号:项目起止时间:项目名称:项目来源:项目号:项目起止时间:项目名称:项目来源:项目号:项目起止时间:项目名称:该项目研究所使用的独特动物是否无法从商业途径获得的?□否□是如果是,在这些动物遭遇意外(如地震、火灾或人为破坏)而死亡时你是否有办法重新获取这些动物?□否□是(相应在下面选项中作出选择). 如果不能,这种损失会对该项目产生多大的影响?. 如果可以,重新获取这些动物(如冻存的胚胎、从合作者处寻求等)需要多少经费?申请使用表填写指南厦门大学实验动物管理与伦理委员会是由生物、医学、药学、兽医、管理等不同专业背景的人员组成。
考虑到委员会成员不同的专业知识,请使用通俗易懂的语言进行描述。
. 简要描述所推荐项目的总体及具体目标。
. 简要描述所推荐项目与人类和或动物健康的关联,以及课题的社会意义。
. 进行动物实验的理由,以及“替代、减少、优化”的原则(; ; ):对使用动物做实验提供科学论据是法律、道德和伦理的义务。
包括具体的需求物种、已认真考虑过减少使用动物及减少动物痛苦的实验方案。
基于上述前提,请填写下列信息。
. 该申请使用表所述程序中有没有不使用动物的替代方案?如果有,为何不考虑使用该替代方案?. 本实验在避免动物的疼痛和苦难方面(包括减少疼痛和危险性等)作了哪些尝试?. 解释所选物种为什么是实施该项目的最佳物种,如以解剖学、生理学或其他特征因素作为参考条件对物种的选择作出一个科学的解释。
爱丁堡仪器FLS980光致发光光谱仪用户手册说明书

Photoluminescence Spectrometer (FLS980)Instrument Summary:The Edinburgh Instruments’ FLS980 photoluminescence spectrometer offers both steady state and time resolved (lifetime) fluorescence spectroscopy measurements of solid and liquid samples. The instrument is equipped with four tunable, pulsed repetition rate lasers (wavelengths including: 315, 375, 635, and 980 nm), a flashlamp, and a xenon arc lamp. The FLS980 incorporates two silicon detectors (200-1100 nm) and an InGaAs detector. By combining time correlated single photon counting (TCSPC) and multi-channel scaling (MCS) the FLS980 excels in fluorescence lifetime measurements which span 12 orders of magnitude, ranging from picoseconds to seconds.Figure 1. The Edinburgh Instruments FLS980, photoluminescence spectrometer.Safety and Precautions:∙Startup: If you are the first user of the day, turn on the FLS980 and let it run for 20 min.∙Shutdown:Turn off the lamp’s and instrument if you are the last user for the day.∙Warning: Avoid running a steady-state excitation or emission scan in which λEx= λEm.∙Warning: Check the compatibility of liquid samples with your cuvettes. Plastic cuvettes (Ex: Polystyrene) can absorb organic liquids (Ex: Toluene) and can leak in the instrument.∙Check:If you do not get signal, check the beam dump to ensure the instrument is configured properly. Additionally, check to make sure there are no optical filters.I. Experiment Planning:1.Determine the Approximate Fluorescence Profiles of your Sample –It is useful to havea basic understanding of the excitation and emission wavelengths of your sample beforestarting an experiment. If the sample has unknown fluorescence properties you can runa signal probing experiment to determine approximate values for excitation and emission.See the “Analysis of Unknown Samples” section below.2.Steady-State Measurement – After determining the approximate excitation and emissionvalues you will want to run a “Steady-State Excitation Scan” and a “Steady-State Emission Scan” to more accurately determine the fluorescence properties of your sample.3.Lifetime Measurement – After determining the steady-state properties of your sample,you are ready to measure the “Fluorescence Lifetime” using either a pulsed LED laser or the flash lamp.II. Start the FLS980:1.Turn on the Instrument –Flip the “PH1” toggle switch behind the computer monitor.2.Turn on the Fan –Flip the “CO1” toggle switch located behind the monitor.3.Turn on Xe Lamp – Flip the lower toggle switch located on the back of the Xe lamp.4.Instrument Stabilization– Allow the instrument to stabilize for 20 minutes.5.Ignite the Xe Lamp– Press and hold the silver button located on top of the instrument.6.Open the Software – Open the Desktop (Password:RandLab). Click the “F980” Icon. III. Insert a Sample:1.Open the Chamber– Lift the circular lid off the top of the FLS980.2.Check Instrument Configuration – Ensure that the beam dump is oriented in the correctposition and that no glass filters are inserted in the path of the beam.3.Insert the Sample in the Holder –The FLS980 can be configured to accommodatecuvettes and films. The mounts are kept in the sample chamber or in the drawers beneath the instrument.*Cuvette Note 1: For liquid samples it is best to utilize dilute concentrations. Samples with high concentrations can limit penetration of the beam through the cuvette. This “inner filter effect” will hurt accuracy of excitation scans. Check to make sure the beam fully penetrates through the liquid.*Cuvette Note 2: Check the compatibility of liquid samples with your cuvettes. Plastic cuvettes (Ex: Polystyrene) can absorb organic liquids and could leak in the instrument.4.Close the Chamber – Replace the lid on the FLS980, this compresses the interlock.5.Position the Sample to Maximize Signal– The sample can be oriented back and forth tomaximize signal by turning the black knob located on the front of the instrument. Check the counts detected in the “Signal Rate Window”.IV. Analysis of Unknown Samples:*Note: For unknown samples it is useful to do a manual excitation and emission scan using the signal rate window. This will provide approximate excitation and emission values prior to running more accurate steady-state excitation and emission scans.1.Open the Signal Rate Window –The “Signal Rate Window” lists live counts as recordedwithin the instrument and can be used to optimize signal parameters (See Figure 2).2.Set the Bandwidth (Δλ) to~0.1–The bandwidth governs the amount variation inwavelength. By setting a low value for unknown samples we prevent detector saturation.3.Set the Step Sizes to ~5 nm – The step size controls the step size taken when scanningthe spectrum. By setting a large step size we can quickly assess the sample.4.Set the Excitation and Emission Wavelengths –Set λEx to ~300 nm and λEm to ~400 nm.5.Manually Increase the Excitation λ–Press the arrow key to iteratively increase theexcitation λ by 5 nm. Monitor the emission signal; look for an increase in CPS. If no signal is detected in this range, increase λEx to ~400 nm and λEm to ~500 nm and continue.6.Scan the Emission λ Range –Once the excitation peak is determined, enter this value asthe excitation wavelength. Next iteratively step through the emission spectrum to find the maximum emission λ.7.Record Approximate Excitation and Emission Wavelengths –These values will helpdesign a steady-state fluorescence procedure.8.Adjust Sample Position – Use the translator knob to adjust sample position and maximizesignal.Figure 2. Screenshot of the signal rate window.*Note: During a steady-state emission scan, the excitation λ is held constant and the detector is used to incrementally scan the light emitted by the sample to determine the emission profile.1.Setup the Emission Scan Parameters– Open the signal rate window and set values.o Excitation Wavelength –Enter an excitation wavelength (λEx), this wavelength (constant) should be at a λ which excites the sample and at least 15 nm shorterthan the onset of the emission profile.o Emission Wavelength –Enter the emission wavelength (λEm), this wavelength should correspond approximately with the emission peak.o Enter Step Size and Band Width –A step size of 0.2 nm and a Δλ of 1.0 should work for most samples.o Select a Light Source and Detector– The Xe900 lamp and the PMT detector should work for most samples.2.Click the “Apply” B utton – This stores the settings in the software.3.Check the Signal – The sample should produce a detectable signal that is between 0 and2 million CPS. If the signal is >2 million CPS, reduce the Iris setting from 100% until thesignal drops below 2 million CPS.4.Open the Steady-State Window –Press the λ icon to open the steady-state scan options.o Check the General Tab– For emission scans select the: EmCorr Scan option.o Check the Excitation Tab–The excitation settings should reflect the settings selected in the signal rate window.5.Update the Emission Tab –Update the “Emission Scan Parameters” options at the bottomof the window.o Scan Range – The scan should begin at a wavelength that is at least 15 nm greater than the λEx value (i.e.λEm Start= λEx + 15 nm) and end at a final value that is ~200nm greater than the starting wavelength (i.e.λEm Stop= λEm Start + 200 nm).o Step – 1.00 nm is a standard step size.o Dwell Time – 0.2 Seconds.o Number of Scans – 5 Scans (this will average data collection over 5 runs).6.Insert a Filter –Add an appropriate high-pass filter that is betweenλEx and λEm Start.o Check for and remove any previous filters.7.Press Start to begin the Scan –The experiment can be aborted by hitting the stop sign.Figure 3. Emission Scan Setup Window.*Note: During a steady-state excitation scan, a constant emission wavelength is monitored to determine CPS produced as the excitation wavelength is varied (See Figure 4).1.Setup the Excitation Scan Parameters– Open the signal rate window and set values.o Excitation Wavelength –Enter an excitation wavelength (λEx), this wavelength should correspond approximately with the excitation peak.o Emission Wavelength –Enter the emission wavelength (λEm), this λshould correspond to a value that is longer than the upper limit of the excitation range.o Enter Step Size and Band Width –A step size of 0.2 nm and a Δλ of 1.0 should work for most samples.o Select a Light Source and Detector – The Xe900 lamp and the PMT detector should work for most samples.2.Click the “Apply” Button – This stores the settings in the software.3.Check the Signal – The sample should produce a detectable signal that is between 0 and2 million CPS. If the signal is >2 million CPS, reduce the Iris setting from 100% until thesignal drops below 2 million CPS.4.Open the Steady-State Window –Press the λ icon to open the steady-state scan options.o Check the General Tab– For excitation scans select: Recording Ref Data.o Check the Emission Tab–The emission settings should reflect the settings selected in the signal rate window.5.Update the Excitation Tab –Update the “E xcitation Scan Parameters” options at thebottom of the window.o Scan Range – The scan should end at a wavelength that is at least ~15 nm less than the emission wavelength value (i.e.λEx Stop= λEm - 15 nm) and start at a value thatis ~200 nm less than the emission wavelength (i.e.λEx Start= λEm - 200 nm).o Step – 1.00 nm is a standard step size.o Dwell Time – 0.2 Seconds.o Number of Scans – 5 Scans (this will average data collection over 5 runs).6.Insert a Filter –Add an appropriate high-pass filter that is betweenλEm and λEx Stop.o Check for and remove any previous filters.7.Press Start to begin the Scan –The experiment can be aborted by hitting the stop sign.Figure 4. Excitation Scan Setup Window.VII. Lifetime Scan:*Note: A lifetime scan can be performed after obtaining the steady-state excitation and emission profile of a sample.1.Configure the Instrument for Lifetime Measurements– Flip the beam dump over to blockthe Xe lamp. Rotate the sample holder 90 ° to face the LED laser source.2.Choose an Appropriate Light Source– Review the excitation and emission data, select alaser closest to the excitation peak of your sample. A range of pulsed LED lasers are available with wavelengths including: 315, 375, 635, and 980 nm. Additionally, a flashlamp is available for samples with long lifetimes.3.Mount the Light Source – Loosen the knob under the current LED source and slide theprevious LED off of the mount. Cap the LED using a red LED end cap. Unplug the red and black cords from the previous LED and connect with the appropriate LED laser. Slide the new LED on the mount and retighten the knob under the LED.4.Turn the LED On – Turn the key on the back of the LED. Wait for the blinking light to stopblinking and stay lit. Then press the red button.5.Select a Repetition Rate – Turn the dial on the LED to a desired repetition rate. This rateshould be long enough to capture the full lifetime of the sample, yet short enough to efficiently collect and bin the data.6.Open the Signal Rate Window – Change the source to the TCSPC Laser. Increase ΔλEm to~5.00 nm. Ensure that the Emission signal is < 2% of the TCSPC’s excitation value. Rotate the optical power knob on the LED to reduce the excitation signal if necessary.7.Open the Lifetime Window– Press the τ icon and select “New Lifetime”.8.Edit Lifetime Settings:o Time Range– This setting should roughly match value selected on the LED dial.o Channels– Set the number of channels (~2048) that you would like to bin data in.Higher values give better resolution but divides counts across more bins.o Stop Condition– Set the Peak counts to value ~2000 counts.9.Press Start – The experiment can take several minutes to hours.10.Check Data– The data should present a peak with a gradually sloping tail. If the data isbinned in such that a series of horizontal lines begin to form, then it is likely that the repetition rate is too high. If this is the case, adjust the knob on the LED and update the Time range setting in the software.*Note: For samples which have extremely fast lifetimes, it may be necessary to deconvolve the instrument’s response function (IRF) from the data. If this is the case, select the “IRF”setting and first run an IRF scan before analyzing your sample.VIII. Data Analysis:bining Spectra–Click the “Join Visible” button at the top of the software. This willcreate a new window that plots multiple spectra on the same graph for comparison.2.Normalizing Data – Data is often normalized for presentation. To normalize data, click“Data”, “Normalize”, select the desired file, and enter a normalized value (Ex: 1.0).3.Data Fitting–Select “Analysis” → “Ex. Tail Fit” → estimate a value for τ1 and select the“Time Resolved Emission Scan (TRES)” option. Alter the τ1 value if it fits the data poorly.4.Saving Data–Export data by selecting “File” and “Export Data to ASCII”.IX. Instrument Shutdown:1.Remove Samples from the Instrument–Remove samples and clean up the instrument.2.Remove Filters from the Instrument – This helps the next user.3.Turn off the Lamp– If you are the last user of the day, turn off the Xe lamp. Allow ~15minutes for the lamp to cool down before powering off the cooling unit.4.Turn off the Fan and Main Power Switch– After the lamp has cooled sufficiently, turn offthe remaining toggle switches in the reverse order as that used to turn on the instrument (turn off CO1 followed by PH1).5.Sign the Log Book.6.Log Off of the Instrument.Emergency Information:Medical Emergencies: Contact 911 and Public Safety (609) 258-1000Room / facility emergencies: Contact Public Safety (609) 258-1000Issues related to the instrument:1. Contact IAC Staff.2.If unsure, leave system as is.3. Try to power down the system.Audible/Siren Emergency Alerts:Follow previous steps 2 & 3 and leave the building.Emergency Contact Information:Nan Yao: Office (609) 258-6394; Cell (908) 922-2236 Email: ******************John Schreiber: Office (609) 258-0034; Cell (215) 431-4670 Email: ******************Paul Shao: Office (609) 258-3851; Cell (847) 721-086 Email: *******************Daniel Gregory: Office (609) 258-7956; Cell (302) 542-3182 Email: ****************************Yao-Wen Yeh: Office (609) 258-7956; Cell (848) 248-8058 Email: ******************。
拟购置仪器设备名称:
拟购置仪器设备名称:Cary Eclipse荧光光谱仪申请购置单位:材料与化学化工学部
购置负责人:
填表时间:年月日
填表说明
1、本表适用于申请购置单价10万元人民币及以上、批量总价20万元人民币及以上仪器设备的可行性论证使用。
2、本表第一项至第五项的内容由仪器设备购置申请人、负责人按表中各栏目要求认真填写。
具体内容真实、详尽。
其余内容由购置单位或学校有关部门填写。
3、购置单价40万元人民币及以上仪器设备的专家论证工作由学校组织,其他可由申请购置单位组织专家论证工作(专家组由五名及以上具备高级专业技术职务的人员组成)。
4、购置单价40万元人民币及以上仪器设备由校长审批生效,其他由分管校领导审批生效。
5、本表一式一份,一律为A4大小,双面打印,左侧装订。
用钢笔、签字笔填写,或用计算机打印。
一、基本信息
二、主要技术性能指标和配置要求
三、设备购置的必要性及可行性论证
(一)购置该设备的必要性(含该设备的主要用途和工作任务等)
(二)购置预估单价40万以上设备者,对校内同类设备现状及其使用情况的调研
(三)主要技术性能指标和配置的先进性和合理性
(四)效益预测
(五)设备共享方案
(六)安装使用的环境及设施条件(请说明是否具备安装条件或拟改造要求)
(七)拟放置地点及管理人
四、市场调研情况
(一)对符合需求的国内外同类产品的调研情况
(二)对上述产品调研情况的比较、分析
五、设备购置负责人意见
六、购置单位意见
七、专家组论证意见
八、实验室与设备管理处意见
九、分管校领导意见
十、校长意见
9。
稳态瞬态荧光光谱仪操作说明书范文

稳态瞬态荧光光谱仪操作说明书稳态/瞬态荧光光谱仪(FLS 920)操作说明书一、仪器测试原理时间相关单光子计数原理是FS920测量荧光寿命的工作基础。
时间相关单光子计数法(time-correlated single photon counting)简称“单光子计数(SPC)法”,其基本原理是,脉冲光源激发样品后,样品发出荧光光子信号,每次脉冲后只记录某特定波长单个光子出现的时间t,经过多次计数,测得荧光光子出现的几率分布P(t),此P(t)曲线就相当于激发停止后荧光强度随时间衰减的I(t)曲线。
这好比一束光(许多光子)经过一个小孔形成的衍射图与单个光子一个一个地经过小孔长时间的累计可得完全相同的衍射图的原理是一样的。
二、测量之前需要特别注意的事项1.在切换光源、修改设置或放样品之前必须把狭缝(Δλ)关到最小(0.01nm),否则会损坏光电倍增管!如果打开样品室盖子之后,Em1的Signal Rate增加,请停止实验并立即与工作人员联系!2.测量样品的瞬态性质之前,请用先对样品的稳态性质进行表征,了解样品的激发光谱与发射光谱及最佳激发波长和发射波长;3.用PMT检测时,必须等稳压电源CO1的温度示数在-15ºC以下才能够开始采集数据;4.狭缝范围0.01~18nm,调节时注意不要超过其上限;(L1: 1mm相当于1.8nm, 200-900nm);(L2: 1mm相当于5.4nm, 900-1900nm)5.每次设置完参数后都要点击Apply或者回车键确定;6.文件保存路径为:C:\data\导师\自己文件夹7.用专用u盘拷贝数据并到另一台电脑发送数据8.如实填写仪器使用记录,爱护仪器。
三、稳态荧光光谱的测定1.紫外可见区稳态荧光光谱的测定步骤1)打开Xe900电源,待其稳定,稳定后电压约16-17V,电流25A;2)打开CO1电源和FLS920主机电源;3)打开计算机,双击桌面上F900图标,进入工作站4)点击窗口左上角的按钮,进入Signal Rate设置窗口,先将ExcitationWavelength和Em1 Wavelength处的Δλ均设置为0.01nm,按回车键(Enter)或者点击Apply确认,再将Source设置为Xe900,Em1 Detector设置为R955,然后点击Apply;5)打开样品室的盖子,放入待测样品,然后盖好;6)调节slit到合适大小(一般2.5mm)。
厦门大学[004]
![厦门大学[004]](https://img.taocdn.com/s3/m/1965a07a5901020207409cfa.png)
厦门大学招标文件采购项目厦门大学化学化工学院真空X-光电子能谱采购(二次)采购编号:XDZB2017-A-041厦门大学招投标中心2017年6月7日第一章投标邀请受学校采购领导小组的委托,厦门大学招投标中心现进行以下项目的招标,欢迎具备相应资格条件的供应商参加投标。
一、招标编号:XDZB2017-A-041二、招标项目:厦门大学化学化工学院真空X-光电子能谱采购(二次)三、供货地点:厦门大学化学化工学院四、招标预算:260万元(最高限价)五、投标截止和开标时间:2017年6月29日上午9点六、报名截至:投标人必须在即日起至2017年6月26日下午5点(节假日除外),以传真方式进行报名(需注明公司名称、联系人及电话等并加盖公章),逾期视为放弃竞标机会。
七、开标地点:厦门大学开评标会议室(厦门大学颂恩楼615房间)八、本批采购的咨询联系人技术方面的问题请联系:陈老师招投标报名等方面的问题请联系:张老师电话:、2181873、2186100转607传真:、2181873、2186100转608厦门大学招投标中心 2017年6月7日第二章采购项目说明及要求注:①以上仪器如有参考型号,也只是提供欲采购仪器的大致性能、技术参数等以供参考。
各投标方可根据提供的技术参数要求推荐其他性能优于参考规格和技术参数的、性价比更具优势的仪器参与投标;二、投标要求1.在满足招标技术参数前提下,投标人可提供更高的配置,并在技术偏离表中注明。
2.投标人须保证所投标产品为正规渠道合法产品,享有正规售后服务,所提供的产品在供货前提供相关证明材料。
供应商必须承诺提供原厂安装、集成及调试服务。
若投标产品为进口设备,供应商必须提供销售授权书。
3.供应商必须提供详细产品配置及彩图。
供应商所提供的货物必须是全新的原装正品,每个包装箱内的清单、中文使用说明书、质量证书、保修卡等所有资料应齐全。
4.投标人必须提供投标人营业执照有效复印件以及投标人法定代表对投标代表的授权书原件。
- 1、下载文档前请自行甄别文档内容的完整性,平台不提供额外的编辑、内容补充、找答案等附加服务。
- 2、"仅部分预览"的文档,不可在线预览部分如存在完整性等问题,可反馈申请退款(可完整预览的文档不适用该条件!)。
- 3、如文档侵犯您的权益,请联系客服反馈,我们会尽快为您处理(人工客服工作时间:9:00-18:30)。
厦门大学化学化工学院
FLS980 稳态瞬态荧光光谱仪样品检测申请登记表
注意:
样品若是固体状态,需要研磨成粉末(特别是颗粒样品),样品量为15 mg,固体样品存放于塑料子弹头中。
液体样品需提供比色池(带有瓶塞)及溶解样品的溶剂,浓度为测量紫外可见吸收的浓度。
如果样品有毒性或腐蚀性,请事先声明。
如果样品或其类似物曾在同类型号的荧光仪器做过或有文献报道,请提供有关信息。
测试完成时间:一般为1周内;对于疑难样品,与用户协商后分析;遇仪器发生故障,时间推后(修好仪器后一周内)。
如果没有认真阅读以上条款,并且没有预先处理好样品,引起仪器故障,除停止测试机时一个月之外,需要承担相应责任。
收样人:收样时间:
1 / 1。
