微软图表控件MsChart使用指南
winform chart的用法
winform chart的用法一、概述Winform Chart是用于在Windows Forms应用程序中显示数据图表的一种控件。
它提供了丰富的功能和灵活的配置选项,可以帮助开发者轻松地创建各种类型的图表,如折线图、柱状图、饼图等。
二、安装与引用要使用Winform Chart,首先需要在Visual Studio中安装相应的Winform Chart控件。
可以通过NuGet包管理器来安装。
在项目资源管理器中右键单击项目,选择“管理NuGet程序包”,然后搜索并安装Winform Chart控件。
三、基本用法1. 添加Winform Chart控件到窗体:在窗体的设计视图中,将Winform Chart控件拖放到窗体上。
2. 配置Chart控件属性:根据需要设置Chart控件的标题、轴标签、轴范围等属性。
3. 绑定数据源:将数据绑定到Chart控件的数据源属性上。
通常使用绑定的方式将数据源设置为数据表、数据集或数据访问对象。
4. 绘制图表:使用Chart控件的绘图方法,如Series对象的系列绘制方法,来绘制图表中的数据点、线、柱状图等元素。
四、常用操作1. 添加系列:使用Series对象的Add()方法,向Chart控件中添加新的系列。
2. 配置系列属性:设置系列的颜色、线型、标记等属性。
3. 添加轴:使用Chart控件的Add()方法,向Chart控件中添加新的轴。
4. 设置坐标轴范围:使用Axis对象的Scale()方法,设置X轴和Y轴的范围。
5. 添加图例:使用Legend控件或Series对象的Legend()方法,添加图例。
6. 显示隐藏图表:使用Chart控件的Visible属性,控制图表是否显示。
7. 保存图表图像:使用Chart控件的SaveImage()方法,将图表保存为图像文件。
五、示例代码以下是一个简单的Winform Chart示例代码,用于展示折线图的绘制和配置:```csharp// 添加Chart控件到窗体上Chart chart = new Chart();this.chart1.Location = new System.Drawing.Point(50, 50); = "chart1";this.chart1.Size = new System.Drawing.Size(400, 300);// 绑定数据源DataView dataView = new DataView();dataView.Table = myDataTable; // myDataTable是数据表对象chart.DataSource = dataView;// 添加系列并配置属性Series series = new Series();series.ChartType = SeriesChartType.Line; // 设置系列类型为折线图series.Color = Color.Blue; // 设置系列颜色为蓝色chart.Series.Add(series);// 设置X轴和Y轴范围chart.Axes.Add(axisX); // axisX是X轴对象axisX.ScaleType = AxisScaleType.Linear; // 设置X轴为线性刻度类型axisX.Minimum = 0; // 设置X轴最小值axisX.Maximum = 100; // 设置X轴最大值axisY = chart.Axes[YAxisName]; // Y轴名称默认为"Value"axisY.Minimum = 0; // 设置Y轴最小值axisY.Maximum = 100; // 设置Y轴最大值```以上代码仅为示例,实际应用中需要根据具体需求进行适当的调整和扩展。
c#_ms_chart_控件使用方法汇总(附统计图)
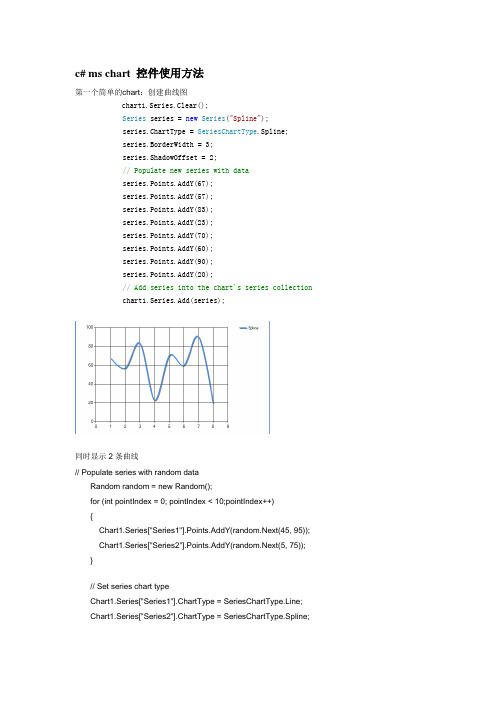
c# ms chart 控件使用方法第一个简单的chart:创建曲线图chart1.Series.Clear();Series series = new Series("Spline");series.ChartType = SeriesChartType.Spline;series.BorderWidth = 3;series.ShadowOffset = 2;// Populate new series with dataseries.Points.AddY(67);series.Points.AddY(57);series.Points.AddY(83);series.Points.AddY(23);series.Points.AddY(70);series.Points.AddY(60);series.Points.AddY(90);series.Points.AddY(20);// Add series into the chart's series collectionchart1.Series.Add(series);同时显示2条曲线// Populate series with random dataRandom random = new Random();for (int pointIndex = 0; pointIndex < 10;pointIndex++){Chart1.Series["Series1"].Points.AddY(random.Next(45, 95)); Chart1.Series["Series2"].Points.AddY(random.Next(5, 75)); }// Set series chart typeChart1.Series["Series1"].ChartType = SeriesChartType.Line; Chart1.Series["Series2"].ChartType = SeriesChartType.Spline;// Set point labelsChart1.Series["Series1"].IsValueShownAsLabel = true;Chart1.Series["Series2"].IsValueShownAsLabel = true;// Enable X axis marginChart1.ChartAreas["ChartArea1"].AxisX.IsMarginVisible = true;// Enable 3D, and show data point marker linesChart1.ChartAreas["ChartArea1"].Area3DStyle.Enable3D = true; Chart1.Series["Series1"]["ShowMarkerLines"] = "True";Chart1.Series["Series2"]["ShowMarkerLines"] = "True";显示column类型图,柱状图// Create new data series and set it's visual attributesChart1.Series.Clear();Series series = new Series("FlowRead");series.ChartType = SeriesChartType.Column;series.BorderWidth = 3;series.ShadowOffset = 2;// Populate new series with dataseries.Points.AddY(67);series.Points.AddY(57);series.Points.AddY(83);series.Points.AddY(23);series.Points.AddY(70);series.Points.AddY(60);series.Points.AddY(90);series.Points.AddY(20);// Add series into the chart's series collectionChart1.Series.Add(series);很多点,效率还可以// Fill series datadouble yValue = 50.0;Random random = new Random();for (int pointIndex = 0; pointIndex < 20000;pointIndex++){yValue = yValue + (random.NextDouble() * 10.0 - 5.0);Chart1.Series["Series1"].Points.AddY(yValue);}// Set fast line chart typeChart1.Series["Series1"].ChartType = SeriesChartType.FastLine;日期,xy类型// Create a new random number generatorRandom rnd = new Random();// Data points X value is using current date DateTime date = DateTime.Now.Date;// Add points to the stock chart seriesfor (int index = 0; index < 10; index++){Chart1.Series["Series1"].Points.AddXY( date, // X value is a daternd.Next(40,50)); //Close Y value// Add 1 day to our X valuedate = date.AddDays(1);int-int的xy数据绘图// Create a new random number generatorRandom rnd = new Random();// Add points to the stock chart seriesfor (int index = 0; index < 10; index++){Chart1.Series["Series1"].Points.AddXY(rnd.Next(10,90), // X value is a date rnd.Next(40,50)); //Close Y value数据库数据,datetime-int类型Chart1.Series.Clear();OleDbConnection conn = new OleDbConnection("Provider=Microsoft.Jet.OLEDB.4.0;Data Source=" +Application.StartupPath + @"\db.mdb" + ";Persist Security Info=False");OleDbCommand cmd = conn.CreateCommand();conn.Open();mandText = "select 时间,序号from pub_log_read order by 序号asc";//DataSet ds = new DataSet();//OleDbDataAdapter da = new OleDbDataAdapter();//da.SelectCommand = cmd;//da.Fill(ds, "tbscore");OleDbDataReader dr = cmd.ExecuteReader(CommandBehavior.CloseConnection);Chart1.DataBindTable(dr, "时间");dr.Close();数据库数据2,string-int类型Chart1.Series.Clear();OleDbConnection conn = new OleDbConnection("Provider=Microsoft.Jet.OLEDB.4.0;Data Source=" +Application.StartupPath + @"\db.mdb" + ";Persist Security Info=False");OleDbCommand cmd = conn.CreateCommand();conn.Open();mandText = "select 账号,count(账号) as 次数from pub_log_read group by 账号order by 账号asc";//DataSet ds = new DataSet();//OleDbDataAdapter da = new OleDbDataAdapter();//da.SelectCommand = cmd;//da.Fill(ds, "tbscore");OleDbDataReader dr = cmd.ExecuteReader(CommandBehavior.CloseConnection);Chart1.DataBindTable(dr, "账号");dr.Close();数据库绑定3-string-int型Chart1.Series.Clear();Chart1.Series.Add("Series1");OleDbConnection conn = new OleDbConnection("Provider=Microsoft.Jet.OLEDB.4.0;Data Source=" +Application.StartupPath + @"\db.mdb" + ";Persist Security Info=False");OleDbCommand cmd = conn.CreateCommand();mandText = "select 账号,count(账号) as 次数from pub_log_read group by 账号order by 账号asc";conn.Open();DataSet ds = new DataSet();OleDbDataAdapter da = new OleDbDataAdapter();da.SelectCommand = cmd;da.Fill(ds, "tbscore");Chart1.DataSource = ds;Chart1.Series["Series1"].XValueMember = "账号";Chart1.Series["Series1"].YValueMembers = "次数";// Data bind to the selected data sourceChart1.DataBind();conn.Close();数据库4,只绑定yChart1.Series.Clear();Chart1.Series.Add("序号");OleDbConnection conn = new OleDbConnection("Provider=Microsoft.Jet.OLEDB.4.0;Data Source=" +Application.StartupPath + @"\db.mdb" + ";Persist Security Info=False");OleDbCommand cmd = conn.CreateCommand();conn.Open();mandText = "select 序号from pub_log_read order by 序号asc";//DataSet ds = new DataSet();//OleDbDataAdapter da = new OleDbDataAdapter();//da.SelectCommand = cmd;//da.Fill(ds, "tbscore");OleDbDataReader dr = cmd.ExecuteReader(CommandBehavior.CloseConnection);Chart1.Series[0].Points.DataBindY(dr);dr.Close();数据库5,绑定xyChart1.Series.Clear();Chart1.Series.Add("序号");OleDbConnection conn = new OleDbConnection("Provider=Microsoft.Jet.OLEDB.4.0;Data Source=" +Application.StartupPath + @"\db.mdb" + ";Persist Security Info=False");OleDbCommand cmd = conn.CreateCommand();conn.Open();mandText = "select 账号,count(账号) as 次数from pub_log_read group by 账号order by 账号desc";//DataSet ds = new DataSet();//OleDbDataAdapter da = new OleDbDataAdapter();//da.SelectCommand = cmd;//da.Fill(ds, "tbscore");OleDbDataReader dr = cmd.ExecuteReader(CommandBehavior.CloseConnection);Chart1.Series[0].Points.DataBindXY(dr,"账号",dr,"次数");dr.Close();数据库6,支持显示参数Chart1.Series.Clear();Chart1.Series.Add("S1");OleDbConnection conn = new OleDbConnection("Provider=Microsoft.Jet.OLEDB.4.0;Data Source=" +Application.StartupPath + @"\db.mdb" + ";Persist Security Info=False");OleDbCommand cmd = conn.CreateCommand();conn.Open();mandText = "SELECT * FROM REPSALES WHERE Year=2004";//DataSet ds = new DataSet();//OleDbDataAdapter da = new OleDbDataAdapter();//da.SelectCommand = cmd;//da.Fill(ds, "tbscore");OleDbDataReader dr = cmd.ExecuteReader(CommandBehavior.CloseConnection);Chart1.Series[0].Points.DataBind(dr, "name", "sales", "Tooltip=Year,Label=Commissions{C2}");dr.Close();数据库7,支持多lineChart1.Series.Clear();Chart1.Series.Add("S1");OleDbConnection conn = new OleDbConnection("Provider=Microsoft.Jet.OLEDB.4.0;Data Source=" +Application.StartupPath + @"\db.mdb" + ";Persist Security Info=False");OleDbCommand cmd = conn.CreateCommand();conn.Open();mandText = "SELECT * FROM REPSALES";//DataSet ds = new DataSet();//OleDbDataAdapter da = new OleDbDataAdapter();//da.SelectCommand = cmd;//da.Fill(ds, "tbscore");OleDbDataReader dr = cmd.ExecuteReader(CommandBehavior.CloseConnection);Chart1.DataBindCrossTable(dr, "Name", "Year", "Sales", "Label=Commissions{C}");dr.Close();数据库8,按照行添加数据// Resolve the address to the Access databasestringfileNameString = this.MapPath(".");fileNameString += "..\\..\\..\\data\\chartdata.mdb";//Initialize a connectionstringstringmyConnectionString = "PROVIDER=Microsoft.Jet.OLEDB.4.0;DataSource=" + fileNameString;// Definethe databasequerystringmySelectQuery="SELECT * FROM SALESCOUNTS;";// Createa database connection object using the connectionstringOleDbConnection myConnection = newOleDbConnection(myConnectionString);// Create adatabase command on the connection usingqueryOleDbCommandmyCommand = new OleDbCommand(mySelectQuery, myConnection);// Open theconnectionmyCommand.Connection.Open();//Initializes a new instance of the OleDbDataAdapter classOleDbDataAdapter myDataAdapter = new OleDbDataAdapter();myDataAdapter.SelectCommand = myCommand;//Initializes a new instance of the DataSet classDataSetmyDataSet = new DataSet();// Addsrows in the DataSetmyDataAdapter.Fill(myDataSet,"Query");foreach(DataRow row in myDataSet.Tables["Query"].Rows){// For each Row add a new seriesstring seriesName = row["SalesRep"].ToString();Chart1.Series.Add(seriesName);Chart1.Series[seriesName].ChartType = SeriesChartType.Line;Chart1.Series[seriesName].BorderWidth = 2;for(int colIndex = 1; colIndex <myDataSet.Tables["Query"].Columns.Count; colIndex++) {// For each column (column 1 and onward) add the value as apointstring columnName =myDataSet.Tables["Query"].Columns[colIndex].ColumnName; int YVal = (int) row[columnName];Chart1.Series[seriesName].Points.AddXY(columnName, YVal);}}DataGrid.DataSource = myDataSet;DataGrid.DataBind();// Closesthe connection to the data source. This is the preferred// method ofclosing any open connection.myCommand.Connection.Close();使用xml数据// resolve the address to the XML documentstringfileNameString = this.MapPath(".");stringfileNameSchema = this.MapPath(".");fileNameString += "..\\..\\..\\data\\data.xml";fileNameSchema += "..\\..\\..\\data\\data.xsd";//Initializes a new instance of the DataSet classDataSetcustDS = new DataSet();// Read XMLschema into the DataSet.custDS.ReadXmlSchema( fileNameSchema );// ReadXML schema and data into the DataSet.custDS.ReadXml( fileNameString );//Initializes a new instance of the DataView classDataViewfirstView = new DataView(custDS.Tables[0]);// Sincethe DataView implements and IEnumerable, pass the reader directlyinto// theDataBindTable method with the name of the column used for the Xvalue.Chart1.DataBindTable(firstView, "Name");使用excel数据// resolve the address to the Excel filestringfileNameString = this.MapPath(".");fileNameString += "..\\..\\..\\data\\ExcelData.xls";// Createconnection object by using the preceding connection string.string sConn= "Provider=Microsoft.Jet.OLEDB.4.0;Data Source=" +fileNameString + ";Extended Properties="Excel8.0;HDR=YES"";OleDbConnection myConnection = new OleDbConnection( sConn );myConnection.Open();// Thecode to follow uses a SQL SELECT command to display the data fromthe worksheet.// Createnew OleDbCommand to return data from worksheet.OleDbCommandmyCommand = new OleDbCommand( "Select * From[data1$A1:E25]",myConnection );// createa databasereaderOleDbDataReader myReader=myCommand.ExecuteReader(CommandBehavior.CloseConnection);//Populate the chart with data in the fileChart1.DataBindTable(myReader, "HOUR");// closethe reader and the connectionmyReader.Close();myConnection.Close();使用csv数据// Filename of the CSV filestring file= "DataFile.csv";// Getthe path of the CSV filestring path= this.MapPath(".");path +="..\\..\\..\\data\";// Createa select statement and a connection string.stringmySelectQuery = "Select * from " + file;stringConStr = "Provider=Microsoft.Jet.OLEDB.4.0;Data Source="+path+ ";Extended Properties="Text;HDR=No;FMT=Delimited"";OleDbConnection myConnection = new OleDbConnection(ConStr);// Createa database command on the connection using queryOleDbCommandmyCommand = new OleDbCommand(mySelectQuery, myConnection);// Openthe connection and create the readermyCommand.Connection.Open();OleDbDataReader myReader=myCommand.ExecuteReader(CommandBehavior.CloseConnection);// Column1 is a time value, column 2 is a double// Databindthe reader to the chart using the DataBindXY methodChart1.Series[0].Points.DataBindXY(myReader, "1", myReader,"2");// Closeconnection and data readermyReader.Close();myConnection.Close();数组绘图// Initialize an array of doublesdouble[] yval = { 2, 6, 4, 5, 3 };// Initialize an array of stringsstring[] xval = { "Peter", "Andrew", "Julie", "Mary", "Dave" };// Bind the double array to the Y axis points of the Default dataseriesChart1.Series["Series1"].Points.DataBindXY(xval, yval);数据库9,dataview// Resolve the address to the Access databasestringfileNameString = this.MapPath(".");fileNameString += "..\\..\\..\\data\\chartdata.mdb";//Initialize a connectionstringstringmyConnectionString = "PROVIDER=Microsoft.Jet.OLEDB.4.0;DataSource=" + fileNameString;// Definethe databasequerystringmySelectQuery="SELECT * FROM REPS;";// Createa database connection object using the connectionstringOleDbConnection myConnection = newOleDbConnection(myConnectionString);// Create adatabase command on the connection usingqueryOleDbCommandmyCommand = new OleDbCommand(mySelectQuery, myConnection);// Open theconnectionmyCommand.Connection.Open();//Initializes a new instance of the OleDbDataAdapter classOleDbDataAdapter custDA = new OleDbDataAdapter();custDA.SelectCommand = myCommand;//Initializes a new instance of the DataSet classDataSetcustDS = new DataSet();// Addsrows in the DataSetcustDA.Fill(custDS, "Customers");//Initializes a new instance of the DataView classDataViewfirstView = new DataView(custDS.Tables[0]);// Sincethe DataView implements IEnumerable, pass the dataview directlyinto// the DataBind method with thename of the Columns selected in thequeryChart1.Series["Default"].Points.DataBindXY(firstView,"Name",firstView, "Sales");// Closesthe connection to the data source. This is the preferred// method of closing any openconnection.myCommand.Connection.Close();指定坐标轴的数据显示范围// Create a new random number generatorRandom rnd = new Random();// Add points to the stock chart seriesfor (int index = 0; index < 10; index++){Chart1.Series["Series1"].Points.AddXY(rnd.Next(10,90), // X value is a daternd.Next(40,50)); //Close Y value}Chart1.ChartAreas[0].AxisY.Minimum = 40;Chart1.ChartAreas[0].AxisY.Maximum = 50;数据排序// Use point index for drawing the chartChart1.Series["Series1"].IsXValueIndexed = true;// Sortseries points by second Y valueChart1.DataManipulator.Sort(PointSortOrder.Ascending, "Y2","Series1");查找数据最大值和最小值// Find point with maximum Y value and change colorDataPointmaxValuePoint =Chart1.Series["Series1"].Points.FindMaxValue(); maxValuePoint.Color = Color.FromArgb(255, 128, 128);// Findpoint with minimum Y value and change colorDataPointminValuePoint =Chart1.Series["Series1"].Points.FindMinValue(); minValuePoint.Color = Color.FromArgb(128, 128, 255);pie显示交互private void Page_Load(object sender, System.EventArgs e){// Addseries to the chartSeriesseries = Chart1.Series.Add("My series");// Setseries and legend tooltipsseries.ToolTip = "#VALX: #VAL{C} million";series.LegendToolTip = "#PERCENT";series.PostBackValue = "#INDEX";series.LegendPostBackValue = "#INDEX";// Populateseries datadouble[] yValues = {65.62, 75.54, 60.45, 34.73, 85.42, 32.12, 55.18, 67.15,56.24, 23.65};string[] xValues = {"France", "Canada", "Germany", "USA", "Italy", "Russia","China", "Japan", "Sweden", "Spain" };series.Points.DataBindXY(xValues, yValues);// Setseries visual attributesseries.Type= SeriesChartType.Pie;series.ShadowOffset = 2;series.BorderColor = Color.DarkGray;series.CustomAttributes = "LabelStyle=Outside";}protected void Chart1_Click(object sender, ImageMapEventArgse){intpointIndex = int.Parse(e.PostBackValue);Seriesseries = Chart1.Series["My series"];if(pointIndex >= 0 &&pointIndex < series.Points.Count){series.Points[pointIndex].CustomProperties +="Exploded=true";}}chart点击事件/// <summary>/// Page Load event handler./// </summary>protected void Page_Load(object sender, System.EventArgs e){this.Chart1.Click += new ImageMapEventHandler(Chart1_Click);// directusing of PostBackValueforeach(Series series in this.Chart1.Series){series.PostBackValue = "series:" + + ",#INDEX";}// transferof click coordinates. getCoordinates is a javascriptfunction.stringpostbackScript =ClientScript.GetPostBackEventReference(this.Chart1,"chart:@");this.Chart1.Attributes["onclick"] = postbackScript.Replace("@'", "'+ getCoordinates(event)"); }/// <summary>/// Handles the Click event of the Chart1 control./// </summary>/// <param name="sender">The sourceof the event.</param>/// <paramname="e">The<seecref="System.Web.UI.WebControls.ImageMapEventArgs"/>instance containing the eventdata.</param>protected void Chart1_Click(object sender, ImageMapEventArgse){this.Chart1.Titles["ClickedElement"].Text = "Nothing";string[]input = e.PostBackValue.Split(':');if(input.Length == 2){string[] seriesData = input[1].Split(',');if (input[0].Equals("series")){this.Chart1.Titles["ClickedElement"].Text = "Last Clicked Element:" + seriesData[0] + " - Data Point #" + seriesData[1];}else if (input[0].Equals("chart")){// hit test of X and Y click pointHitTestResult hitTestResult=this.Chart1.HitTest(Int32.Parse(seriesData[0]),Int32.Parse(seriesData[1]));if (hitTestResult != null){this.Chart1.Titles["ClickedElement"].Text = "Last Clicked Element:" + hitTestResult.ChartElementType.ToString();}}}}。
MSChart控件教程
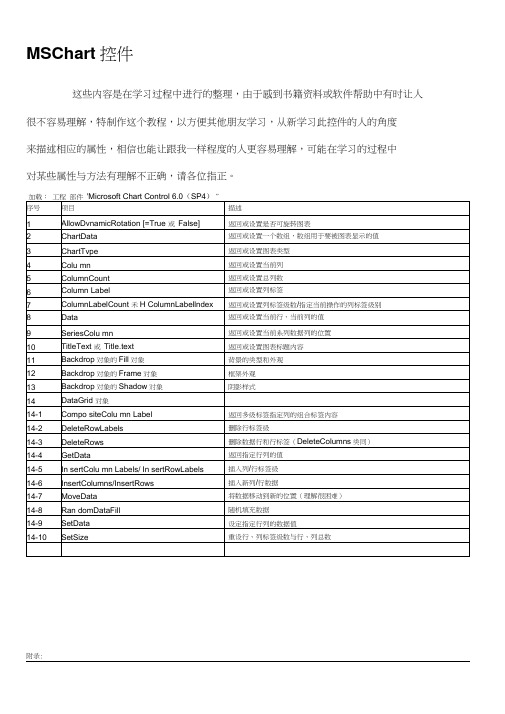
MSChart控件这些内容是在学习过程中进行的整理,由于感到书籍资料或软件帮助中有时让人很不容易理解,特制作这个教程,以方便其他朋友学习,从新学习此控件的人的角度来描述相应的属性,相信也能让跟我一样程度的人更容易理解,可能在学习的过程中对某些属性与方法有理解不正确,请各位指正。
附录:1、AllowDynamicRotation返回目录作用:返回或设置是否可旋转图表注:需要图表的ChartType是3d类型才可以,当AllowDynamicRotation=True时,在图表中可按住ctrl+鼠标左键旋转图表。
示例:F列代码在窗体加载时将MSChartl设置为3d柱形图,并允许按住ctrl+鼠标左键旋转。
(窗体上放一个MSChart控件)Private Sub Form_Load()With MSChart1.chartType = VtChChartType3dBar '类型为3d柱形图,类形常数详见附录.AllowD yn amicRotati on =True '允许旋转End WithEnd Sub口ForniilA■AllowDynamicRotation 值: 下列代码将以对话框的形式返回上面示例的MsgBox MSChart1.AllowDy namicRotati onTrue2、ChartData返回目录注:书中及软件帮助文档中说到数组需要变体型数值,是指如果要将数组第一个元素作为标题,其他作为数据,那个这个数组既有字符又有数字,那么就需要一个变体形。
如果数组中并不包含标题(或是之后使用属性来赋于标题),那么数组是可以定义类形的,个人建议先给定数组类型,之后再使用属性来设置标题。
作用:设置:将一个数组的数据作表图表的显示数据返回:将图表数据赋给一个数组示例:将数组元素作为图表的显示数据制作一个1行6列的的图表(数组的维代表图表的行,每维的元素代表列)Private Sub Form_Load()Dim 一维数组(1 To 6) '为了表示得更清楚,我们采取逐个赋值的方法一维数组(1)= 1一维数组(2) = 2一维数组(3) = 3一维数组(4) = 4一维数组(5) = 5一维数组(6) = 6With MSChartl.chartType = VtChChartType2dBar '类型为3d 柱形图.ChartData = 一维数组()End WithEnd SubEnd SubComm aitdl为了理解图表的行列与数组的维数的对应关系,再举例一个二维数组(图表对应就形成Private Sub Form_Load()Dim 二维数组(1 To 2, 1 To 6) '为了表示得更清楚,我们采取逐个赋值的方法 二维数组 二维数组 二维数组 二维数组 二维数组 二维数组With MSChart1.chartType = VtChChartType2dBar '类型为 2d 柱形图 .ChartData =二维数组()End With导 Forml—r 65 4 3 2 ft54=1= 3-I- 22行6列) (1, 1) = 1(1,2) = 2(1, 3) = 3(1,4) = 4(1, 5) = 5(1,6) = 6二维数组 二维数组 二维数组 二维数组 二维数组 二维数组 (2, 1) = 1(2, 2) = 2(2, 3) = 3(2, 4) = 4(2, 5) = 5(2, 6) = 6导Formlill--5--4…3--2R1R2CommaitdlF面是将数组的第一个元素设置成字符,使图表加载时将其作为标题的示例: Private Sub Form_Load()Dim 二维数组(1 To 2, 1 To 6)'为了表示得更清楚,我们采取逐个赋值的方法二维数组二维数组二维数组二维数组二维数组二维数组(1, 1)="第一行标题”(1,2) = 2(1, 3) = 3(1,4) = 4(1, 5) = 5(1,6) = 6二维数组二维数组二维数组二维数组二维数组二维数组(2, 1)(2, 2)(2, 3)(2, 4)(2, 5)(2, 6)"第二行标题”54With MSChart1.chartType = VtChChartType2dBar '类型为2d 柱形图.ChartData =二维数组()End WithEnd Sub口Forinl—r t.M一维翹1行1列12列 2 -3列34列45列56列 6 =上述例子是将数组的内容反应到图表中,下面我们将使用上面的一维和二维图表,从图表中获得数据给数组,并将 数组显示出来以验证结果(我们采取设置一个断点,然后通过视图 本地的方式来查看生成的数组):Cl Fermi库工程2 -Fpn^l (Co«3r) TJfe |Caw4udl II Ci-m vndl tripag 5*ih f :OTundl diet 0 U L * 别jft 加 0 ■ II TriT^abe Sih farrjj^sdl < 』L* 二璀T)细a [« 2, J It 6) (2 1;7邯亡¥更舌跟『血眸总匹刚iDtf 出盘 净駅■ 诩工 __®x 二■¥池AC 」 ]■] £■] 31■0 b] 1. 1?3 4-s 6 & c - 4- ..M L " .4 灯和匸三 贼liZJiulTjrfJB* 如尤M 卅主总国I 工程L P M .I I ^iiif.ardl jni ck裹乜式~ 【诅 曰祈魏用 -轉地(0呈僮 -邓fttUbcr -瞪细yea ” -■SMnrcs" L 證趙心怔「 S'Mft) -谿用O 沖「 -(I ] -Jii 欄 ws -HSlifllLS -斬畑Id -5m tL^ L 融^8(沁 幻弓f 檢1笙〕 -iiOfes -¥的论q -iisoes -険fiI2E L I 现1 —三 y^pii/y^rrhi —' ^iTi snt [Dio?. XoTi ant 血 to 6J 『也■'“ Vtzi vbt/ftTin ( Vu-1 ub/Etran^ Kari HiiLr'Elxirii Y HJ i 袒".丿悅站5『喘 ¥«■* Mlt/WtT 山匸 Mri 皿t/Str i 口耳 Ku-i uiL O J to b. VuTh 4iir/Slr jci^ ¥«■* 曲咲 苜xi 皿cyDabl. KiTi EttryLittle Vayi^nr/D-.l.l- ViTi tnLf^Dnrjbl* Fari 『廿■ »匕(D I.U ft. Vtri uit/ftTicif tnLf^DnrjBl^ Xtri uiLr'DgbL. ^4ThULL/Dr-j1iLrVu-i 也韶 BmM* ■如■! anLf^D^jlil* Xtri Hfi. JDebL* — 从图中可以看到,对于我们用 2给数组生成的图表,再赋给新的数组时,数组变成了素用来存储行标签,既“ RT'、“ R2”,多出来的一维用来存储列标签,既“ 3维,并且每维还多了一个元 C1”、“C2” 等。
MSChart控件教程

MSChart控件这些内容是在学习过程中进行的整理,由于感到书籍资料或软件帮助中有时让人很不容易理解,特制作这个教程,以方便其他朋友学习,从新学习此控件的人的角度来描述相应的属性,相信也能让跟我一样程度的人更容易理解,可能在学习的过程中对某些属性与方法有理解不正确,请各位指正。
附录:1、AllowDynamicRotation作用:返回或设置是否可旋转图表注:需要图表的ChartType是3d类型才可以,当AllowDynamicRotation=True时,在图表中可按住ctrl+鼠标左键旋转图表。
示例:下列代码在窗体加载时将MSChart1设置为3d柱形图,并允许按住ctrl+鼠标左键旋转。
(窗体上放一个MSChart控件)Private Sub Form_Load()With MSChart1.chartType = VtChChartType3dBar '类型为3d柱形图,类形常数详见附录.AllowDynamicRotation = True '允许旋转End WithEnd Sub下列代码将以对话框的形式返回上面示例的AllowDynamicRotation值:MsgBox MSChart1.AllowDynamicRotation2、ChartData注:书中及软件帮助文档中说到数组需要变体型数值,是指如果要将数组第一个元素作为标题,其他作为数据,那个这个数组既有字符又有数字,那么就需要一个变体形。
如果数组中并不包含标题(或是之后使用属性来赋于标题),那么数组是可以定义类形的,个人建议先给定数组类型,之后再使用属性来设置标题。
作用:设置:将一个数组的数据作表图表的显示数据返回:将图表数据赋给一个数组示例:将数组元素作为图表的显示数据制作一个1行6列的的图表(数组的维代表图表的行,每维的元素代表列)Private Sub Form_Load()Dim 一维数组(1 To 6)'为了表示得更清楚,我们采取逐个赋值的方法一维数组(1) = 1一维数组(2) = 2一维数组(3) = 3一维数组(4) = 4一维数组(5) = 5一维数组(6) = 6With MSChart1.chartType = VtChChartType2dBar '类型为3d柱形图.ChartData = 一维数组()End WithEnd Sub为了理解图表的行列与数组的维数的对应关系,再举例一个二维数组(图表对应就形成2行6列)Private Sub Form_Load()Dim 二维数组(1 To 2, 1 To 6)'为了表示得更清楚,我们采取逐个赋值的方法二维数组(1, 1) = 1二维数组(1, 2) = 2二维数组(1, 3) = 3二维数组(1, 4) = 4二维数组(1, 5) = 5二维数组(1, 6) = 6二维数组(2, 1) = 1二维数组(2, 2) = 2二维数组(2, 3) = 3二维数组(2, 4) = 4二维数组(2, 5) = 5二维数组(2, 6) = 6With MSChart1.chartType = VtChChartType2dBar '类型为2d柱形图.ChartData = 二维数组()End WithEnd Sub下面是将数组的第一个元素设置成字符,使图表加载时将其作为标题的示例:Private Sub Form_Load()Dim 二维数组(1 To 2, 1 To 6)'为了表示得更清楚,我们采取逐个赋值的方法二维数组(1, 1) = "第一行标题"二维数组(1, 2) = 2二维数组(1, 3) = 3二维数组(1, 4) = 4二维数组(1, 5) = 5二维数组(1, 6) = 6二维数组(2, 1) = "第二行标题"二维数组(2, 2) = 5二维数组(2, 3) = 4二维数组(2, 4) = 3二维数组(2, 5) = 2二维数组(2, 6) = 1With MSChart1.chartType = VtChChartType2dBar '类型为2d柱形图.ChartData = 二维数组()End WithEnd Sub最后总结数组元素与维和图表行列的对应关系,作以下关系图:上述例子是将数组的内容反应到图表中,下面我们将使用上面的一维和二维图表,从图表中获得数据给数组,并将数组显示出来以验证结果(我们采取设置一个断点,然后通过视图\本地的方式来查看生成的数组):从图中可以看到,对于我们用2给数组生成的图表,再赋给新的数组时,数组变成了3维,并且每维还多了一个元素用来存储行标签,既“R1”、“R2”,多出来的一维用来存储列标签,既“C1”、“C2”等。
mschart安装使用

mschart安装使用最近需要为程序显示一些柱状图、线图之类的,查了一下微软的mschart不错,功能强大。
可是自vc6.0之后mschart控件就从ms的IDE里去掉了,如果用只能自己下载安装。
安装mschart需要1 .net framewrok 3.5 sp1(注意是sp1),没有安装的话就去下载吧,完整包大概200多M2 安装MSChart.exe MSChart_VisualStudioAddOn.exe 下载mschrt20.ocx 到C:\WINDOWS\system32目录下。
命令行运行regsvr32 mschrt20.ocx注册控件3 在vs2005之后的平台上,你要么在class view下add class->MFC Class f rom ActiveX Control然后有两个,你可以选择registy然后选择ms mschart 6.0(o led),这样只能出现一个类CMSCHART,或者选择File然后浏览mschrt20.ocx,这里面生成了很多类,你全部添加进去,最后就可以用了。
第二、你可以在一个MFC dialog上insert axtivex control或者toolbox选择choose item->com选择组件让它出现在工具箱中,这样也可以有控件。
我们自己选择生成的很多类,跟网上有示例的类函数名称上有所不同,可能会给使用带来麻烦。
其实最简单的就是找到一个Demo把里面相关的CMSCHART和其它相关的十几个类都拷贝到我的工程文件夹里,再添加进来,就ok了。
网上很多例子可供参考,比如:/document/viewdoc/?id=9 59关于遇到的一些问题。
在设置图形类型的时候,m_chart.SetChartType(1|2);显示出2D曲线图,而我们用m_chart.SetChartType(16);的时候如果你只设置了m_chart. SetColumnCount(1); 就不会显示,因为16的散列图需要的是一对坐标点,你至少需要设置m_chart.SetColumnCount(2);为2。
MSChart控件的用法

介绍MSChart的常用属性和事件介绍MSChart的常用属性和事件MSChart的元素组成最常用的属性包括ChartAreas:增加多个绘图区域,每个绘图区域包含独立的图表组、数据源,用于多个图表类型在一个绘图区不兼容时。
AlignmentOrientation:图表区对齐方向,定义两个绘图区域间的对齐方式。
AlignmentStyle:图表区对齐类型,定义图表间用以对其的元素。
AlignWithChartArea:参照对齐的绘图区名称。
InnerPlotPosition:图表在绘图区内的位置属性。
Auto:是否自动对齐。
Height:图表在绘图区内的高度(百分比,取值在0-100)Width:图表在绘图区内的宽度(百分比,取值在0-100)X,Y:图表在绘图区内左上角坐标Position:绘图区位置属性,同InnerPlotPosition。
Name:绘图区名称。
Axis:坐标轴集合Title:坐标轴标题TitleAlignment:坐标轴标题对齐方式Interval:轴刻度间隔大小IntervalOffset:轴刻度偏移量大小MinorGrid:次要辅助线MinorTickMark:次要刻度线MajorGrid:主要辅助线MajorTickMark:主要刻度线DataSourceID:MSChart的数据源。
Legends:图例说明。
Palette:图表外观定义。
Series:最重要的属性,图表集合,就是最终看到的饼图、柱状图、线图、点图等构成的集合;可以将多种相互兼容的类型放在一个绘图区域内,形成复合图。
IsValueShownAsLabel:是否显示数据点标签,如果为true,在图表中显示每一个数据值Label:数据点标签文本LabelFormat:数据点标签文本格式LabelAngle:标签字体角度Name:图表名称Points:数据点集合XValueType:横坐标轴类型YValueType:纵坐标轴类型XValueMember:横坐标绑定的数据源(如果数据源为T able,则填写横坐标要显示的字段名称)YValueMembers:纵坐标绑定的数据源(如果数据源为Table,则填写纵坐标要显示的字段名称,纵坐标可以有两个)ChartArea:图表所属的绘图区域名称ChartType:图表类型(柱形、饼形、线形、点形等)Legend:图表使用的图例名称Titles:标题集合。
用MicrosoftChartControls(MSChart)实现曲线图,并支持拖动放大到秒

用MicrosoftChartControls(MSChart)实现曲线图,并支持拖动放大到秒本文用MSChart实现Winform曲线图的绘制,本文结合自己的实际项目,每个点需要显示到秒(这也是本文需要解决的关键点),刚开始照着网上的例子实现了一下,样子是出来了,但是当数据一多并且显示到秒时用鼠标进行拖动放大页面会直接卡死,后来经过自己的一番探索和研究,终于把这个问题给解决了,故把整个实现过程记录下来,和大家分享一下。
在文章的后面附上了源码,源码有详细的代码注释,一些需要注意的属性设置都有说明,可以实现刻度到秒的拖动放大,两条红色分别我定义是Min和Max值基准,是为了表达一个区间的概念。
页面上绘制了一千个点,每个点上有相应的T oolTip提示。
代码没有做拆分,只是把整个创建及设置的流程给描述下来,是为了让需要的朋友更好的理解和使用,第一次写博文,希望大家给予指正与支持,谢谢。
附上效果图:using System;using System.Collections.Generic;using ponentModel;using System.Data;using System.Drawing;using System.Linq;using System.Text;using System.Windows.Forms;usingSystem.Windows.Forms.DataVisualization.Charting; using Hyet.Dal;using Hxj.Model;using Hxj.Data;using System.Collections;using Hyet.BLL;namespace DigitalFactory.ReportForms{public partial class ChartInfo : Form{public ChartInfo(){InitializeComponent();InitializeChart();this.myChart.GetToolTipText = newEventHandler<ToolTipEventArgs>(myChart_GetToolTi pText);}private void InitializeChart(){myChart.ChartAreas.Clear();myChart.Series.Clear();#region 设置图表的属性//图表的背景色myChart.BackColor = Color.FromArgb(211, 223, 240); //图表背景色的渐变方式myChart.BackGradientStyle =GradientStyle.TopBottom;//图表的边框颜色、myChart.BorderlineColor = Color.FromArgb(26, 59, 105);//图表的边框线条样式myChart.BorderlineDashStyle = ChartDashStyle.Solid; //图表边框线条的宽度myChart.BorderlineWidth = 2;//图表边框的皮肤myChart.BorderSkin.SkinStyle = BorderSkinStyle.Emboss;#endregion#region 设置图表的标题Title title = new Title();//标题内容title.Text = '曲线图';//标题的字体title.Font = new System.Drawing.Font('Microsoft Sans Serif', 12, FontStyle.Bold);//标题字体颜色title.ForeColor = Color.FromArgb(26, 59, 105);//标题阴影颜色title.ShadowColor = Color.FromArgb(32, 0, 0, 0);//标题阴影偏移量title.ShadowOffset = 3;myChart.Titles.Add(title);#endregion#region 设置图例的属性//注意,需要把原来控件自带的图例删除掉this.myChart.Legends.Clear();Legend legend = new Legend('Default');legend.Alignment = StringAlignment.Center; legend.Docking = Docking.Bottom;legend.LegendStyle = LegendStyle.Column;this.myChart.Legends.Add(legend);// Add header separator of type linelegend.HeaderSeparator = LegendSeparatorStyle.Line; legend.HeaderSeparatorColor = Color.Gray;LegendCellColumn firstColumn = new LegendCellColumn();firstColumn.ColumnType = LegendCellColumnType.SeriesSymbol; firstColumn.HeaderText = 'Color';firstColumn.HeaderBackColor = Color.WhiteSmoke;myChart.Legends['Default'].CellColumns.Add(firstColu mn);// Add Legend Text columnLegendCellColumn secondColumn = new LegendCellColumn();secondColumn.ColumnType = LegendCellColumnType.Text;secondColumn.HeaderText = 'Name'; secondColumn.Text = '#LEGENDTEXT'; secondColumn.HeaderBackColor = Color.WhiteSmoke; myChart.Legends['Default'].CellColumns.Add(secondC olumn);// Add AVG cell columnLegendCellColumn avgColumn = new LegendCellColumn();avgColumn.Text = '#AVG{N2}';avgColumn.HeaderText = 'Avg'; = 'AvgColumn';avgColumn.HeaderBackColor = Color.WhiteSmoke; myChart.Legends['Default'].CellColumns.Add(avgColu mn);// Add Total cell columnLegendCellColumn totalColumn = new LegendCellColumn();totalColumn.Text = '#TOTAL{N1}';totalColumn.HeaderText = 'Total'; = 'TotalColumn'; totalColumn.HeaderBackColor = Color.WhiteSmoke; myChart.Legends['Default'].CellColumns.Add(totalCol umn);// Set Min cell column attributes LegendCellColumn minColumn = new LegendCellColumn();minColumn.Text = '#MIN{N1}';minColumn.HeaderText = 'Min'; = 'MinColumn';minColumn.HeaderBackColor = Color.WhiteSmoke; myChart.Legends['Default'].CellColumns.Add(minColu mn);// Set Max cell column attributes LegendCellColumn maxColumn = new LegendCellColumn();maxColumn.Text = '#MAX{N1}';maxColumn.HeaderText = 'Max'; = 'MaxColumn';maxColumn.HeaderBackColor = Color.WhiteSmoke; myChart.Legends['Default'].CellColumns.Add(maxColu mn);#endregion#region 设置图表区属性ChartArea chartArea = new ChartArea('Default');//设置Y轴刻度间隔大小chartArea.AxisY.Interval = 5;//设置Y轴的数据类型格式//belStyle.Format = 'C';//设置背景色chartArea.BackColor = Color.FromArgb(64, 165, 191, 228);//设置背景渐变方式chartArea.BackGradientStyle =GradientStyle.TopBottom;//设置渐变和阴影的辅助背景色chartArea.BackSecondaryColor = Color.White;//设置边框颜色chartArea.BorderColor = Color.FromArgb(64, 64, 64, 64);//设置阴影颜色chartArea.ShadowColor = Color.Transparent;//设置X轴和Y轴线条的颜色chartArea.AxisX.LineColor = Color.FromArgb(64, 64, 64, 64);chartArea.AxisY.LineColor = Color.FromArgb(64, 64, 64, 64);//设置X轴和Y轴线条的宽度chartArea.AxisX.LineWidth = 1;chartArea.AxisY.LineWidth = 1;//设置X轴和Y轴的标题chartArea.AxisX.Title = '时间';chartArea.AxisY.Title = '数值';//设置图表区网格横纵线条的颜色chartArea.AxisX.MajorGrid.LineColor =Color.FromArgb(64, 64, 64, 64);chartArea.AxisY.MajorGrid.LineColor =Color.FromArgb(64, 64, 64, 64);//设置图表区网格横纵线条的宽度chartArea.AxisX.MajorGrid.LineWidth = 1; chartArea.AxisY.MajorGrid.LineWidth = 1;//设置坐标轴刻度线不延长出来chartArea.AxisX.MajorTickMark.Enabled = false; chartArea.AxisY.MajorTickMark.Enabled = false;//开启下面两句能够隐藏网格线条//chartArea.AxisX.MajorGrid.Enabled = false;//chartArea.AxisY.MajorGrid.Enabled = false;//设置X轴的显示类型及显示方式chartArea.AxisX.Interval = 0; //设置为0表示由控件自动分配chartArea.AxisX.IntervalAutoMode = IntervalAutoMode.VariableCount;chartArea.AxisX.IntervalType = DateTimeIntervalType.Minutes;belStyle.IsStaggered = true;//chartArea.AxisX.MajorGrid.IntervalType = DateTimeIntervalType.Minutes;//belStyle.IntervalType = DateTimeIntervalType.Minutes;belStyle.Format = 'yyyy-MM-dd HH:mm:ss';//设置文本角度//belStyle.Angle = 45;//设置文本自适应chartArea.AxisX.IsLabelAutoFit = true;//设置X轴允许拖动放大chartArea.CursorX.IsUserEnabled = true; chartArea.CursorX.IsUserSelectionEnabled = true; chartArea.CursorX.Interval = 0;chartArea.CursorX.IntervalOffset = 0;chartArea.CursorX.IntervalType = DateTimeIntervalType.Minutes;chartArea.AxisX.ScaleView.Zoomable = true; chartArea.AxisX.ScrollBar.IsPositionedInside = false;//设置中短线(还没看到效果)//chartArea.AxisY.ScaleBreakStyle.Enabled = true;//chartArea.AxisY.ScaleBreakStyle.CollapsibleSpaceThr eshold = 47;//chartArea.AxisY.ScaleBreakStyle.BreakLineStyle = BreakLineStyle.Wave;//chartArea.AxisY.ScaleBreakStyle.Spacing = 2;//chartArea.AxisY.ScaleBreakStyle.LineColor = Color.Red;//chartArea.AxisY.ScaleBreakStyle.LineWidth = 10;myChart.ChartAreas.Add(chartArea);#endregion//线条2:主要曲线Series series = new Series('Default');//设置线条类型series.ChartType = SeriesChartType.Line;//线条宽度series.BorderWidth = 1;//阴影宽度series.ShadowOffset = 0;//是否显示在图例集合Legendsseries.IsVisibleInLegend = true;//线条上数据点上是否有数据显示series.IsValueShownAsLabel = true;//线条颜色series.Color = Color.MediumPurple;//设置曲线X轴的显示类型series.XValueType = ChartValueType.DateTime;//设置数据点的类型series.MarkerStyle = MarkerStyle.Circle;//线条数据点的大小series.MarkerSize = 5;myChart.Series.Add(series);//手动构造横坐标数据DataTable dataTable = new DataTable(); dataTable.Columns.Add('TheTime',typeof(DateTime)); //注意typeofdataTable.Columns.Add('TheValue', typeof(double)); //注意typeofRandom random = new Random(); //随机数DateTime dateTime = System.DateTime.Now;for (int n = 0; n < 3; n ){dateTime = dateTime.AddSeconds(10);DataRow dr = dataTable.NewRow();dr['TheTime'] = dateTime;dr['TheValue'] = random.Next(0, 101);dataTable.Rows.Add(dr);}for (int n = 3; n < 1000; n ){dateTime = dateTime.AddSeconds(30); DataRow dr = dataTable.NewRow();dr['TheTime'] = dateTime;dr['TheValue'] = random.Next(0, 101); dataTable.Rows.Add(dr);}//线条1:下限横线Series seriesMin = new Series('Min'); seriesMin.ChartType = SeriesChartType.Line; seriesMin.BorderWidth = 1;seriesMin.ShadowOffset = 0;seriesMin.IsVisibleInLegend = true;seriesMin.IsValueShownAsLabel = false; seriesMin.Color = Color.Red;seriesMin.XValueType = ChartValueType.DateTime; seriesMin.MarkerStyle = MarkerStyle.None; myChart.Series.Add(seriesMin);//线条3:上限横线Series seriesMax = new Series('Max');seriesMax.ChartType = SeriesChartType.Line; seriesMax.BorderWidth = 1;seriesMax.ShadowOffset = 0;seriesMax.IsVisibleInLegend = true;seriesMax.IsValueShownAsLabel = false; seriesMax.Color = Color.Red;seriesMax.XValueType = ChartValueType.DateTime; seriesMax.MarkerStyle = MarkerStyle.None; myChart.Series.Add(seriesMax);//设置X轴的最小值为第一个点的X坐标值chartArea.AxisX.Minimum =Convert.ToDateTime(dataTable.Rows[0]['TheTime']).To OADate();//开始画线foreach (DataRow dr in dataTable.Rows){series.Points.AddXY(dr['TheTime'], dr['TheValue']);seriesMin.Points.AddXY(dr['TheTime'], 15); //设置下线为15seriesMax.Points.AddXY(dr['TheTime'], 30); //设置上限为30}}private void myChart_GetToolTipText(object sender, ToolTipEventArgs e){if (e.HitTestResult.ChartElementType == ChartElementType.DataPoint){int i = e.HitTestResult.PointIndex;DataPoint dp = e.HitTestResult.Series.Points[i];e.Text = string.Format('时间:{0},数值:{1:F1} ', DateTime.FromOADate(dp.XValue), dp.YValues[0]); }}}}。
图表绘制控件mschart的使用方法1

图表绘制控件mschart的使⽤⽅法1VisualBasic中ActiveX控件MSChart的使⽤⽅法*依⽪提哈尔·穆罕买提,那斯尔江·⼟尔逊(新疆⼤学数学与系统科学学院,乌鲁⽊齐,830046)热依曼·吐尔逊(新疆⼤学信息⼯程学院,乌鲁⽊齐,830046)摘要:本⽂⾸先介绍了VisualBasic(简称VB)中MSChart控件的使⽤⽅法,然后通过简单的例⼦详细介绍了利⽤MSChart控件绘制Excel数据源图表的⽅法。
关键词:VisualBasic;MSChart控件;MicrosoftExcel数据表;图表;数据库The Methods of Using MSChart Control Based on VBIptihar.Muhammat,Nasirjan.Tursun(Mathematics and Systematic Science Institude of XinjiangUniversity,Urumqi,Xinjiang,830046)Reyima.Tursun(Information Science and Engineering Institude of Xinjiang University,Urumqi,Xinjiang,830046)Abstract:This article discusses how to use the MSChart control and how that is used in the VB project to drawing Microsoft? Excel charts.KeyWords: MSChart Control;Chartdata ;Mirosoft Excel Sheets;Chart;Database1. 引⾔Visual Basic中的MSChart控件是⼀个功能强⼤的⾼级图表⼯具,拥有丰富的图表绘制功能,⽤它来可以显⽰⼆维和三维的棒图、区域图、线形图、饼图等多种常⽤图表。
MSCHART用法

1、MSChart控件的属性(1)ChartType属性:用于设置或返回图表类型,MSChart控件图表类型与对应ChartType属性值如表8.7所示。
如,ChartType=1则显示二维直方图,ChartType=14则显示饼图。
表8.7 MSChart图表类型(2)行(格)属性①RowCount属性:用于表示图表中总格(行)数。
例如:若MSChart控件显示二维数组Array_2(M,N),则总格(行)数RowCount=M。
如:RowCount=5,表示有5格(行)数据。
若MSChart控件显示一维数组Array_1(N)的元素值,则总行数RowCount=1。
②Row属性:用于表示图表中某格(行)的序号。
若MSChart控件显示二维数组Array_2(M,N),则图表中第I格的序号Row=I,当Row=1表示第1格(行)数据。
③RowLabel属性:用于表示格(行)标签名,默认值为Ri。
用户可以修改其值,如改为无锡地区人数、南京地区人数等。
④RowLabelCount属性:用于表示格(行)标签数,MSChart控件允许设置多个格(行)标签。
通常取值为1,当需要用2行以上的标签时,才修改此属性。
⑤RowLabelIndex属性:用于表示格(行)标签序号,用户通过设置不同格(行)标签序号选择不同格(行)标签进行编辑。
(3)列属性①ColumnCount属性:用于表示图表中每格(行)中的列数,即数组中列数N。
如设置ColumnCount=3,则每格(行)中有3列,图表每数据格用3个矩形或3个扇形表示。
②Column属性:用于表示图表中某格(行)某列的列序号,例如:Row=1,Column=1,表示图表中第1格(行)第1列。
③ColumnLabel属性:用于表示图表列标签名,默认为Ci。
④ColumnLabelCount属性:用于表示图表某格中的列标签数。
⑤ColumnLabelIndex属性:用于表示图表某格中的列标签序号。
ASPNETMVC中使用MsChart制作图
ASP NET MVC 中使用MsChart制作图 MVC 中使用MsChart制作图表(附实例)000微软新发布的图表控件MSChart,依赖于.NET Framework3.5 sp1的环境,制作出的图表非常漂亮。
同时,支持webfrom,winform,MVC。
本文主要介绍在ASP .NET MVC 下如何使用MSCHART制作图表。
1.下面简单列举一下MSCHART的部分图表类型2维堆积饼状图2维面积图2维气泡图2维线性图二维柱状图三维饼状图三维面积图三维线性图2. 在 MVC 框架下,如何使用MSCHART.首先看效果柱状图饼状图下面介绍使用MsChart制作图表实现的步骤:首先修改web.config 1. 将控件的命名空间加到("<system.web><pages><controls>" ) : <add tagPrefix="asp" namespace="System.Web.UI.DataVisualization.Chartin g"assembly="System.Web.DataVisualization,Version=3.5 .0.0,Culture=neutral, PublicKeyToken=31bf3856ad364e35"/> 2. 添加一个httpHandler ("<httpHandlers>"下面) :<add path="ChartImg.axd" verb="GET,HEAD"type="System.Web.UI.DataVisualization.Charting.Cha rtHttpHandler,System.Web.DataVisualization, Version=3.5.0.0, Culture=neutral, PublicKeyToken=31bf3856ad364e35" validate="false"/>3. 然后根据自己的需要,绘制不同的图表。
微软图表控件MsChart使用指南
微软图表控件MsChart使用指南昨天在网上看到了微软发布了.NET 3.5框架下的图表控件,第一时间抓下来看了一下,发觉功能很强劲,基本上能想到的图表都可以使用它绘制出来,给图形统计和报表图形显示提供了很好的解决办法,同时支持Web和WinForm两种方式,不过缺点也比较明显,只能在最新的开发环境中使用,需要.Net 3.5 Sp1以及VS 2008的开发环境。
下面是下载地址:mework 3.5)–1.包含英文版,中文版。
上面提供的链接是中文版的,可以更改为英文版。
2.语言包:Microsoft Chart Controls for Microsoft .NETFramework 3.5 Language Pack3.Microsoft .NET Framework 3.5 的Microsoft 图表控件的语言包,包含23中语言。
4.Microsoft Chart Controls Add-on for Microsoft Visual Studio 2008–这个只有英文的,没找到中文的。
5.文档(Microsoft Chart Controls for .NET Framework Documentation)–这个只有英文的,没找到中文的。
6.WinForm 和的例子(Samples Environmentfor Microsoft Chart Controls)–这个只有英文的,没找到英文的。
7.Demo 下载:/mschart下了它的示例程序后,运行了一下,非常的强大,可以支持各种各样的图形显示,常见的:点状图、饼图、柱状图、曲线图、面积图、排列图等等,同时也支持3D样式的图表显示,不过我觉得最有用的功能还是支持图形上各个点的属性操作,它可以定义图形上各个点、标签、图形的提示信息(Tooltip)以及超级链接、Jav ascript动作等,而不是像其它图形类库仅生成一幅图片而已,通过这些,加上微软自己的Ajax框架,可以建立一个可以互动的图形统计报表了。
微软图表控件MsChart使用文档
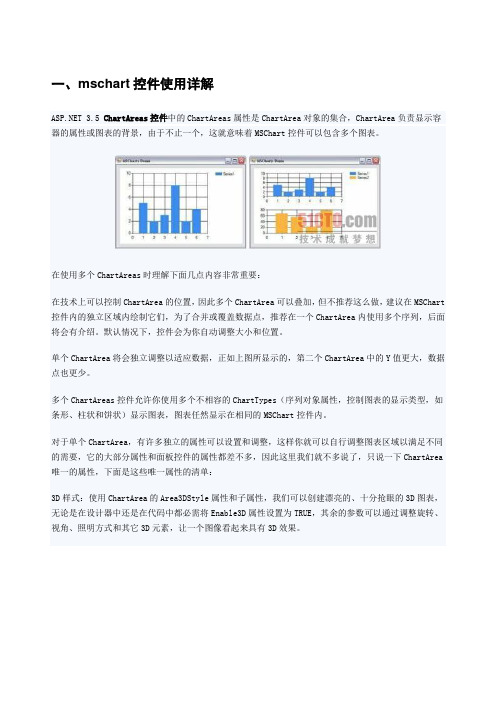
一、mschart控件使用详解 3.5 ChartAreas控件中的ChartAreas属性是ChartArea对象的集合,ChartArea负责显示容器的属性或图表的背景,由于不止一个,这就意味着MSChart控件可以包含多个图表。
在使用多个ChartAreas时理解下面几点内容非常重要:在技术上可以控制ChartArea的位置,因此多个ChartArea可以叠加,但不推荐这么做,建议在MSChart 控件内的独立区域内绘制它们,为了合并或覆盖数据点,推荐在一个ChartArea内使用多个序列,后面将会有介绍。
默认情况下,控件会为你自动调整大小和位置。
单个ChartArea将会独立调整以适应数据,正如上图所显示的,第二个ChartArea中的Y值更大,数据点也更少。
多个ChartAreas控件允许你使用多个不相容的ChartTypes(序列对象属性,控制图表的显示类型,如条形、柱状和饼状)显示图表,图表任然显示在相同的MSChart控件内。
对于单个ChartArea,有许多独立的属性可以设置和调整,这样你就可以自行调整图表区域以满足不同的需要,它的大部分属性和面板控件的属性都差不多,因此这里我们就不多说了,只说一下ChartArea 唯一的属性,下面是这些唯一属性的清单:3D样式:使用ChartArea的Area3DStyle属性和子属性,我们可以创建漂亮的、十分抢眼的3D图表,无论是在设计器中还是在代码中都必需将Enable3D属性设置为TRUE,其余的参数可以通过调整旋转、视角、照明方式和其它3D元素,让一个图像看起来具有3D效果。
坐标轴控制和样式:坐标轴集合包括x轴和y轴,以及第二个x轴和y轴,这四个项目的属性允许你设置样式、设置标签、定义间隔、设置工具提示、设置缩放等,如果你的图标要求精确的间隔、标签或其它特殊的显示需要,你可以使用这些属性。
例如,你可以颠倒坐标轴的值,或控制如何在x轴上显示标签。
Microsoft Visual Studio 2010中MSChart控件用于仿真曲线样例
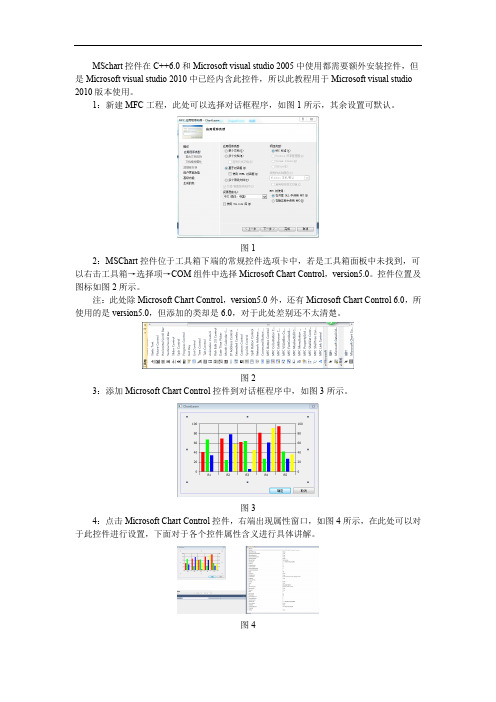
MSchart控件在C++6.0和Microsoft visual studio 2005中使用都需要额外安装控件,但是Microsoft visual studio 2010中已经内含此控件,所以此教程用于Microsoft visual studio 2010版本使用。
1:新建MFC工程,此处可以选择对话框程序,如图1所示,其余设置可默认。
图12:MSChart控件位于工具箱下端的常规控件选项卡中,若是工具箱面板中未找到,可以右击工具箱→选择项→COM组件中选择Microsoft Chart Control,version5.0。
控件位置及图标如图2所示。
注:此处除Microsoft Chart Control,version5.0外,还有Microsoft Chart Control 6.0,所使用的是version5.0,但添加的类却是6.0,对于此处差别还不太清楚。
图23:添加Microsoft Chart Control控件到对话框程序中,如图3所示。
图34:点击Microsoft Chart Control控件,右端出现属性窗口,如图4所示,在此处可以对于此控件进行设置,下面对于各个控件属性含义进行具体讲解。
图4更改属性页内属性,属性页位于属性列表上端快捷键最后一位,属性页如图5所示。
图5属性列表主要包括以下几个方面的设置:Chart主要包括对于图表类型的选择,此例中主要使用的是Line(2D),选项Show legend 为显示图例,在此例中需要进行勾选。
设置如图6所示。
图6Axis主要是对于各个坐标轴的设置,其中Axis可以进行X Axis、Y Axis及Second Y Axis 三个轴的选择,其中Show scale选项可以选择对应轴是否显示,Automatic scaling可以对于坐标轴上最大值、最小值、标注标签间隔和每个间隔细分格数(对于X及Y轴是不同的,X轴若是100为一个格,50需要为一个小格,Y轴Major divisions对应的是大格格数,Minor divisions对应小格格数)。
如何使用MsChart?

如何使用MsChart?MsChart是微软出品的一款功能强大的制作图表工具,用它可以很方便的建立各种图表。
下面我们举例来说明:submitinfo.asp' 发送数据程<HTML><HEAD><META NAME="GENERA TOR" Content="Microsoft Visual Studio 6.0"></HEAD><BODY><form method=post name="form1" action=mschart.asp><INPUT type="submit" value="发送" id=submit1 name=submit1><input type="hidden" value="宋英特的童年记录" name=chtitle><input type="hidden" value=3 name=rcount>' rcount 列数<input type="hidden" value=2 name=ccount>' ccount 行数<input type="hidden" value=1 name=rc_type><input type="hidden" value="1998" name=rname>' rname 列名数组<input type="hidden" value="1999" name=rname><input type="hidden" value="2000" name=rname><input type="hidden" value="身高" name=cname>' cname 行名数组<input type="hidden" value="体重" name=cname><input type="hidden" value=72 name=rc_data>' rc_data 数据<input type="hidden" value=75 name=rc_data><input type="hidden" value=78 name=rc_data><input type="hidden" value=81 name=rc_data><input type="hidden" value=84 name=rc_data><input type="hidden" value=89 name=rc_data></form></BODY></HTML>mschart.asp' 显示数据程序<%@ Language=VBScript %><HTML><HEAD><META NAME="GENERA TOR" Content="Microsoft Visual Studio 6.0"> <SCRIPT ID=clientEventHandlersJS LANGUAGE=javascript><!--function window_onload() {t=0;mschart1.TitleText = document.form1.chtitle.value;mschart1.ShowLegend =true;mschart1.ColumnCount =ount.value;mschart1.RowCount =document.form1.rcount.value;for (i=0;i<document.form1.rcount.value;i++){for (j=0;j<ount.value;j++){ mschart1.Row=i+1;mschart1.Column=j+1;if (ount.value>1)mschart1.ColumnLabel =ame(j).value;elsemschart1.ColumnLabel =ame.value;if ((document.form1.rcount.value*ount.value)>1) mschart1.Data=document.form1.rc_data(t).value;elsemschart1.Data=document.form1.rc_data.value;t++;}if (document.form1.rcount.value>1)mschart1.RowLabel =document.form1.rname(i).value ;elsemschart1.RowLabel =document.form1.rname.value ;}}function select1_onchange() {mschart1.chartType =select1.valuemschart1.Plot}//--></SCRIPT><TITLE>精彩春风之图表显示</TITLE></HEAD><BODY LANGUAGE=javascript onload="return window_onload()"><---此处插入mschart activex控件---><BR>MsChart显示方式<SELECT id=select1 name=select1 LANGUAGE=javascript onchange="return select1_onchange()"><OPTION value=1>二维直方图</OPTION><OPTION value=0>三维直方图</OPTION><OPTION value=3>二维折线图</OPTION><OPTION value=2>三维折线图</OPTION><OPTION value=5>二维面积图</OPTION><OPTION value=4>三维面积图</OPTION><OPTION value=14>饼图</OPTION></SELECT><form name=form1 id=form1><% for i=1 to Request.Form("rcount")%><input type="hidden" name=rname id=rname value=<%=Request.Form("rname")(i)%>> <%next%><% for i=1 to Request.Form("ccount")%><input type="hidden" name=cname id=cname value=<%=Request.Form("cname")(i)%>> <%next%><input type="hidden" name=rcount id=rcount value=<%=Request.Form("rcount")%>><input type="hidden" name=chtitle id=chtitle value=<%=Request.Form("chtitle")%>>' chtitle 标题<input type="hidden" name=ccount id=ccount value=<%=Request.Form("ccount")%>> <%if Request.Form("rc_type")=1 then%>' rc_type 排列方式(1 以行方式,2以列方式)<%for i=1 to Request.Form("rcount")*Request.Form("ccount")%><input type="hidden" name=rc_data id=rc_data value=<%=Request.Form("rc_data")(i)%>> <%next%><%else%><%for j=1 to Request.Form("rcount")%><%for i=1 to Request.Form("ccount")%><input type="hidden" name=rc_data id=rc_data value=<%=Request.Form("rc_data")((i-1)*Request.Form("rcount")+j)%>> <%next%> <%next%> <%end if%> </form></BODY> </HTML>。
mschart控件使用详解

一.数据源说到绘制图表,可能很多人的第一反应除了是图表呈现的方式外,更关心的便是数据如何添加,记得在很多年前,哪时要绘制一个数据曲线图,一直找不到好的呈现方式,后来使用了SVG的绘图模式,不过在添加数据的时候可谓吃尽了苦头,毕竟,SVG只是一种描述语言,要动态的实现一个图表的绘制,是非常困难的.对于微软的图表控件,数据添加是一件很简单的方式,它支持多种数据添加方式,如:·可以在图表的设计界面,在属性设置窗口中的Series属性下的Points中添加需要的数据.·可以在图表的设计界面中,在属性中绑定一个数据源.·可以在后台代码中,动态添加数据.·可以在后台代码中设置一个或多个数据源,直接绑定到图表中.在此处,我只着重讲解一下第3,4两点.对于第3点,相对来说比较简单,在后台代码中,找到要添加代码的Series,通过它下面Points的Add、AddXY、AddY等方法,即可以实现数据的添加.例如:1. double t;2. for(t = 0; t <= (2.5 * Math.PI); t += Math.PI/6)3. {4. double ch1 = Math.Sin(t);5. double ch2 = Math.Sin(t-Math.PI/2);6. Chart1.Series["Channel 1"].Points.AddXY(t, ch1);7. Chart1.Series["Channel 2"].Points.AddXY(t, ch2);8. }复制代码注:代码摘自微软的例子,上例中,Chart1为图表的名字,Channel 1、Channel 2分别表示两个Series数据序列)二.绑定数据先来看看图表控件都支持什么类型的数据绑定,根据官方文档的说法,只要是实现了IEnumerable接口的数据类型,都可以绑定到图表控件中,例如:DataView, DataReader, DataSet, DataRow, DataColumn, Array, List, SqlCommand, OleDbCommand, SqlDataAdapter, 及OleDbDataAdapter对象。
MFC画图的强大工具MSChart的使用

MFC画图的强⼤⼯具MSChart的使⽤MFC画图的强⼤⼯具MSChart的使⽤图表由于其直观明了的特性,在实际应⽤中⼗分很⼴泛。
我们常常希望数据能通过图表来显⽰其特性。
例如在Delphi和C++Builder编程中,我们可以很⽅便地实现数据图表。
MsChart(6.0或5.0版)是Windows 系统中Visual studio⾃带的⼀个ACTIVEX控件,它功能强⼤,应⽤⼴泛,具有以下特点:·⽀持随机数据和随机数组,动态显⽰。
·⽀持所有主要的图表类型。
·⽀持三维显⽰。
下⾯是⼀个实例:程序运⾏效果图⼀、在⼯程中加⼊mschart菜单->Project->Add To Project->Components and Controls->Registered ActiveX Controls->Microsoft Chart Control, version 6.0 (OLEDB)⼆、在CDemoView中加⼊:CMSChart m_Chart三、创建及设置m_Chart3.1 在CDemoView::OnCreate 中创建CMSChart1.// CDemoView::OnCreate()2.CRect rc;3.GetClientRect(&rc);4.if(!m_Chart.Create("mschart", WS_CHILD| WS_VISIBLE, rc, this, 10))5.return-1;3.2 在CDemoView::OnSize 中调整m_Chart 的⼤⼩,使之能随窗⼝⼤⼩变化⽽变化1.// CDemoView::OnSize2.if( m_Chart.GetSafeHwnd() )3.m_Chart.MoveWindow( 0, 0, cx, cy );3.3 设置m_Chart01.void CDemoView::InitChart()02.{03.// 设置标题04.m_Chart.SetTitleText("mschart ⽰例 by thinkry@/doc/4ce3eb7bbcd126fff7050bc0.html ");05.// 下⾯两句改变背景⾊06.m_Chart.GetBackdrop().GetFill().SetStyle(1);07.m_Chart.GetBackdrop().GetFill().GetBrush().GetFillColor().Set(255, 255, 255);08.// 显⽰图例09.m_Chart.SetShowLegend(TRUE);10.m_Chart.SetColumn(1);11.m_Chart.SetColumnLabel((LPCTSTR)"1号机");12.m_Chart.SetColumn(2);13.m_Chart.SetColumnLabel((LPCTSTR)"2号机");14.m_Chart.SetColumn(3);15.m_Chart.SetColumnLabel((LPCTSTR)"3号机");16.// 栈模式17.// m_Chart.SetStacking(TRUE);18.// Y轴设置19.VARIANT var;20.m_Chart.GetPlot().GetAxis(1,var).GetValueScale().SetAuto(FALSE); / / 不⾃动标注Y轴刻度21.m_Chart.GetPlot().GetAxis(1,var).GetValueScale().SetMaximum(100); // Y轴最⼤刻度22.m_Chart.GetPlot().GetAxis(1,var).GetValueScale().SetMinimum(0); // Y轴最⼩刻度23.m_Chart.GetPlot().GetAxis(1,var).GetValueScale().SetMajorDivision( 5); // Y轴刻度5等分24.m_Chart.GetPlot().GetAxis(1,var).GetValueScale().SetMinorDivision( 1); // 每刻度⼀个刻度线25.m_Chart.GetPlot().GetAxis(1,var).GetAxisTitle().SetText("⼩时"); // Y轴名称26.// 3条曲线27.m_Chart.SetColumnCount(3);28.// 线⾊29.m_Chart.GetPlot().GetSeriesCollection().GetItem(1).GetPen().GetVtC olor().Set(0, 0, 255);30.m_Chart.GetPlot().GetSeriesCollection().GetItem(2).GetPen().GetVtC olor().Set(255, 0, 0);31.m_Chart.GetPlot().GetSeriesCollection().GetItem(3).GetPen().GetVtC olor().Set(0, 255, 0);32.// 线宽(对点线图有效)33.m_Chart.GetPlot().GetSeriesCollection().GetItem(1).GetPen().SetWid th(50);34.m_Chart.GetPlot().GetSeriesCollection().GetItem(2).GetPen().SetWid th(100);35.m_Chart.GetPlot().GetSeriesCollection().GetItem(3).GetPen().SetWid th(2);36.// 数据点类型显⽰数据值的模式(对柱柱状图和点线图有效)37.// 0: 不显⽰ 1: 显⽰在柱状图外38.// 2: 显⽰在柱状图内上⽅ 3: 显⽰在柱状图内中间 4: 显⽰在柱状图内下⽅39.m_Chart.GetPlot().GetSeriesCollection().GetItem(1).GetDataPoints() .GetItem(-1).GetDataPointLabel().SetLocationType(1);40.m_Chart.GetPlot().GetSeriesCollection().GetItem(2).GetDataPoints() .GetItem(-1).GetDataPointLabel().SetLocationType(1);41.m_Chart.GetPlot().GetSeriesCollection().GetItem(3).GetDataPoints() .GetItem(-1).GetDataPointLabel().SetLocationType(1);42.}3.4 设置数据01.void CDemoView::DrawChart()02.{03.int nRowCount = 6;04.m_Chart.SetRowCount(nRowCount);05.VARIANT var;06.07.// 不⾃动标注X轴刻度08.m_Chart.GetPlot().GetAxis(0,var).GetCategoryScale().SetAuto(FALSE) ;09.10.// 每刻度⼀个标注11.m_Chart.GetPlot().GetAxis(0,var).GetCategoryScale().SetDivisionsPe rLabel(1);12.13.// 每刻度⼀个刻度线14.m_Chart.GetPlot().GetAxis(0,var).GetCategoryScale().SetDivisionsPe rTick(1);15.16.// X轴名称17.m_Chart.GetPlot().GetAxis(0,var).GetAxisTitle().SetText("⽇期");18.char buf[32];19.srand( (unsigned)time( NULL ) );20.for(int row = 1; row <= nRowCount; ++row)21.{22.m_Chart.SetRow(row);23.sprintf(buf, "%d号", row);24.m_Chart.SetRowLabel((LPCTSTR)buf);25.m_Chart.GetDataGrid().SetData(row, 1, rand() * 100 / RAND_MAX, 0);26.m_Chart.GetDataGrid().SetData(row, 2, rand() * 100 / RAND_MAX, 0);27.m_Chart.GetDataGrid().SetData(row, 3, rand() * 100 / RAND_MAX, 0);28.}29.m_Chart.Refresh();30.}3.5 改变显⽰类型view sourceprint?01.// 折线图02.void CDemoView::OnChartLine()03.{04.m_Chart.SetChartType(3);05.DrawChart();06.}07.08.// 柱状图09.void CDemoView::OnChartCombi()10.{11.m_Chart.SetChartType(1);12.DrawChart();13.}14.// 饼状图15.void CDemoView::OnChartPie()16.{17.m_Chart.SetChartType(14);18.DrawChart();19.}。
MSChart经验与技巧

每一个 对象最终都被添加至 集合属性中才能呈现出来 注:每一个Series对象最终都被添加至Chart .Series集合属性中才能呈现出来。 对象最终都被添加至Chart .Series集合属性中才能呈现出来。
四. MSChart主要控件类使用
• Point类使用 类
1. Label属性 ——点标签文本。 2. LegendText属性 ——图例项文本。 3. XValue属性 ——点对应X轴值。 4. YValues属性 ——点对应Y轴值集合,一般取第1个即可。 5. AxisLabel属性 ——点对应X轴标签文字,绘制饼图时会用到。 6. MarkerSize、MarkerStyle属性 ——和Series用法一致,且其优先级高于 Series级别定义。 7. Exploded 属性 ——仅适用域饼图的point对象,值为布尔型,用于控制饼块 是否分离显示,通过point.CustomProperty或point[“Exploded ”]来设置。 8. ToolTip、Url、MapAreaAttributes属性 ——实现浏览器端交互使用到 的关键属性,用法参见本幻灯片前文“三. MSChart公共属性”相关部分。
mschart label 用法

mschart label 用法
MSChart是Microsoft提供的一个用于在Windows窗体应用程
序中创建图表的工具。
在MSChart中,label的用法是用来显示图
表中数据点的标签,以便更清晰地展示数据信息。
以下是关于MSChart中label的用法的详细说明:
1. 数据点标签的显示,在MSChart中,可以通过设置数据点的Label属性来显示数据点的标签。
这可以通过代码来实现,也可以
通过设计器来设置。
通过设置Label属性,可以让每个数据点显示
其对应的标签,例如在柱状图或折线图中显示数据点的具体数值。
2. 自定义标签内容,除了显示数据点的数值之外,还可以自定
义数据点的标签内容。
可以通过设置数据点的Label属性,将任何
希望显示的文本赋给数据点的标签,比如数据点的名称、单位等。
3. 标签的样式和格式,MSChart允许对标签的样式和格式进行
自定义。
可以设置标签的字体、颜色、大小等属性,以及标签的位
置和对齐方式,以满足不同的显示需求。
4. 动态显示标签,在一些情况下,需要动态地显示或隐藏标签,
MSChart也提供了相应的方法和事件来实现这一功能,比如根据鼠标悬停在数据点上时显示标签,或者根据特定条件动态地显示或隐藏标签。
总之,MSChart中的label用法主要是用来显示图表中数据点的标签信息,通过设置标签的内容、样式和格式,可以使图表更加清晰地展示数据,并且可以根据实际需求进行灵活的定制和控制。
希望以上信息能够帮助你更好地了解MSChart中label的用法。
VS2013 使用MsChart图表控件
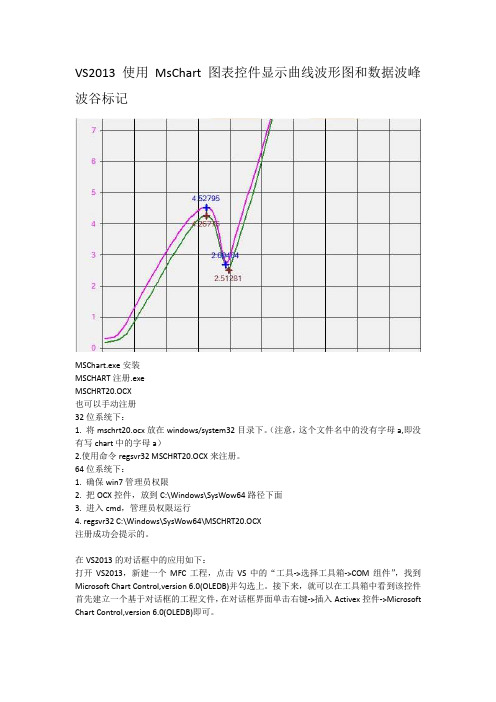
VS2013 使用MsChart图表控件显示曲线波形图和数据波峰波谷标记MSChart.exe安装MSCHART注册.exeMSCHRT20.OCX也可以手动注册32位系统下:1. 将mschrt20.ocx放在windows/system32目录下。
(注意,这个文件名中的没有字母a,即没有写chart中的字母a)2.使用命令regsvr32 MSCHRT20.OCX来注册。
64位系统下:1. 确保win7管理员权限2. 把OCX控件,放到C:\Windows\SysWow64路径下面3. 进入cmd,管理员权限运行4. regsvr32 C:\Windows\SysWow64\MSCHRT20.OCX注册成功会提示的。
在VS2013的对话框中的应用如下:打开VS2013,新建一个MFC工程,点击VS中的“工具->选择工具箱->COM组件”,找到Microsoft Chart Control,version 6.0(OLEDB)并勾选上。
接下来,就可以在工具箱中看到该控件首先建立一个基于对话框的工程文件,在对话框界面单击右键->插入Activex控件->Microsoft Chart Control,version 6.0(OLEDB)即可。
新建MFC工程建立对话框应该程序点击完成,右击插入ActiveX控件列表中找到Microsoft Chart Control 6.0(SP4) (OLEDB)控件点确定按钮插入MsChart图表控件在控件上右击添加变量这时候并不能使用MsChart控件的所有功能,还需要添加控件的所有类,添加步骤如下,先打开类向导点“…”找到MSCHRT20.OCX文件注意OCX控件32位系统在C:\ windows/system32目录下64位系统在C:\Windows\SysWow64路径下面注意左侧会列出控件的所有类,可选择添加点击“>”逐个添加要用到的类,好像只能一个一个添加,最好全部添加添加完成按确定会自动加载.h和.cpp文件到工程中,这时才可以使用控件的所有功能下面是整理出来的一些主要功能void CMyPD3000Dlg::Init_Mschart(CMschart1& m_chartt1){m_chartt1.put_AllowSelections(FALSE); //是否可以选择图表对象m_chartt1.put_AllowSeriesSelection(FALSE);//单击单个的图表数据点时是否可选定整个系列。
MSChart图表控件的一些使用

MSChart图表控件的一些使用最近使用MSChart做了几张图表,微软提供的例子中对这个图表控件的使用已经说的比较详细了,我这里记录一些需要注意的。
1. Chart图表的元素要使用该图表首先要了解该图表的元素组成,就是下面这张图了,图表主要包含:Annotations (图形注解集合)ChartAreas(图表区域集合)Legends(图例集合)Series图表序列集合即图表数据对象集合)Title(图标的标题集合)其他大家可以参考Samples中的Char Features一节。
2. 如何在 MVC中使用Chart控件2.1.需要在"<system.web><pages><controls>"中添加如下:<add tagPrefix="asp" namespace="System.Web.UI.DataVisualization.Charting" assembly="System.Web.DataVisualization,Version=3.5.0.0, Culture=neutral, PublicKeyToken=31bf3856ad364e35"/>2.2.在"<httpHandlers>"中添加如下部分:<add path="ChartImg.axd" verb="GET,HEAD" type="System.Web.UI.DataVisualization.Charting.ChartHttpHan dler,System.Web.DataVisualization, Version=3.5.0.0, Culture=neutral, PublicKeyToken=31bf3856ad364e35" validate="false"/>2.3. 有了上面的配置就可以测试了:2.3.1.View中添加:<asp:chart id="Chart1" runat="server" Height="296px"Width="412px" Palette="BrightPastel" imagetype="Png"BorderDashStyle="Solid" BackSecondaryColor="White" BackGradientStyle="TopBottom" BorderWidth="2" backcolor="#D3DFF0"BorderColor="26, 59, 105"><Titles><asp:Title Text="With datasource in code behind" /></Titles><legends><asp:Legend IsTextAutoFit="False" Name="Default" BackColor="Transparent" Font="Trebuchet MS, 8.25pt, style=Bold"></asp:Legend></legends><borderskin skinstyle="Emboss"></borderskin><series><asp:Series Name="Column" BorderColor="180, 26, 59, 105"> </asp:Series></series><chartareas><asp:ChartArea Name="ChartArea1" BorderColor="64, 64, 64, 64" BorderDashStyle="Solid" BackSecondaryColor="White"BackColor="64, 165, 191, 228" ShadowColor="Transparent" BackGradientStyle="TopBottom"><area3dstyle Rotation="10" perspective="10" Inclination="15" IsRightAngleAxes="False" wallwidth="0"IsClustered="False"></area3dstyle><axisy linecolor="64, 64, 64, 64"><labelstyle font="Trebuchet MS, 8.25pt, style=Bold" /><majorgrid linecolor="64, 64, 64, 64" /></axisy><axisx linecolor="64, 64, 64, 64"><labelstyle font="Trebuchet MS, 8.25pt, style=Bold" /><majorgrid linecolor="64, 64, 64, 64" /></axisx></asp:ChartArea></chartareas></asp:chart>2.3.2.index.aspx.cs中添加protected void Page_Load(object sender, System.EventArgs e) {foreach (int value in (List<int>)this.ViewData["Chart"]){this.Chart1.Series["Column"].Points.Add(value);}}2.3.3.Controller中:public ActionResult Index(){ViewData["Title"] = "Home Page";ViewData["Message"] = "Welcome to MVC!";List<int> chartList = new List<int>();chartList.Add(1);chartList.Add(2);chartList.Add(6);chartList.Add(5);chartList.Add(4);ViewData["Chart"] = chartList;return View();}2.3.4.添加System.Web.ui.DataVisualization引用3. Tooltip的使用ToolTip用于在各个关键点,如:标签、图形关键点、标题等当鼠标移动上去的时候,提示用户一些相关的详细或说明信息。
- 1、下载文档前请自行甄别文档内容的完整性,平台不提供额外的编辑、内容补充、找答案等附加服务。
- 2、"仅部分预览"的文档,不可在线预览部分如存在完整性等问题,可反馈申请退款(可完整预览的文档不适用该条件!)。
- 3、如文档侵犯您的权益,请联系客服反馈,我们会尽快为您处理(人工客服工作时间:9:00-18:30)。
微软图表控件MsChart使用指南昨天在网上看到了微软发布了.NET 3.5框架下的图表控件,第一时间抓下来看了一下,发觉功能很强劲,基本上能想到的图表都可以使用它绘制出来,给图形统计和报表图形显示提供了很好的解决办法,同时支持Web和WinForm两种方式,不过缺点也比较明显,只能在最新的开发环境中使用,需要.Net 3.5 Sp1以及VS 2008的开发环境。
下面是下载地址:mework 3.5)–1.包含英文版,中文版。
上面提供的链接是中文版的,可以更改为英文版。
2.语言包:Microsoft Chart Controls for Microsoft .NETFramework 3.5 Language Pack3.Microsoft .NET Framework 3.5 的Microsoft 图表控件的语言包,包含23中语言。
4.Microsoft Chart Controls Add-on for Microsoft Visual Studio 2008–这个只有英文的,没找到中文的。
5.文档(Microsoft Chart Controls for .NET Framework Documentation)–这个只有英文的,没找到中文的。
6.WinForm 和的例子(Samples Environmentfor Microsoft Chart Controls)–这个只有英文的,没找到英文的。
7.Demo 下载:/mschart下了它的示例程序后,运行了一下,非常的强大,可以支持各种各样的图形显示,常见的:点状图、饼图、柱状图、曲线图、面积图、排列图等等,同时也支持3D样式的图表显示,不过我觉得最有用的功能还是支持图形上各个点的属性操作,它可以定义图形上各个点、标签、图形的提示信息(Tooltip)以及超级链接、Jav ascript动作等,而不是像其它图形类库仅生成一幅图片而已,通过这些,加上微软自己的Ajax框架,可以建立一个可以互动的图形统计报表了。
一。
安装控件的安装相对比较简单,下载完后,先执行“MSChart.exe”程序,它会自动检测你的环境,安装到系统目录中去,如果要在V S 2008环境中直接使用,那么需要安装For Vs2008的插件,MSChart_VisualStudioAddOn.exe,还有一个中文语言包MS ChartLP_chs.exe。
安装完后,打开Vs2008,在建立项目的时候,你就能在工具栏中看到有一个Chart的控件了,如下图:二。
使用安装好后,建立一个.NET3.5的Web项目,像使用普通控件一样拖放到要使用的Web界面即可。
初步研究了一下,整个图形控件主要由以下几个部份组成:1.Annotations --图形注解集合2.ChartAreas --图表区域集合3.Legends --图例集合4.Series--图表序列集合(即图表数据对象集合)5.Titles--图标的标题集合Annotations注解集合Annotations是一个对图形的一些注解对象的集合,所谓注解对象,类似于对某个点的详细或者批注的说明,比如,在图片上实现各个节点的关键信息,如下图方框和黄色的小方框:一个图形上可以拥有多个注解对象,可以添加十多种图形样式的注解对象,包括常见的箭头、云朵、矩行、图片等等注解符号,通过各个注解对象的属性,可以方便的设置注解对象的放置位置、呈现的颜色、大小、文字内容样式等常见的属性。
ChartAreas图表区域集合ChartAreas可以理解为是一个图表的绘图区,例如,你想在一幅图上呈现两个不同属性的内容,一个是用户流量,另一个则是系统资源占用情况,那么你要在一个图形上绘制这两种情况,明显是不合理的,对于这种情况,可以建立两个ChartArea,一个用于呈现用户流量,另一个则用于呈现系统资源的占用情况。
当然了,图表控件并不限制你添加多少个绘图区域,你可以根据你的需要进行添加。
对于每一个绘图区域,你可以设置各自的属性,如:X,Y轴属性、背景等。
需要注意的是,绘图区域只是一个可以作图的区域范围,它本身并不包含要作图形的各种属性数据。
多绘图区效果图如下,分为上下两个绘图区域,分别表示不同的绘图数据:Legends图例集合Legends是一个图例的集合,即标注图形中各个线条或颜色的含义,同样,一个图片也可以包含多个图例说明,比如像上面说的多个图表区域的方式,则可以建立多个图例,每别说明各个绘图区域的信息,具体的图例配置说明此处就不详细说明了,可以参考一下官网的例子,写得丰富的详细了:)也上一张图例的效果图吧~Series图表序列图表序列,应该是整个绘图中最关键的内容了,通俗点说,即是实际的绘图数据区域,实际呈现的图形形状,就是由此集合中的每一个图表来构成的,可以往集合里面添加多个图表,每一个图表可以有自己的绘制形状、样式、独立的数据等。
需要注意的是,每一个图表,你可以指定它的绘制区域(见C hartAreas的说明),让此图表呈现在某个绘图区域,也可以让几个图表在同一个绘图区域叠加,如下图:上面两幅图,分别表示了把图表放在不同的绘制区域和放在同一个绘制区域的情况。
继续回到ChartAreas章节举的例子,同时要显示用户的流量还要显示系统的占用情况,对于这种时候,应该建立两个Series,一个用于呈现用户的流量,另一个则用于呈现系统的占用情况。
它们分别属于各自的绘图区域。
Titles标题合集根据字面含义即可以理解,是图表的标题配置,同样可以添加多个标题,以及设置标题的样式及文字、位置等属性。
多看一下它的属性即能明白各自的含义。
三。
其它属性相对来说,我觉得比较有用的属性有三个,分别是:Label、T ooltip以及Url链接。
Label即标签的含义,可以在图片的关键位置进行一些关键数字或文字的描述,如下图:像上图:X轴和Y轴的文字便是标签,以及图表曲线中的红点上的文字,也是标签,添加了标签,可以让人更容易的对内容进行理解。
Tooltip即提示的含义,用于在各个关键点,如:标签、图形关键点、标题等当鼠标移动上去的时候,提示用户一些相关的详细或说明信息,例如上图,可以给曲线中的每一个点增加Tooltip的属性,写上需要详细说明的内容,比如:详细的销售明细,那么,在鼠标移动到这个点的时候,会自动弹出提示信息。
Tooltip可以支持简单方式以及自定义的方式,简单方式即像平时Html页面设置的title之类的属性效果,而自定义的方式,则可以实现图形、文本等各种复杂的提示信息显示。
详细的方式请参考官方例子的:Interactivity and AJAX/Tooltips以及Inter activity and AJAX/Client Side Scripts下面的相关例子。
Url链接,图表控件中,有一大半的控件都有Url及Tooltip的属性,你可以设置此属性,在鼠标点击的时候,代到其它相应的页面去。
建议大家看看官方例子中的Interactivity and AJAX部份,很精彩:)例子:建立一个Cpu信息和内存使用的实时统计表下面写一个小例子,建立一个系统的内存实时统计图表,使用到了Ajax的方法,以及Windows Api取得系统内存的方法。
首先,建立一个Aspx页面,拖动一个图表控件到页面,设置图表控件的属性如下:其中,MEMORY_INFO,ComputerInfo是一个定义的结构体及调用Win32 API接口的一个访问类。
程序分别取得每一个图表对象,每次加载的时候,都重新取得当前的内存和Cpu信息,再在图表上添加一个点,需要注意的是,一定要设置图表控件的En ableViewState属性为True,否则无法记录状态。
<asp:Chart ID="ChartMemory"runat="server"BackColor= "LightSteelBlue"BackGradientStyle="TopBottom"BackSecondaryColor="Whi te"EnableTheming="False"EnableViewState="True"Height="363px"Width="415px"> <Legends><asp:Legend Alignment="Center"Docking="Bottom"Name ="Legend1"Title="图例"></asp:Legend></Legends><Titles><asp:Title Font="微软雅黑, 16pt"Name="Title1"Text="系统内存监控图表"></asp:Title></Titles><Series><asp:Series BorderColor="White"BorderWidth="3"ChartAr ea="ChartArea1"ChartType="Spline"Legend="Legend1"Name="已使用物理内存"XValueType="Double"YValueType="Double"></asp:Series><asp:Series BorderWidth="3"ChartArea="ChartArea1"Cha rtType="Spline"Legend="Legend1"Name="全部占用内存"></asp:Series><asp:Series ChartArea="ChartArea2"ChartType="StackedA rea"Legend="Legend1"Name="CPU"></asp:Series></Series><ChartAreas><asp:ChartArea BackColor="224, 224, 224"BackGradientS tyle="LeftRight"Name="ChartArea1"></asp:ChartArea><asp:ChartArea Name="ChartArea2"></asp:ChartArea></ChartAreas></asp:Chart>一共建立了两个绘图区,一个用于呈现内存使用情况的在ChartA rea1区域,另一个则是呈现Cpu使用情况的,放置在ChartAre a2区域了。