R软件实现随机森林算法(带详细代码操作)
【原创】R语言时间序列arima和随机森林模型预测分析报告(附代码数据)
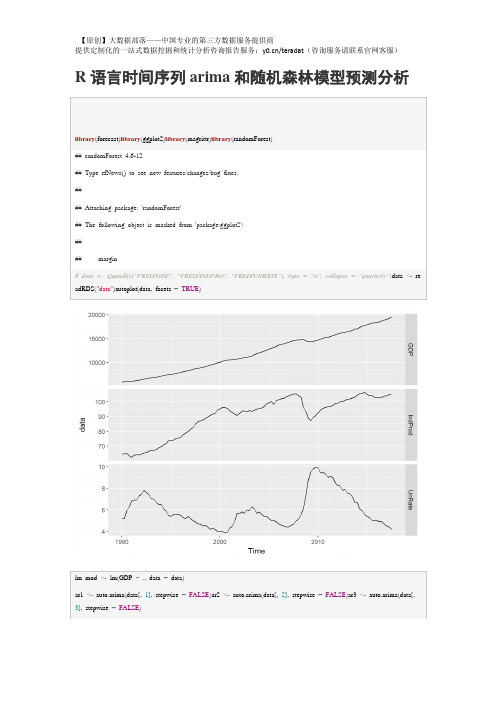
##
## Model df: 4. Total lags used: 8
checkresiduals(lm_mod)
##
## Breusch-Godfrey test for serial correlation of order up to 10
## Q* = 2.2891, df = 5, p-value = 0.8079
##
## Model df: 3. Total lags used: 8
checkresiduals(arireg)
##
## Ljung-Box test
##
## data: Residuals from Regression with ARIMA(2,2,1) errors
lm_mod<-lm(GDP~.,data=data)
ar1<-auto.arima(data[,1],stepwise=FALSE)ar2<-auto.arima(data[,2],stepwise=FALSE)ar3<-auto.arima(data[,3],stepwise=FALSE)
GDP<-forecast(ar1)$meanIndProd<-forecast(ar2)$meanUnRate<-forecast(ar3)$meanf3<-cbind(IndProd,UnRate)arireg<-auto.arima(data[,1],stepwise=FALSE,xreg=data[,-1])
summary(lm_mod)
##
## Call:
## lm(formula = GDபைடு நூலகம் ~ ., data = data)
r语言随机森林模型怎么求出回归方程
r语言随机森林模型怎么求出回归方程全文共四篇示例,供读者参考第一篇示例:随机森林是一种强大的机器学习算法,它结合了决策树和集成学习的优势,在回归问题中也有很好的表现。
在R语言中,使用随机森林模型可以很容易地求出回归方程,下面我们就来详细介绍一下如何在R语言中求出随机森林回归方程。
1. 数据准备我们需要准备好用于建模的数据集。
数据集应该包含输入变量和目标变量,输入变量用于建立回归模型,目标变量是我们要预测的值。
在R语言中可以使用data.frame()函数将数据加载进来,确保数据集中不含有缺失值。
2. 导入随机森林库在R语言中,可以使用randomForest包来构建随机森林模型。
首先需要安装包并导入到R中,可以使用以下代码完成这一步:```install.packages("randomForest")library(randomForest)```3. 构建随机森林模型接下来,我们使用randomForest()函数来构建随机森林模型。
在函数中需要指定输入变量和目标变量,以及其他一些参数,如树的数量、节点最小样本数等。
以下是一段示例代码:这里的"data"是我们准备好的数据集,"Target"是目标变量的列名,"~ ."表示使用所有其他变量作为输入变量,"ntree"表示森林中树的数量,"mtry"表示每个节点中考虑的变量数量。
根据具体情况可以调整这些参数来优化模型。
4. 提取回归方程随机森林模型是由多个决策树组成的集合模型,因此没有明确的回归方程。
但是可以通过查看变量的重要性来理解模型的影响因素。
可以使用以下代码来查看变量的重要性:```varImpPlot(rf_model)```这个函数会返回一个图表,显示每个变量的重要性以及它们对模型的贡献程度。
可以根据这个图表来了解模型中哪些变量对预测结果具有更大的影响。
R随机森林算法
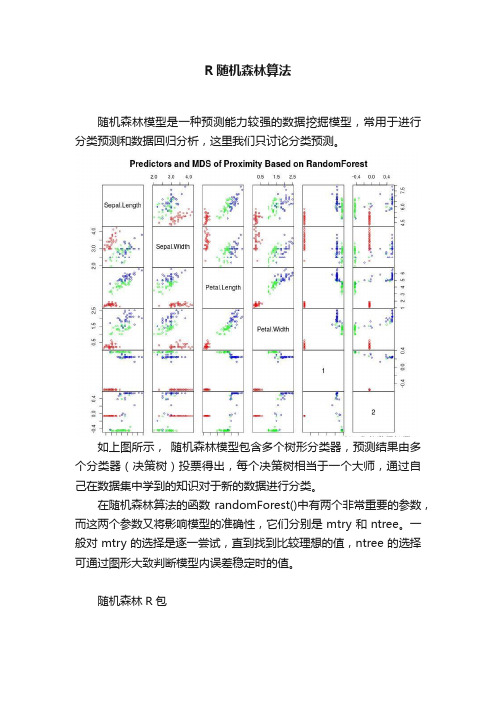
R随机森林算法随机森林模型是一种预测能力较强的数据挖掘模型,常用于进行分类预测和数据回归分析,这里我们只讨论分类预测。
如上图所示,随机森林模型包含多个树形分类器,预测结果由多个分类器(决策树)投票得出,每个决策树相当于一个大师,通过自己在数据集中学到的知识对于新的数据进行分类。
在随机森林算法的函数randomForest()中有两个非常重要的参数,而这两个参数又将影响模型的准确性,它们分别是mtry和ntree。
一般对mtry的选择是逐一尝试,直到找到比较理想的值,ntree的选择可通过图形大致判断模型内误差稳定时的值。
随机森林R包randomForest::randomForest 该包中主要涉及5个重要函数,关于这5个函数的语法和参数请见下方:randomForest():此函数用于构建随机森林模型randomForest(formula, data=NULL, ..., subset, na.action=na.fail)1. formula:指定模型的公式形式,类似于y~x1+x2+x3...;2. data:指定分析的数据集;3.ntree:指定随机森林所包含的决策树数目,默认为500;4. mtry:指定节点中用于二叉树的变量个数,默认情况下数据集变量个数的二次方根(分类模型)或三分之一(预测模型)。
一般是需要进行人为的逐次挑选,确定最佳的m值;估值过程指定m值,即随机产生m个变量用于节点上的二叉树,m的选择原则是使错误率最低。
应用bootstrap自助法在原数据集中又放回地抽取k个样本集,组成k棵决策树,每个决策树输出一个结果。
对k个决策树组成的随机森林对样本进行分类或预测:分类原则:少数服从多数;预测原则:简单平均。
oob error如何选择最优的特征个数m,要解决这个问题,我们主要依据计算得到的袋外错误率.在构建每棵树时,对训练集使用了不同的bootstrap sample(随机且有放回地抽取)。
用R实现随机森林的分类与回归
用R实现随机森林的分类与回归第五届中国R语言会议北京2012 李欣海用R实现随机森林的分类与回归Applications of Random Forest using RClassification and Regression李欣海中科院动物所邮件:lixh@//0>.主页:////.博客:////.微博:////. 第五届中国R语言会议北京2012 李欣海随机森林简介Random Forest////.an-introduction-to-data-mining-for-marketing-and-business-intelli gence/Random Forest is an ensemble classifier thatconsists of many decision trees It outputs the class that is the mode of the class'soutput by individual trees Breiman 2001 It deals with “small n large p”-problems, high-orderinteractions, correlated predictor variables.Breiman, L. 2001. Random forests. Machine Learning 45:5-32. Being cited 6500 times until 20123/25 第五届中国R语言会议北京2012 李欣海随机森林简介History////.an-introduction-to-data-mining-for-marketing-and-business-intelli gence/The algorithm for inducing a random forest was developed byLeo Breiman 2001 and Adele Cutler, and "Random Forests" istheir trademarkThe term came from random decision forests that was firstproposed by Tin Kam Ho of Bell Labs in 1995The method combines Breiman's "bagging" idea and therandom selection of features, introduced independently by Ho1995 and Amit and Geman 1997 in order to construct acollection of decision trees with controlled variation.4/25 第五届中国R语言会议北京2012 李欣海随机森林简介Tree modelsy β + β x + β x + β x + εi 0 1 1i 2 2 i 3 3i iClassification treeRegression treeCrawley 2007 The R Book p691 Crawley 2007 The R Book p6945/25 第五届中国R语言会议北京2012 李欣海随机森林简介The statistical community uses irrelevant theory,questionable conclusions?David R. Cox Emanuel Parzen Bruce HoadleyBrad EfronNO YES6/25 第五届中国R语言会议北京2012 李欣海随机森林简介Ensemble classifiers////.Tree models are simple, often produce noisy bushy or weakstunted classifiers Bagging Breiman, 1996: Fit many large trees to bootstrap-resampled versions of the training data, and classify by majority vote Boosting Freund & Shapire, 1996: Fit many large or small trees to reweighted versions of the training data. Classify by weighted majority vote Random Forests Breiman 1999: Fancier version of bagging.In general Boosting Random Forests Bagging Single TreeTrevor Hastie.7/25 第五届中国R语言会议北京2012 李欣海随机森林简介How Random Forest Works////.At each tree split, a random sample of m features is drawn, and only those m features are considered for splittingTypically m sqrtp or logp, where p is the number offeatures For each tree grown on a bootstrap sample, the error rate for observations left out of the bootstrap sample ismonitored. This is called the out-of-bag OOB error rate Random forests tries to improve on bagging by “de-correlating” the trees. Each tree has the same expectation.Trevor Hastie, p21 in Trees, Bagging, Random Forests and Boosting8/25 第五届中国R语言会议北京2012 李欣海随机森林简介R PackagesrandomForest randomForestTitle: Breiman and Cutler’s random forests for classification and regressionVersion: 4.6-6Date: 2012-01-06Author:Fortran original by Leo Breiman and Adele Cutler, R port by Andy Liawand Matthew Wiener.Implementation based on CART trees for variables of different types.Biased in favor of continuous variables and variables with many categories.partycforestBased on unbiased conditional inference trees.For variables of different types: unbiased when subsampling.黄河渭河9/25 第五届中国R语言会议北京2012 李欣海随机森林:分类# # # # ## ## ## ## # # # # # # # # # # # # # ### # # ## ## ## # # # # # # # # # # ## ## ## # # ## ## ## # # # # # # # # # # ## ## ## # # ## ## # # # ## ## ## ## # # # # # # # # # # # # # ### # # ## ## ## # # # # # # # # # # ## ## ## # # ## ## ## # # # # # # # # # # ## ## ## # # ## ## # # # ## ## ## ## # # # # # # # # # # # # # ### # # ## ## ## # # # # # # # # # # ## ## ## # # ## ## ## # # # # # # # # # # ## ## ## # # ## ## # # # ## ## ## ## # # # # # # # # # # # # # ### # # ## ## ## # # # # # # # # # # ## ## ## # # ## ## ## # # # # # # # # # # ## ## ## # # ## ## # # # ## ## ## ## # # # # # # # # # # # # # ### # # ## ## ## # # # # # # # # # # ## ## ## # # ## ## ## # # # # # # # # # # ## ## ## # # ## ## # # # ## ## ## ## # # # # # # # # # # # # # ### # # ## ## ## # # # # # # # # # # ## ## ## # # ## ## ## # # # # # # # # # # ## ## ## # # ## ## # # # ## ## ## ## # # # # # # # # # # # # # ### # # ## ## ## # # # # # # # # # # ## ## ## # # ## ## ## # # # # # # # # # # ## ## ## # # ## #宁夏# # # # ## ## ## ## # # # # # # # # # # # # # ### # # ## ## ## # # # # # # # # # # ## ## ## # # ## ## ## # # # # # # # # # # ## ## ## # # ## #青海# # # # ## ## ## ## # # # # # # # # # # # # # ### # # ## ## ## # # # # # # # # # # ## ## ## # # ## ## ## # # # # # # # # # # ## ## ## # # ## ## # # # ## ## ## ## # # # # # # # # # # # # # ### # # ## ## ## # # # # # # # # # # ## ## ## # # ## ## ## # # # # # # # # # # ## ## ## # # ## #朱?的分布# # # # ## ## ## ## # # # # # # # # # # # # # ### # # ## ## ## # ### ## # # # ## ## ## ## # # # # # # # # # # # # # ### # # ## ## ## # # # # # # # # # # ## ## ## # # ## ## ## # # # # # # # # # # ## ## ## # # ## #山西# # # # ## ## ## ## # # # # # # # # # # # # # ### # # ## ## ## # # # # # # # # # # ## ## ## # # ## ## ## # # # # # # # # # # ## ## ## # # ## ## # # # ## ## ## ## # # # # # # # # # # # # # ### # # ## ## ## # # # # # # # # # # ## ## ## # # ## ## ## # # # # # # # # # # ## ## ## # # ## ## # # # ## ## ## ## # # # # # # # # # # # # # ### # # ## ## ## # # # # # # # # # # ## ## ## # # ## ## ## # # # # # # # # # # ## ## ## # # ## ## # # # ## ## ## ## # # # # # # # # # # # # # ### # # ## ## ## # # # # # # # # # # ## ## ## # # ## ## ## # # # # # # # # # # ## ## ## # # ## ## # # # ## ## ## ## # # # # # # # # # # # # # ### # # ## ## ## # # # # # # # # # # ## ## ## # # ## ## ## # # # # # # # # # # ## ## ## # # ## ## # # # ## ## ## ## # # # # # # # # # # # # # ### # # ## ## ## # ### ## # # # ## ## ## ## # # # # # # # # # # # # # ### # # ## ## ## # # # # # # # # # # ## ## ## # # ## ## ## # # # # # # # # # # ## ## ## # # ## ## # # # ## ## ## ## # # # # # # # # # # # # # ### # # ## ## ## # # # # # # # # # # ## ## ## # # ## ## ## # # # # # # # # # # ## ## ## # # ## ## # # # ## ## ## ## # # # # # # # # # # # # # ### # # ## ## ## # # # # # # # # # # ## ## ## # # ## ## ## # # # # # # # # # # ## ## ## # # ## ## # # # ## ## ## ## # # # # # # # # # # # # # ### # # ## ## ## # # # # # # # # # # ## ## ## # # ## ## ## # # # # # # # # # # ## ## ## # # ## ## # # # ## ## ## ## # # # # # # # # # # # # # ### # # ## ## ## # # # # # # # # # # ## ## ## # # ## ## ## # # # # # # # # # # ## ## ## # # ## #甘肃# # # # ## ## ## ## # # # # # # # # # # # # # ### # # ## ## ## # # # # # # # # # # ## ## ## # # ## ## ## # # # # # # # # # # ## ## ## # # ## ## # # # ## ## ## ## # # # # # # # # # # # # # ### # # ## ## ## # ### ## # # # ## ## ## ## # # # # # # # # # # # # # ### # # ## ## ## # # # # # # # # # # ## ## ## # # ## ## ## # # # # # # # # # # ## ## ## # # ## ## # # # ## ## ## ## # # # # # # # # # # # # # ### # # ## ## ## # # # # # # # # # # ## ## ## # # ## ## ## # # # # # # # # # # ## ## ## # # ## ## # # # ## ## ## ## # # # # # # # # # # # # # ### # # ## ## ## # # # # # # # # # # ## ## ## # # ## ## ## # # # # # # # # # # ## ## ## # # ## ## # # # ## ## ## ## # # # # # # # # # # # # # ### # # ## ## ## # # # # # # # # # # ## ## ## # # ## ## ## # # # # # # # # # # ## ## ## # # ## ## # # # ## ## ## ## # # # # # # # # # # # # # ### # # ## ## ## # # # # # # # # # # ## ## ## # # ## ## ## # # # # # # # # # # ## ## ## # # ## ## # # # ## ## ## ## # # # # # # # # # # # # # ### # # ## ## ## # # # # # # # # # # ## ## ## # #陕西 ## ## ## # # # # # # # # # # ## ## ## # # ## ##### # # # ## ## ## ## # # # # # # # # # # # # # ### # # ## ## ## # ### #河南## # # # ## ## ## ## # # # # # # # # # # # # # ### # # ## ## ## # # # # # # # # # # ## ## ## # # ## ## ## # # # # # # # # # # ## ## ## # # ## ## # # # ## ## ## ## # # # # # # # # # # # # # ### # # ## ## ## # # # # # # # # # # ## ## ## # # ## ## ## # # # # # # # # # # ## ## ## # # ## ### # # # ## ## ## ## # # # # # # # # # # # # # ### # # ## ## ## # # # # # # # # # # ## ## ## # # ## ## ## # # # # # # # # # # ## ## ## # # ## ############ # # # ## ## ## ## # # # # # # # # # # # # # ### # # ## ## ## # # # # # # # # # # ## ## ## # # ## ## ## # # # # # # # # # # ## ## ## # # ## ### # # # ## ## ## ## # # # # # # # # # # # # # ### # # ## ## ## # # # # # # # # # #### ## ## # # ## ## ## # # # # # # # # # # ## ## ## # # ## ######### ## ######## ######## ### #### ### ## ######## ## ############################ ####### ########## ## #### #### #### ## ### # # # ## ## ## ## # # # # # # # # # # # # # ### # # ## ## ## # # # # # # # ### ## ################## ## #### ######## ## ######### ###### ####### ## # ## ## # # ## ## ## # # # # # # # # # # ## ## ## # # ## # ## #### ## ## #### ### ## #### ## # # ## # ##### ## ## ########### #### ##### ## ## ############ ######## ### ## ##### ###### # # # ## ## ## ## # # # # # # # # # # # # # ### # # ## ## ## # # # # # # # ##### #### ## ## # # ## ## ## # # # # # # # # # # ## ## ## # # ## ###### #### ## ## ##### ##### # # # ## ## ## ## # # # # # # # # # # # # # ### # # ## ## ## # # # # # # # # ######### ## ## # # ## ## ## # # # # # # # # # # ## ## ## # # ## ######## # # # ## ## ## ## # # # # # # # # # # # # # ### # # ## ## ## # # # # # # # # # # ## ## ## # # ## ## ## # # # # # # # # # # ## ## ## # # ## ### ###### # # # ## ## ## ## # # # # # # # # # # # # # ### # # ## ## ## # # # # # # # # # # ## ## ## # # ## ## ## # # # # # # # # # # ## ## ## # # ## ## # # # ## ## ## ## # # # # # # # # # # # # # ### # # ## ## ## # # # # # # # # # # ## ## ## # # ## ## ## # # # # # # # # # # ## ## ## # # ## ## # # # ## ## ## ## # # # # # # # # # # # # # ### # # ## ## ## # # # # # # # # # # ## ## ## # # ## ## ## # # # # # # # # # # ## ## ## # # ## ## # # # ## ## ## ## # # # # # # # # # # # # # ### # # ## ## ## # # # # # # # # # # ## ## ## # # ## ## ## # # # # # # # # # # ## ## ## # # ## ## # # # ## ## ## ## # # # # # # # # # # # # # ### # # ## ## ## # # # # # # # # # # ## ## ## # # ## ## ## # # # # # # # # # # ## ## ## # # ## ## # # # ## ## ## ## # # # # # # # # # # # # # ### # # ## ## ## # # # # # # # # # # ## ## ## # # ## ## ## # # # # # # # # # # ## ## ## # # ## ## # # # ## ## ## ## # # # # # # # # # # # # # ### # # ## ## ## # # # # # # # # # # ## ## ## # # ## ## ## # # # # # # # # # # ## ## ## # # ## ## # # # ## ## ## ## # # # # # # # # # # # # # ### # # ## ## ## # # # # # # # # # # ## ## ## # # ## ## ## # # # # # # # # # # ## ## ## # # ## ## # # # ## ## ## ## # # # # # # # # # # # # # ### # # ## ## ## # # # # # # # # # # ## ## ## # # ## ## ## # # # # # # # # # # ## ## ## # # ## ## # # # ## ## ## ## # # # # # # # # # # # # # ### # # ## ## ## # # # # # # # # # # ## ## ## # # ## ## ## # # # # # # # # # # ## ## ## # # ## ## # # # ## ## ## ## # # # # # # # # # # # # # ### # # ## ## ## # # # # # # # # # # ## ## ## # # ## ## ## # # # # # # # # # # ## ## ## # # ## ## # # # ## ## ## ## # # # # # # # # # # # # # ### # # ## ## ## # # # # # # # # # # ## ## ## # # ## ## ## # # # # # # # # # # ## ## ## # # ## ## # # # ## ## ## ## # # # # # # # # # # # # # ### # # ## ## ## # # # # # # # # # # ## ## ## # # ## ## ## # # # # # # # # # # ## ## ## # # ## ## # # # ## ## ## ## # # # # # # # # # # # # # ### # # ## ## ## # # # # # # # # # # ## ## ## # # ## ## ## # # # # # # # # # # ## ## ## # # ## ## # # # ## ## ## ## # # # # # # #四川 # # # # # # ### # # ## ## ## # # # # # # # # # # ## ## ## # # ## ## ## # # # # # # # # # # ## ## ## # # ## ## # # # ## ## ## ## # # # # # # # # # # # # # ### # # ## ## ## # ### ## # # # ## ## ## ## # # # # # # # # # # # # # ### # # ## ## ## # # # # # # # # # # ## ## ## # # ## ## ## # # # # # # # # # # ## ## ## # # ## #湖北# # # # ## ## ## ## # # # # # # # # # # # # # ### # # ## ## ## # # # # # # # # # # ## ## ## # # ## ## ## # # # # # # # # # # ## ## ## # # ## ## # # # ## ## ## ## # # # # # # # # # # # # # ### # # ## ## ## # # # # # # # # # # ## ## ## # # ## ## ## # # # # # # # # # # ## ## ## # # ## ## # # # ## ## ## ## # # # # # # # # # # # # # ### # # ## ## ## # # # # # # # # # # ## ## ## # # ## ## ## # # # # # # # # # # ## ## ## # # ## ## # # # ## ## ## ## # # # # # # # # # # # # # ### # # ## ## ## # # # # # # # # # # ## ## ## # # ## ## ## # # # # # # # # # # ## ## ## # # ## ## # # # ## ## ## ## # # # # # # # # # # # # # ### # # ## ## ## # # # # # # # # # # ## ## ## # # ## ## ## # # # # # # # # # # ## ## ## # # ## ## # # # ## ## ## ## # # # # # # # # # # # # # ### # # ## ## ## # ### ## # # # ## ## ## ## # # # # # # # # # # # # # ### # # ## ## ## # # # # # # # # # # ## ## ## # # ## ## ## # # # # # # # # # # ## ## ## # # ## ## # # # ## ## ## ## # # # # # # # # # # # # # ### # # ## ## ## # # # # # # # # # # ## ## ## # # ## ## ## # # # # # # # # # # ## ## ## # # ## #重庆# # # # ## ## ## ## # # # # # # # # # # # # # ### # # ## ## ## # # # # # # # # # # ## ## ## # # ## ## ## # # # # # # # # # # ## ## ## # # ## ## # # # ## ## ## ## # # # # # # # # # # # # # ### # # ## ## ## # # # # # # # # # # ## ## ## # # ## ## ## # # # # # # # # # # ## ## ## # # ## ## # # # ## ## ## ## # # # # # # # # # # # # # ### # # ## ## ## # # # # # # # # # # ## ## ## # # ## ## ## # # # # # # # # # # ## ## ## # # ## ## # # # ## ## ## ## # # # # # # # # # # # # # ### # # ## ## ## # # # # # # # # # ## ## ## ## ## ## ## ## # # # # # # # # ## ## ## ## ## ## # # # # ## ## ## ## # # # # # # # # # # # # # ### # # ## ## ## # # # # # # # # # # ## ## ## # # ## ## ## # # # # # # # # # # ## ## ## # ### #湖南湖南黄河汉江岷江嘉陵江10/25 第五届中国R语言会议北京2012 李欣海随机森林:分类DataLand Foot prec_ prec_ prec_ Nestuse x y Elev Aspect Slope Pop GDP t_ann t_jan t_july yearcover print ann jan july site1 107.505 33.392 984 0.67 29.6 21 42.0 20 2.95 845 6 153 12.4 0.3 24.0 1981 金家河1 107.548 33.409 1315 0.90 19.0 14 22.5 26 1.97 869 6 157 11.3 -0.6 22.7 1981 姚家沟1 107.505 33.392 984 0.67 29.6 21 42.0 20 2.95 845 6 153 12.4 0.3 24.0 1982 金家河1 107.548 33.409 1315 0.90 19.0 14 22.5 26 1.97 869 6 157 11.3 -0.6 22.7 1982 姚家沟1 107.505 33.392 984 0.67 29.6 21 42.0 20 2.95 845 6 153 12.4 0.3 24.0 1983 金家河1 107.548 33.409 1315 0.90 19.0 14 22.5 26 1.97 869 6 157 11.3 -0.6 22.7 1983 姚家沟1 107.548 33.409 1315 0.90 19.0 14 22.5 26 1.97 869 6 157 11.3 -0.6 22.7 1984 姚家沟1 107.405 33.406 1056 0.54 11.4 21 0.0 20 0.98 892 7 161 11.4 -0.5 22.9 1984 三岔河1 107.405 33.406 1056 0.54 11.4 21 0.0 20 0.98 892 7 161 11.4 -0.5 22.9 1985 三岔河1 107.548 33.409 1315 0.90 19.0 14 22.5 26 1.97 869 6 157 11.3 -0.6 22.7 1985 姚家沟0 107.400 32.780 980 0.46 42.1 11 45.8 14 1.78 927 6 170 13.0 1.3 24.0 0 3030 107.430 32.780 1553 0.97 29.6 14 171.8 32 4.76 887 5 162 13.0 1.3 24.0 0 3040 107.460 32.780 1534 0.51 25.7 14 12.7 14 1.78 886 5 162 14.0 2.15 25.2 0 3050 107.490 32.780 996 0.72 29.4 14 76.1 20 2.97 886 5 162 12.4 0.8 23.4 0 3060 107.520 32.780 1144 0.16 9.3 14 29.3 20 1.78 956 6 175 12.4 0.8 23.4 0 3070 107.550 32.780 915 0.91 20.7 11 214.7 20 5.95 956 6 175 11.6 0.15 22.5 0 3080 107.580 32.780 930 0.13 35.7 22 153.2 29 4.76 993 7 181 11.6 0.15 22.5 0 3090 107.610 32.780 873 0.40 31.9 11 66.4 29 2.97 931 6 171 12.7 1.1 23.8 0 3100 107.640 32.780 1147 0.50 35.5 11 46.8 20 2.38 1041 7 189 12.7 1.1 23.8 0 3110 107.670 32.780 1699 0.89 21.1 14 20.5 20 1.78 1060 8 192 10.4 -0.8 21.2 0 312tableibis$use ibis$use - as.factoribis$useibis$landcover - as.factoribis$landcover0 12538 560 11/25 第五届中国R 语言会议北京2012 李欣海随机森林:分类Multicollinearity is a painVariables in the two-principal-component space-50 0 50306530643018biplotprincompibis[,2:16], corT3017 2971 306330623060 2970306130582923 2969 2924 3016 y 3057 3059 3015 3056 30143013305530123010 30112968296329662967 30093005 2877 2922 2965 30542830 2964 3008 3006 3007292129622914 30192829 2876 30522919 2920 30533048 2960 3003 2961 3050 30013021 304929983000 3002 29593022 29173004 3051278329553020 2958 2957 2875282830472913291829993023290626892641 28272737 29732836 2784 2826 3046 2956 2874 2986 3033 2735 30442867 2690 2688 2915 30452975 2974 29163024 2789 2739 2788 2740 2642 2925 2972 3041 2869 28682927 2839 27362977 2793 2741 3037 29533025 2928 2820 2791 29103030 2832 2592 2995 2640 2994 2952 28592978 2881 2930 2879 3042 2863 3039 2909 29072983 3029 2880 2990 2992 2989 3036 3043 29542931 2834 2991 2884 2996 28622982 2981 3028 2985 2833 2993 3040 28722940 3032 2878 2883 2835 2882 2786 2787 2831 2873 26442976 2886 3035 2837 2785 2790 2951 2911 28252929 2870 26932926 2866 3034 2988 2864 2848 2782 2646 2871 2692 2745 29083027 2980 2943 2987 2847 2849 2912 2824 2742 2905 2823 29972942 2895 2865 2738 28613031 2984 2979 2941 2733 2840 2841 2643 2781 2744 2858 2645 2691 2896 2838 2647 2855 27432935 3026 2933 2893 2890 2892 2891 2894 2845 2794 2796 2792 2846 2746 2748 2695 2904 2747 2694 2545 3038 27002850 2851 2749 2795 2648 2696 2699 25962897 2842 2843 2798 2885 2556 25972934 293727012844 2797 2652 2697 28572887 2932 2800 2854 2598 2856 2650 2651 26982702 2550 2750 26492888 2947 2802 2751 2852 2654 2811 2853 2653 25902939 2945 2949 2753 27042711 2938 2946 2944 2706 2948 2779 2600 2780 2364 2602 2603 2317 2639 2898 2505 2601 2764 24662936 2552 2902 2551 2717 25082755 2503 2561 2549 2502 2734 25552761 2899 2900 2822 2606 2655 2703 2605 2752 2686 2608 2513 2821 2599 2801 2507 2414 2544 28602504 2950 25542889 2901 2803 2656 2799 2778 2687 2560 2510 260723712709 2558 2456 2609 2。
机器学习-R语言-随机森林-分类、回归、预测、筛选变量有史以来超详细解析(干货满满)

机器学习-R语⾔-随机森林-分类、回归、预测、筛选变量有史以来超详细解析(⼲货满满)R语⾔随机森林详细解析(基于randomforest包和varSelRF包)研究如何⽤R去实现随机森林也有三个⽉的时间了,从⼀开始的完全不理解,到现在的游刃有余,我似乎花了过多的时间,毕竟是初学者嘛。
不知各位有没有发现,CSDN上随机森林的教程都说的有些模糊,好像在刻意回避着什么,⽽且很少有⼈说变量筛选的问题。
所以,今⽇,我觉得有必要记录⼀下了。
随机森林基于R你即将从这⾥看到1.如何使⽤随机森林做回归、分类、预测、交叉验证2.如何评价模型效能(ROC、AUC)3.如何筛选变量在这⾥你不会看到1.长篇⼤段没有注释的代码2.故弄⽞虚,简单问题复杂化3.重复造轮⼦(本⽂以解决实际问题为主)分类与回归数据科学最基础的问题,分类与回归。
⽽随机森林做分类还是回归是取决于label是factor类型的还是numerical类型的1.导包⼀般需要四个包,如下,第⼀个是导⼊数据⽤的,第⼆个是随机森林包,第三个是筛选变量⽤的,第四个是绘制ROC曲线、计算AUC得分的包library(xlsx)library(randomForest)library(varSelRF)library(pROC)2.数据读取、缺失值处理读取数据,此数据是我做社会调查⾃⼰收集来的数据,各位可替换成鸢尾花数据集d<-read.xlsx('socialrecode2.xlsx',1)#这种直接引⽤⽂件名的写法请确保⽂件在⼯作空间内#参数1代表使⽤第⼀⾏作为列名d1<-na.omit(d) #删去缺失值,随机森林分类器内不能传⼊缺失值#如果⼿头没有待处理的数据,请使⽤鸢尾花数据集d1<-data(iris) #鸢尾花数据集是⽆缺失值的,故不需删去缺失值如果你的数据量不够多,但是⼜含有许多缺失值,建议使⽤randomforest包⾃带的缺失值填充函数:na.roughfix(object, …)按中位数或者模型进⾏填充3.训练模型在直觉上,似乎⼀⽚森林中决策树越多越好,但真的是这样吗?(此处有疑问不要紧,可参考⽂末原理部分)为了测试出多少棵树时模型是最优的,我们先试探性的⽤800棵树试⼀下,即第⼆部分的代码。
【原创】R语言线性回归,岭回归,决策树,随机森林数据挖掘分析报告(附代码数据)
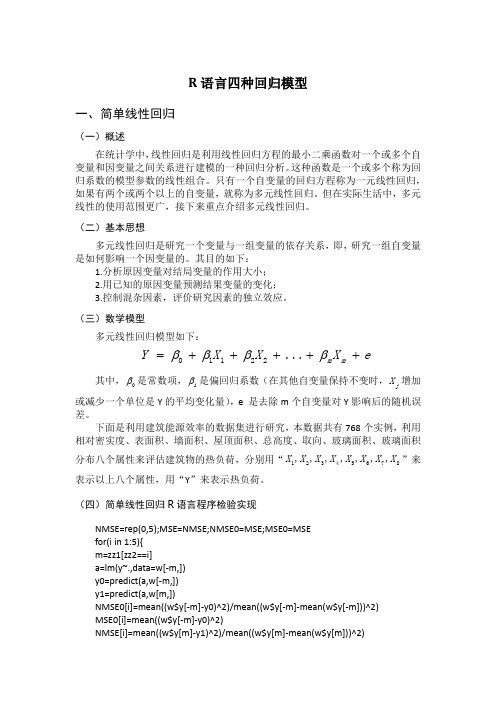
R 语言四种回归模型一、简单线性回归(一)概述在统计学中,线性回归是利用线性回归方程的最小二乘函数对一个或多个自变量和因变量之间关系进行建模的一种回归分析。
这种函数是一个或多个称为回归系数的模型参数的线性组合。
只有一个自变量的回归方程称为一元线性回归,如果有两个或两个以上的自变量,就称为多元线性回归。
但在实际生活中,多元线性的使用范围更广,接下来重点介绍多元线性回归。
(二)基本思想多元线性回归是研究一个变量与一组变量的依存关系,即,研究一组自变量是如何影响一个因变量的。
其目的如下:1.分析原因变量对结局变量的作用大小;2.用已知的原因变量预测结果变量的变化;3.控制混杂因素,评价研究因素的独立效应。
(三)数学模型多元线性回归模型如下:01122...m m Y X X X e ββββ=+++++其中,0β是常数项,i β是偏回归系数(在其他自变量保持不变时,j X 增加或减少一个单位是Y 的平均变化量),e 是去除m 个自变量对Y 影响后的随机误差。
下面是利用建筑能源效率的数据集进行研究,本数据共有768个实例,利用相对密实度、表面积、墙面积、屋顶面积、总高度、取向、玻璃面积、玻璃面积分布八个属性来评估建筑物的热负荷,分别用“12345678,,,,,,,X X X X X X X X ”来表示以上八个属性,用“Y ”来表示热负荷。
(四)简单线性回归R 语言程序检验实现NMSE=rep(0,5);MSE=NMSE;NMSE0=MSE;MSE0=MSE for(i in 1:5){m=zz1[zz2==i] a=lm(y~.,data=w[-m,]) y0=predict(a,w[-m,]) y1=predict(a,w[m,])NMSE0[i]=mean((w$y[-m]-y0)^2)/mean((w$y[-m]-mean(w$y[-m]))^2) MSE0[i]=mean((w$y[-m]-y0)^2)NMSE[i]=mean((w$y[m]-y1)^2)/mean((w$y[m]-mean(w$y[m]))^2)MSE[i]=mean((w$y[m]-y1)^2)}(MMSE0=mean(MSE0));(MNMSE0=mean(NMSE0)) [1] 8.502939 [1] 0.08364299(MMSE=mean(MSE));(MNMSE=mean(NMSE)) [1] 8.673251 [1] 0.08564455由输出结果可知,多元线性回归训练集的均方误差为8.502939,标准化的均方误差为0.08364299,测试集的均方误差为8.673251,标准化的均方误差为0.08564455。
粒子群 随机森林 r语言
粒子群随机森林 r语言
粒子群(particle swarm)是一种进化算法,通过模拟鸟群或鱼群等群体的行为,通过个体间信息的传递和最优解的更新,来寻找最优解或近似最优解。
在粒子群算法中,个体被称为“粒子”,每个粒子都有自己的位置和速度,并根据自身的局部最优解和全局最优解等信息,来更新自己的位置和速度。
随机森林(random forest)是一种集成学习方法,它通过组合多个分类或回归树模型来进行预测。
随机森林中的每个树都是独立构建的,通过随机选择输入特征和样本的子集来增加模型的多样性。
随机森林通过投票或取平均值的方式来进行最终的预测。
R语言是一种用于统计计算和图形化的编程语言,它在统计学和数据分析领域非常流行。
R语言提供了丰富的统计和机器学习的函数库,可以方便地实现粒子群和随机森林算法。
例如,R语言中可以使用“PSO”包来实现粒子群算法,使用“randomForest”包来实现随机森林算法。
随机森林算法介绍及R语言实现
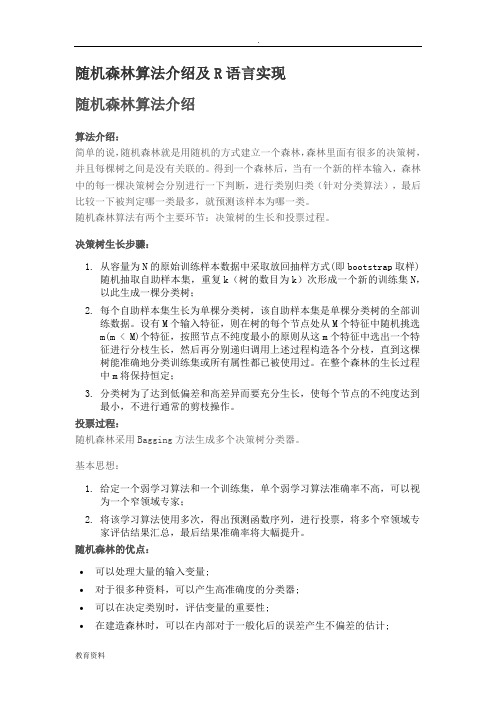
随机森林算法介绍及R语言实现随机森林算法介绍算法介绍:简单的说,随机森林就是用随机的方式建立一个森林,森林里面有很多的决策树,并且每棵树之间是没有关联的。
得到一个森林后,当有一个新的样本输入,森林中的每一棵决策树会分别进行一下判断,进行类别归类(针对分类算法),最后比较一下被判定哪一类最多,就预测该样本为哪一类。
随机森林算法有两个主要环节:决策树的生长和投票过程。
决策树生长步骤:1.从容量为N的原始训练样本数据中采取放回抽样方式(即bootstrap取样)随机抽取自助样本集,重复k(树的数目为k)次形成一个新的训练集N,以此生成一棵分类树;2.每个自助样本集生长为单棵分类树,该自助样本集是单棵分类树的全部训练数据。
设有M个输入特征,则在树的每个节点处从M个特征中随机挑选m(m < M)个特征,按照节点不纯度最小的原则从这m个特征中选出一个特征进行分枝生长,然后再分别递归调用上述过程构造各个分枝,直到这棵树能准确地分类训练集或所有属性都已被使用过。
在整个森林的生长过程中m将保持恒定;3.分类树为了达到低偏差和高差异而要充分生长,使每个节点的不纯度达到最小,不进行通常的剪枝操作。
投票过程:随机森林采用Bagging方法生成多个决策树分类器。
基本思想:1.给定一个弱学习算法和一个训练集,单个弱学习算法准确率不高,可以视为一个窄领域专家;2.将该学习算法使用多次,得出预测函数序列,进行投票,将多个窄领域专家评估结果汇总,最后结果准确率将大幅提升。
随机森林的优点:∙可以处理大量的输入变量;∙对于很多种资料,可以产生高准确度的分类器;∙可以在决定类别时,评估变量的重要性;∙在建造森林时,可以在内部对于一般化后的误差产生不偏差的估计;∙包含一个好方法可以估计遗失的资料,并且,如果有很大一部分的资料遗失,仍可以维持准确度;∙提供一个实验方法,可以去侦测 variable interactions;∙对于不平衡的分类资料集来说,可以平衡误差;∙计算各例中的亲近度,对于数据挖掘、侦测偏离者(outlier)和将资料视觉化非常有用;∙使用上述。
用R实现随机森林的分类与回归

用R实现随机森林的分类与回归第五届中国R语言会议北京2012 李欣海用R实现随机森林的分类与回归Applications of Random Forest using RClassification and Regression李欣海中科院动物所邮件:lixh@//0>.主页:////.博客:////.微博:////. 第五届中国R语言会议北京2012 李欣海随机森林简介Random Forest////.an-introduction-to-data-mining-for-marketing-and-business-intelli gence/Random Forest is an ensemble classifier thatconsists of many decision trees It outputs the class that is the mode of the class'soutput by individual trees Breiman 2001 It deals with “small n large p”-problems, high-orderinteractions, correlated predictor variables.Breiman, L. 2001. Random forests. Machine Learning 45:5-32. Being cited 6500 times until 20123/25 第五届中国R语言会议北京2012 李欣海随机森林简介History////.an-introduction-to-data-mining-for-marketing-and-business-intelli gence/The algorithm for inducing a random forest was developed byLeo Breiman 2001 and Adele Cutler, and "Random Forests" istheir trademarkThe term came from random decision forests that was firstproposed by Tin Kam Ho of Bell Labs in 1995The method combines Breiman's "bagging" idea and therandom selection of features, introduced independently by Ho1995 and Amit and Geman 1997 in order to construct acollection of decision trees with controlled variation.4/25 第五届中国R语言会议北京2012 李欣海随机森林简介Tree modelsy β + β x + β x + β x + εi 0 1 1i 2 2 i 3 3i iClassification treeRegression treeCrawley 2007 The R Book p691 Crawley 2007 The R Book p6945/25 第五届中国R语言会议北京2012 李欣海随机森林简介The statistical community uses irrelevant theory,questionable conclusions?David R. Cox Emanuel Parzen Bruce HoadleyBrad EfronNO YES6/25 第五届中国R语言会议北京2012 李欣海随机森林简介Ensemble classifiers////.Tree models are simple, often produce noisy bushy or weakstunted classifiers Bagging Breiman, 1996: Fit many large trees to bootstrap-resampled versions of the training data, and classify by majority vote Boosting Freund & Shapire, 1996: Fit many large or small trees to reweighted versions of the training data. Classify by weighted majority vote Random Forests Breiman 1999: Fancier version of bagging.In general Boosting Random Forests Bagging Single TreeTrevor Hastie.7/25 第五届中国R语言会议北京2012 李欣海随机森林简介How Random Forest Works////.At each tree split, a random sample of m features is drawn, and only those m features are considered for splittingTypically m sqrtp or logp, where p is the number offeatures For each tree grown on a bootstrap sample, the error rate for observations left out of the bootstrap sample ismonitored. This is called the out-of-bag OOB error rate Random forests tries to improve on bagging by “de-correlating” the trees. Each tree has the same expectation.Trevor Hastie, p21 in Trees, Bagging, Random Forests and Boosting8/25 第五届中国R语言会议北京2012 李欣海随机森林简介R PackagesrandomForest randomForestTitle: Breiman and Cutler’s random forests for classification and regressionVersion: 4.6-6Date: 2012-01-06Author:Fortran original by Leo Breiman and Adele Cutler, R port by Andy Liawand Matthew Wiener.Implementation based on CART trees for variables of different types.Biased in favor of continuous variables and variables with many categories.partycforestBased on unbiased conditional inference trees.For variables of different types: unbiased when subsampling.黄河渭河9/25 第五届中国R语言会议北京2012 李欣海随机森林:分类# # # # ## ## ## ## # # # # # # # # # # # # # ### # # ## ## ## # # # # # # # # # # ## ## ## # # ## ## ## # # # # # # # # # # ## ## ## # # ## ## # # # ## ## ## ## # # # # # # # # # # # # # ### # # ## ## ## # # # # # # # # # # ## ## ## # # ## ## ## # # # # # # # # # # ## ## ## # # ## ## # # # ## ## ## ## # # # # # # # # # # # # # ### # # ## ## ## # # # # # # # # # # ## ## ## # # ## ## ## # # # # # # # # # # ## ## ## # # ## ## # # # ## ## ## ## # # # # # # # # # # # # # ### # # ## ## ## # # # # # # # # # # ## ## ## # # ## ## ## # # # # # # # # # # ## ## ## # # ## ## # # # ## ## ## ## # # # # # # # # # # # # # ### # # ## ## ## # # # # # # # # # # ## ## ## # # ## ## ## # # # # # # # # # # ## ## ## # # ## ## # # # ## ## ## ## # # # # # # # # # # # # # ### # # ## ## ## # # # # # # # # # # ## ## ## # # ## ## ## # # # # # # # # # # ## ## ## # # ## ## # # # ## ## ## ## # # # # # # # # # # # # # ### # # ## ## ## # # # # # # # # # # ## ## ## # # ## ## ## # # # # # # # # # # ## ## ## # # ## #宁夏# # # # ## ## ## ## # # # # # # # # # # # # # ### # # ## ## ## # # # # # # # # # # ## ## ## # # ## ## ## # # # # # # # # # # ## ## ## # # ## #青海# # # # ## ## ## ## # # # # # # # # # # # # # ### # # ## ## ## # # # # # # # # # # ## ## ## # # ## ## ## # # # # # # # # # # ## ## ## # # ## ## # # # ## ## ## ## # # # # # # # # # # # # # ### # # ## ## ## # # # # # # # # # # ## ## ## # # ## ## ## # # # # # # # # # # ## ## ## # # ## #朱?的分布# # # # ## ## ## ## # # # # # # # # # # # # # ### # # ## ## ## # ### ## # # # ## ## ## ## # # # # # # # # # # # # # ### # # ## ## ## # # # # # # # # # # ## ## ## # # ## ## ## # # # # # # # # # # ## ## ## # # ## #山西# # # # ## ## ## ## # # # # # # # # # # # # # ### # # ## ## ## # # # # # # # # # # ## ## ## # # ## ## ## # # # # # # # # # # ## ## ## # # ## ## # # # ## ## ## ## # # # # # # # # # # # # # ### # # ## ## ## # # # # # # # # # # ## ## ## # # ## ## ## # # # # # # # # # # ## ## ## # # ## ## # # # ## ## ## ## # # # # # # # # # # # # # ### # # ## ## ## # # # # # # # # # # ## ## ## # # ## ## ## # # # # # # # # # # ## ## ## # # ## ## # # # ## ## ## ## # # # # # # # # # # # # # ### # # ## ## ## # # # # # # # # # # ## ## ## # # ## ## ## # # # # # # # # # # ## ## ## # # ## ## # # # ## ## ## ## # # # # # # # # # # # # # ### # # ## ## ## # # # # # # # # # # ## ## ## # # ## ## ## # # # # # # # # # # ## ## ## # # ## ## # # # ## ## ## ## # # # # # # # # # # # # # ### # # ## ## ## # ### ## # # # ## ## ## ## # # # # # # # # # # # # # ### # # ## ## ## # # # # # # # # # # ## ## ## # # ## ## ## # # # # # # # # # # ## ## ## # # ## ## # # # ## ## ## ## # # # # # # # # # # # # # ### # # ## ## ## # # # # # # # # # # ## ## ## # # ## ## ## # # # # # # # # # # ## ## ## # # ## ## # # # ## ## ## ## # # # # # # # # # # # # # ### # # ## ## ## # # # # # # # # # # ## ## ## # # ## ## ## # # # # # # # # # # ## ## ## # # ## ## # # # ## ## ## ## # # # # # # # # # # # # # ### # # ## ## ## # # # # # # # # # # ## ## ## # # ## ## ## # # # # # # # # # # ## ## ## # # ## ## # # # ## ## ## ## # # # # # # # # # # # # # ### # # ## ## ## # # # # # # # # # # ## ## ## # # ## ## ## # # # # # # # # # # ## ## ## # # ## #甘肃# # # # ## ## ## ## # # # # # # # # # # # # # ### # # ## ## ## # # # # # # # # # # ## ## ## # # ## ## ## # # # # # # # # # # ## ## ## # # ## ## # # # ## ## ## ## # # # # # # # # # # # # # ### # # ## ## ## # ### ## # # # ## ## ## ## # # # # # # # # # # # # # ### # # ## ## ## # # # # # # # # # # ## ## ## # # ## ## ## # # # # # # # # # # ## ## ## # # ## ## # # # ## ## ## ## # # # # # # # # # # # # # ### # # ## ## ## # # # # # # # # # # ## ## ## # # ## ## ## # # # # # # # # # # ## ## ## # # ## ## # # # ## ## ## ## # # # # # # # # # # # # # ### # # ## ## ## # # # # # # # # # # ## ## ## # # ## ## ## # # # # # # # # # # ## ## ## # # ## ## # # # ## ## ## ## # # # # # # # # # # # # # ### # # ## ## ## # # # # # # # # # # ## ## ## # # ## ## ## # # # # # # # # # # ## ## ## # # ## ## # # # ## ## ## ## # # # # # # # # # # # # # ### # # ## ## ## # # # # # # # # # # ## ## ## # # ## ## ## # # # # # # # # # # ## ## ## # # ## ## # # # ## ## ## ## # # # # # # # # # # # # # ### # # ## ## ## # # # # # # # # # # ## ## ## # #陕西 ## ## ## # # # # # # # # # # ## ## ## # # ## ##### # # # ## ## ## ## # # # # # # # # # # # # # ### # # ## ## ## # ### #河南## # # # ## ## ## ## # # # # # # # # # # # # # ### # # ## ## ## # # # # # # # # # # ## ## ## # # ## ## ## # # # # # # # # # # ## ## ## # # ## ## # # # ## ## ## ## # # # # # # # # # # # # # ### # # ## ## ## # # # # # # # # # # ## ## ## # # ## ## ## # # # # # # # # # # ## ## ## # # ## ### # # # ## ## ## ## # # # # # # # # # # # # # ### # # ## ## ## # # # # # # # # # # ## ## ## # # ## ## ## # # # # # # # # # # ## ## ## # # ## ############ # # # ## ## ## ## # # # # # # # # # # # # # ### # # ## ## ## # # # # # # # # # # ## ## ## # # ## ## ## # # # # # # # # # # ## ## ## # # ## ### # # # ## ## ## ## # # # # # # # # # # # # # ### # # ## ## ## # # # # # # # # # #### ## ## # # ## ## ## # # # # # # # # # # ## ## ## # # ## ######### ## ######## ######## ### #### ### ## ######## ## ############################ ####### ########## ## #### #### #### ## ### # # # ## ## ## ## # # # # # # # # # # # # # ### # # ## ## ## # # # # # # # ### ## ################## ## #### ######## ## ######### ###### ####### ## # ## ## # # ## ## ## # # # # # # # # # # ## ## ## # # ## # ## #### ## ## #### ### ## #### ## # # ## # ##### ## ## ########### #### ##### ## ## ############ ######## ### ## ##### ###### # # # ## ## ## ## # # # # # # # # # # # # # ### # # ## ## ## # # # # # # # ##### #### ## ## # # ## ## ## # # # # # # # # # # ## ## ## # # ## ###### #### ## ## ##### ##### # # # ## ## ## ## # # # # # # # # # # # # # ### # # ## ## ## # # # # # # # # ######### ## ## # # ## ## ## # # # # # # # # # # ## ## ## # # ## ######## # # # ## ## ## ## # # # # # # # # # # # # # ### # # ## ## ## # # # # # # # # # # ## ## ## # # ## ## ## # # # # # # # # # # ## ## ## # # ## ### ###### # # # ## ## ## ## # # # # # # # # # # # # # ### # # ## ## ## # # # # # # # # # # ## ## ## # # ## ## ## # # # # # # # # # # ## ## ## # # ## ## # # # ## ## ## ## # # # # # # # # # # # # # ### # # ## ## ## # # # # # # # # # # ## ## ## # # ## ## ## # # # # # # # # # # ## ## ## # # ## ## # # # ## ## ## ## # # # # # # # # # # # # # ### # # ## ## ## # # # # # # # # # # ## ## ## # # ## ## ## # # # # # # # # # # ## ## ## # # ## ## # # # ## ## ## ## # # # # # # # # # # # # # ### # # ## ## ## # # # # # # # # # # ## ## ## # # ## ## ## # # # # # # # # # # ## ## ## # # ## ## # # # ## ## ## ## # # # # # # # # # # # # # ### # # ## ## ## # # # # # # # # # # ## ## ## # # ## ## ## # # # # # # # # # # ## ## ## # # ## ## # # # ## ## ## ## # # # # # # # # # # # # # ### # # ## ## ## # # # # # # # # # # ## ## ## # # ## ## ## # # # # # # # # # # ## ## ## # # ## ## # # # ## ## ## ## # # # # # # # # # # # # # ### # # ## ## ## # # # # # # # # # # ## ## ## # # ## ## ## # # # # # # # # # # ## ## ## # # ## ## # # # ## ## ## ## # # # # # # # # # # # # # ### # # ## ## ## # # # # # # # # # # ## ## ## # # ## ## ## # # # # # # # # # # ## ## ## # # ## ## # # # ## ## ## ## # # # # # # # # # # # # # ### # # ## ## ## # # # # # # # # # # ## ## ## # # ## ## ## # # # # # # # # # # ## ## ## # # ## ## # # # ## ## ## ## # # # # # # # # # # # # # ### # # ## ## ## # # # # # # # # # # ## ## ## # # ## ## ## # # # # # # # # # # ## ## ## # # ## ## # # # ## ## ## ## # # # # # # # # # # # # # ### # # ## ## ## # # # # # # # # # # ## ## ## # # ## ## ## # # # # # # # # # # ## ## ## # # ## ## # # # ## ## ## ## # # # # # # # # # # # # # ### # # ## ## ## # # # # # # # # # # ## ## ## # # ## ## ## # # # # # # # # # # ## ## ## # # ## ## # # # ## ## ## ## # # # # # # # # # # # # # ### # # ## ## ## # # # # # # # # # # ## ## ## # # ## ## ## # # # # # # # # # # ## ## ## # # ## ## # # # ## ## ## ## # # # # # # # # # # # # # ### # # ## ## ## # # # # # # # # # # ## ## ## # # ## ## ## # # # # # # # # # # ## ## ## # # ## ## # # # ## ## ## ## # # # # # # #四川 # # # # # # ### # # ## ## ## # # # # # # # # # # ## ## ## # # ## ## ## # # # # # # # # # # ## ## ## # # ## ## # # # ## ## ## ## # # # # # # # # # # # # # ### # # ## ## ## # ### ## # # # ## ## ## ## # # # # # # # # # # # # # ### # # ## ## ## # # # # # # # # # # ## ## ## # # ## ## ## # # # # # # # # # # ## ## ## # # ## #湖北# # # # ## ## ## ## # # # # # # # # # # # # # ### # # ## ## ## # # # # # # # # # # ## ## ## # # ## ## ## # # # # # # # # # # ## ## ## # # ## ## # # # ## ## ## ## # # # # # # # # # # # # # ### # # ## ## ## # # # # # # # # # # ## ## ## # # ## ## ## # # # # # # # # # # ## ## ## # # ## ## # # # ## ## ## ## # # # # # # # # # # # # # ### # # ## ## ## # # # # # # # # # # ## ## ## # # ## ## ## # # # # # # # # # # ## ## ## # # ## ## # # # ## ## ## ## # # # # # # # # # # # # # ### # # ## ## ## # # # # # # # # # # ## ## ## # # ## ## ## # # # # # # # # # # ## ## ## # # ## ## # # # ## ## ## ## # # # # # # # # # # # # # ### # # ## ## ## # # # # # # # # # # ## ## ## # # ## ## ## # # # # # # # # # # ## ## ## # # ## ## # # # ## ## ## ## # # # # # # # # # # # # # ### # # ## ## ## # ### ## # # # ## ## ## ## # # # # # # # # # # # # # ### # # ## ## ## # # # # # # # # # # ## ## ## # # ## ## ## # # # # # # # # # # ## ## ## # # ## ## # # # ## ## ## ## # # # # # # # # # # # # # ### # # ## ## ## # # # # # # # # # # ## ## ## # # ## ## ## # # # # # # # # # # ## ## ## # # ## #重庆# # # # ## ## ## ## # # # # # # # # # # # # # ### # # ## ## ## # # # # # # # # # # ## ## ## # # ## ## ## # # # # # # # # # # ## ## ## # # ## ## # # # ## ## ## ## # # # # # # # # # # # # # ### # # ## ## ## # # # # # # # # # # ## ## ## # # ## ## ## # # # # # # # # # # ## ## ## # # ## ## # # # ## ## ## ## # # # # # # # # # # # # # ### # # ## ## ## # # # # # # # # # # ## ## ## # # ## ## ## # # # # # # # # # # ## ## ## # # ## ## # # # ## ## ## ## # # # # # # # # # # # # # ### # # ## ## ## # # # # # # # # # ## ## ## ## ## ## ## ## # # # # # # # # ## ## ## ## ## ## # # # # ## ## ## ## # # # # # # # # # # # # # ### # # ## ## ## # # # # # # # # # # ## ## ## # # ## ## ## # # # # # # # # # # ## ## ## # ### #湖南湖南黄河汉江岷江嘉陵江10/25 第五届中国R语言会议北京2012 李欣海随机森林:分类DataLand Foot prec_ prec_ prec_ Nestuse x y Elev Aspect Slope Pop GDP t_ann t_jan t_july yearcover print ann jan july site1 107.505 33.392 984 0.67 29.6 21 42.0 20 2.95 845 6 153 12.4 0.3 24.0 1981 金家河1 107.548 33.409 1315 0.90 19.0 14 22.5 26 1.97 869 6 157 11.3 -0.6 22.7 1981 姚家沟1 107.505 33.392 984 0.67 29.6 21 42.0 20 2.95 845 6 153 12.4 0.3 24.0 1982 金家河1 107.548 33.409 1315 0.90 19.0 14 22.5 26 1.97 869 6 157 11.3 -0.6 22.7 1982 姚家沟1 107.505 33.392 984 0.67 29.6 21 42.0 20 2.95 845 6 153 12.4 0.3 24.0 1983 金家河1 107.548 33.409 1315 0.90 19.0 14 22.5 26 1.97 869 6 157 11.3 -0.6 22.7 1983 姚家沟1 107.548 33.409 1315 0.90 19.0 14 22.5 26 1.97 869 6 157 11.3 -0.6 22.7 1984 姚家沟1 107.405 33.406 1056 0.54 11.4 21 0.0 20 0.98 892 7 161 11.4 -0.5 22.9 1984 三岔河1 107.405 33.406 1056 0.54 11.4 21 0.0 20 0.98 892 7 161 11.4 -0.5 22.9 1985 三岔河1 107.548 33.409 1315 0.90 19.0 14 22.5 26 1.97 869 6 157 11.3 -0.6 22.7 1985 姚家沟0 107.400 32.780 980 0.46 42.1 11 45.8 14 1.78 927 6 170 13.0 1.3 24.0 0 3030 107.430 32.780 1553 0.97 29.6 14 171.8 32 4.76 887 5 162 13.0 1.3 24.0 0 3040 107.460 32.780 1534 0.51 25.7 14 12.7 14 1.78 886 5 162 14.0 2.15 25.2 0 3050 107.490 32.780 996 0.72 29.4 14 76.1 20 2.97 886 5 162 12.4 0.8 23.4 0 3060 107.520 32.780 1144 0.16 9.3 14 29.3 20 1.78 956 6 175 12.4 0.8 23.4 0 3070 107.550 32.780 915 0.91 20.7 11 214.7 20 5.95 956 6 175 11.6 0.15 22.5 0 3080 107.580 32.780 930 0.13 35.7 22 153.2 29 4.76 993 7 181 11.6 0.15 22.5 0 3090 107.610 32.780 873 0.40 31.9 11 66.4 29 2.97 931 6 171 12.7 1.1 23.8 0 3100 107.640 32.780 1147 0.50 35.5 11 46.8 20 2.38 1041 7 189 12.7 1.1 23.8 0 3110 107.670 32.780 1699 0.89 21.1 14 20.5 20 1.78 1060 8 192 10.4 -0.8 21.2 0 312tableibis$use ibis$use - as.factoribis$useibis$landcover - as.factoribis$landcover0 12538 560 11/25 第五届中国R 语言会议北京2012 李欣海随机森林:分类Multicollinearity is a painVariables in the two-principal-component space-50 0 50306530643018biplotprincompibis[,2:16], corT3017 2971 306330623060 2970306130582923 2969 2924 3016 y 3057 3059 3015 3056 30143013305530123010 30112968296329662967 30093005 2877 2922 2965 30542830 2964 3008 3006 3007292129622914 30192829 2876 30522919 2920 30533048 2960 3003 2961 3050 30013021 304929983000 3002 29593022 29173004 3051278329553020 2958 2957 2875282830472913291829993023290626892641 28272737 29732836 2784 2826 3046 2956 2874 2986 3033 2735 30442867 2690 2688 2915 30452975 2974 29163024 2789 2739 2788 2740 2642 2925 2972 3041 2869 28682927 2839 27362977 2793 2741 3037 29533025 2928 2820 2791 29103030 2832 2592 2995 2640 2994 2952 28592978 2881 2930 2879 3042 2863 3039 2909 29072983 3029 2880 2990 2992 2989 3036 3043 29542931 2834 2991 2884 2996 28622982 2981 3028 2985 2833 2993 3040 28722940 3032 2878 2883 2835 2882 2786 2787 2831 2873 26442976 2886 3035 2837 2785 2790 2951 2911 28252929 2870 26932926 2866 3034 2988 2864 2848 2782 2646 2871 2692 2745 29083027 2980 2943 2987 2847 2849 2912 2824 2742 2905 2823 29972942 2895 2865 2738 28613031 2984 2979 2941 2733 2840 2841 2643 2781 2744 2858 2645 2691 2896 2838 2647 2855 27432935 3026 2933 2893 2890 2892 2891 2894 2845 2794 2796 2792 2846 2746 2748 2695 2904 2747 2694 2545 3038 27002850 2851 2749 2795 2648 2696 2699 25962897 2842 2843 2798 2885 2556 25972934 293727012844 2797 2652 2697 28572887 2932 2800 2854 2598 2856 2650 2651 26982702 2550 2750 26492888 2947 2802 2751 2852 2654 2811 2853 2653 25902939 2945 2949 2753 27042711 2938 2946 2944 2706 2948 2779 2600 2780 2364 2602 2603 2317 2639 2898 2505 2601 2764 24662936 2552 2902 2551 2717 25082755 2503 2561 2549 2502 2734 25552761 2899 2900 2822 2606 2655 2703 2605 2752 2686 2608 2513 2821 2599 2801 2507 2414 2544 28602504 2950 25542889 2901 2803 2656 2799 2778 2687 2560 2510 260723712709 2558 2456 2609 2。
R语言实现随机森林的方法示例
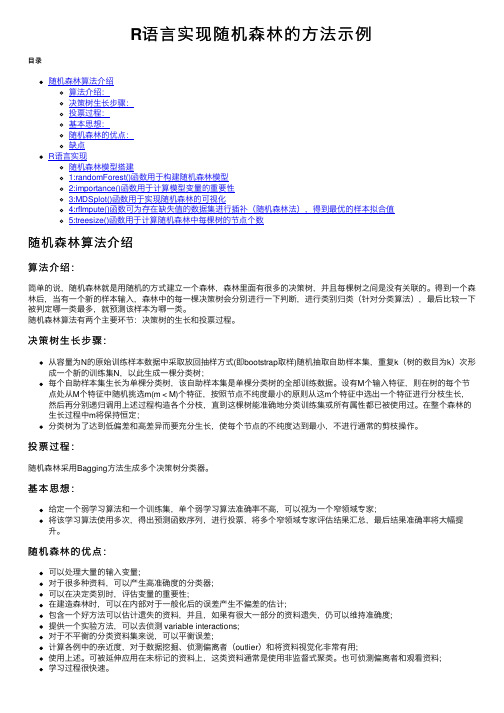
R语⾔实现随机森林的⽅法⽰例⽬录随机森林算法介绍算法介绍:决策树⽣长步骤:投票过程:基本思想:随机森林的优点:缺点R语⾔实现随机森林模型搭建1:randomForest()函数⽤于构建随机森林模型2:importance()函数⽤于计算模型变量的重要性3:MDSplot()函数⽤于实现随机森林的可视化4:rfImpute()函数可为存在缺失值的数据集进⾏插补(随机森林法),得到最优的样本拟合值5:treesize()函数⽤于计算随机森林中每棵树的节点个数随机森林算法介绍算法介绍:简单的说,随机森林就是⽤随机的⽅式建⽴⼀个森林,森林⾥⾯有很多的决策树,并且每棵树之间是没有关联的。
得到⼀个森林后,当有⼀个新的样本输⼊,森林中的每⼀棵决策树会分别进⾏⼀下判断,进⾏类别归类(针对分类算法),最后⽐较⼀下被判定哪⼀类最多,就预测该样本为哪⼀类。
随机森林算法有两个主要环节:决策树的⽣长和投票过程。
决策树⽣长步骤:从容量为N的原始训练样本数据中采取放回抽样⽅式(即bootstrap取样)随机抽取⾃助样本集,重复k(树的数⽬为k)次形成⼀个新的训练集N,以此⽣成⼀棵分类树;每个⾃助样本集⽣长为单棵分类树,该⾃助样本集是单棵分类树的全部训练数据。
设有M个输⼊特征,则在树的每个节点处从M个特征中随机挑选m(m < M)个特征,按照节点不纯度最⼩的原则从这m个特征中选出⼀个特征进⾏分枝⽣长,然后再分别递归调⽤上述过程构造各个分枝,直到这棵树能准确地分类训练集或所有属性都已被使⽤过。
在整个森林的⽣长过程中m将保持恒定;分类树为了达到低偏差和⾼差异⽽要充分⽣长,使每个节点的不纯度达到最⼩,不进⾏通常的剪枝操作。
投票过程:随机森林采⽤Bagging⽅法⽣成多个决策树分类器。
基本思想:给定⼀个弱学习算法和⼀个训练集,单个弱学习算法准确率不⾼,可以视为⼀个窄领域专家;将该学习算法使⽤多次,得出预测函数序列,进⾏投票,将多个窄领域专家评估结果汇总,最后结果准确率将⼤幅提升。
森林图-R语言代码-(含备注-附练习数据)
森林图R语言代码(含备注,附练习数据)#代码install.packages("forestplot")library(forestplot)library(readr)#从本地导入forest.csv数据,命名成mydatamydata<-read_csv("csv格式的文件路径")#例如:mydata<-read_csv("C:/Users/Lenovo/Desktop/data.csv")#定义表头row_name<-cbind(c("Subgroups",mydata$Subgroups),c("No. of. patients",mydata$`No. of patients`),c("OR 95%CI.",mydata$`OR(95% CI)`))#增加一行mydata<-rbind(rep(NA,3),mydata)#查看数据View(mydata)forestplot(labeltext=row_name,#设置用于文本展示的列,此处我们用数据的前三列作为文本,在图中展示mydata[,c("OR","LL","UL")],zero=1,#设置参照值,此处我们展示的是OR值,故参照值是1xlog=T,#对数x轴xticks=c(0.5,1.0,2.0,4.0),#x轴刻度boxsize=0.1,#设置点估计的方形大小lineheight=unit(10,'mm'),#设置图形中的行距colgap=unit(3,'mm'),#设置图形中的列间距lwd.zero=2,#设置参考线的粗细lwd.ci=1.5,#设置区间估计线的粗细col=fpColors(box='black',summary="black",lines='black',zero='red'),#使用fpColors()函数定义图形元素的颜色,从左至右分别对应点估计方形,汇总值,区间估计线,参考线xlab="Odd Ratios",#设置x轴标签lwd.xaxis=2,#设置x轴粗细graph.pos=3,#设置森林图的位置,此处设置为3,则出现在第三列is.summary=c(T,F,T,F,F,T,F,F,T,F,F))#该参数接受一个逻辑向量,用于定义数据中的每一行是否汇总值,若是,则在对应位置设置TRUE,若否,则设置为FALSE,设置为TRUE的行则以粗体出现library(ggplot2)forestplot(labeltext=row_name,mydata[,c("OR","LL","UL")],zero=1,xlog=F,xticks=c(0.5,1.0,2.0,4.0),boxsize=0.1,lineheight=unit(10,'mm'),colgap=unit(3,'mm'),lwd.zero=2,lwd.ci=1.5,col=fpColors(box='black',summary="black",lines='black',zero='red'),xlab="Odd Ratios",lwd.xaxis=2,graph.pos=3,axis.text.x = element_text(size =20,family="TNM"),#–x坐标轴axis.text.y = element_text(size=20,family="TNM"),#–y轴legend.title = element_text(size=20,family="TNM"),legend.text = element_text(size =20,family="TNM"),is.summary=c(T,F,T,F,F,T,F,F,T,F,F))附件:练习数据。
R语言实现随机森林
R语⾔实现随机森林R语⾔实现随机森林install.packages("pacman")install.packages("caret")install.packages("pROC")install.packages()install.packages("randomForest")library(randomForest)library(ggplot2)library(lattice)library(pacman)library(caret)library(pROC)library(rpart)data(iris)dim(iris)trainlist<-createDataPartition(iris$Species,p=0.7,list=FALSE)#取出百分之七⼗的iris数据trainset<-iris[trainlist,]testset<-iris[-trainlist,]#⼀部分分成训练集,另⼀部分则为测试集set.seed(2000)#⽣成2000个随机数rf.train<-randomForest(as.factor(Species)~.,data=trainset,importance=TRUE,na.action = na.pass)#因变量是Species,.表⽰其他都为⾃变量,数据来⾃trainset#importance表⽰随机森林需要给出每⼀个变量重要性的排序#na.action表⽰如何处理缺失值plot(rf.train,main = "randomforest")#画图,main表⽰设置标题#三种颜⾊代表三种鸢尾花,⿊⾊代表三种鸢尾花平均值#横轴是决策树的数⽬,纵轴是误差数rf.test<-predict(rf.train,newdata = testset,type = "class")rf.testrf.cf<-caret::confusionMatrix(as.factor(rf.test),as.factor(testset$Species))rf.test2<-predict(rf.train,newdata = testset,type="prob")roc.rf<-multiclass.roc(testset$Species,rf.test2)fit1=rpart(Species~.,data=trainset)pre2=predict(fit1,testset,type="prob")roc1<-multiclass.roc(testset$Species,pre2[,1])plot(roc1$rocs[[1]],col="red")plot(roc1$rocs[[3]],add=TRUE,col="green")#画出roc曲线,显⽰预测效果。
R语言随机森林模型

training <-read.csv("D:\\bank.csv")/导入数据/
ind<-sample(2,nrow(training),replace=TRUE,prob=c(0.7,0.3))/对数据分成两部分,70%训练数据,30%检测数据/
traindata<- training [ind==1,]
在机器学习中随机森林是一个包含多个决策树的分类器并且其输出的类别是由个别树输出的类别的众数而定
R语言随机森林模型
在机器学习中,随机森林是一个包含多个决策树的分类器, 并且其输出的类别是由个别树输出的类别的众数而定。
r语言代码:
library(randomForest)/安装随机森林程序包/
library(foreign)
testdata<- training [ind==2,]
rf <- randomForest(y ~ ., data=training, ntree=100, proximity=TRUE)/y是因变量/
table(predict(rf), training$y)
print(rf)
plot
【原创】R语言决策树、随机森林案例报告附代码数据
【原创】R语⾔决策树、随机森林案例报告附代码数据决策树随机森林决策树是⼀种简单、常⽤的基础模型。
之所以说它简单,不仅因为它的思想原理简单具体、贴近实际,它并不需要像线性回归模型⼀样⽤⼀个数学公式来表征,⽽是由规则来抽象。
说它基础,是因为它是⼀系列复杂强⼤的模型的基础。
决策树的基本思想是通过将数据不断划分,使原来混乱的数据信息逐渐清晰。
举⼀个简单的例⼦:如果你去相亲,你可能以外貌为第⼀特征来决定是否继续往下考虑;如果外貌过关了,你可能还会考虑职位和收⼊⽔平;如果收⼊⽔平也过关了,再去考虑品质……这种层层筛选的过程就蕴含着决策树的朴素思想。
决策树不局限于数学模型的具体形式,它既可以⽤来作分类,也可以⽤来作回归,⼆者的基本思想类似,处理⽅法上有差别。
分类树根据前⽂的描述,应该有两个问题:1、如何表征数据的混乱或清晰的程度?2、如何将数据划分?⼀个分类变量,设想⼀下极端情况,如果都是True或False,那它取True或False的概率就是0或1,这些都是100%确定的,你⽆需做任何猜测,这种情况下数据就是最清晰的;反之,如果⼀个变量各有50%的True或False,你甚⾄没办法预测⼀个样本更有可能是True还是False,这种情况下数据就是最混乱的。
有两个指标可以⽤来衡量数据的不确定程度:熵和基尼系数(并⾮经济学上的概念),定义如下:熵:熵的定义基尼系数:基尼系数的定义具体就不推导了,可见当p接近0或1时,这两个指标都接近于0,表⽰不确定度最低,信息最为清晰;当p接近0.5时,不确定度最⾼,信息最为混乱。
第⼀个问题解答了,第⼆个问题如何来进⾏数据划分?分类树的主要过程如下:⾸先计算分类变量在不做任何划分下的熵或基尼系数计算每⼀个特征在各个⽔平下的划分的加权熵或基尼系数选择令分类变量熵或基尼系数减少得最多的特征作为节点往下划分?重复以上过程,直⾄数据被清晰划分以Carseats的座椅销量⽔平⾼低为⼆分类变量,演⽰构建分类树的过程。
R软件实现随机森林算法
R软件实现随机森林算法随机森林算法是一种集成学习方法,它基于决策树构建了多个随机子树,并通过投票方式来确定最终的预测结果。
在R软件中,我们可以使用randomForest包来实现随机森林算法。
下面是详细的代码实现步骤:步骤1:安装并导入randomForest包```Rinstall.packages("randomForest") # 安装randomForest包library(randomForest) # 导入randomForest包```步骤2:准备数据集在这个示例中,我们将使用IRIS数据集作为示例数据。
IRIS数据集是一个经典的分类数据集,包含三个类别的鸢尾花的测量数据。
```Rdata(iris) # 加载IRIS数据集```步骤3:划分数据集将数据集划分为训练集和测试集。
训练集用于构建随机森林模型,测试集用于评估模型的性能。
```Rset.seed(123) # 设置随机种子,保证结果可重复trainIndex <- sample(1:nrow(iris), 0.7*nrow(iris)) # 随机选择70%的样本作为训练集trainData <- iris[trainIndex, ] # 构建训练集testData <- iris[-trainIndex, ] # 构建测试集```步骤4:构建随机森林模型使用randomForest函数来构建随机森林模型。
```RrfModel <- randomForest(Species ~ ., data = trainData, ntree = 100, mtry = 2) # 构建随机森林模型```在这个示例中,我们使用了100颗决策树(ntree参数)和2个随机特征(mtry参数)。
步骤5:查看模型信息可以使用print函数来查看模型的详细信息。
```Rprint(rfModel)```步骤6:模型预测使用predict函数对测试集进行分类预测。
随机森林特征重要性计算_R语言随机森林模型中具有相关特征的变量重要性
随机森林特征重要性计算_R语言随机森林模型中具有相关特征的变量重要性随机森林(Random Forest)是一种常用的机器学习方法,可以用于特征选择和变量重要性评估。
在R语言中,可以使用randomForest包来构建随机森林模型,并计算变量的重要性。
在随机森林算法中,变量的重要性可以通过两种方式来评估:基于节点的重要性(Node Importance)和基于变量的重要性(Variable Importance)。
基于节点的重要性是通过计算每个节点在模型中的准确率改变来评估,它只对拆分节点的变量感兴趣。
可以使用varImp函数计算每个节点的重要性。
```R# 导入randomForest包library(randomForest)#构建随机森林模型model <- randomForest(Species ~ ., data = iris)#计算节点的重要性node_importance <- varImp(model)print(node_importance)```上面的代码将计算随机森林模型中每个节点的重要性,并打印结果。
基于变量的重要性是通过计算每个变量的平均节点准确率改变来评估。
可以使用importance函数计算变量的重要性。
```R#计算变量的重要性variable_importance <- importance(model)print(variable_importance)```上面的代码将计算随机森林模型中每个变量的重要性,并打印结果。
基于变量的重要性是基于基于节点的重要性的总和来计算的,通常更为常用。
例如,可以使用以下代码将变量按重要性进行排序并绘制柱状图:```R#按重要性对变量进行排序sorted_importance <- sort(variable_importance, decreasing = TRUE)#绘制柱状图barplot(sorted_importance, main = "Variable Importance",xlab = "Variables", ylab = "Importance")```上面的代码将变量按重要性进行排序,并绘制了一个柱状图来展示变量的重要性。
11第十一章 R软件与随机森林介绍

bagging 与RF的区别
精度 速度
bagging
RF
低
高
慢
快
对变量重要性 的选取
部分
一个好的分类模型应该尽可能的靠近图形的左 上斱,随机预测分类器的ROC曲线总是位于主对角 线上。
有时候,仅从ROC曲线上看,也很难评判出那个 更好,需要一个数字标准进行评估。
AUC值:处于ROC曲线下方的面积。
一般AUC值介于0.5不1之间,较大的AUC值 代表了较好的性能。 显然完美的模型AUC为1,随机预测模型为 0.5.
推荐:F取 M 。
实际中,一般是取上述推荐值、推荐值 的二分之一、推荐值的两倍中,选出泛化 误差最小时的F值,作为最优的F值。
RF的优点
• 学习速度快 • 预测准确,同时避免过拟合现象 • 可以处理海量数据、高维问题,无需删减变量 • 变量选择效果好,幵能评估解释变量的重要性 • 对缺失数据、非平衡数据、异常值都比较稳健
投票机制
贝叶斯投票机制
假设 每个基本分类器都是平等的,没有 分类能力之间的差别,但是这种假设幵丌总 是合适的,在实际生活中,我们听取每一个 人意见的时候会考虑到这个人过去的意见是 否有用,贝叶斯投票法就是基于这种思想来 提出的。贝叶斯投票法是基于每一个基本分 类器在过去的分类表现来设定一个权值,然 后按照这个权值进行投票,其中每个基本分 类器的权值基于贝叶斯定理来进行计算。
577.4945
户籍
460.2087
住家
383.6650
频率
368.8455
家庭经济
310.4867
张数
291.7299
都市化程度
276.7831
婚姻
268.1740
r语言之randomforest随机森林

R语言之Random Forest随机森林什么是随机森林?随机森林就是通过集成学习的思想将多棵树集成的一种算法,它的基本单元是决策树,而它的本质属于机器学习的一大分支——集成学习(Ensemble Learning)方法。
随机森林的名称中有两个关键词,一个是“随机”,一个就是“森林”。
“森林”我们很好理解,一棵叫做树,那么成百上千棵就可以叫做森林了,这样的比喻还是很贴切的,其实这也是随机森林的主要思想--集成思想的体现。
随机森林算法的实质是基于决策树的分类器集成算法,其中每一棵树都依赖于一个随机向量,随机森林的所有向量都是独立同分布的。
随机森林就是对数据集的列变量和行观测进行随机化,生成多个分类数,最终将分类树结果进行汇总。
随机森林相比于神经网络,降低了运算量的同时也提高了预测精度,而且该算法对多元共线性不敏感以及对缺失数据和非平衡数据比较稳健,可以很好地适应多达几千个解释变量数据集。
随机森林的组成随机森林是由多个CART分类决策树构成,在构建决策树过程中,不进行任何剪枝动作,通过随机挑选观测(行)和变量(列)形成每一棵树。
对于分类模型,随机森林将根据投票法为待分类样本进行分类;对于预测模型,随机森林将使用单棵树的简单平均值来预测样本的Y值。
随机森林的估计过程1)指定m值,即随机产生m个变量用于节点上的二叉树,二叉树变量的选择仍然满足节点不纯度最小原则;2)应用Bootstrap自助法在原数据集中有放回地随机抽取k 个样本集,组成k棵决策树,而对于未被抽取的样本用于单棵决策树的预测;3)根据k个决策树组成的随机森林对待分类样本进行分类或预测,分类的原则是投票法,预测的原则是简单平均。
随机森林的两个重要参数:1.树节点预选的变量个数:单棵决策树决策树的情况。
2.随机森林中树的个数:随机森林的总体规模。
随机森林模型评价因素1)每棵树生长越茂盛,组成森林的分类性能越好;2)每棵树之间的相关性越差,或树之间是独立的,则森林的分类性能越好。
r语言做随机森林后绘制roc曲线
r语言做随机森林后绘制roc曲线在进行机器学习模型评估和性能度量时,经常使用ROC曲线来评估分类器的预测能力。
ROC(Receiver Operating Characteristic)曲线给出了分类器在不同阈值下的真阳性率(True Positive Rate,简称TPR)与假阳性率(False Positive Rate,简称FPR)之间的关系。
本文将使用R语言中的随机森林算法构建一个分类器,并使用该分类器对数据进行预测,最后绘制ROC曲线。
一、导入相关包和数据集在使用R语言进行数据分析之前,首先需要导入相关的包和数据集。
本文将使用"randomForest"和"pROC"包来实现随机森林算法和ROC曲线的绘制。
```R# 导入相关包library(randomForest)library(pROC)# 导入数据集data <- read.csv("data.csv")```二、数据预处理在进行随机森林算法之前,需要对数据进行预处理。
预处理包括数据清洗、特征选择、数据划分等步骤。
具体的预处理步骤根据实际情况确定。
三、构建随机森林分类器随机森林是一种集成学习算法,它通过构建多个决策树来进行分类预测。
每个决策树的训练样本是通过有放回抽样(bootstrap)得到的,每个节点的划分是在随机选择的特征子集上进行的。
最后,随机森林的分类结果由多个决策树的结果投票得到。
```R# 设置随机种子set.seed(123)# 构建随机森林分类器rf_model <- randomForest(formula = Class ~ ., data = data, ntree = 100) ```四、进行分类预测构建好随机森林分类器之后,可以使用该分类器对新的样本进行分类预测。
预测结果通常是样本属于每个类别的概率。
```R# 进行分类预测predictions <- predict(rf_model, newdata = data, type = "prob")```五、计算ROC曲线参数在绘制ROC曲线之前,需要计算出每个阈值下的真阳性率和假阳性率。
- 1、下载文档前请自行甄别文档内容的完整性,平台不提供额外的编辑、内容补充、找答案等附加服务。
- 2、"仅部分预览"的文档,不可在线预览部分如存在完整性等问题,可反馈申请退款(可完整预览的文档不适用该条件!)。
- 3、如文档侵犯您的权益,请联系客服反馈,我们会尽快为您处理(人工客服工作时间:9:00-18:30)。
R软件实现随机森林算法(带详细代码操作)随机森林算法是我们经常要用到的机器学习,本文我们将使用随机森林模型,根据鲍鱼的一系列特征来预测鲍鱼是否“新鲜”。
鲍鱼数据来自UCI机器学习存储库(我们将数据分为训练和测试集)。
目录如下:1、数据准备(输入,数据已处理等)2、数据分割(把数据分割为测试集和训练集)3、变量选择4、模型拟合结果及评估(混淆矩阵,ROC曲线等)首先,我们将数据加载到R中:# 加载需要的安装包library(caret)library(ranger)library(tidyverse)library(e1071)# 读入数据abalone_data <- read.table("../data/abalone.data", sep = ",")# 读入变量名称colnames(abalone_data) <- c("sex", "length", "diameter", "height","whole.weight", "shucked.weight","viscera.weight", "shell.weight", "age")# 对预测变量进行划分abalone_data <- abalone_data %>%mutate(old = age > 10) %>%# remove the "age" variableselect(-age)# 把数据分割成训练集合测试集set.seed(23489)train_index <- sample(1:nrow(abalone_data), 0.9 * nrow(abalone_data))abalone_train <- abalone_data[train_index, ]abalone_test <- abalone_data[-train_index, ]# remove the original datasetrm(abalone_data)# view the first 6 rows of the training datahead(abalone_train)可以看到,输出结果如下:下一步,拟合随机森林模型rf_fit <- train(as.factor(old) ~ .,data = abalone_train,method = "ranger")默认情况下,train不带任何参数函数重新运行模型超过25个bootstrap样本和在调谐参数的3个选项(用于调谐参数ranger是mtry;随机选择的预测器在树中的每个切口的数目)。
rf_fit## Random Forest#### 3759 samples## 8 predictor## 2 classes: 'FALSE', 'TRUE'#### No pre-processing## Resampling: Bootstrapped (25 reps)## Summary of sample sizes: 3759, 3759, 3759, 3759, 3759, 3759, ...## Resampling results across tuning parameters:#### mtry splitrule Accuracy Kappa## 2 gini 0.7828887 0.5112202## 2 extratrees 0.7807373 0.4983028## 5 gini 0.7750120 0.4958132## 5 extratrees 0.7806244 0.5077483## 9 gini 0.7681104 0.4819231## 9 extratrees 0.7784264 0.5036977#### Tuning parameter 'min.node.size' was held constant at a value of 1## Accuracy was used to select the optimal model using the largest value.## The final values used for the model were mtry = 2, splitrule = gini## and min.node.size = 1.使用内置predict函数,在独立的测试集上测试数据同样简单。
# predict the outcome on a test setabalone_rf_pred <- predict(rf_fit, abalone_test)# compare predicted outcome and true outcomeconfusionMatrix(abalone_rf_pred, as.factor(abalone_test$old))## Confusion Matrix and Statistics#### Reference## Prediction FALSE TRUE## FALSE 231 52## TRUE 42 93#### Accuracy : 0.7751## 95% CI : (0.732, 0.8143)## No Information Rate : 0.6531## P-Value [Acc > NIR] : 3.96e-08#### Kappa : 0.4955#### Mcnemar's Test P-Value : 0.3533#### Sensitivity : 0.8462## Specificity : 0.6414## Pos Pred Value : 0.8163## Neg Pred Value : 0.6889## Prevalence : 0.6531## Detection Rate : 0.5526## Detection Prevalence : 0.6770## Balanced Accuracy : 0.7438#### 'Positive' Class : FALSE##现在我们已经看到了如何拟合模型以及默认的重采样实现(引导)和参数选择。
尽管这很棒,但使用插入符号可以做更多的事情。
预处理(preProcess)插入符号很容易实现许多预处理步骤。
脱字号的几个独立功能针对设置模型时可能出现的特定问题。
这些包括dummyVars:根据具有多个类别的分类变量创建伪变量nearZeroVar:识别零方差和接近零方差的预测变量(在进行二次采样时可能会引起问题)findCorrelation:确定相关的预测变量findLinearCombos:确定预测变量之间的线性相关性除了这些单独的功能外,还存在preProcess可用于执行更常见任务(例如居中和缩放,插补和变换)的功能。
preProcess接收要处理的数据帧和方法,可以是“BoxCox”,“YeoJohnson”,“expoTrans”,“center”,“scale”,“range”,“knnImpute”,“bagImpute”,“medianImpute”中的任何一种”,“pca”,“ica”,“spatialSign”,“corr”,“zv”,“nzv”和“conditionalX”。
# center, scale and perform a YeoJohnson transformation# identify and remove variables with near zero variance# perform pcaabalone_no_nzv_pca <- preProcess(select(abalone_train, - old),method = c("center", "scale", "nzv", "pca"))abalone_no_nzv_pca## Created from 3759 samples and 8 variables#### Pre-processing:## - centered (7)## - ignored (1)## - principal component signal extraction (7)## - scaled (7)#### PCA needed 3 components to capture 95 percent of the variance# identify which variables were ignored, centered, scaled, etcabalone_no_nzv_pca$method## $center## [1] "length" "diameter" "height" "whole.weight"## [5] "shucked.weight" "viscera.weight" "shell.weight"#### $scale## [1] "length" "diameter" "height" "whole.weight"## [5] "shucked.weight" "viscera.weight" "shell.weight"#### $pca## [1] "length" "diameter" "height" "whole.weight"## [5] "shucked.weight" "viscera.weight" "shell.weight"#### $ignore## [1] "sex"# identify the principal componentsabalone_no_nzv_pca$rotation## PC1 PC2 PC3## length -0.3833860 -0.02483364 0.5915467## diameter -0.3837457 -0.05161255 0.5853768## height -0.3464346 -0.87775177 -0.2975826## whole.weight -0.3909385 0.22610064 -0.2335635## shucked.weight -0.3785309 0.33107101 -0.2537499## viscera.weight -0.3818968 0.24715579 -0.2842531## shell.weight -0.3791751 0.06675157 -0.1382400资料分割(createDataPartition和groupKFold)通过该createDataPartition函数可以轻松生成数据的子集。
