LaserSCANNER
激光扫描技术及其应用
激光扫描技术及其应⽤郑重申明本⼈呈交的学位论⽂,是在导师的指导下,独⽴进⾏研究⼯作所取得的成果,所有数据、图⽚资料真实可靠。
尽我所知,除⽂中已经注明引⽤的内容外,本学位论⽂的研究成果不包含他⼈享有著作权的内容。
对本论⽂所涉及的研究⼯作做出贡献的其他个⼈和集体,均已在⽂中以明确的⽅式标明。
本学位论⽂的知识产权归属于培养单位。
本⼈签名:⽇期:摘要激光扫描技术是⼀种新兴空间信息获取技术,作为获取空间数据的有效⼿段,以其快速、精确、⽆接触测量等优势在众多领域发挥着越来越重要的作⽤,尤其是在测绘领域,其在变形监测、3D数字城市、地图测量等等上的快速、良好运⽤,给测绘⼜带来了⼀次技术变⾰。
随着对激光扫描技术的研究进⼀步深⼊,其应⽤领域将更加⼴泛。
本⽂是⼀篇研究激光扫描技术及其若⼲应⽤的⽂章,主要从激光的原理和特性⼊⼿,来阐述激光扫描仪,包括对激光扫描仪的原理、特点进⾏叙述,以及激光扫描仪与传统测绘技术的对⽐,接着重点介绍地⾯三维激光扫描仪,包括对地⾯三维激光扫描仪的原理、分类、精度影响因素等等说明,同时列举了地⾯三维激光扫描仪在公路建模上的⼀个运⽤,进⾏最后是对激光扫描仪的总结和展望。
关键词:信息技术、激光、激光扫描测量、激光扫描技术、地⾯激光扫描仪、点云数据ABSTRACTAs get spatial data effective means, laser scanning technology is one kind of emerging spatial information acquisition technology, with its rapid, accurate, non-contact measurement in many fields such as advantage is playing more and more important role, especially in surveying and mapping domain, its deformation monitoring, 3D digital city, map measurement, etc by the rapid, good use of surveying and mapping, to bring a technological change again. With the study of laser scanning technique, its application field further will be more widely.This paper is a study laser scanning technology and some application articles, mainly from the principle and characteristics of laser, expounded the laser scanner, including laser scanner principle, characteristics, and laser scanner description with traditional mapping technology contrast, then introduced the ground 3d laser scanner, including ground 3d laser scanner principle, classification, precision influence factors and so on, and enumerated the ground that 3d laser scanner in a highway modeling to apply, final is summarized and prospects of laser scanner.Keywords:Information technology, laser, laser scanning measurement, laser scanning technology, ground laser scanner, the point cloud data⽬录第⼀章绪论 (1)1.1研究背景 (1)1.2 研究意义 (2)1.2.1 达到的⽬的 (2)1.2.2 选题的意义 (2)1.3发展现状 (2)1.3.1国外的研究介绍 (2)1.2.2国内研究简介 (5)1.4主要研究内容 (6)第⼆章激光扫描技术 (7)2.1激光 (7)2.1.1激光原理 (7)2.1.2激光的特性 (8)2.2激光雷达(LIDAR) (8)2.2.1激光雷达⼯作原理 (9)2.2.2激光雷达技术优势 (9)2.2.3激光雷达技术应⽤现状 (10)2.3激光扫描仪的原理 (11)2.3.1激光扫描⽅式 (11)2.3.2激光扫描仪的测量原理 (12)2.4激光扫描仪种类 (13)2.5机载型激光扫描仪 (14)2.6激光扫描仪的特点 (15)2.7激光扫描技术与传统测量技术的区别 (16)第三章地⾯激光扫描仪 (17)3.1地⾯激光扫描仪的原理 (17)3.2地⾯激光扫描仪与靶标 (18)3.3地⾯激光扫描仪的分类 (20)3.3.1基于测距⽅式的分类 (20)3.3.2基于与相机组合⽅式的分类 (21)3.4 地⾯激光扫描仪的⽅法和数据处理 (22) 3.4.1地⾯激光扫描仪的⽅法 (22)3.4.2 地⾯激光扫描仪的数据处理 (23)3.5影响地⾯激光扫描仪精度的因素 (25) 3.5.1⾓度测量 (25)3.5.2距离测量 (25)3.5.3分辨率 (25)3.5.4边缘效应 (26)3.5.5反射特性 (26)3.5.6环境条件 (26)3.6地⾯激光扫描仪应⽤实例 (26)3.6.1数据采集 (26)3.6.2数据处理及结果 (27)3.7地⾯激光扫描仪的应⽤ (29)第四章总结与展望 (32)4.1总结 (32)4.2展望 (32)参考⽂献 (34)致谢 ........................................ 错误!未定义书签。
热转与热感的区别

商品条码是在流通领域中用于标识商品的全球通用的条码。
商品条码由一组规则排列的条、空及其对应字符组成,表示一定信息。
商品条码的条、空组合部分称为条码符号,对应符号部分由一组阿拉伯数字组成称为商品标识代码。
条码符号和条码代码相对应,表示的信息一致。
条码符号用于条码识读设备扫描识读,条码代码供人识读。
国家标准规定了商品条码的编码、结构、尺寸及技术要求。
商品条码的商品项目代码由厂商自行编制,表示商品的类别、规格、包装形式等信息。
根据GB12904-2003中商品项目代码编制唯一性原则规定:对同一商品项目的商品应分配相同的商品标识代码。
基本特征相同的商品视为同一商品项目,基本特征不同的商品视为不同的商品项目;对不同商品项目的商品应分配不同的商品标识代码。
商品条码包括EAN条码和UPC条码。
GB12904主要依据EAN应用规范制定,我国推广应用EAN条码。
UPC条码主要用于美国、加拿大等国家。
我国出口到美国、加拿大的食品、医疗保健类商品需要申请使用UPC条码。
第一章条码概述第1.1节条码的发展历史条码最早出现在40年代,但得到实际应用和发展还是在70年代左右。
现在世界上的各个国家和地区都已普遍使用条码技术,而且它正在快速的向世界各地推广,其应用领域越来越广泛,并逐步渗透到许多技术领域。
早在40年代,美国乔·伍德兰德(Joe Wood Land)和伯尼·西尔沃(Berny Silver)两位工程师就开始研究用代码表示食品项目及相应的自动识别设备,于1949年获得了美国专利。
该图案很像微型射箭靶,被叫做“公牛眼”代码。
靶式的同心圆是由圆条和空绘成圆环形。
在原理上,“公牛眼”代码与后来的条码很相近,遗憾的是当时的工艺和商品经济还没有能力印制出这种码。
然而,10年后乔·伍德兰德作为IBM公司的工程师成为北美统一代码UPC 码的奠基人。
以吉拉德·费伊塞尔(Girard Fessel)为代表的几名发明家,于1959年提请了一项专利,描述了数字0-9中每个数字可由七段平行条组成。
【激光打印机使用工作原理和一般故障检修】

【激光打印机使用工作原理和一般故障检修】【激光打印机工作原理】激光打印机以其打印速度快,打印品质高的优点,在人们的日常工作中越来越受到青睐。
但了解其工作原理的人并不多。
本文根据激光打印机的工作特点,浅淡激光打印机工作原理。
激光打印机一般分成6大系统: 1、Power System(供电系统) 2、DC controller System(直流控制系统) 3、Formatter System(接口系统) 4、Laser/Scanner System(激光扫描系统) 5、Image Formation System (成像系统) 6、Pick-up/Feed System(搓纸系统)。
下面将对这6大系统分别进行阐述。
一、Power System(供电系统)供电系统作用于其它5个系统,根据需要,输入的交流电被调控为高压、低压、直流电。
高压电一般作用于成像系统,许多型号的打印机都单独的高压板,像HP4、HP4V、方正文杰作280、XeroxP8E、Canon BX/BX2等。
但随着集成化的增、高,很多打印机的高压板、电源板以及DC控制板被集成在一起。
像HP5L/6L,HP4L/4P、HP5P/6P、HP4000、HP5000等。
低压电主要用来驱动各个引擎马达,其电压根据需要而定,像HP5L/6L主要有5V、12V电压,而HP5000主要有3.4\/、5V、24V电压。
直流电主要用来驱动DC板上的各种型号的传感器、控制芯片以及CPU等。
二、DC Controller System(直流控制系统)直流控制系统主要用来协调和控制打印机的各系统之间的工作:从接口系统接收数据,驱动控制激光扫描单元、测试传感器、控制交直流电的分布,过压/欠流保护、节能模式、控制高压电的分布等。
其电路构成比其它5 个系统都复杂,涉及到电路的一些专业知识,像放大电路、反馈电路、整流电路等,是维修的一个难关。
三、Formatter System(接口系统)接口系统是打印机和计算机连接的桥梁,它负责把计算机传递过来的一定格式的数据翻译成DC板能处理的格式,并传递给DC板。
机科——叉车式AGV方案

AGV输送系统技术方案目录1.1 总体方案 (2)1.1.2AGV输送系统构成 (2)1.1.3AGV系统输送方案 (4)1.2 方案特点及分项技术描述 (5)1.2.1AGV单车 (5)1.2.1.1 AL16型激光导引AGV (5)1.2.1.2 AGV车体 (13)1.2.1.3 AGV车载控制系统 (15)1.2.1.4 AGV车载安全防护系统 (17)1.2.1.5 AGV小车操作模式 (19)1.2.1.6 AGV单车故障诊断 (19)1.2.2AGV控制系统 (20)1.2.2.1 AGV控制系统功能 (20)1.2.2.2 AGV管理监控计算机 (22)1.2.2.3 AGV自动调度软件 (24)1.2.3AGV充电系统及电池 (26)1.2.3.1 自动充电机 (26)1.2.3.2 镍镉快充电池 (26)1.2.3.3 充电方式与充电站的设置原则 (28)1.3 需要说明的其他问题(建筑及公用工程) (29)1.3.1动力配电系统 (29)1.3.2中控室 (29)1.4 近年业绩(物流) (30)1.5 系统报价................................................................. 错误!未定义书签。
1.1 总体方案1.1.1 AGV技术简介瑞典NDC公司成立于1962年,在欧洲被称为“自控之王”,NDC公司采用合作伙伴的商业模式,NDC的核心能力在于研发,为合作伙伴提供先进的AGV 控制系统、导引系统与开发软件,AGV的设计、制造、安装以及市场开发等工作由合作伙伴来完成。
目前,全球顶尖的50家AGV供应商均在其车辆中采用了NDC公司的AGV控制系统,它的AGV系列产品行销全球,目前,世界上采用NDC公司控制技术的15000台套AGV在运行,NDC公司的激光、磁导引技术居世界领先水平,在激光、磁导引AGV领域占据全世界市场80%的份额。
4-LaserCOMPACT探测器产品指南

LaserCOMPACT 探测器产品指南2007年7月VESDA® LaserCOMPACT产品指南范围 (1)LaserCOMPACT探测器简介 (1)LaserCOMPACT探测器的配置 (1)LaserCOMPACT探测器的特性 (2)LaserCOMPACT探测器的运行 (2)LaserCOMPACT探测器的显示器 (3)LED指示灯和“复位/隔离”按钮 (3)Compact (VN)探测器的远程显示模块 (5)LaserCOMPACT探测器的远程显示模块 (5)LCD编程器 (7)产品设置 (8)产品信息 (10)产品技术规格 (10)产品尺寸 (12)等级与认证 (13)缺省设置 (14)继电器状态变化的设置及条件 (15)辅助/GPI通用输入端子 (15)探测器的安装 (16)固定安装托架 (17)安装探测器 (17)嵌入式安装套件 (18)这组套件用于将探测器嵌入墙体内 (18)将VLC探测器与采样管网相连接 (18)进气管 (18)排气管 (19)线缆的连接 (19)终端卡 (19)VESDAnet端子(仅适用VN联网型) (20)继电器端子 (21)编程器插槽 (21)辅助/GPI通用输入端子 (22)电源 (22)备用电池 (22)备用电池大小的计算表 (23)启动 (23)系统初步检测 (24)探测器的维修与维护 (24)探测器的开启与关闭 (25)开启探测器 (25)关闭探测器 (26)更换吸气泵 (26)组装 (27)LaserCOMPACT探测器的内部接线 (28)Doc. 11453_03LaserCOMPACT产品指南VESDA® 备件 (28)Doc. 11453_03VESDA® LaserCOMPACT产品指南 1.1范围LaserCOMPACT产品指南提供了全面的探测器信息。
本指南对LaserCOMPACT探测器的特性、技术规格、组件及其功能进行了介绍。
LASER SCANNER
专利名称:LASER SCANNER发明人:REICHERT, Rainer,RIEGER,Peter,PFENNIGBAUER, Martin,RIEGL,Johannes申请号:EP19196895.7申请日:20190912公开号:EP3792653B1公开日:20220126专利内容由知识产权出版社提供摘要:The present invention relates to a laser scanner (1), comprising a housing (23), a laser transmitter (11) having a transmission aperture (S) for a transmission beam (12), a laser receiver (16) for a reception beam (15), and a beam-deflecting apparatus in the form of a mirror pyramid (2), the pyramid axis of which forms the axis of rotation (21) thereof and the pyramid sides of which each from a mirror facet (7-10), wherein the laser transmitter (11) and the laser receiver (16) are each directed at the mirror pyramid parallel to the axis of rotation (21) of the mirror pyramid (2), the laser receiver (16) has at least one converging lens (20) arranged downstream of the mirror pyramid (2) in the reception beam path, and the converging lens (20), viewed in the direction of the axis of rotation (21), is, in its region of overlap with the mirror facets (7-10), at least as large, in area comparison, as twice the largest of all the mirror facets (7-10) observed in the direction of axis of rotation (21).申请人:RIEGL Laser Measurement Systems GmbH代理机构:Weiser & Voith Patentanwälte Partnerschaft更多信息请下载全文后查看。
扫光机技术使用方法
扫光机技术使用方法扫光机(sweep laser scanner)是一种常用于光学成像、勘测、激光雷达等领域的一种设备。
其工作原理是通过发射激光束并扫描整个目标区域,将散射回来的光信号接收并处理,从而获得目标区域的图像或数据。
下面将详细介绍扫光机技术的使用方法。
一、设备准备1. 选择扫光机:根据应用需求选择合适的扫光机型号,考虑扫描速度、分辨率、功率等因素。
2. 安装扫描平台:将扫光机安装在适当的平台上,确保稳定且能够自由扫描整个目标区域。
二、调整扫描参数1. 调整扫描速度:根据应用需求设置扫描速度,通常可通过控制器进行调整。
2. 设置扫描模式:根据需要选择线性扫描模式或非线性扫描模式,线性扫描适用于直线区域,非线性扫描适用于曲线或复杂形状区域。
3. 设置扫描角度:根据实际需求设置扫描角度范围,确保扫描覆盖整个目标区域。
三、激光发射与接收1. 发射激光束:通过控制器或软件控制扫光机发射激光束,确保激光束的稳定性和准直性。
2. 接收散射信号:扫光机通过感光元件接收目标区域反射回来的散射信号,并将信号转化为电信号。
四、图像数据处理1. 数据采集:将接收到的信号转化为数字信号,并进行采样,得到离散的数据点。
2. 数据处理:对采集到的数据点进行滤波、降噪、校准等处理,提高数据质量。
3. 图像重建:根据采集到的数据点,使用图像重建算法进行图像重建,生成目标区域的图像。
五、应用领域1. 光学成像:扫光机可用于光学显微镜、相机等设备中,通过扫描目标,获取高分辨率的图像。
2. 勘测与制图:扫光机可应用于航空激光雷达、地面激光扫描等勘测工作,生成地形图、建筑物模型等数据。
3. 机器人导航:扫光机可用于机器人导航与避障,通过扫描周围环境,实时获取障碍物信息,进行路径规划与避障控制。
4. 3D打印与制造:扫光机可用于3D打印、制造等领域,生成高精度的物体模型与结构形态数据。
总结:扫光机是一种重要的光学设备,通过发射激光束并扫描整个目标区域,将接收到的散射信号转化为图像或数据。
FAROLaser Scanner Focus3DX330新型激光扫描仪:用于三维数字建档和土地测量的理想工具

沉淀 ,同时能够确保每台搅拌泵具有 相等的累计
运 行 时 间 ,确 保 了污 水池 的水 处 于 最 佳状 态 。一 旦 水 位 到 达 上 高 位 时 ,P L C就 会 启 用 干 运 转 保 护 措 施 ,使 全 部 的补 水 泵停 止 运 行 ,这样 对 水 泵 起 到 了保 护作 用 。
号 ,P L C 控制污水池 中水泵给蓄水池补水 ,直到
蓄水 池 液 面 达 到 高位 ;同时 P L C还 控 制 骨料 层 蓄 水 池 内搅拌 泵 定时搅 拌 ,避免 污水 沉 淀 。
[ 2 ]陈燕兵. 基 于P L C 及 组 态王技 术 的污水 处理 自控 系统
应 用分析 [ J ]. 工业控 制计 算机 ,2 0 1 2( 1 ) :3 6 .
j f F A R O ⑧L a s e r S c a n n e r F o c u s 。 D X 3 3 0 新型激光扫描仪:用于三维数字 j 1
;
+
建 档 和 土 地 测 量 的理 想 工具
阜
+
{
+
佛罗里达州玛丽湖 ( 2 0 1 3 年l 0 月8 日) 一 全球最值得信赖的三维测量、 成像和实现技术 供应商F A R O T e c h 一 {
ห้องสมุดไป่ตู้
, r —卜 。 - +- 。 - +- 。 - 4 -。 —卜 - +- 。 - +- 。 - 4 -。 — 卜 - 4 - - + - 。 - +- 。 - 4- 。 _ 4 - - 。 - 4 - - + - 。 - 4 - - 。 - 4 - - 。 - 4 - 。 - + - 。 - +- 。 - 4 - - 。 - + - 。 - + - ’ - +- 。 - 4 -。 — 卜 - 4 - - 。 - 4 . - 。 - 4 - 。 - + - 。 - +- 。 - F’
激光打印机的工作原理分析讲解
激光打印机的工作原理分析通常,用户们只知道激光打印机打印速度快、打印质量好等优点,但了解其工作原理的又有多少人呢?然而,清楚打印机的工作原理对于对打印机进行日常维护,从而增加机器的工作质量和寿命等都是十分重要的。
通常,激光打印机可分成6大系统,分别是供电系统(Power System)、直流控制系统(DC controller System)、接口系统(Formatter System)、激光扫描系统(Laser/Scanner System)、成像系统(Image Formation System)以及搓纸系统(Pick-up/Feed System),其中最重要的就是成像系统,下面我们分别对六大系统进行简单的阐述:一、供电系统(Power System)坐享当今电气时代,似乎凡是机器都需要用到电,因此可以说每一台机器都必然有一个供电系统(只不过是轻重大小之分),对用电较为讲究的激光打印机更不例外。
激光打印机的供电系统是其它五个系统的能源基础,其性能发挥的优劣直接影响着另外五个系统。
一般,激光打印机的供电系统又分为三种,分别是高压、低压、直流,高压电一般作用于是成像系统,利用较高的电压才可以使激光器工作运行。
低压主要用来驱动各个引擎马达,电压大小可根据需要而定,如声名显赫的HP 6L系列激打,就有5V和12V两种。
而直流电则是用于驱动DC板上的传感器、控制芯片以及CPU等。
三种电压相互隔离,各司其主,但又相互影响,共同缔造一个稳定的供电系统。
二、直流控制系统(DC controller System)直流控制系统主要用来协调和控制打印机的各系统之间的工作,如数据接收、扫描单元的控制、传感器的测试,以及各种直流电的监控和分配等,它的电路构成比其它五个系统都要复杂,其中包含有许多电子的专业知识,包括放大、反馈等电路,因此笔者还是建议电子课程考试不及格的用户还是少动它为妙。
三、接口系统(Formatter System)当计算机向打印机发出打印命令后,打印机不会直接响应而去打印文件,而是首先需要把打印命令“翻译”过来,然后再根据得到的真实命令开展工作。
lidar原理与应用
• 测绘学的分支:
•
大地测量学与测量工程
•
地图制图学与地理信息工程
•
摄影测量与遥感
• 大地测量学与测量工程:
大地测量是研究地球形状、大小和重力场及其变化, 通过建立区域和全球三维控制网、重力网及利用卫星测量 、甚长基线干涉测量等方法测定地球各种动态的理论和技 术的学科。
工程测量是研究工程建设和自然资源开发中各个阶段 进行的控制测量、地形测绘、施工放样、变形监测及建立 相应信息系统的理论和技术的学科。
平面坐标(X,Y)及高程(Z)的数据集。DEM的格网间 隔应与其高程精度相适配,并形成有规则的格网系列。根 据不同的高程精度,可分为不同类型。为完整反映地表形 态,还可增加离散高程点数据。
• 数字正射影像图(Digital Orthophoto Map— DOM)是利用数字高程模型(DEM)对经扫描处理的数
图4 Lidar数据地面点断面分布示意图
Lidar数据的处理
LIDAR数据处理包括原始数据预处理和点云数据 后处理两个阶段。
1、原始数据预处理 首先通过地面CPS的基准站和机载GPS的测量数 据的联合差分结算,即可精确确定飞机飞行轨迹。 然后利用仪器厂家提供的随机商用软件,对飞机 GPS 轨迹数据、飞机姿态数据、激光测距数据及激 光扫描镜的摆动角度数据进行联合处理,最后得到 各测点的(X,Y,Z)三维坐标数据。这样得到的是 大量悬浮在空中没有属性的离散的点阵数据,形象 地称之为“点云”。
图5 Lidar点云数据分布示意图
2、点云数据后处理
对Lidar点云数据进行后处理的目的就是将分布 在不同地面目标上的点进行分离。简单地说,就是 将落在地形表面上的点(即所谓的地面点)与那些非 地形表面上的点(譬如上面图中落在汽车上、树木 或植被上、以及落在房屋上的点)进行有效而准确 的分离。
激光扫描仪原理

激光扫描仪原理
激光扫描仪(Laser Scanner)是一种利用激光技术进行扫描和成像的设备,它在工业、医疗、通讯、地理信息系统等领域都有着广泛的应用。
其原理主要包括激光发射、扫描镜控制、光电探测等几个方面。
激光扫描仪的工作原理是利用激光器产生一束高亮度的激光光束,经过透镜聚焦后,通过扫描镜的控制进行扫描,最终被目标表面反射或散射回来。
光电探测器接收到反射回来的光信号后,将其转换为电信号并进行处理,最终形成图像或数据输出。
在激光扫描仪中,激光器是起到产生激光光束的作用的关键部件。
它通常采用氮化镓(GaN)激光二极管或激光二极管阵列作为激光发射器,通过电流激发产生激光。
激光经过准直透镜后,形成一束平行光线,再经过扫描镜的控制进行扫描。
扫描镜是激光扫描仪中的另一个重要组成部分,它通常采用振荡镜或旋转镜来实现横向和纵向的扫描。
振荡镜通过电磁驱动或压电驱动来实现快速的横向扫描,而旋转镜则通过马达驱动实现较慢的纵向扫描。
通过对扫描镜的控制,可以实现对激光束的精确定位和扫描路径的控制。
光电探测器则是将反射回来的激光光信号转换为电信号的装置,它通常采用光电二极管、光电倍增管或光电二维阵列等器件。
这些器件能够将光信号转换为电流或电压信号,并经过放大、滤波、模数转换等处理后,最终形成数字化的图像或数据输出。
总的来说,激光扫描仪的工作原理是利用激光器产生激光光束,通过扫描镜的控制进行扫描,最终被目标表面反射或散射回来,再经过光电探测器转换为电信号并进行处理,最终形成图像或数据输出。
激光扫描仪具有高精度、高速度、非接触式等特点,因此在工业检测、医学影像、地理测绘等领域有着广泛的应用前景。
FARO激光扫描仪软件说明书

color photographs of the FARO color option, automatically detecting and equalizing differences in the distortion and alignment of the photos. Measuring and Analyzing Generation of objects, including points, spheres, planes, and cylinders directly from the scan data. Measuring between scan points and objects. Checks for flatness.Global Sales Offices: USA • Mexico • Germany • Switzerland • France • United Kingdom • Spain • Italy • Netherlands • Poland • Singapore • China • Japan • India •Brazil800.736.023404REF201-042.pdf Revised: 3/26/09Specifications Editing Scan Data■ Automatic search for reference spheres and black and white reference targets■ Object markers for the manual identification of spheres, black and white reference targets, circular reference targets, planes and slabs ■ Online correspondence search for the automatic assignment of reference points■ Automatic coloring of the scans with the high-resolution color photographs of the FARO color option■ Coloring of scan points with the aid of imported color photos ■ Deletion of scan areas■ Generation of new scan files of selected areas ■ Filters (including “dark points”, and “stray points”)Data Management of Extensive Projects ■ Hierarchical structure■ Bundling of unlimited number of scans to one project Analysis■ Distance measurement ■ Analysis of evennessImport & Export■ Control points for geo-referencing (.cor, .csv)■ Scan points (FARO Scan, FARO Cloud, .dxf, VRML, .igs, .txt, .xyz, .xyb, .pts, .ptx, .ptc, .ptz [import only], .pod [export only])■ CAD objects (.wrl [im- & export], .igs and .dxf [export only])■ Import digital photos (.jpg, .png, .bmp)■ Export panoramic images (.jpg)■ Online data transfer to FARO Cloud for AutoCAD Navigation■ Displaying of scan positions for viewpoint selection and changing to other scans by clicking■ 3D navigation in flight and inspection mode■ Predefined views (front view, side view, top view)Creating Workspaces ■ Scans & CAD objects■ Object fitting with visual quality indicators for spheres/tubes/planes (including automatic border detection)■ Meshing■ Measurements■ Intuitive user interface with structure viewViews■ 3D view■ Planar & Quick view■ Color scans are shown either in black & white or color ■ CAD object display ■ Print preview■ Color gradient depiction for displaying point distances from reference planes or the scanner locationGeneral。
OS32C安全激光扫描仪说明书
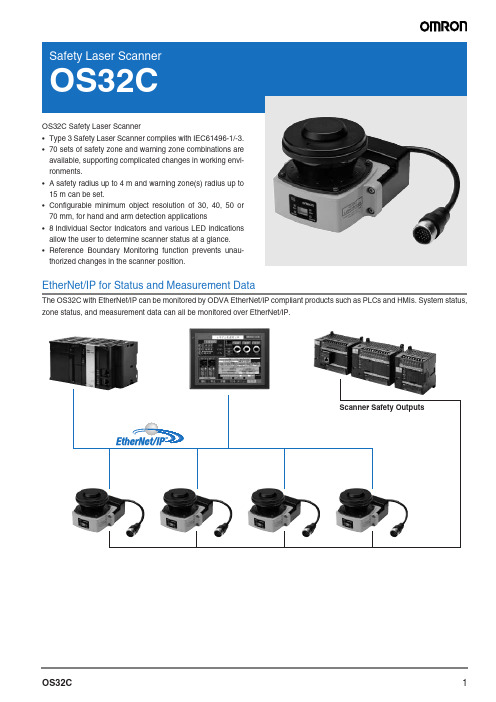
OS32C Safety Laser Scanner•Type 3 Safety Laser Scanner complies with IEC61496-1/-3.•70 sets of safety zone and warning zone combinations areavailable, supporting complicated changes in working envi-ronments.• A safety radius up to 4m and warning zone(s) radius up to15m can be set.•Configurable minimum object resolution of 30, 40, 50 or70mm, for hand and arm detection applications•8Individual Sector Indicators and various LED indicationsallow the user to determine scanner status at a glance.•Reference Boundary Monitoring function prevents unau-thorized changes in the scanner position.EtherNet/IP for Status and Measurement DataThe OS32C with EtherNet/IP can be monitored by ODVA EtherNet/IP compliant products such as PLCs and HMIs. System status, zone status, and measurement data can all be monitored over EtherNet/IP.Ordering informationOS32C (Power cable is sold separately.)Power cableEthernet cableNote:An ethernet cable with an M12, 4-pin connector is required.AppearanceDescriptionMax. OperatingRange (Safety Zone)ModelRemarksOS32C with backlocation cable entry 3mOS32C-BPCD-ROM (Configuration tool)OS supported:-Windows 2000,-Windows XP (32-bit version, Service Pack 3 or later)-Windows Vista (32-bit version),-Windows 7 (32-bit version/64-bit version)For configuration tool version, refer to page 9.4mOS32C-BP-4MOS32C with side lo-cation cable entry *1 *1.For OS32C-SP1(-DM), each connector is located on the left as viewed from the back of the I/O block.3mOS32C-SP14mOS32C-SP1-4MOS32C with Ether-Net/IP and back lo-cation cable entry3mOS32C-BP-DM4m OS32C-BP-DM-4MOS32C with Ether-Net/IP and side lo-cation cable entry *13mOS32C-SP1-DM4mOS32C-SP1-DM-4MAppearanceDescriptionModelRemarksCable length: 3 m OS32C-CBL-03M One cable is required per sensor.Cable length: 10 m OS32C-CBL-10M Cable length: 20 m OS32C-CBL-20M Cable length: 30 mOS32C-CBL-30MAppearanceDescriptionModelRemarksCable length: 2 m OS32C-ECBL-02M Required for configuration and monitoring.Cable length: 5 m OS32C-ECBL-05M Cable length: 15 mOS32C-ECBL-15MMounting bracketsAppearanceDescriptionModelRemarksBottom/side mounting bracketOS32C-BKT1Bottom/side mounting bracket × 1,unit mounting screws × 4 setsXY axis rotation mounting bracket OS32C-BKT2XY axis rotation mounting bracket × 1,unit mounting screws × 6 sets,bracket mounting screws × 1 set (must be used with OS32C-BKT1)Simple mounting bracket OS32C-BKT3Simple mounting brackets × 2,unit mounting screws × 4 sets *1*1.There are eight OS32C mounting screws: four screws for singular use, and four screws for protective cover for window.Protective cover for window OS32C-BKT4Mounting stand OS32C-MTWhen using a mounting stand, use an OS32C with side location cable entry (OS32C-SP1).The OS32C with back location cable entry (OS32C-BP) cannot be mounted.Use with mounting brackets (OS32C-BKT1 and OS32C-BKT2).Hardware kit for mounting stand OS32C-HDT Mounting screws × 3 setsUse this when mounting a bracket to the mounting stand.AccessoriesAppearanceDe s cription Model Remark sScan window OS32C-WIN-KT Spare for replacementSensor block without I/O blockMax. Operating Range: 3 mOS32C-SN Spare for replacementSensor block without I/O blockMax. Operating Range: 4 mOS32C-SN-4MSensor block without I/O block forEtherNet/IPMax. Operating Range: 3 mOS32C-SN-DM Spare replacement for EtherNet/IPSensor block without I/O block forEtherNet/IPMax. Operating Range: 4 mOS32C-SN-DM-4MI/O block With cable accessfrom the backOS32C-CBBP Spare for replacementWith cable accessfrom the left sideOS32C-CBSP1Spare for replacementWindow cleaning kit, anti-static cleaner WIN-CLN-KT AccessoryRating/PerformanceSensor Type Type 3 Safety Laser ScannerSafety Category PLd/Safety Category 3 (ISO 13849-1)Detection Capability Configurable; Non-transparent with a diameter of 30, 40, 50, 70mm (1.8% reflectivity or greater)(default: 70 mm)Monitoring Zone Monitoring Zone Set Count: (Safety Zone + 2 Warning Zones) x 70 setsOperating Range OS32C-@@@Safety Zone: 1.75 m (min. obj. resolution of 30 mm)2.5 m (min. obj. resolution of 40 mm)3.0 m (min. obj. resolution of 50 mm or 70 mm)Warning Zone:10.0 mOS32C-@@@-4M Safety Zone: 1.75 m (min. object resolution of 30mm)2.5 m (min. object resolution of 40 mm)3.0 m (min. object resolution of 50 mm or 70 mm)4.0 m (min. object resolution of 70 mm)Warning Zone:15.0 mMaximum Measurement Error100 mm (at range of 3 m or less)*1110 mm (at distance greater than 3 m and up to 4m)*1Detection Angle270°Angular Resolution0.4°Laser Beam Diameter 6 mm at optics cover, 14 mm (typical) at 3 m.Laser Scan Plane Height 67mm from the bottom of the scanner (see "Dimensions" on page 8 for more detail.)Response Time Response time from ON to OFF: From 80 ms (2 scans) to 680 ms (up to 17 scans)*2Response time from OFF to ON: Response time from ON to OFF + 100 ms to 60 s (Configurable) Zone Switching Time20 to 320 msLine Voltage24 VDC +25%/–30% (ripple p-p 2.5 V max.)Power Consumption Normal operation: 5 W max., 4 W typical (without output load)*3Standby mode: 3.75 W (without output load)Emission Source (Wavelength)Infrared Laser Diode (905 nm)Laser Protection Class Class 1: IEC/EN60825-1 (2007)Class 1: JIS C 6802 (2005)Class I: CFR21 1040.10, 1040.11Safety Output (OSSD) PNP transistor × 2, load current of 250 mA max., residual voltage of 2 V max.,load capacity of 2.2 µf max., leak current of 1 mA max.*3,*4,*5Auxiliary Output (Non-Safety)NPN/PNP transistor × 1, load current of 100 mA max., residual voltage of 2 V max.,leak current of 1mA max.*4,*5,*6Warning Output (Non-Safety)NPN/PNP transistor × 1, load current of 100 mA max., residual voltage of 2 V max.,leak current of 1mA max.*4,*5,*6Operation Mode Auto Start, Start Interlock, Start/Restart InterlockInput External DeviceMonitoring (EDM)ON: 0 V short (input current of 50 mA), OFF: OpenStart ON: 0 V short (input current of 20 mA), OFF: OpenZone Select ON: 24 V short (input current of 5 mA), OFF: OpenStand-by ON: 24 V short (input current of 5 mA max.), OFF: OpenConnection Type Power Cable: 18-pin mini-connector (pigtail)Communication Cable: M12, 4-pin connectorConnection with PC Communication: Ethernet*7OS Supported:Windows 2000, Windows XP (32-bit version, Service Pack 3 or later),Windows Vista (32-bit version), Windows 7 (32-bit version/64-bit version) Indicators RUN indicator: Green, STOP indicator: Red, Interlock Indicator: Yellow, Warning/Auxiliary OutputIndicator: OrangeStatus/Diagnostic Display: 2 × 7-segment LEDs, Individual Sector Indicators: Red LED × 8 Protective Circuit Protection against output load short and reverse power connectionAmbient Temperature Operation: –10 to 50°C, Storage: –25 to 70°CAmbient Humidity Operation & Storage: 95% RH max., non-condensingAmbient Operation Illumination Incandescent lamp: Illumination on receiving surface 1500 lx max. (an angle of laser scanning plane and disturbance light must be ±5 degrees or more)Insulation Resistance20 M or higher (500 VDC)Dielectric Withstand Voltage500VDC, 1 minuteEnclosure Rating IP65 (IEC60529)Enclosure Sensor head: Die-cast aluminum, optical cover: Polycarbonate, I/O block: Die-cast aluminum Dimensions (WxHxD)133.0 × 104.5 × 142.7 mm (except cable)ConnectionBasic connection with single OS32C unitCategory 3, Performance Level d (ISO13849-1)Impact Resistance 98 m/s 2 1,000 times for each of X, Y, and Z directions (IEC60068-2-29)Vibration10 to 55 Hz double-amplitude of 0.7 mm, 20 sweepings for X, Y, and Z directions (IEC60068-2-6)Weight (Main Unit only) 1.3 kg Power CableUp to 30 mCommunication Cable Up to 100 m for 100BASE-TX cableApprovalsCertificated by:TÜV Rheinland, UL Standards: EN61496-1 (Type 3 ESPE), EN61496-3 (Type 3 AOPDDR), EN61508 (SIL2),IEC61496-1 (Type 3 ESPE), IEC61496-3 (Type 3 AOPDDR), IEC61508 (SIL2), UL508, UL1998, CAN/CSA-C22.2 No. 14, CAN/CSA-C22.2 No. 0.8*1.An additional measurement error may need to be added due to reflective backgrounds.*2.Pollution Tolerance mode will add 6 ms to each scan time.*3.Rated current of OS32C is 1.025 A max. (OS32C 210 mA + OSSD A load + OSSD B load + Auxiliary output load + Warning output load + Functional Inputs). Where functional inputs are: EDM input ... 50 mA Start input ... 20 mA Standby input ... 5 mA Zone X input ... 5 mA x 8 (eight zone set select inputs)*4.Output voltage is Input voltage - 2.0 VDC.*5.Total consumption current of 2 OSSDs, auxiliary output, and warning output must not exceed 700 mA.*6.Output polarity (NPN/PNP) is configurable via the configuration tool.*7.An ethernet cable with an M12, 4-pin connector is required.Connecting to the Controller G9SA-301Category 3, Performance Level d (ISO13849-1)*e NC-contact for a start input.*3.If the External Device Monitoring is not used, connect brown/white wires to 0V, and then turn OFF the External Device Monitoring with the config-uration software.*4.For zone select switch setting, refer to OS32C Series User’s Manual.Note:This wiring example is for category 3.DimensionsOS32C with Back Location Cable Entry - OS32C-BP/OS32C-BP-DMOS32C with Side Location Cable Entry - OS32C-SP1/OS32C-SP1-DMDust Back ViewFirmware and Configuration Tool Features and CompatibilityRefer to the table below for supported features and compatibility with OS32C versions. Refer to the product labels to determine the OS32C version.Note:•Only the version of the sensor block and the configuration tool were updated to support the new features. No changes were made to the I/O block.•The window replacement kit OS32C-WIN-KT can be used on any sensor block.OS32C-SN: 40591-0010 (old), 40591-0020 (current)OS32C-SN-DM: 40591-0040 (current)OS32C-SN-4M: 40603-0020 (current)OS32C-SN-DM-4M: 40603-0040 (current)OS32C VersionOS32C-DM OS32C-4M OS32C-DM-4M 40591-001040591-002040591-004040603-002040603-0040Configurable minimum object resolution –Supported Supported Supported Supported Standby mode with laser shutoff –Supported Supported Supported Supported Copy & paste zones and zone sets –Supported Supported Supported Supported Record system monitoring –Supported Supported Supported Supported Playback system monitoring–Supported Supported Supported Supported Support for inverting 7-segment display –Supported Supported Supported Supported Display configuration filename in config toolheader–Supported Supported Supported Supported Additional zone shapes (180︒ semi-circle, 180︒ rectangle, 180︒ polygon)–Supported Supported Supported Supported Config tool support for switching between de-fault OS32C configuration and the user's currentworking configuration–SupportedSupportedSupportedSupportedTroubleshooting tips displayed in fault log –Supported Supported Supported Supported Configuration checksum, safety checksum Supported *1*1.Requires Configuration Tool Version 1.4.0 and up Supported *1Supported *1Supported *1Supported *1Windows 7 support –Supported Supported Supported Supported Non-safety checksumSupported *2*2.Requires Configuration Tool Version 1.6.0 and upSupported *2Supported *2Supported *2Supported *2Single Import & Export Zone Coordinate Data Supported *2Supported *2Supported *2Supported *2Supported *2Maintenance access level –Supported *3*3.If serial number of the sensor block is higher than AS08300 and Configuration Tool is version 1.6.0 and up Supported *2Supported *2Supported *2Rotation of monitor screen viewSupported *4*4.Requires Configuration Tool is Version 1.8.0 and upSupported *4Supported *4Supported *4Supported *4French, German, Italian & Spanish Languages Supported *4Supported *4Supported *4Supported *4Supported *4Multiple Import & Export Zone Coordinate Data Supported *4Supported *4Supported *4Supported *4Supported *4EtherNet/IP and Measurement Data ––Supported –Supported Pollution Tolerance Mode –Supported *5*5.If serial number of the sensor block is higher than AS15500 and Configuration Tool is Version 2.0.0 and up Supported *5Supported *6*6.Requires Configuration Tool is Version 2.0.0 and upSupported *6Variable response time settings –Supported *5Supported *5Supported *6Supported *64 meter safety/ 15 meter warning zone –––Supported *6Supported *6Status information during monitor mode –Supported *5Supported *5Supported *6Supported *6Global Confirmation of Safety parameters –Supported *5Supported *5Supported *6Supported *6EtherNet/IP Warning zone change capable––Supported *5–Supported *6Configuration Tool Versionbefore 1.4.0 1.4.0 and up 1.6.0 and up 1.8.0 and up 2.0.0 and up Configurable minimum object resolution–Supported Supported Supported Supported Standby mode with laser shutoff–Supported Supported Supported Supported Copy & paste zones and zone sets–Supported Supported Supported Supported Record system monitoring–Supported Supported Supported Supported Playback system monitoring–Supported Supported Supported Supported Support for inverting 7-segment display–Supported Supported Supported Supported Display configuration filename in config toolheader–Supported Supported Supported SupportedAdditional zone shapes (180︒ semi-circle,180︒rectangle, 180︒ polygon)–Supported Supported Supported SupportedConfig tool support for switching between defaultOS32C configuration and the user's current work-ing configuration–Supported Supported Supported SupportedTroubleshooting tips displayed in fault log–Supported Supported Supported Supported Configuration checksum, safety checksum–Supported Supported Supported Supported Windows 7 support–Supported Supported Supported Supported Non-safety checksum––Supported Supported Supported Single Import & Export Zone Coordinate Data––Supported Supported Supported Maintenance access level––Supported Supported Supported Rotation of monitor screen view–––Supported Supported French, German, Italian & Spanish Languages–––Supported Supported Multiple Import&Export Zones Coordinate Data–––Supported Supported Pollution Tolerance Modes––––Supported Variable response time settings ––––Supported4meter safety/15meter warning zone––––Supported Status information during monitor mode ––––Supported Global Confirmation of Safety parameters ––––Supported EtherNet/IP Warning zone change capable––––SupportedModel Sensor Head P/NConfiguration Tool Versionbefore 1.4.0 1.4.0 and up 1.6.0 and up 1.8.0 and up 2.0.0 and upOS32C-SN40591-0010Supported Supported Supported Supported SupportedOS32C-SN40591-0020–Supported Supported Supported SupportedOS32C-SN-DM40591-0040––Supported Supported SupportedOS32C-SN-4M40603-0020––––SupportedOS32C-SN-DM-4M40603-0040––––SupportedIn the intere s t of product improvement, s pecification s are s ubject to change without notice. Cat. No. Z298-E2-05-XOMRON EUROPE B.V.Wegalaan 67-69,NL-2132 JD, Hoofddorp,The NetherlandsPhone:+31 23 568 13 00Fax:+31 23 568 13 88industrial.omron.eu。
VESDA产品技术手册
威士达(VESDA)空气采样早期预警系统特性:主动抽取气样,既克服了被动等待和空气流动的影响,又赢得了时间。
激光探测,灵敏度高,可以探测到不可见烟,在形成火灾之前很长时间提供多级预警。
管网布置灵活,既可以根据实际情况确定采样点,又可以提供全面的综合保护。
具有专利保护的独特结构,抗灰尘、抗干扰,避免误报警。
网络功能强,便于集中监控,既可以联成本地网VESDAnet,又可以通过电信公用网络或局域网,实现集中监控。
18000个历史纪录,方便查找火警和故障原因。
自学习,自适应,自动设置报警阈值。
自清洗系统光学部件,保证系统长期稳定的运行。
概述威士达(VESDA)极早期火灾报警系统是澳大利亚VISION公司在二十世纪七十年代研制出来的,并迅速占领了全球市场。
1998年,VISION公司推出了全新产品——VESDA激光加强型(LaserPLUS)早期烟雾探测系统,使其在空气采样式烟雾探测产品上又向前迈出了大大的一步。
2000年以来,根据市场发展的需要,VISION公司不断推出新的产品满足用户的不同需求。
威士达(VESDA)极早期火灾报警系统以其先进的技术和优秀的品质赢得了声誉,坚定了VISION公司在世界上的领先地位。
威士达(VESDA)通过灵活的管网系统主动抽取空气样品,克服了保护区空气流动的影响;使用激光探测烟雾,具有超高灵敏度,能够探测出火灾发生初期的不可见烟,达到早期预警的目的;威士达(VESDA)采用独创的灰尘过滤技术、识别技术及人工神经网络智能技术判别火灾,避免了误报警。
威士达(VESDA)集创新的硬件技术与智能的软件技术于一身,以其独特的原理、卓越的性能,成为当今世界最理想的极早期火灾探测系统。
主机组成及工作流程威士达(VESDA)主机内有抽气泵、气流传感器、激光探测腔、数据处理板等。
系统在高效抽气泵的作用下,通过伸向保护区的管道网络连续不断地抽取空气样品,气样首先经过过滤器,将灰尘滤掉,然后进入激光探测腔,在探测腔内特定的位置上安装有激光源及接收器,激光源发出的光束照射到空气样品上,如果有烟粒子存在,光束将产生散射,光接收器接受散射的光信号。
Compact Omnidirectional Laser Scanner 说明书
590-66010E-201No warranty of any kind is made in regard to this material, including, but not limited to, implied warranties of merchantability or fitness for a particular purpose. We are not liable for any errors contained herein or incidental or consequential damages in connection with furnishing, performance or use of this material.No part of this document may be reproduced, transmitted, stored in a retrieval system, transcribed, or translated into any language or computer language in any form or by any means electronic, mechanical, magnetic, optical, chemical, manual or otherwise, without express written consent and authorization.We reserve the right to make changes in product design without reservation and without notification. The material in this guide is for information only and is subject to change without notice.All trademarks mentioned herein, registered or otherwise, are the properties of their various respective owners.Copyright © 2006. All rights reserved.Radio NoticeThis equipment generates uses and can radiate radio frequency energy. If not installed and used in accordance with the instructions in this manual, it may cause interference to radio communications. The equipment has been tested and found to comply with the limits for a Class A computing device pursuant to EN55022 and 47 CFR, Part 2 and Part 15 of the FCC rules. These specifications are designed to provide reasonable protection against interference when operated in a commercial environment.Radio and Television InterferenceOperation of this equipment in a residential area can cause interference to radio or television reception. This can be determined by turning the equipment off and on. The user is encouraged to try to correct the interference by one or more of the following measures:Reorient the receiving antenna.Relocate the device with respect to the receiver.Move the device away from the receiver.Plug the device into a different outlet so that the device and the receiver are on different branch circuits.If necessary the user may consult the manufacturer, and authorized dealer, or experienced radio/television technician for additional suggestions. The user may find the following booklet prepared by the Federal Communications Commission helpful: “How to Identify and Resolve Radio-TV Interference Problems.” This booklet is available from the U.S. Government Printing Office, Washington, DC 20402 U.S.A., Stock No. 004000003454.For CE-countriesThis scanner is in conformity with CE standards. Please note that an approved, CE-marked power supply unit should be used in order to maintain CE conformance.Laser SafetyThe laser scanner complies with safety standard IEC 60825 -1for a Class I laser produce. It also complies with CDRH as applicable to a Class IIa laser product. Avoid long term staring into direct laser light.Radiant Energy: The laser scanner uses one low-power visible laser diodes operating at 650nm in an opto-mechanical scanner resulting in less than 3.9μW radiated power as observed through a 7mm aperture and averaged over 10 seconds.Do not attempt to remove the protective housing of the scanner, as unscanned laser light with a peak output up to 0.8mW would be accessible inside.Laser Light Viewing: The scan window is the only aperture through which laser light may be observed from this product. A failure of the scanner motor, while the laser diode continues to emit a laser beam, may cause emission levels to exceed those for safe operation. The scanner has safeguards to prevent this occurrence. If, however, a stationary laser beam is emitted, the failing scanner should be disconnected from its power source immediately.Adjustments: Do not attempt any adjustments or alteration of this product. Do not remove the protective housing of the scanner. There are no user-serviceable parts inside.Caution: Use of controls or adjustments or performance of procedures other than those specified herein may result in hazardous laser light exposure. Optical: The use of optical instruments with this product will increase the eye hazard. Optical instruments include binoculars, magnifying glasses, and microscopes but do not include normal eye glasses worn by the user.Table of Contents Introduction (1)Unpacking (2)Outline (3)Scanner (3)Stand (4)Connecting (5)Power (5)Verifying Scanner Operation (5)Connecting to the Host (6)Setting Up the Scanner (7)ScanTest (7)up (7)SetOperating the Scanner (9)ScanMode (9)Single-lineMode (10)PresentationIndications (11)LEDBeeps (12)Mode (13)SleepChange Beep Volume Using Function Button (13)Maintaining the Scanner (14)1. InstructionThe scanner is a compact hands-free omnidirectional laser scanner, and becomes a single-line laser scanner by pressing down a button. It is designed to suit both requirements for omnidirectional and single-line scanning. With the reserved mounting holes at the back of the scanner body, The scanner transforms to a scanning module to allow integration into your desirable hardware application.The Scanner is cubic designed as compact as it can be, and with its standard holder, it certainly saves the maximum counter top space. Featured with Z-scan hardware decode technology, it guarantees the real-time decode and provide the best scanning performance you could expect. The Scanner surely has the performance inverse to its size.The scanner includes key features as,Button switch in between omnidirectional and single–line scanning capability, ideal for increasing your operating efficiency.Powerful 20-line scan pattern yields1400 scans per second for omnidirectional scanning74 scans per second for single-line scanningImplement with the proprietary real-time hardware decoding technology that ensures instant recognition and decoding barcodesInstant working is ready, or can be embedded into other hardware applications via mounting holes atback.Optional 3D turning cradle with two joins that maximize the range of adjustment2. UnpackingThe handheld omnidirectional scanner package contains:1 ea. Compact omnidirectionalscanner1 ea. Scanner stand1 ea. Screw (to fix the standwhen necessary)1 ea. Adjustable stand(optional)1 ea. Communication cable1 ea. Power adapter (only forspecific RS-232 cables)1 ea. User’s manualIf any contents are damaged or missing, please contact your dealer immediately.Please leave this user’s manual within easy access of person using the scanner.3. Outline3-1 ScannerDescriptionFunction Exit WindowReads barcodes Object Detector Trigger and wake up scanner whenpresenting barcode in its rangeBeeper Hole For beep tone indicationWake up scanner When the scanner enters into the sleepmode, pressing this switch can wakethe scanner up. The sleep modefeature can be programmed using themenu labels from the ProgrammingGuide.NOTE: The default time-out value isset to 10 minutes after laser slept, 30minutes after motor slept. When thescanner is in sleep mode, the LED isintermittently flashing Blue.Function ButtonSingle -line patternPick up the scanner, press and releasethe trigger will active single line scanmodeBack Mount Holes To fix the scanner with your hostinstrument.Interface Cable Connection For interface communication cable connection.3-2 StandThe stands are both designed with a fixing hole, use appropriate screws enclosed in package to fix the stands on surface if necessary.Fixed StandScrew Size:Sharp screw, M4-16.0mm,Cross shapeAdjustable StandScrew Size:Sharp screw, M5-16.0mm,Cross shapeAdjustable height illustrate as below,4. Connecting4-1. PowerThe scanner requires a minimum of 2.5W at 5 VDC power. The interface cable that comes with the scanner supports both direct power (where the scanner takes power from the host machine) and external power (that’s what the supplied power adapter is for). A sufficiently robust POS system can support a scanner successfully without external power;a POS system with a barely adequate power supply may produce erratic performance (either of the POS system itself, or of the scanner, or both) when a scanner is attached. Unless you are sure your POS system can candle such loading, it is recommended that you use the supplied power adapter. When an external adapter is connected, the scanner does not take power from the host.The scanner turns on when power is supplied, and turns off when power is removed. There is no on/off switch on the scanner itself.Use only an AC/DC power adapter approved for the scanner. Use of other power supplies may cause damage to the scanner, and void the factory warranty.4-2. Verifying Scanner OperationPlease follow the procedure below to verify scanning operation.1. Insert the 8 pin modular plug of the Interface cableinto the scanner until a firm click is heard.2. Plug the power adapter into the jack on Interfacecable if necessary.3. Plug the AC end of the power adapter into an ACoutlet, or plug the other end of cable into host ifpower adapter is not needed. The scanner powersup, the buzzer sounds four beeps and the LEDindicator glows.4. Present a known-good test barcode to the scanner.The scanner should issue a short beep and the LEDshould flash red momentarily. [if the scanner isconnected to a USB for this test, it should read onebarcode, beep, then remain with a red LED indicatinglight. This is normal when the USB is not connectedto a live host terminal.]Note: if the scanner does not produce any beeps, or produces the wrong beeps, or the LED does not light up, remove the power connection and refer to the section on Troubleshooting.4-3. Connecting to the HostThe interface cable comes with different host-end connectors, depending on the host. Follow the steps below to connect the interface cable to the host.1. Make sure that the power of the host system is off.2. Connect the host end of the interface cable to theappropriate connector on the host system.3. For those cases where external power is used, plugthe external AC power adapter into the jack on theinterface cable.4. Turn on the host system.5. Setting up the ScannerIn certain cases no setup is required. The scanner is either pre-programmed to suit the situation, or it automatically detects and is ready to go. In other cases the scanner must be informed about what kind of system it is connected to. This can be done in a few moments using the programming barcodes enclosed in the later sections of this booklet.The programming section may be used to set a number of parameters on the scanner: communication interface type (RS-232, Keyboard, USB), beep tone, sleep mode timings, same-code delay time, enable/disable decoding of numerous code types, and more advanced things like set headers and trailers.Individual parameters may be set at any time without affecting the other parameters.5-1. Scan Test1. With the scanner running (LED blue) and the hostsystem on, try to scan several known-goodbarcodes.2. Check the results on the POS screen. If thescanner is reading okay, no further setup may benecessary.3. If the POS screen does not show the expected scans,go to Set Up, below.5-2. Set UpWhen the scanner is powered on (LED blue), present the <Enter/Exit programming mode> barcode, found in the programming section, to the scanner. The scanner gives two beeps: low and high, and the LED turn red. Thescanner is in programming mode.Decide which parameters are required and find their barcodes in the programming section.Cover unwanted codes with your hand and present the desired codes, one by one, to the scanner, the scanner beeps once as it accepts each code.When done, again present the <Enter/Exit programming mode> barcode. The scanner beeps twice, once long and once short, and the LED returns to blue. The scanner has been programmed.Test again with known-good barcodes. If results are good, you are done setting up. Otherwise, return to step 1 and try again.6. Operating the ScannerThe scanner can read barcodes in either omnidirectional or single-line mode to accommodate different requirements. This scanner is truly omnidirectional while single-line mode is usually used for better aiming on the specific barcode on the same sheet of more than one barcode printed closely.6-1 Single Line Scan ModeIn this mode the scanner can emit a single line pattern for user to handheld scanning of hard to read or multiple barcodes on one object, sales clerks could switch it to single line scan option simply by pressing one button.Button1.Pick up the scanner 2. Press and then release the top button, a line patternappears, it allows you to aim at the barcode.Ensure the scan line crosses every bar and space ofthe symbol.3.Press the button to decode and transmit the barcode, the good read beeps once.¾If the button is released, it automatically switch back to omnidirectional scan in 5seconds. Press down again to switch tosingle-line scan when necessary.6-2 Presentation ModeAs if the scanner is on the stand, the scanner will always stay active in Presentation Mode. In other words, the scanner always has multi-lines, and will not switch to6-3 LED IndicationsA dual color red-blue LED indicates operating status as follows:Off No power supplied to the scanner Steady blue light The scanner is on and ready toscanOne red flash A barcode has been successfullydecoded.Steady red light A barcode has been successfullydecoded, but the object is notremoved from the scan window.The scanner is in programmingmode.Flashing blue light The scanner is in sleep mode.Steady Purple light This indicates the scanner has a motor or laser failure. For motor failure, a periodic beep is sounded. Return the unit for repair.Alternate flashing red and blue light The scanner detects failing power. Please check the power supply.6-4 BeepsA beeper gives audible feedback on scanner operation.One beep A barcode has been successfullydecoded.Four beeps in series This indicates the scanner passed the power on self-test and is operating properly.Two beeps: low-high The scanner has entered programming mode.Two beeps: same tone Scanner has returned from programming to normal mode.Continuous tone This is a failure indication. Returnthe unit for repair.6-5 Sleep ModeAfter the scanner has been inactive for a period of time, the laser automatically turns off; then the motor will turn off and the scanner will enter into “Sleep Mode”, the blue status LED blinks once as indication. To wake up the scanner, simply present an object close to the exit window, or press the trigger button.Note: The scanner includes a motion sensor that detects activity in front of the scan window. The detecting distance is up to about 15cm (6 inches) from the scan window,6-6 Change Beeper Volume Using Function ButtonThe beep tone, volume and duration are programmable. And the beep volume is adjustable by pushing the function button.The volume has 3 different levels, low, medium, loud, follow the following steps to tune the volume.1. Always keep the scanner in the stand2. Press and hold down the function buttons for about 3seconds, the scanner will enter (medium—low---loud)beeper cycle, every level of setting beeps twice.3. Release the button when you hear the right beeps.4. The scanner beeps accordingly.Note:The volume setting is not saved in non-volatile memory. In words, the change will lost by powered-off and reset to the configured setting.If you wish to keep the changed the volume setting, use the programming guide to set the changes.7. Maintaining the ScannerThe scanner is designed for long-term trouble-free operation and rarely requires any maintenance. Only an occasional cleaning of the scanner window is necessary in order to remove dirt and fingerprints.7-1. Cleaning the Scan WindowWipe the scan window with a soft lint-free cloth and a non-abrasive cleaner to avoid scratching and damaging the scan window. The scan window may be cleaned while the scanner is running.7-2. Replacing the Interface CableThe standard interface cable is attached to the scanner with an 10-pin modular connector. When the connector is properly seated, it is secured in the scanner by a flexible retention tab. The cable is designed to be field replaceable.Replacement cables can be obtained from your authorized distributor.To replace the cable, take the following steps.1. Make sure that the power of your computer isswitched off, and if a power adapter is used,disconnect it from the scanner cable.2. Disconnect the old scanner cable from the computersystem.3. Press down at where indicated below, and gently pullout the cable.4. Insert the new interface cable into the bottom of thescanner until it clicks.5. Plug the new cable into the host.6. If a power adapter is used, plug the power adapterinto the jack on the interface cable.Gently pull out the cable this direction。
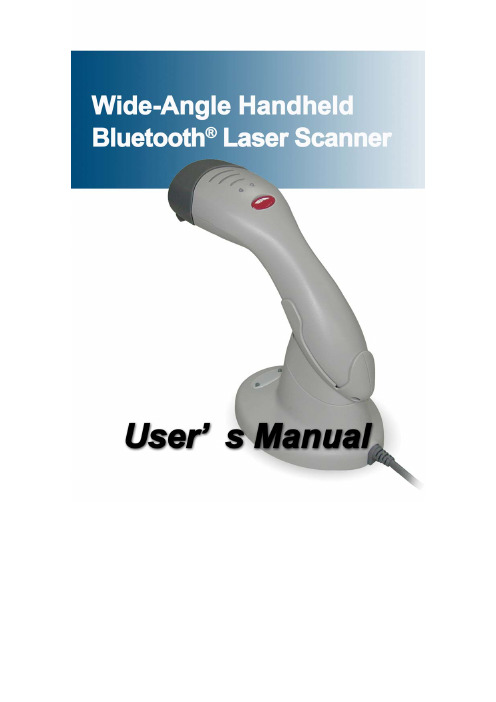
Wide-Angle Handheld Bluetooth Laser Scanner 说明书
2ZEBEX是巨豪实业股份有限公司的注册商标,本手册中提到的其余商标都属于相应公司所有。
本手册的内容可能会被更改或更新而不另行通知,本手册所提供的信息也可能不够准确,ZEBEX公司对此不承担任何法律责任。
版权所有,未经ZEBEX公司授权不得转印、复制或出售本文档的任何内容,本手册最终解释权归ZEBEX公司所有。
版本号:2007注意:此扫描枪有时会产生无线电射频能量,如果没有按照本手册的指南进行安装和使用,有可能会造成对无线电通信的干扰。
此设备已被测试并达到了A级计算机安全设备标准(EN55022和47 CFP的第2及第15部分)。
这些设计使产品在使用过程中尽量避免对商业环境造成无线电干扰。
对广播电视的影响在居民区使用本扫描枪时,可能会干涉广播电视的信号接收。
使用者可以通过开启和关闭扫描枪来判断是否干涉,并可以通过采取以下措施来消除干涉:重新设定天线方位改变扫描枪和广播电视接收器的相对位置增加扫描枪和广播电视接收器的距离让扫描枪和广播电视接收器在不同的电源分支线路上如果有必要,用户也可以向厂商,授权代理商,或者有经验的无线电技师请教其它的一些建议,用户也可以从由FCC提供的“怎样鉴别和解决无线电干涉”这本书中得到帮助,这本书可以从the U.S. Government Printing Office, Washington, DC 20402 U.S.A.得到,货号004000003454.CE标准:此扫描枪完全符合CE标准。
但请特别注意采用带有CE认证标志的电源,确保CE一致性。
i激光安全Z-3051BT遵从IEC 60825激光产品安全标准,也遵从CDRH标准,符合IIa级激光产品的要求,但应避免被激光长时间直接照射,特别不应直接照射眼睛。
辐射:Z-3051BT采用低辐射激光二极管,在平均大于10秒间隔,650nm光源系统通过一7mm的光孔产生低于3.9μW辐射。
不要尝试拆除扫描枪的外壳,没有外壳及防尘片保护的雷射光很可能产生0.8mW以上的高辐射。
Laser Scanner Super-resolution

Eurographics Symposium on Point-Based Graphics(2006)M.Botsch,B.Chen(Editors)Laser Scanner Super-resolutionYong Joo Kil1and Boris Mederos2and Nina Amenta11Department of Computer Science,University of California at Davis2Instituto Nacional de Matematica Pura e Aplicada-IMPAAbstractWe give a method for improving the resolution of surfaces captured with a laser range scanner by combining many very similar scans.This idea is an application of the2D image processing technique known as super-resolution.The input lower-resolution scans are each randomly shifted,so that each one contributes slightly different information to thefinal model.Noise is reduced by averaging the input scans.Categories and Subject Descriptors(according to ACM CCS):I.3.3[Computer Graphics]:Surface AcquisitionLaser range scanners are used to capture the geometry of three-dimensional objects.They are used for reverse engi-neering manufactured objects,and for digitizing objects of scientific,artistic or historical importance for archiving and analysis.Like all physical measurement devices,laser range scanners have limitations,including noise and limits on res-olution.We describe a method for acquiring better models using a commercial laser range scanner by taking many al-most,but not quite,identical scans and combining them in software.For instance,in Figure2,we combined100nearly identical scans like the one on the the left to create the cleaner and more detailed surface in the center.Our technique is a variant of a two-dimensional image processing technique called super-resolution,which takes many nearly identical low-resolution input images and com-bines them to produce a higher-resolution output image. Classical super-resolution is based on the assumption that each pixel in the low-resolution input images is produced from an original continuous image by deforming(possibly just translating),blurring and then sampling.If the blur func-tion is a perfect low-passfilter,then all high-resolution in-formation is irrevocably lost.But if not,then the resulting aliasing in the low-resolution images contains information, and a higher-resolution output can be recovered from enough slightly displaced input images.In its simplest form,this idea is obvious.Consider sam-pling a signal at some rate less than its Nyquist frequency (the rate at which all features can be captured without alias-ing).One set of samples is not sufficient to reconstruct the signal.But if we are given many samples,randomly offset from each other,and we can register them correctly,then we can produce an accurate reconstruction.See Figure1.We apply this simple idea to laser range scanning verydirectly.Figure1:Left:If a scan samples the surface too sparsely, detail is lost.The Nyquist theorem implies that we can only expect to capture details of size at least x if we scan with a sample spacing of x/2.Right:When we combine several scans(different shades),we can recover much more detail.Combining many scans is also useful for removing noise. Noise in the depth images from laser range scans comes from several sources,including quantization and noise in the video imaging system,laser speckle(caused by random reinforcement of the coherent light of the laser reflected from a rough surface),systematic error in peak detection (caused by surface curvature and color),and the instability of the computation of point locations by triangulation.Ran-dom noise can be essentially eliminated,but super-resolution does nothing for systematic scanner errors. Obviously,it is much more time consuming to take a hun-dred scans than it is to take one.In high-value situations,c The Eurographics Association2006.Figure2:On the left,one scan of the the parrot statue,with a sample spacing of about1mm.Center,we combine100nearly identical such scans to produce the surface in the center,produced on a grid with sample spacing of about0.3mm.Notice the noise reduction and the improvement in the detail,for instance in the face,neck and wing feathers.On the right,a photograph of the parrot statue.however,for instance when an expert hasflown thousands of miles to scan a fossil or a coin in a museum,it would be worth it to spend an hour,or even a few hours,scanning in order to get a better model.Our technique also gives an alternative approach for capturing high-resolution models of large objects.Instead of capturing many high-resolution scans,each covering a small area,and then registering them,we can capture many (slightly shifted)low-resolution scans covering a larger area,and then merge them to produce a single large high-resolution surface patch.This technique has two advantages. First,it avoids having to merge many small scans,which is difficult to do accurately.Second,it means that the scanner can be kept farther away from the object,and moved less, which might be necessary or desirable.Algorithm Overview:We scan a model many times,from similar but randomly perturbed viewpoints.We get an initial registration of the scans to each other,and we use the reg-istered scans to reconstruct the super-resolved depth-map. We get the depth value at every point of a higher-resolution grid by simply averaging the z-values of nearby points from the input scans.We then re-register each scan to the super-resolved depth-map,and iterate the reconstruction and reg-istration steps several times.Finally we output the super-resolved depth-map.1.Related WorkLaser range scanners:Producing better models from laser range data is a topic of on-going interest in computer graph-ics and computer vision.Curless and Levoy[CL95]give an excellent description of the scanning process.With a scanner such as our Minolta Vivid910,a vertical stripe of laser light is moved across the object surface,and captured by a video camera.Along each horizontal scan line of the video frame, the brightest spot is taken to be the point at which the laser stripe"hits"the surface.This brightness peak is detected at sub-pixel resolution.The relative positions of the laser and the video camera are used tofind the three-dimensional co-ordinates of the brightest spot by triangulation.So,the x-coordinate of each point in the output depth image is de-termined by the position of the laser stripe for a particular video frame,the y-coordinate corresponds to a raster line in the video frame,and the depth value is computed from the brightness peak detected along the raster line in the video frame.This imaging process is more complex than that of a cam-era,and it introduces systematic artifacts.Curless and Levoy removed many of these,and reduced noise,by analyzing multiple frames of the video stream when detecting each peak point.Their technique is intended to be part of the processing within the scanner.We concentrate on improving noise and resolution at the user level,taking the output data from the device and trying to improve it by post-processing.c The Eurographics Association2006.Recently Nehab et al.[NRDR05]combined surface data from a temporal stereo triangulation scanner with normals captured by photometric stereo,to improve the resolution and reduce the noise in captured surface models.Similary, Diebel and Thrun[DT05]improve models captured with a time-of-flight scanner using digital photographs.Rather than combining different data types,we explore combining lots of scans.Our reconstruction method is related to Curless and Levoy’s VRIP algorithm[CL96],with one crucial differ-ence.They treat each input scan as a triangle mesh,with the intention of getting as much coverage as possible.Interpo-lating the scans by triangles is a form of low-passfiltering, and high-resolution detail is lost,or at least greatly obscured. Instead,we treat each scan as a set of points,making it much easier to reconstruct a higher-resolution surface.Super-resolution:Our method is derived from two-dimensional super-resolution algorithms.See[PPK03]for a recent survey.Most algorithms use two basic steps,sub-pixel registration and reconstruction.Neither step translates com-pletely straightforwardly into our context.Reconstruction is usually the more complex step,and is a large focus of our re-search.It is based on the assumption that,given the correct registration,each low-resolution input image is formed from some"true"high-resolution image by a known process:first the"true"image is translated slightly(or displaced in some other way),then it is smoothed with a blurring kernel(e.g.a boxfilter),then it is sampled at the lower resolution,and finally random noise is introduced.Elad and Feuer[EF97] argue that most methods can be represented by the follow-ing matrix equationY=HX+Ewhere Y is a vector containing all the low-resolution images, H is a known matrix that contains the displacement,blur-ring and sampling steps of the image formation process de-scribed above,X is the desired high-resolution image,and E is an unknown vector of noise terms.This basic model can be enhanced with priors on the error terms and/or reg-ularization terms on the high-resolution pixels to encour-age smoothness.A least-squares solution,minimizing E t E is formulated in the standard way,and the problem comes down to solving a huge sparse linear system to recover X, which in practice are solved using an iterative methods.An ideal super-resolution algorithm for laser range data would be based on a matrix H which correctly models the triangulation laser range scanner.This seems difficult since the peak-detection process is not a linear operation.Instead, we assume an admittedly incorrect but linear process:trans-lation and down-sampling,with no blur operation.The main advantage of this assumption is that it leads to a very sim-ple and efficient reconstruction algorithm.The alternative assumption,that nearby depth values are averaged by the peak-detection process,is also clearly incorrect(and so far in our research,has not produced better results).Our simple reconstruction algorithm is based on an ar-gument by Elad and Hel-Or[EHO01],in which they point out that in very easy cases,the correct solution for X can be found by interpolating the values in Y onto the grid of values for X.We discuss their argument as it applies to our case in Section5.It is very similar to the splatting-interpolation pro-cess for surface reconstruction from laser range scans used in VRIP[CL96],which Curless similarly showed it minimized the least-squares error in his thesis[Cur97].The large-scale structure of our algorithm is in-spired by the super-resolution algorithm of Cheeseman et al.[CKK∗96],in which after producing a super-resolution image,each input image is then re-registered to the super-resolution output,and the process is iterated.This gives us the opportunity to improve the registration using high-resolution features which are not detectable in any of the low-resolution inputs.2.Data AcquisitionWe take around100scans of each view of the object.To create random displacements between scans,we move the entire scanner on its tripod before each scan,by nudging its x and y panning knobs(±5◦).This is a laborious process, requiring30-60minutes of scanning for each view.It would also be possible to move the object slightly before each scan, instead of moving the scanner,possibly by using an auto-matic turntable.For the Mayan hieroglyphic model in Figure10,we also rotated the tablet after every ten scans.This reduced"tiling" artifacts caused by interaction between the low-resolution and high-resolution grids,as discussed in Section6.We used the Geomagic Studio[Geo03]software to clean up the scans,removing pieces of surrounding objects and supports.This is a normal part of the3D scanning pipeline. The scans could be manipulated altogether as a group,so this stage is not more time consuming than usual.We also used Geomagic’s registration tool to produce an initial registra-tion of the scans,choosing an arbitrary scan and registering all the others to it.This registration is improved by the later super-resolution processing.Our goal is to capture enough three-dimensional points so that at least a few scan points contribute to each high-resolution output point.To get a ball-parkfigure,assume that we want to improve the resolution by an integer fac-tor m(such as four),and assume that the displacements are simply translations of the low-resolution grid with respect to the high-resolution grid.Then if we consider an arbitrary m×m square of high-resolution cells,each low-resolution scan contributes one point to the square,which lands ran-domly in one of the cells.A scan misses each specific cell with probability(1−1/m2),so the probability that any of the m2cells end up with fewer than,say,five points after we take k scans is≤m2(1−1/m2)(k−5).Then k,the numberc The Eurographics Association2006.of scans needed,grows as O (m 2lg m ),and,to give a specific example,if m =4and we want the failure probability to be <0.1,we need about 150scans.In fact we usually use fewer.While increasing the number of scans improves the quality of the surface -see Figure 3-it seems indeed to do so onlyslowly.Figure 3:Super-resolution reconstruction using only 30in-put scans at the left and increasing to 140at the right.Noise is reduced dramatically at the beginning but more slowly at the end.Surfaces were reconstructed from subsets which were pre-registered using all 140scans.3.ReconstructionOur reconstruction algorithm is very simple.We produce an output depth-map as a grid of function values,each com-puted as a weighted average of the contributions of nearby points from the input scans.We first establish a coordinate system in which the z -direction (depth)is the direction towards the scanner,by adopting the coordinate system of an arbitrarily chosen in-put scan.We create a grid of the desired resolution in the x −y plane of that coordinate system,and locate each of the scanned input points in the grid,based on the current reg-istration.Then for each high-resolution cell with center q we create an output depth value.We use a two-dimensional Gaussian kernel centered on q to assign weights w (q ,r i )to the input points r i in cells within the surrounding 5×5neighborhood N ,based on their x −y positions.Then we take the weighted average of their depth values.z (q )=∑r i ∈N z (r i )·w (r i ,q )∑r i ∈N i ,q )The width h of the Gaussian kernel e −d (r i −q )2/h 2is set to thesample-spacing of the grid,so that points outside of the 5×5neighborhood have negligible weight.The sum is dominated by the points within the 3×3neighborhood,and when m >3(as in all our experiments)this neighborhood can contain at most one point from each scan.We experimented with using the median (which is more robust to outliers)rather than the weighted mean,andweFigure 4:A thin strip of the super-resolved surface,and the nearby sample points from the input scans.The input is very noisy,but the points are densely and randomly distributed near the surface with few outliers,so the average gives an accurate representation of the surface.did not see any noticeable difference in the output.As seen in Figure 4,the noise seems fairly evenly distributed near the surface,and outliers are not much of a problem,so a least-squares model is probably best.The Gaussian weights provide some smoothing as part of the interpolation,but the resulting surface still shows some noise,as in Figure 5.We follow the reconstruction by ap-plying a bilateral filter [TM98],removing some noise while retaining sharpfeatures.Figure 5:A close-up of the reconstruction of the parrot-head model before bilateral filtering (left)and after (right).We re-scanned the head of the parrot,with a sample spac-ing of about .4mm in the input scans,and reconstructed the super-resolution surface from 146scans.The entire surface appears in Figure 11.4.RegistrationWe iterate reconstruction of the surface with re-registration of each scan to the high-resolution surface.We use the following variant of the Iterated Closest Point (ICP)algo-rithm [BM92,RL01]to register a scan to the surface.First we subsample the triangles of the high-resolution surface,distributing samples in the interior of each triangle.Then for each point in the scan,we find its closest point in the dense set of samples on the surface.Points near boundaries,either on the scan or on the surface,are ignored.We use Horn’s algorithm [Hor87]to minimize the mean-squared distance between the point pairs,and iterate until convergence.WecThe Eurographics Association 2006.see an example of the improvement produced by registering each scan to the high-resolution surface in Figure 6.Figure 6:Left,a close up of the initial super-resolution mesh,for which the scans are only registered to each other.Right,after one iteration in which the scans are registered to the high-resolution surface.Notice that the "tiling"arti-fact typical of mis-registration is reduced.We see the most dramatic improvement in this first step.5.Least-Squares ApproximationAs noted in Section 1,averaging minimizes the error in a least-squared sense,which corresponds to a maximum-likelihood estimate of the surface,assuming the errors in the z -direction are Gaussian noise.Here we review the ar-gument of Elad and Hel-Or [EHO01]which makes this as-sertion precise under some assumptions that are not strictly met in practice,but which are a good rough approximation.Our set-up is somewhat different from theirs in that we as-sume there is no blur operation.This allows us to drop one of their assumptions that the deformations used to form their input images are all translations in the x −y plane,but we can allow rotations as well.The raw input scans are represented as column vec-tors {Y 1,...,Y L }with dimensions n ×1,where n =width ×height .The high-resolution depth-map is represented as a column vector X of dimension N ×1,where N = width ·m × height ·m .Based on our assumption that there is no blurring and as-suming that the range scans are obtained by random rigid motions,the creation of the low resolution scans Y k ,k =1,...,L from an unknown high-resolution depth-map X could be explained by the following linear model:{Y k =D k F k X +E k }k =1,...,L(1)The matrices D k ,F k ,E k represent a known decimation,a known displacement,and an unknown Gaussian error vector,respectively.What we want to find is a high resolution Xsuch that E =∑L k =1E tk E k is minimized.Expressing E as a function of X and setting the derivative of d (E )/dX =0,we get a linear systemRX =P(2)where R =∑L k =1F t k D t k D k F k and P =∑L k =1F t k D tk Y k .Gen-erally,in super-resolution algorithms,the linear system is solved via an iterative method such as steepest descent.Following Elad and Hel-Or,we make the following addi-tional simplifying assumptions.Assume that both D k and F kTable 1:Statistics on all the scanned input data sets.are 0−1matrices,where D k represents decimation exactly by an integer factor m ,and each F k is a permutation approx-imating the displacement which it represents.Then R turns out to have a simple form:it is an integer diagonal matrix,where the (i ,i )th entry is the number of samples placed into the i th cell of the high-resolution grid.The column vector P is simple as well:the i th entry contains the sum of all the z values of samples that fall into the i th high-resolution cell.So under these assumptions,averaging the z values of the points that fall into the i th cell is the correct solution of the linear system,and gives the least-squares estimate of the z value of the surface at that point.6.ExperimentsWe have tried this method on models of various sizes,with the statistics summarized in Table 1.For each,the reso-lution of the output mesh was either 3.7or 4times that of the input scans.We do five iterations of reconstruction and registration for each super-resolved scan (three would probably have been sufficient),and each iteration takes be-tween one and three minutes,depending of the size of the input model and the desired output resolution.Actual scan-ning time takes anywhere between 30-60minutes for 90-150scans,and cleanup and initial registration using Geomagic takes another 30minutes or so.We took six views of the parrot model,producing six super-resolved scans.As we can see in Figure 2,our super-resolved scans have artifacts that are derived from system-atic scanner errors which occur in all input scans.In particu-lar,because of "edge curl"(for instance at the wing tips)the boundaries of each super-resolved scan had to be trimmed.We used the standard clean-up and merging tools in Geo-magic to merge the six super-resolved scans into a single model,which can be seen in Figure 9.In this example it is clear that both noise removal and true super-resolution -the detection of detail invisible in each individual scan -is achieved.Each super-resolved scan in the parrot model was com-posed of 100input scans,each taken with a random x −y pan.Registering and merging the low-resolution point sets produces the periodic sampling patterns on the left in Fig-ure 7;the period matches that of the low-resolution input grid,and is larger than the sample spacing in the output high-resolution grid.This shows up in the final surface as notice-able aliasing on the output surface,which can be seen in the close-up in Figure 6.As registration improves,this aliasingcThe Eurographics Association 2006.Figure7:Left:the sampling pattern when we only do ran-dom x-y shifts.Right:the sampling pattern when we also ro-tate the model(increments of10◦degrees for every10scans, 90scans total).Notice that this reduces the tiling artifact.diminishes but it does not disappear.It is possible that the scans form clumps,and that registration is excellent within a clump but loser between clumps.To avoid this undesirable artifact,we can rotate the model while taking the scans.We did this with the Mayan hiero-glyphic shown in Figure10,producing the much more de-sirable sampling pattern on the right in Figure7.This did in-deed eliminate the grid aliasing artifact,at the cost of slightly worse registration as measured by RMS error.While the re-sults overall in this experiment were good,another artifact is visible near the deep grooves in the surface:ridges inside the grooves,sometimes(like in the wrinkles near the bird’s smile)obscuring the groove itself.We believe this occurs be-cause of the peak detection errors on the low-resolution CDC image in the scanner.This highlights a problem with using super-resolution alone,without better processing within the scanner,e.g.Curless and Levoy[CL95];if there are system-atic scanning artifacts,super-resolution succeeds only in im-proving the resolution of the artifacts.We tested the method on some very small objects,to show that we can improve the effective resolution of the scan-ner.The smallest object we scanned was a cast of a New York subway token,shown in Figure8.The subway token was scanned at the highest resolution possible,with a sam-ple spacing of0.15mm.This is in fact a higher resolution than the specified accuracy of the scanner(±0.22mm in x-direction and±0.16mm in y-direction).The super-resolved model clearly achieves very good output quality at this high resolution,effectively capturing the object completely.To compare the contribution of noise reduction and resolu-tion improvement to this result,we tried processing a sin-gle scan to reduce noise,by subdividing and then smooth-ing.This was surprisingly effective(Figure8,lower left), but clearly not as good as super-resolution.We also tried taking100scans without nudging the scanner before each scan,to see the effect of the small random shifts.The re-sults were again quite good(Figure8,lower right),but ar-tifacts of the low-resolution grid are clearly visible,and the full super-resolution method is again significantly better.For very small objects like coins,it is clear that taking many scans reduce noise greatly,and that small displacements be-tween the scans and the full super-resolution process give the best results.At a lower input resolution,we get excellent super-resolution results.A high-resolution scan of the parrot’s head,with an input sample spacing of about0.4mm,can be seen in Figure11.In this case details completely invisible in the input scans really are revealed in the super-resolved output,especially the differences in texture.The high quality renderings in Figures2,9,10were done using Autodesk Maya,while the blue models are screenshots from Geomagic Studio.All models are triangulated.7.DiscussionWe see several avenues for further research based on this method.Our reconstruction algorithm uses the simplest ap-proach to super-resolution.Most image processing algo-rithms involve more complicated formulations.We tried one such approach,based on the super-resolution algorithm of Irani and Peleg[IP91]on our Parrot Head example,and did not see a noticeable improvement.Possibly other super-resolution algorithms,for instance[FREM03]or[KJH01], could improve the results using better regularization andfil-tering terms,and might give good results using less input data,as they seem to do in image processing.Our parrot model is constructed from six super-resolved scans.Instead,it might be possible to use a turntable and use several hundred input scans from different directions to pro-duce a super-resolved cylindrical scan.This would require a true3D reconstruction method,rather than the simple2.5D processing scheme we used here.Also,super-resolution re-quires large quantities of data,and the limiting factor in our prototype is anizing the computation to use memory efficiently would make it feasible for large scan-ning projects.A system similar to Curless and Levoy’s VRIP method[CL96]might be appropriate.Finally,we are eager to try super-resolution with time-of-flight scanners.Time-of-flight scanners suffer from noise in the z-direction,and theyfit the model of pure point-sampling very well.8.AcknowledgmentsWe gratefully acknowledge the cheerful assistance of U.C. Davis undergraduate Research Assistant Kelcey Chan,who helped us with the data acquisition and model construction. We thank the reviewers for several helpful suggestions. Work on this project was supported by NSF through grant CCF-0331736and also through CAREER award CCF-0093378.Dr.Mederos was also supported by the Brazilian National Council of Technological and Scientific Develop-ment(CNPq).c The Eurographics Association2006.Figure8:(a)One scan.(b)Final super-resolved surface from100scans.(c)Photo of the object(a plaster cast of a subway token).The bottom row shows some results of other kinds of processing,to evaluate the importance of the various steps of the algorithm.(d)One scan,bilinearly interpolated onto thefiner grid and smoothed.Detail is missing.(e)The entire algorithm except for thefinal bilateralfiltering step.The noise removed by thefiltering seems to be residual registration error,which perhaps could be improved.(f)Just averaging100scans taken without moving the scanner,using the same Gaussian kernel. Noise is decreased,but there is aliasing from the lower-resolution grid obscuring detail visible in(b).References[BM92]B ESL P.,M C K AY N.:A method for registration of3d shapes.IEEE Trans.on Pattern Analysis and Machine Intelli-gence14,2(Feb1992).[CKK∗96]C HEESEMAN P.,K ANEFSKY B.,K RAFT R.,S TUTZ J.,H ANSON R.:Super-resolved surface reconstruction from multiple images.In Maximum Entropy and Bayesian Methods. Kluwer Academic Publishers,1996,pp.293–308.[CL95]C URLESS B.,L EVOY M.:Better optical triangulation through spacetime analysis.In5th International Conference on Computer Vision(1995),pp.987–994.[CL96]C URLESS B.,L EVOY M.:A volumetric method for build-ing complex models from range puter Graphics30, Annual Conference Series(1996),303–312.[Cur97]C URLESS B.L.:New Methods for Surface Reconstruc-tion from Range Images.Tech.Rep.CSL-TR-97-733,Stanford Computer Science,1997.[DT05]D IEBEL J.,T HRUN S.:An application of markov random fields to range sensing.In Proceedings of Conference on Neural Information Processing Systems(NIPS)(Cambridge,MA,2005), MIT Press.[EF97]E LAD M.,F EUER A.:Restoration of single super-resolution image from several blurred,noisy and down-sampled measured images.IEEE Trans.on Image Processing(1997), 1646–1658.[EHO01]E LAD M.,H EL-O R Y.:A fast super-resolution recon-struction algorithm for pure translational motion and common space invariant blur.IEEE Transactions on Image Processing10, 8(2001),1187–1193.[FREM03]F ARSIU S.,R OBINSON D.,E LAD M.,M ILANFAR P.: Robust shift and add approach to super-resolution.In SPIE Conf. on Applications of Digital Signal and Image Processing(2003). [Geo03]G EOMAGIC I.:Studio6.0,2003.[Hor87]H ORN B.:Closed-form solution of absolute orientation using unit quaternions.Journal of the Optical Society of America 4,4(1987),629–642.[HT84]H UANG T.,T SAY R.:Multiple frame image restoration and registration.In Advances in Computer Vision and Image Pro-cessing,Huang T.,(Ed.).1984,pp.317–339.[IP91]I RANI M.,P ELEG S.:Improving resolution by image reg-istration.CVGIP:Graph.Models Image Process.53,3(1991), 231–239.[KJH01]K IM H.,J ANG J.-H.,H ONG K.-S.:Edge-enhancing super-resolution using anisotropic diffusion.In IEEE Conference on Image Processing(2001),vol.3,pp.130–133.[NRDR05]N EHAB D.,R USINKIEWICZ S.,D AVIS J.,R A-MAMOORTHI R.:Efficiently combining positions and normals for precise3d geometry.ACM Transactions on Graphics(SIG-GRAPH2005)(2005),536–543.[PPK03]P ARK S.C.,P ARK M.K.,K ANG M.G.:Super-resolution image reconstruction:a technical overview.IEEE Sig-nal Processing Magazine(2003),21–36.[RL01]R USINKIEWICZ S.,L EVOY M.:Efficient variants of the icp algorithm.In International Conference on3D Digital Imag-ing and Modeling(3DIM)(2001).[TM98]T OMASI C.,M ANDUCHI R.:Bilateralfiltering for gray and color images.In ICCV’98:Proceedings of the Sixth Interna-tional Conference on Computer Vision(Washington,DC,USA, 1998),IEEE Computer Society,p.839.c The Eurographics Association2006.。
scanner光刻机原理
scanner光刻机原理Scanner 光刻机原理一、引言光刻技术是微电子工业中的一项重要技术,其在芯片制造过程中起着至关重要的作用。
Scanner光刻机作为光刻技术的核心装备,其原理和工作机制的理解对于提高芯片制造的精度和效率具有重要意义。
本文将从Scanner光刻机的原理入手,详细介绍其工作原理和关键技术。
二、Scanner光刻机的工作原理Scanner光刻机是一种通过光学方式将光照射在硅片上的设备。
其工作原理可以简单描述为:通过光源产生的光束经过一系列的光学元件进行准直、聚焦和控制,最终通过掩模板上的图形将光影投射到硅片上,形成微细的图形。
1. 光源系统光源系统是Scanner光刻机的核心组成部分之一。
光源系统通常采用激光光源,通过激光的特殊性质,可以实现光线的单色、高亮度和高稳定性。
激光光源发出的光束经过调制和准直后,进入光学系统。
2. 光学系统光学系统是Scanner光刻机的另一个重要组成部分。
光学系统主要包括准直系统、聚焦系统和扫描系统。
准直系统通过调整光束的大小和形状,使其达到要求的准直度和光强度。
聚焦系统通过透镜的调整,将光束聚焦到硅片的表面。
扫描系统则通过精密的机械装置,实现在硅片上进行图形的扫描。
3. 掩模和硅片在光学系统的作用下,光线经过掩模上的图形,形成了阴影和亮区的分布。
掩模是一种特制的光刻版,其上的图形决定了最终在硅片上形成的微细图案。
硅片是光刻加工的对象,它是光刻工艺的最终产物。
4. 曝光和显影在掩模和硅片的配合下,Scanner光刻机开始进行曝光和显影的过程。
曝光是指将掩模上的图形通过光刻机的光源系统投射到硅片上的过程。
显影是指在曝光后,通过化学液体的处理,将未暴露的光刻胶去除,形成微细图案的过程。
5. 其他关键技术除了以上介绍的几个关键部分外,Scanner光刻机还涉及到一些其他的关键技术。
例如,对于提高光刻精度和分辨率,需要采用更高级别的掩模和更精密的光学系统;对于提高生产效率,需要采用更高功率的光源和更快速的扫描系统。
scanner 光刻机原理

scanner 光刻机原理Scanner光刻机原理一、引言随着半导体技术的不断发展,光刻技术在芯片制造中起着至关重要的作用。
而Scanner光刻机作为现代光刻技术中的一种重要设备,其原理是如何实现高精度的芯片制造的呢?本文将从Scanner光刻机的原理入手,详细介绍其工作过程和关键技术。
二、Scanner光刻机的工作原理Scanner光刻机是一种利用光学技术进行微影曝光的设备,其核心部件是光学系统和机械系统。
光学系统负责实现光刻光源的聚焦和照射,而机械系统则负责控制曝光台和掩膜的移动。
下面将详细介绍Scanner光刻机的工作原理。
1. 曝光过程Scanner光刻机的曝光过程主要包括光源发射、光线聚焦、光线照射和图像传输等步骤。
光源发射部分通常采用激光器,其发射的激光经过光学系统的透镜组进行聚焦,然后照射到掩膜上。
掩膜上的芯片图案会将光线进行阻挡或透过,形成光刻图案。
通过掩膜上的图案和光线的照射,将芯片图案传输到硅片上,实现曝光过程。
2. 机械控制系统Scanner光刻机的机械控制系统主要包括曝光台和掩膜的移动控制。
曝光台负责将硅片放置在需要曝光的位置,然后通过机械系统的控制,将掩膜和硅片进行相对运动,使光线照射到硅片上的不同区域。
掩膜的移动控制需要保证与硅片的相对位置精度,以实现高精度的曝光。
3. 光学系统Scanner光刻机的光学系统是实现光线聚焦和照射的关键部件。
光学系统由透镜组、反射镜和光学补偿系统等组成。
透镜组负责将光线进行聚焦,使其能够通过掩膜上的图案。
反射镜则用于改变光线的传输方向,确保光线能够正确照射到硅片上。
光学补偿系统则用于校正光线在透镜组中的传输过程中产生的像差,提高曝光的精度。
三、Scanner光刻机的关键技术Scanner光刻机作为现代芯片制造中关键的设备,其性能和精度取决于多种关键技术的应用。
下面将介绍几个重要的关键技术。
1. 光源技术Scanner光刻机的光源通常采用激光器,其发射的激光需要具备高功率、高稳定性和高均匀性等特点。
scanner 光刻机原理

scanner 光刻机原理Scanner光刻机原理一、引言光刻技术是半导体制造工艺中的重要环节,它是将光源经过一系列的光学元件加工后,将光能转化为电子束或光束,通过光掩膜的传导,将图案投影到硅片上,形成微米级的图案。
而Scanner光刻机是光刻技术中的一种高级设备,具有高精度、高效率的特点。
本文将详细介绍Scanner光刻机的原理及其工作过程。
二、Scanner光刻机的原理Scanner光刻机是一种采用扫描式曝光方式的光刻设备。
其主要原理是通过光学系统将光束聚焦到一定的尺寸,并通过控制光源的强度和曝光时间,使光线能够对硅片进行曝光。
Scanner光刻机具有多通道的曝光系统,可以同时对多个硅片进行曝光,提高生产效率。
三、光学系统Scanner光刻机的光学系统是实现光刻曝光的核心部分。
它主要由光源、准直器、透镜和投影镜等组成。
光源是产生光线的设备,通常采用氘灯或氙灯。
准直器用于调整光线的平行度和均匀度,确保光线能够准确地照射到硅片上。
透镜和投影镜则负责将光线聚焦到硅片上,形成所需的图案。
四、控制系统Scanner光刻机的控制系统是实现光刻曝光的关键部分。
它主要由光学控制系统和机械控制系统两部分组成。
光学控制系统负责调节光源的强度和曝光时间,确保曝光的精度和一致性。
机械控制系统则负责控制硅片的移动和旋转,使得曝光能够覆盖整个硅片表面。
五、曝光过程Scanner光刻机的曝光过程主要包括准备、对位、曝光和退像几个步骤。
首先,通过对位仪器对硅片和掩膜进行对位,确保曝光的位置准确。
然后,光刻机会按照预设的曝光参数,通过光学和机械控制系统进行曝光操作。
在曝光过程中,光线会经过掩膜,将所需的图案投影到硅片上。
最后,通过退像操作,将光线从硅片上移走,完成曝光过程。
六、特点与应用Scanner光刻机具有高精度、高效率的特点,广泛应用于半导体制造、平板显示、光学仪器等领域。
其高精度的光刻技术可以实现微米级的图案制作,满足了现代电子产品对精度和密度的要求。
- 1、下载文档前请自行甄别文档内容的完整性,平台不提供额外的编辑、内容补充、找答案等附加服务。
- 2、"仅部分预览"的文档,不可在线预览部分如存在完整性等问题,可反馈申请退款(可完整预览的文档不适用该条件!)。
- 3、如文档侵犯您的权益,请联系客服反馈,我们会尽快为您处理(人工客服工作时间:9:00-18:30)。
: 7 12
2A @ 30VDC
:7
: NO/NC
1,
2,
:12
: 10 x NO, 2 x NO/NC
EQUAL
EQUAL
(2) “P“ DIA. KNOCKOUTS
ON BACK
Detector Te r m i n a t i o n Board Here
TAB WITH (3) HOLES (TYPICAL)
Vision House, Focus 31, Mark Road
Mount Waverley, VIC 3149
Hingham, Massachusetts, USA
02043 Hemel Hempstead, Herts. HP2 7BW
Australia
(781) 740-2223
United Kingdom
61 3 9211 7200
(800) 229-4434
+44 1442 242 330
61 3 9211 7201
(781) 740-4433
+44 1442 249 327
1800 700 203
©2000 Vision Systems – VESDA™.
Vision Products
Vision Products
@ 3000rpm
@ 4200rpm
Dimensions mm in
A 350 13.8
Dimensions mm in
L 23.8 .94
B 225 8.9 M 51 2
5.8W 240mA
7.4W 310mA
9.6W 400mA
(WHD): 350mm x 225mm x 125mm (13.8in x 8.9in x 4.9in)
○○○○○○○○○○○○
LaserSCANNER™
○○○○○○○○○○○○○○○○○○○○○○○○○○○○○○○○○○○○○○○○○○○○○○○○○○○○
: FM, LPC, SSL, UL, ULC, VdS
LaserSCANNER VESDA
LaserPLUS VESDA
LaserSCANNER LaserSCANNER
+ –
SHEILD X9
+ –
SHEILD X10
+ –
X7
+ –
X8
L1 L2
Dimensions
mm in
A 337.3 13.25
B 130.8 4.87
C
14.5 .28
D
70.6 2.81
E
50.6 2.06
7 F
10.0
G 47.62
.37 1.87
H
6.35 .25
(ISOLATED)
H
6.35 .25
X11 NC (FIRE 2) C
NO
(FIRE 1) C
NO
NC
C (ACTION)
NO
(GENERAL PURPOSE INPUT)
– +
X5
NC
1
+ C4
C2
+
C1
+
R1
+
X19 N4
C19
R8
LED OUTPUTS
D1
D2
T1
1 X17
X2
+C7
C3
+
+
X1
1
Vision Systems
:
: 0.005 - 1.990% obs/m (0.0015 - 0.6218% obs/ft)
: 0.010 - 1.995% obs/m (0.0031 - 0.6234% obs/ft)
1 : 0.015 - 2.00% obs/m (0.0046 - 0.625% obs/ft)
2 : 0.020 - 20.00% obs/m (0.0062 - 6.25% obs/ft)*
(MINOR FAULT)
NO C NC NO C NC NO Z1 C NC NO C NC
(URGENT FAULT)
(ALERT)
X12
X6
G
F
E
D
A 337.3 13.25
B 130.8 4.87
C
14.5 .28
D
70.6 2.81
E
50.6 2.06
F
10.0 .37
G 47.62 1.87
2
2000 5
BRIDGE (TYPICAL)
B
(4) KEY MOUNTING
HOLES (TYPICAL)
A
Q
(2) “P“ DIA. KNOCKOUTS ON LEFT
BRIDGE
U
C
(TYPICAL)
B
F
D
IP
IP30
:
8 x 25 mm (1in)
:
0.2-2.5sq mm (30-12 AWG)
:
0.005 20% obs/m (0.0015 to 6% obs/ft)
TOP VIEW
(4) “P“ DIA. PORT SAMPLE PIPE INLET MANIFOLD HOLES ON TOP
L
C 70 2.75 D 57 2.25 E 35 1.37 F 44.5 1.75 G 22.2 .87 H 141 5.56 I 15.9 .62 J 33.3 1.31 K 34 1.33
N 21 .83 O 141 5.56 P 25.4 1 Q 11.1 .44 R 9.5 .37 S 28.5 1.12 T 30.2 1.19 U 3.2 .125
C
D G
G N
P
:
: 200m (650ft)
: ASPIRE™
:
25mm (1in)
15-21mm (9/16in - 7/8in)
LED (FAS)
VESDAnet™
7 12 AutoLearn™
LaserSCANNER LaserSCANNER
LaserSCANNER
(FAS) FAS
1
2
LaserSCANNER LaserSCANNER
19
LaserSCANNER 7 12
VESDAnet™
VESDAnet
19
VESDAnet VESDAnet
○
○
○
○
○
○
○
○
○
○
○
○
○
○
○
○
○
○
○
○
○
○
○
○
○
○
○
○
○
○
○
○
○
○
○
○
○
○
○
○
○
○
○
○
○
○
○
○
○
○
○
○
○
○
○
○
○
○
Vision Systems – VESDA™
Vision Systems – VESDA™
Vision Systems – VESDA™
Private Bag 215, 495 Blackburn Road 35 Pond Park Road
VESDA InfoWORKS, ASPIRE, LaserPLUS, LaserSCANNER, LaserCOMPACT, AutoLearn, VSM, VESDAnet Vision Products Pty. Ltd.
VESDA® Vision Products Pty. Ltd
19176
VESDA
AutoLearn™
LaserSCANNER
AutoLearn
AutoLearn
1
2
VESDA LaserSCANNER
○
○
○
○
○
○
○
○
○
○
○
○
○
○
○
○
○
○
○
○
○
○
○
○
○
○
○
○
○
○
○
○
○
○
○
○
○
○
○
○
○
○
○
○
○
○
○
○
○
○
○
○
○
○
○
○
○
○
○
○
○
○
○
○
○
○
○
○
○
○
○
: 18 30VDC @ 24VDC:
*UL
12% obs/m (4% obs/ft)
:
:
FIFO
18,000
AutoLearn :
15151源自AutoLearn:
:
1
2
:
: 7 12
:
VESDAnet
:
:
:
X
X
VESDA LaserPLUS
X
2=7 3=12 6=7 7=12
VLS-XXX XX
w/FOK LED w/FOK LED
0=B
B
C
mm in
F
12
+
VnetA
-
SHIELD X9
+
VnetB
-
X10 SHIELD
