数字信号处理实验报告
数字信号处理实验报告 3
数字信号处理实验报告姓名:班级:通信学号:实验名称:频域抽样定理验证实验类型:验证试验指导教师:实习日期:2013.频域采样定理验证实验一. 实验目的:1. 加深对离散序列频域抽样定理的理解2.了解由频谱通过IFFT 计算连续时间信号的方法3.掌握用MATLAB 语言进行频域抽样与恢复时程序的编写方法 4、用MATLAB 语言将X(k)恢复为X(z)及X(e jw )。
二. 实验原理:1、1、频域采样定理: 如果序列x(n)的长度为M ,频域抽样点数为N ,则只有当频域采样点数N ≥M 时,才有x N (n)=IDFT[X(k)]=x(n),即可由频域采样X(k)无失真的恢复原序列 x(n)。
2、用X(k)表示X(z)的内插公式:∑-=-----=10111)(1)(N k kNNzWz k X Nz X内插函数: zWzkNNN z 1k111)(-----=ϕ频域内插公式:∑-=-=10)2()()(N K j k Nk X e X πωϕω频域内插函数:e N j N N )21()2sin()2sin(1)(--=ωωωωϕ三. 实验任务与步骤:实验一:长度为26的三角形序列x(n)如图(b)所示,编写MATLAB 程序验证频域抽样定理。
实验二:已知一个时间序列的频谱为X(e jw )=2+4e -jw +6e -j2w +4e -j3w +2e -j4w分别取频域抽样点数N为3、5和10,用IPPT计算并求出其时间序列x(n),用图形显示各时间序列。
由此讨论原时域信号不失真地由频域抽样恢复的条件。
实验三:由X32(k)恢复X(z)和X(e jw)。
四.实验结论与分析:实验一:源程序:M=26;N=32;n=0:M; %产生M长三角波序列x(n)xa=0:floor(M/2);xb= ceil(M/2)-1:-1:0; xn=[xa,xb];Xk=fft(xn,512); %1024点FFT[x(n)], 用于近似序列x(n)的TFX32k=fft(xn,32); %32点FFT[x(n)]x32n=ifft(X32k); %32点IFFT[X32(k)]得到x32(n)X16k=X32k(1:2:N); %隔点抽取X32k得到X16(K)x16n=ifft(X16k,N/2); %16点IFFT[X16(k)]得到x16(n)subplot(3,2,2);stem(n,xn,'.');box ontitle('(b) 三角波序列x(n)');xlabel('n');ylabel('x(n)');axis([0,32,0,20])k=0:511;wk=2*k/512;subplot(3,2,1);plot(wk,abs(Xk));title('(a)FT[x(n)]');xlabel('\omega/\pi');ylabel('|X(e^j^\omega)|');axis([0,1,0,200])k=0:N/2-1;subplot(3,2,3);stem(k,abs(X16k),'.');box ontitle('(c) 16点频域');xlabel('k');ylabel('|X_1_6(k)|');axis([0,8,0,200])n1=0:N/2-1;subplot(3,2,4);stem(n1,x16n,'.');box ontitle('(d) 16点IDFT[X_1_6(k)]');xlabel('n');ylabel('x_1_6(n)');axis([0,32,0,20])k=0:N-1;subplot(3,2,5);stem(k,abs(X32k),'.');box ontitle('(e) 32点频域采样');xlabel('k');ylabel('|X_3_2(k)|');axis([0,16,0,200])n1=0:N-1;subplot(3,2,6);stem(n1,x32n,'.');box ontitle('(f) 32点IDFT[X_3_2(k)]');xlabel('n');ylabel('x_3_2(n)');axis([0,32,0,20])结果如下所示:实验一分析:序列x(n)的长度M=26,由图中可以看出,当采样点数N=16<M时,x16(n)确实等于原三角序列x(n)以16为周期的周期延拓序列的主值序列。
数字信号处理实验报告
实验一 信号、系统及系统响应一、实验目的1、熟悉理想采样的性质,了解信号采样前后的频谱变化,加深对时域采样定理的理解。
2、熟悉离散信号和系统的时域特性。
3、熟悉线性卷积的计算编程方法:利用卷积的方法,观察、分析系统响应的时域特性。
4、掌握序列傅里叶变换的计算机实现方法,利用序列的傅里叶变换对离散信号、系统及其系统响应进行频域分析。
二、 实验原理1.理想采样序列:对信号x a (t)=A e −αt sin(Ω0t )u(t)进行理想采样,可以得到一个理想的采样信号序列x a (t)=A e −αt sin(Ω0nT ),0≤n ≤50,其中A 为幅度因子,α是衰减因子,Ω0是频率,T 是采样周期。
2.对一个连续时间信号x a (t)进行理想采样可以表示为该信号与一个周期冲激脉冲的乘积,即x ̂a (t)= x a (t)M(t),其中x ̂a (t)是连续信号x a (t)的理想采样;M(t)是周期冲激M(t)=∑δ+∞−∞(t-nT)=1T ∑e jm Ωs t +∞−∞,其中T 为采样周期,Ωs =2π/T 是采样角频率。
信号理想采样的傅里叶变换为X ̂a (j Ω)=1T ∑X a +∞−∞[j(Ω−k Ωs )],由此式可知:信号理想采样后的频谱是原信号频谱的周期延拓,其延拓周期为Ωs =2π/T 。
根据时域采样定理,如果原信号是带限信号,且采样频率高于原信号最高频率分量的2倍,则采样以后不会发生频率混叠现象。
三、简明步骤产生理想采样信号序列x a (n),使A=444.128,α=50√2π,Ω0=50√2π。
(1) 首先选用采样频率为1000HZ ,T=1/1000,观察所得理想采样信号的幅频特性,在折叠频率以内和给定的理想幅频特性无明显差异,并做记录;(2) 改变采样频率为300HZ ,T=1/300,观察所得到的频谱特性曲线的变化,并做记录;(3) 进一步减小采样频率为200HZ ,T=1/200,观察频谱混淆现象是否明显存在,说明原因,并记录这时候的幅频特性曲线。
数字信号实验报告材料 (全)
数字信号处理实验报告实验一:用 FFT 做谱分析 一、 实验目的1、进一步加深 DFT 算法原理和基本性质的理解。
2、熟悉 FFT 算法原理和 FFT 子程序的应用。
3、学习用FFT 对连续信号和时域离散信号进行谱分析的方法,了解可能出现的分析误差及其原因,以便在实际中正确应用 FFT 。
二、实验原理用FFT 对信号作频谱分析是学习数字信号处理的重要内容。
经常需要进行谱分析的信号是模拟信号和时域离散信号。
对信号进行谱分析的重要问题是频谱分辨率D 和分析误差。
频谱分辨率直接和FFT 的变换区间N 有关,因为FFT 能够实现的频率分辨率是2π/N ≤D 。
可以根据此时选择FFT 的变换区间N 。
误差主要来自于用FFT 作频谱分析时,得到的是离散谱,而信号(周期信号除外)是连续谱,只有当N 较大时离散谱的包络才能逼近于连续谱,因此N 要适当选择大一些。
周期信号的频谱是离散谱,只有用整数倍周期的长度作FFT ,得到的离散谱才能代表周期信号的频谱。
如果不知道信号周期,可以尽量选择信号的观察时间长一些。
对模拟信号的频谱时,首先要按照采样定理将其变成时域离散信号。
如果是模拟周期信号,也应该选取整数倍周期的长度,经过采样后形成周期序列,按照周期序列的谱分析进行。
三、实验内容和步骤对以下典型信号进行谱分析:⎪⎩⎪⎨⎧≤≤-≤≤-=⎪⎩⎪⎨⎧≤≤-≤≤+==其它nn n n n n x 其它nn n n n n x n R n x ,074,330,4)(,074,830,1)()()(32414()cos4x n n π=5()cos(/4)cos(/8)x n n n ππ=+6()cos8cos16cos20x t t t t πππ=++对于以上信号,x1(n)~x5(n) 选择FFT 的变换区间N 为8和16 两种情况进行频谱分析。
分别打印其幅频特性曲线。
并进行对比、分析和讨论;;x6(t)为模拟周期信号,选择 采样频率Hz F s 64=,变换区间N=16,32,64 三种情况进行谱分析。
数字信号处理实验六报告

实验六 频域抽样定理和音频信号的处理实验报告 (一)频域抽样定理给定信号1, 013()27, 14260, n n x n n n +≤≤⎧⎪=-≤≤⎨⎪⎩其它 1.利用DTFT 计算信号的频谱()j X e ω,一个周期内角频率离散为M=1024点,画出频谱图,标明坐标轴。
n=0:100; %设定n 及其取值范围for n1=0:13 %对于n 处于不同的取值范围将n 代入不同的表达式xn(n1+1)=n1+1;endfor n2=14:26xn(n2+1)=27-n2;endfor n3=27:100xn(n3+1)=0;endM=1024; %设定抽样离散点的个数k=0:M-1; %设定k 的取值范围w=2*pi*k/M; %定义数字角频率[X,w] = dtft2( xn,n, M ) %调用dtft2子程序求频谱plot(w,abs(X)); %画出幅度值的连续图像xlabel('w/rad');ylabel('|X(exp(jw))|');title(' M=1024时的信号频谱图像'); %标明图像的横纵坐标和图像标题function [X,w] = dtft2(xn, n, M ) %定义x(n)的DTFT 函数w=0:2*pi/M:2*pi-2*pi/M; %将数字角频率w 离散化L=length(n); %设定L 为序列n 的长度 for (k=1:M) %外层循环,w 循环M 次sum=0; %每确定一个w 值,将sum 赋初值为零for (m=1:L) %内层循环,对n 求和,循环次数为n 的长度sum=sum+xn(m)*exp(-j*w(k)*n(m)); %求和X(k)=sum; %把每一次各x(n)的和的总值赋给X ,然后开始对下一个w 的求和过程end %内层循环结束end%外层循环结束M=1024时的信号频谱图像如图1-1所示:图1-1 M=1024时的信号频谱图像2.分别对信号的频谱()jX eω在区间π[0,2]上等间隔抽样16点和32点,得到32()X k和16()X k。
数字信号处理实验报告

数字信号处理实验报告实验一:频谱分析与采样定理一、实验目的1.观察模拟信号经理想采样后的频谱变化关系。
2.验证采样定理,观察欠采样时产生的频谱混叠现象3.加深对DFT算法原理和基本性质的理解4.熟悉FFT算法原理和FFT的应用二、实验原理根据采样定理,对给定信号确定采样频率,观察信号的频谱三、实验内容和步骤实验内容(1)在给定信号为:1.x(t)=cos(100*π*at)2.x(t)=exp(-at)3.x(t)=exp(-at)cos(100*π*at)其中a为实验者的学号,用DFT分析上述各信号的频谱结构,选取不同的采样频率和截取长度,试分析频谱发生的变化。
实验内容(2)设x(n)=cos(0.48*π*n)+ cos(0.52*π*n),对其进行以下频谱分析:10点DFT,64点DFT,及在10点序列后补零至64点的DFT 试分析这三种频谱的特点。
四、实验步骤1.复习采样理论、DFT的定义、性质和用DFT作谱分析的有关内容。
2.复习FFT算法原理和基本思想。
3.确定实验给定信号的采样频率,编制对采样后信号进行频谱分析的程序五、实验程序和结果实验1内容(1)N=L/T+1;t=0:T:L;a=48;D1=2*pi/(N*T); % 求出频率分辨率k1=floor((-(N-1)/2):((N-1)/2)); % 求对称于零频率的FFT位置向量%%%%%%%%%%%%%%%%%%%%%%%%%figure(1),x1=cos(100*pi*a*t);y1=T*fftshift(fft(x1));%虽然原来是周期信号,但做了截断后,仍可当作非周期信号。
subplot(2,1,1),plot(t,x1);title('正弦信号');subplot(2,1,2),plot(k1*D1,abs(y1));title('正弦信号频谱'); %%%%%%%%%%%%%%%%%%%%% figure(2), x2=exp(-a*t);y2=T*fftshift(fft(x2));%有限长(长度为N)离散时间信号x1的dft 再乘T 来近似模拟信号的频谱,长度为Nsubplot(2,1,1),plot(t,x2);title('指数信号');subplot(2,1,2),plot(k1*D1,abs(y2));title('指数信号频谱'); %%%%%%%%%%%%%%%%%%%%% figure(3), x3=x1.*x2;y3=T*fftshift(fft(x3))subplot(2,1,1),plot(t,x3);title('两信号相乘');subplot(2,1,2),plot(k1*D1,abs(y3));title('两信号相乘频谱');0.020.040.060.080.10.120.140.16-1-0.500.51正弦信号-4000-3000-2000-10000100020003000400000.020.040.06正弦信号频谱00.020.040.060.080.10.120.140.160.51-4000-3000-2000-10000100020003000400000.010.020.03指数信号频谱0.020.040.060.080.10.120.140.16-1-0.500.51两信号相乘-4000-3000-2000-10000100020003000400000.0050.010.015两信号相乘频谱T=0.0005 L=0.150.020.040.060.080.10.120.140.16-1-0.500.51-8000-6000-4000-2000200040006000800000.020.040.060.08正弦信号频谱00.020.040.060.080.10.120.140.160.51指数信号-8000-6000-4000-20000200040006000800000.010.020.03指数信号频谱0.020.040.060.080.10.120.140.16-1-0.500.51-8000-6000-4000-20000200040006000800000.0050.010.015两信号相乘频谱T=0.002 L=0.150.020.040.060.080.10.120.140.16-1-0.500.51正弦信号-2000-1500-1000-50050010001500200000.020.040.060.08正弦信号频谱00.020.040.060.080.10.120.140.160.51-2000-1500-1000-500050010001500200000.010.020.03指数信号频谱0.020.040.060.080.10.120.140.16-1-0.500.51两信号相乘-2000-1500-1000-500050010001500200000.0050.010.015两信号相乘频谱T=0.001 L=0.180.020.040.060.080.10.120.140.160.18-1-0.500.51-4000-3000-2000-1000100020003000400000.020.040.060.08正弦信号频谱00.020.040.060.080.10.120.140.160.180.51指数信号-4000-3000-2000-10000100020003000400000.010.020.03指数信号频谱0.020.040.060.080.10.120.140.160.18-1-0.500.51-4000-3000-2000-10000100020003000400000.0050.010.015两信号相乘频谱T=0.001 L=0.120.020.040.060.080.10.12-1-0.500.51正弦信号-4000-3000-2000-10000100020003000400000.020.040.06正弦信号频谱00.020.040.060.080.10.120.51-4000-3000-2000-10000100020003000400000.010.020.03指数信号频谱0.020.040.060.080.10.12-1-0.500.51两信号相乘-4000-3000-2000-10000100020003000400000.0050.010.015两信号相乘频谱实验1内容(2)>> N=10;n=1:NT=1x1=cos(0.48*pi*n*T)+cos(0.52*pi*n*T)X1=fft(x1,10)k=1:N;w=2*pi*k/10subplot(3,2,1);stem(n,x1);axis([0,10,-3,3]);title('信号x(n)');subplot(3,2,2);stem(w/pi,abs(X1));axis([0,1,0,10]);title('DFTx(n)');%%%%%%%%%%%%%%%%%%%%%%%%%%%%%% N2=100;n2=1:N2T=1x1=cos(0.48*pi*[1:10]*T)+cos(0.52*pi*[1:10]*T)x2=[x1,zeros(1,90)]X2=fft(x2,N2)k2=1:N2;w2=2*pi*k2/100subplot(3,2,3);stem(x2);axis([0,100,-3,3]);title('信号x(n)补零');subplot(3,2,4);plot(w2/pi,abs(X2));axis([0,1,0,10]);title('DFTx(n)');%%%%%%%%%%%%%%%%%%%%%%%%%%%%%% N3=100;n3=1:N3T=1x3=cos(0.48*pi*n3*T)+cos(0.52*pi*n3*T)X3=fft(x3,100)k3=1:N3;w3=2*pi*k3/100subplot(3,2,5);stem(n3,x3);axis([0,100,-3,3]);title('信号x(n)');subplot(3,2,6);stem(w3/pi,abs(X3));axis([0,1,0,10]);title('DFTx(n)');n =1 2 3 4 5 6 7 8 9 10 T =1510-202信号x(n)0.510510DFTx(n)50100信号x(n)补零0.510510DFTx(n)50100信号x(n)DFTx(n)实验二 卷积定理一、实验目的通过本实验,验证卷积定理,掌握利用DFT 和FFT 计算线性卷积的方法。
DSP(数字信号处理)实验报告2
本科学生实验报告学号124090314 姓名何胜金学院物电学院专业、班级12电子实验课程名称数字信号处理(实验)教师及职称杨卫平开课学期第三至第四学年下学期填报时间2015 年 3 月 1 9 日云南师范大学教务处编印2.产生幅度调制信号x[t]=cos(2t)cos(200t),推导其频率特性,确定抽样频率,并会出波形。
程序: clc,clear,close all t=[0:0.01:5];x=cos(2*pi*t).*cos(200*pi*t); plot(t,x);clc,clear,close allt0=0:0.001:0.1;x0=0.5*(cos(202*pi*t0)+cos(198*pi*t0)); plot(t0,x0,'r') hold on fs=202;t=0:1/fs:0.1;x=0.5*(cos(202*pi*t)+cos(198*pi*t)); stem(t,x);3.对连续信号x[t]=cos(4t)进行抽样以得到离散序列,并进行重建。
(1)生成信号x(t),时间为t=0:0.001:4,画出x(t)的波形。
程序clc,clear,close all t0=0:0.001:3; x0=cos(4*pi*t0); plot(t0 ,x0,'r');(2)以faam=10HZ对信号进行抽样,画出在0≤t≤1范围内的抽样序列,x[k],利用抽样内插函数恢复连续时间信号,画出重逢信号的波形。
程序:clc,clear,close all t0=0:0.001:3; x0=cos(4*pi*t0); plot(t0,x0); hold onfs=10;t=0:1/fs:3; x=cos(4*pi*t); stem(t,x);4.若x[k]是对连续信号x(t)=cos(0.5t)以samf=2Hz抽样得到的离散序列,如何通过在抽样点之间内插,恢复原连续时间信号x(t)?程序:clc,clear,close all t=0:0.0001:4; x=cos(0.5*pi*t); plot(t,x); Figure1:clc,clear,close allt=0:0.0001:4; x=cos(0.5*pi*t); subplot(2,1,1); plot(t,x);t0=0:0.5:4;x0=cos(0.5*pi*t0); subplot(2,1,2); stem(t0,x0);5.已知序列x[k]={1,3,2,-5;k=0,1,2,3},分别取N=2,3,4,5对其频谱X(e j)进行抽样,再由频域抽样点恢复时域序列,观察时域序列是否存在混叠,有何规律?k=[0,1,2,3]; x=[1,3,2,-5]; n=100;omega=[0:n-1]*2*pi/n;X0=1+3*exp(-j*omega)+2*exp(-2*j*omega)-5*exp(-3*j*omega); subplot(3,4,1);stem(k,x);title('原序列');subplot(3,4,2);plot(omega./pi,abs(X0));title('序列的频谱 N=100');N=2;omega=[0:N-1]*2*pi/N;X1=1+3*exp(-j*omega)+2*exp(-2*j*omega)-5*exp(-3*j*omega); subplot(3,4,5);stem(omega./pi,abs(X1));title('频域抽样 N=2');rx1=real(ifft(X1)); subplot(3,4,9);stem(rx1);title('时域恢复');N=3;omega=[0:N-1]*2*pi/N;X2=1+3*exp(-j*omega)+2*exp(-2*j*omega)-5*exp(-3*j*omega); subplot(3,4,6);stem(omega./pi,abs(X2));title('频域抽样 N=3');rx2=real(ifft(X2)); subplot(3,4,10);stem(rx2);title('时域恢复');N=4;omega=[0:N-1]*2*pi/N;X3=1+3*exp(-j*omega)+2*exp(-2*j*omega)-5*exp(-3*j*omega); subplot(3,4,7);stem(omega./pi,abs(X3));title('频域抽样 N=4');rx3=real(ifft(X3)); subplot(3,4,11);stem(rx3);title('时域恢复');。
数字信号处理实验报告_五个实验
实验一 信号、系统及系统响应一、 实验目的1、熟悉连续信号经理想采样前后的频谱变化关系,加深对时域采样定理的理解;2、熟悉时域离散系统的时域特性;3、利用卷积方法观察分析系统的时域特性;4、掌握序列傅立叶变换的计算机实现方法,利用序列的傅立叶变换对连续信号、离散信号及系统响应进行频域分析。
二、 实验原理及方法采样是连续信号数字处理的第一个关键环节。
对采样过程的研究不仅可以了解采样前后信号时域和频域特性发生变化以及信号信息不丢失的条件,而且可以加深对傅立叶变换、Z 变换和序列傅立叶变换之间关系式的理解。
对一个连续信号)(t x a 进行理想采样的过程可用下式表示:)()()(^t p t t x x aa其中)(^t x a 为)(t x a 的理想采样,p(t)为周期脉冲,即∑∞-∞=-=m nT t t p )()(δ)(^t x a的傅立叶变换为)]([1)(^s m a m j X T j a X Ω-Ω=Ω∑∞-∞= 上式表明^)(Ωj Xa为)(Ωj Xa的周期延拓。
其延拓周期为采样角频率(T /2π=Ω)。
只有满足采样定理时,才不会发生频率混叠失真。
在实验时可以用序列的傅立叶变换来计算^)(Ωj X a 。
公式如下:Tw jwae X j X Ω==Ω|)()(^离散信号和系统在时域均可用序列来表示。
为了在实验中观察分析各种序列的频域特性,通常对)(jw e X 在[0,2π]上进行M 点采样来观察分析。
对长度为N 的有限长序列x(n),有:n jw N n jw k ke m x eX--=∑=)()(1其中,k Mk πω2=,k=0,1,……M-1 时域离散线性非移变系统的输入/输出关系为∑∞-∞=-==m m n h m x n h n x n y )()()(*)()(上述卷积运算也可在频域实现)()()(ωωωj j j e H e X eY =三、 实验程序s=yesinput(Please Select The Step Of Experiment:\n 一.(1时域采样序列分析 s=str2num(s); close all;Xb=impseq(0,0,1); Ha=stepseq(1,1,10);Hb=impseq(0,0,3)+2.5*impseq(1,0,3)+2.2*impseq(2,0,3)+impseq(3,0,3); i=0;while(s);%时域采样序列分析 if(s==1)k=0;while(1)if(k==0)A=yesinput('please input the Amplitude:\n',...444.128,[100,1000]); a=yesinput('please input the Attenuation Coefficient:\n',...222.144,[100,600]);w=yesinput('please input the Angle Frequence(rad/s):\n',...222.144,[100,600]);endk=k+1;fs=yesinput('please input the sample frequence:\n',...1000,[100,1200]);Xa=FF(A,a,w,fs);i=i+1;string+['fs=',num2str(fs)];figure(i)DFT(Xa,50,string);1=yesinput1=str2num(1);end%系统和响应分析else if(s==2)kk=str2num(kk);while(kk)if(kk==1)m=conv(Xb,Hb);N=5;i=i+1;figure(i)string=('hb(n)');Hs=DFT(Hb,4,string);i=i+1;figure(i)string('xb(n)');DFT(Xb,2,string);string=('y(n)=xb(n)*hb(n)');else if (kk==2)m=conv(Ha,Ha);N=19;string=('y(n)=ha(n)*(ha(n)');else if (kk==3)Xc=stepseq(1,1,5);m=conv(Xc,Ha);string=('y(n)=xc(n)*ha(n)');endendendi=i+1;figure(i)DFT(m,N,string);kk=yesinputkk=str2num(kk);end卷积定理的验证else if(s==3)A=1;a=0.5;w=2,0734;fs=1;Xal=FF(A,a,w,fs);i=i+1;figure(i)string=('The xal(n)(A=1,a=0.4,T=1)'); [Xa,w]DFT(Xal,50,string);i=i+1;figure(i)string =('hb(n)');Hs=DFT(Hb,4,string);Ys=Xs.*Hs;y=conv(Xal,Hb);N=53;i=i+1;figure(i)string=('y(n)=xa(n)*hb(n)');[yy,w]=DFT(y,N,string);i=i+1;figure(i)subplot(2,2,1)plot(w/pi,abs(yy));axis([-2 2 0 2]);xlabel('w/pi');ylabel('|Ys(jw)|');title(FT[x(n)*h(n)]');subplot(2,2,3)plot(w/pi,abs(Ys));axis([-2 2 0 2]);xlabel('w/pi');ylabel('|Ys(jw)|');title('FT[xs(n)].FT[h(n)]'); end end end子函数:离散傅立叶变换及X(n),FT[x(n)]的绘图函数 function[c,l]=DFT(x,N,str) n=0:N-1; k=-200:200; w=(pi/100)*k; l=w; c=x*Xc=stepseq(1,1,5); 子函数:产生信号function c=FF(A,a,w,fs) n=o:50-1;c=A*exp((-a)*n/fs).*sin(w*n/fs).*stepseq(0,0,49); 子函数:产生脉冲信号function [x,n]=impseq(n0,n1,n2) n=[n1:n2];x=[(n-n0)==0];子函数:产生矩形框信号function [x,n]=stepseq(n0,n1,n2) n=[n1:n2];x=[(n-n0>=0)];四、 实验内容及步骤1、认真复习采样理论,离散信号与系统,线性卷积,序列的傅立叶变换及性质等有关内容,阅读本实验原理与方法。
数字信号处理实验报告一二
数字信号处理课程实验报告实验一 离散时间信号和系统响应一. 实验目的1. 熟悉连续信号经理想采样前后的频谱变化关系,加深对时域采样定理的理解2. 掌握时域离散系统的时域特性3. 利用卷积方法观察分析系统的时域特性4. 掌握序列傅里叶变换的计算机实现方法,利用序列的傅里叶变换对离散信号及系统响应进行频域分析二、实验原理1. 采样是连续信号数字化处理的第一个关键环节。
对采样过程的研究不仅可以了解采样前后信号时域和频域特性的变化以及信号信息不丢失的条件,而且可以加深对离散傅里叶变换、Z 变换和序列傅里叶变换之间关系式的理解。
对连续信号()a x t 以T 为采样间隔进行时域等间隔理想采样,形成采样信号: 式中()p t 为周期冲激脉冲,()a x t 为()a x t 的理想采样。
()a x t 的傅里叶变换为()a X j Ω:上式表明将连续信号()a x t 采样后其频谱将变为周期的,周期为Ωs=2π/T 。
也即采样信号的频谱()a X j Ω是原连续信号xa(t)的频谱Xa(jΩ)在频率轴上以Ωs 为周期,周期延拓而成的。
因此,若对连续信号()a x t 进行采样,要保证采样频率fs ≥2fm ,fm 为信号的最高频率,才可能由采样信号无失真地恢复出原模拟信号ˆ()()()a a xt x t p t =1()()*()21()n a a a s X j X j P j X j jn T π∞=-∞Ω=ΩΩ=Ω-Ω∑()()n P t t nT δ∞=-∞=-∑计算机实现时,利用计算机计算上式并不方便,因此我们利用采样序列的傅里叶变换来实现,即而()()j j n n X e x n e ωω∞-=-∞=∑为采样序列的傅里叶变换2. 时域中,描述系统特性的方法是差分方程和单位脉冲响应,频域中可用系统函数描述系统特性。
已知输入信号,可以由差分方程、单位脉冲响应或系统函数求出系统对于该输入信号的响应。
数字信号处理实验报告 (实验四)
实验四 离散时间信号的DTFT一、实验目的1. 运用MA TLAB 计算离散时间系统的频率响应。
2. 运用MA TLAB 验证离散时间傅立叶变换的性质。
二、实验原理(一)、计算离散时间系统的DTFT已知一个离散时间系统∑∑==-=-Nk k N k k k n x b k n y a 00)()(,可以用MATLAB 函数frequz 非常方便地在给定的L 个离散频率点l ωω=处进行计算。
由于)(ωj e H 是ω的连续函数,需要尽可能大地选取L 的值(因为严格说,在MA TLAB 中不使用symbolic 工具箱是不能分析模拟信号的,但是当采样时间间隔充分小的时候,可产生平滑的图形),以使得命令plot 产生的图形和真实离散时间傅立叶变换的图形尽可能一致。
在MA TLAB 中,freqz 计算出序列{M b b b ,,,10 }和{N a a a ,,,10 }的L 点离散傅立叶变换,然后对其离散傅立叶变换值相除得到L l eH l j ,,2,1),( =ω。
为了更加方便快速地运算,应将L 的值选为2的幂,如256或者512。
例3.1 运用MA TLAB 画出以下系统的频率响应。
y(n)-0.6y(n-1)=2x(n)+x(n-1)程序: clf;w=-4*pi:8*pi/511:4*pi;num=[2 1];den=[1 -0.6];h=freqz(num,den,w);subplot(2,1,1)plot(w/pi,real(h));gridtitle(‘H(e^{j\omega}的实部’))xlabel(‘\omega/ \pi ’);ylabel(‘振幅’);subplot(2,1,1)plot(w/pi,imag(h));gridtitle(‘H(e^{j\omega}的虚部’))xlabel(‘\omega/ \pi ’);ylabel(‘振幅’);(二)、离散时间傅立叶变换DTFT 的性质。
数字信号处理实验报告完整版[5篇模版]
![数字信号处理实验报告完整版[5篇模版]](https://img.taocdn.com/s3/m/7b21a71bb5daa58da0116c175f0e7cd184251866.png)
数字信号处理实验报告完整版[5篇模版]第一篇:数字信号处理实验报告完整版实验 1利用 T DFT 分析信号频谱一、实验目的1.加深对 DFT 原理的理解。
2.应用 DFT 分析信号的频谱。
3.深刻理解利用DFT 分析信号频谱的原理,分析实现过程中出现的现象及解决方法。
二、实验设备与环境计算机、MATLAB 软件环境三、实验基础理论T 1.DFT 与与 T DTFT 的关系有限长序列的离散时间傅里叶变换在频率区间的N 个等间隔分布的点上的 N 个取样值可以由下式表示:212 /0()|()()0 1Nj knjNk NkX e x n e X k k Nπωωπ--====≤≤-∑由上式可知,序列的 N 点 DFT ,实际上就是序列的 DTFT 在 N 个等间隔频率点上样本。
2.利用 T DFT 求求 DTFT方法 1 1:由恢复出的方法如下:由图 2.1 所示流程可知:101()()()Nj j n kn j nNn n kX e x n e X k W eNωωω∞∞----=-∞=-∞=⎡⎤==⎢⎥⎣⎦∑∑∑由上式可以得到:IDFT DTFT第二篇:数字信号处理实验报告JIANGSUUNIVERSITY OF TECHNOLOGY数字信号处理实验报告学院名称:电气信息工程学院专业:班级:姓名:学号:指导老师:张维玺(教授)2013年12月20日实验一离散时间信号的产生一、实验目的数字信号处理系统中的信号都是以离散时间形态存在的,所以对离散时间信号的研究是数字信号的基本所在。
而要研究离散时间信号,首先需要产生出各种离散时间信号。
使用MATLAB软件可以很方便地产生各种常见的离散时间信号,而且它还具有强大绘图功能,便于用户直观地处理输出结果。
通过本实验,学生将学习如何用MATLAB产生一些常见的离散时间信号,实现信号的卷积运算,并通过MATLAB中的绘图工具对产生的信号进行观察,加深对常用离散信号和信号卷积和运算的理解。
数字信号处理实验报告
数字信号处理实验报告实验一:混叠现象的时域与频域表现实验原理:当采样频率Fs不满足采样定理,会在0.5Fs附近引起频谱混叠,造成频谱分析误差。
实验过程:考虑频率分别为3Hz,7Hz,13Hz 的三个余弦信号,即:g1(t)=cos(6πt), g2(t)=cos(14πt), g3(t)=cos(26πt),当采样频率为10Hz 时,即采样间隔为0.1秒,则产生的序列分别为:g1[n]=cos(0.6πn), g2[n]=cos(1.4πn), g3[n]=cos(2.6πn)对g2[n],g3[n] 稍加变换可得:g2[n]=cos(1.4πn)=cos((2π-0.6π)n)= cos(0.6πn)g3[n]=cos(2.6πn)= cos((2π+0.6π)n)=cos(0.6πn)利用Matlab进行编程:n=1:300;t=(n-1)*1/300;g1=cos(6*pi*t);g2=cos(14*pi*t);g3=cos(26*pi*t);plot(t,g1,t,g2,t,g3);k=1:100;s=k*0.1;q1=cos(6*pi*s);q2=cos(14*pi*s);q3=cos(26*pi*s);hold on; plot(s(1:10),q1(1:10),'bd');figuresubplot(2,2,1);plot(k/10,abs(fft(q1)))subplot(2,2,2);plot(k/10,abs(fft(q2)))subplot(2,2,3);plot(k/10,abs(fft(q3)))通过Matlab软件的图像如图所示:如果将采样频率改为30Hz,则三信号采样后不会发生频率混叠,可运行以下的程序,观察序列的频谱。
程序编程改动如下:k=1:300;q=cos(6*pi*k/30);q1=cos(14*pi*k/30);q2=cos(26*pi*k/30);subplot(2,2,1);plot(k/10,abs(fft(q)))subplot(2,2,2);plot(k/10,abs(fft(q1)))subplot(2,2,3);plot(k/10,abs(fft(q2)))得图像:问题讨论:保证采样后的信号不发生混叠的条件是什么?若信号的最高频率为17Hz,采样频率为30Hz,问是否会发生频率混叠?混叠成频率为多少Hz的信号?编程验证你的想法。
数字信号处理实验一报告
实验一:用FFT 对信号作频谱分析1.实验目的学习用FFT 对连续信号和时域离散信号进行谱分析的方法,了解可能出现的分析 误差及其原因,以便正确应用FFT 。
2. 实验原理用FFT 对信号作频谱分析是学习数字信号处理的重要内容。
经常需要进行谱分析的信号是模拟信号和时域离散信号。
对信号进行谱分析的重要问题是频谱分辨率D 和分析误差。
频谱分辨率直接和FFT 的变换区间N 有关,因为FFT 能够实现的频率分辨率是N /2π,因此要求D N ≤/2π。
可以根据此式选择FFT 的变换区间N 。
误差主要来自于用FFT 作频谱分析时,得到的是离散谱,而信号(周期信号除外)是连续谱,只有当N 较大时离散谱的包络才能逼近于连续谱,因此N 要适当选择大一些。
周期信号的频谱是离散谱,只有用整数倍周期的长度作FFT ,得到的离散谱才能代表周期信号的频谱。
如果不知道信号周期,可以尽量选择信号的观察时间长一些。
对模拟信号进行谱分析时,首先要按照采样定理将其变成时域离散信号。
如果是模拟周期信号,也应该选取整数倍周期的长度,经过采样后形成周期序列,按照周期序列的谱分析进行。
3.实验步骤及内容(1)对以下序列进行谱分析。
⎪⎩⎪⎨⎧≤≤-≤≤-=⎪⎩⎪⎨⎧≤≤-≤≤+==其它nn n n n n x 其它nn n n n n x n R n x ,074,330,4)(,074,830,1)()()(3241选择FFT 的变换区间N 为8和16 两种情况进行频谱分析。
分别打印其幅频特性曲线。
并进行对比、分析和讨论。
(2)对以下周期序列进行谱分析。
4()cos4x n n π=5()cos(/4)cos(/8)x n n n ππ=+选择FFT 的变换区间N 为8和16 两种情况分别对以上序列进行频谱分析。
分别打印其幅频特性曲线。
并进行对比、分析和讨论。
(3)对模拟周期信号进行谱分析6()cos8cos16cos20x t t t t πππ=++选择 采样频率Hz F s 64=,变换区间N=16,32,64 三种情况进行谱分析。
数字信号处理期末综合实验报告
数字信号处理综合实验报告实验题目:基于Matlab的语音信号去噪及仿真专业名称:学号:姓名:日期:报告内容:一、实验原理1、去噪的原理1.1 采样定理在进行模拟/数字信号的转换过程中,当采样频率fs.max大于信号中,最高频率fmax的2倍时,即:fs.max>=2fmax,则采样之后的数字信号完整地保留了原始信号中的信息,一般实际应用中保证采样频率为信号最高频率的5~10倍;采样定理又称奈奎斯特定理。
1924年奈奎斯特(Nyquist>就推导出在理想低通信道的最高大码元传输速率的公式: 理想低通信道的最高大码元传输速率=2W*log2 N (其中W是理想低通信道的带宽,N是电平强度>为什么把采样频率设为8kHz?在数字通信中,根据采样定理, 最小采样频率为语音信号最高频率的2倍b5E2RGbCAP频带为F的连续信号f(t>可用一系列离散的采样值f(t1>,f(t1±Δt>,f(t1±2Δt>,...来表示,只要这些采样点的时间间隔Δt≤1/2F,便可根据各采样值完全恢复原来的信号f(t>。
这是时域采样定理的一种表述方式。
p1EanqFDPw时域采样定理的另一种表述方式是:当时间信号函数f(t>的最高频率分量为fM时,f(t>的值可由一系列采样间隔小于或等于1/2fM的采样值来确定,即采样点的重复频率f≥2fM。
图为模拟信号和采样样本的示意图。
DXDiTa9E3d时域采样定理是采样误差理论、随机变量采样理论和多变量采样理论的基础。
对于时间上受限制的连续信号f(t><即当│t│>T 时,f(t>=0,这里T=T2-T1是信号的持续时间),若其频谱为F<ω),则可在频域上用一系列离散的采样值 RTCrpUDGiT<1-1)5PCzVD7HxA采样值来表示,只要这些采样点的频率间隔<1-2)jLBHrnAILg。
史上最全数字信号处理实验报告完美版
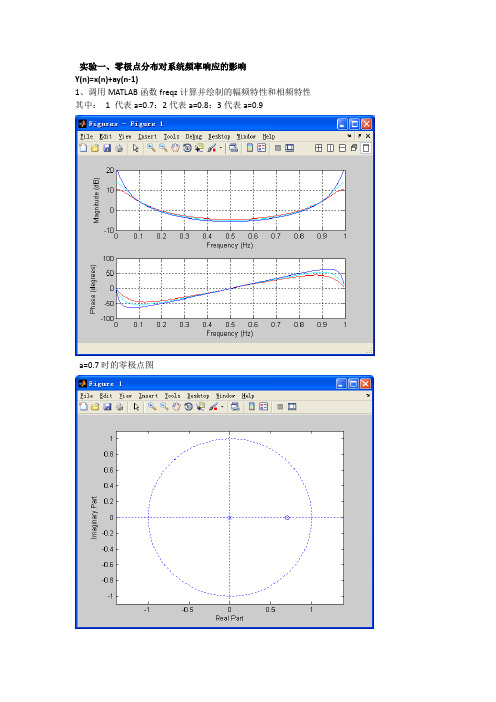
实验一、零极点分布对系统频率响应的影响Y(n)=x(n)+ay(n-1)1、调用MATLAB函数freqz计算并绘制的幅频特性和相频特性其中:1 代表a=0.7;2代表a=0.8;3代表a=0.9a=0.7时的零极点图A=0.8时的零极点图a=0.9时的零极点图观察零极点的分布与相应曲线易知:小结:系统极点z=a,零点z=0,当B点从w=0逆时针旋转时,在w=0点,由于极点向量长度最短,形成波峰,并且当a越大,极点越接近单位圆,峰值愈高愈尖锐;在w=pi点形成波谷;z=0处零点不影响幅频响应2、先求出系统传函的封闭表达式,通过直接计算法得出的幅频特性和相频特性曲线。
其中:1代表a=0.7;2代表a=0.8;3代表a=0.9附录程序如下:(对程序进行部分注释)>> a=0.7;w=0:0.01:2*pi;%设定w的范围由0到2π,间隔为0.01y=1./(1-a*exp(-j*w)); %生成函数subplot(211);plot(w/2/pi,10*log(abs(y)),'g');%生成图像其中通过调用abs函数计算幅值hold on;xlabel('Frequency(Hz)');%定义横坐标名称ylabel('magnitude(dB)');%定义纵坐标名称title('a=0.8,直接计算h(ejw)');grid on;%定义图片标题subplot(212);plot(w/2/pi,unwrap(angle(y)),'g');grid on;%生成图像其中通过调用angle计算相角,‘g’为规定线条颜色hold on;>> a=0.8;w=0:0.01:2*pi;y=1./(1-a*exp(-j*w));subplot(211);plot(w/2/pi,10*log(abs(y)),'r');hold on;xlabel('Frequency(Hz)');ylabel('magnitude(dB)');title('a=0.8,直接计算h(ejw)');grid on;subplot(212);plot(w/2/pi,unwrap(angle(y)),'r');grid on;hold on;>> a=0.9;w=0:0.01:2*pi;y=1./(1-a*exp(-j*w));subplot(211);plot(w/2/pi,10*log(abs(y)),'b');hold on;xlabel('Frequency(Hz)');ylabel('magnitude(dB)');title('a=0.9,直接计算h(ejw)');grid on;subplot(212);plot(w/2/pi,unwrap(angle(y)),'b');grid on;hold on;2、y(n)=x(n)=ax(n-1)通过调用freqz函数绘图,其中:1代表a=0.7,;2代表a=0.8;3代表a=0.9附录程序如下:(因为程序同实验一相同不再进行注释)a=0.7;A=1;B=[1,a];freqz(B,A,256,'whole',1);title('a=0.7');hold on;a=0.8;A=1;B=[1,a];freqz(B,A,256,'whole',1);title('a=0.8');hold on;a=0.9;A=1;B=[1,a];freqz(B,A,256,'whole',1);title('a=0.9');以下为a为不同数值时的零极点图a=0.7A=0.8A=0.9小结:系统极点z=0,零点z=a,当B点从w=0逆时针旋转时,在w=0点,由于零点向量长度最长,形成波峰:在w=pi点形成波谷;z=a处极点不影响相频响应。
数字信号处理实验三报告 数字信号处理上机实验报告.doc

数字信号处理实验三报告数字信号处理上机实验报告实验一系统响应及系统稳定性一、实验目的(1)掌握求系统响应的方法。
(2)掌握时域离散系统的时域特性。
(3)分析、观察及检验系统的稳定性。
二、实验内容(1)给定一个低通滤波器的差分方程为y(n)=0.05x(n)+0.05x(n-1)+0.9y(n-1)输入信号x1(n)=R8(n)x2(n)=u(n)(a) 分别求出系统对x1(n)=R8(n) 和x2(n)=u(n)的响应序列,并画出其波形。
(b) 求出系统的单位冲响应,画出其波形。
实验程序:A=[1,-0.9];B=[0.05,0.05]; %%系统差分方程系数向量 B 和 Ax1n=[1 1 1 1 1 1 1 1 zeros(1,50)]; %产生信号 x1(n)=R8(n)x2n=ones(1,8); %产生信号 x2(n)=u(n)y1n=filter(B,A,x1n); %求系统对 x1(n)的响应 y1(n)n=0:length(y1n)-1;subplot(2,2,1);stem(n,y1n,".");title("(a) 系统对 R_8(n)的响应y_1(n)");xlabel("n");ylabel("y_1(n)");y2n=filter(B,A,x2n); %求系统对 x2(n)的响应 y2(n) n=0:length(y2n)-1;subplot(2,2,2);stem(n,y2n,".");title("(b) 系统对 u(n)的响应y_2(n)");xlabel("n");ylabel("y_2(n)");hn=impz(B,A,58); %求系统单位脉冲响应 h(n)n=0:length(hn)-1;subplot(2,2,3);y=hn;stem(n,hn,".");title("(c) 系统单位脉冲响应h(n)");xlabel("n");ylabel("h(n)");运行结果图:(2)给定系统的单位脉冲响应为h1(n)=R10(n)h2(n)= δ(n)+2.5δ(n-1)+2.5δ(n-2)+δ(n-3)用线性卷积法分别求系统h1(n)和h2(n)对x1(n)=R8(n)的输出响应,波形。
数字信号处理实验报告(自己的实验报告)
数字信号处理实验报告西南交通大学信息科学与技术学院姓名:伍先春学号:20092487班级:自动化1班指导老师:张翠芳实验一序列的傅立叶变换实验目的进一步加深理解DFS,DFT 算法的原理;研究补零问题;快速傅立叶变换(FFT )的应用。
实验步骤1. 复习DFS 和DFT 的定义,性质和应用;2. 熟悉MATLAB 语言的命令窗口、编程窗口和图形窗口的使用;利用提供的程序例子编写实验用程序;按实验内容上机实验,并进行实验结果分析;写出完整的实验报告,并将程序附在后面。
实验内容1. 周期方波序列的频谱试画出下面四种情况下的的幅度频谱,并分析补零后,对信号频谱的影响。
2. 有限长序列x(n)的DFT(1) 取x(n)(n=0:10)时,画出x(n)的频谱X(k) 的幅度;(2) 将(1)中的x(n)以补零的方式,使x(n)加长到(n:0~100)时,画出x(n)的频谱X(k) 的幅度;(3) 取x(n)(n:0~100)时,画出x(n)的频谱X(k) 的幅度。
利用FFT进行谱分析 已知:模拟信号以t=0.01n(n=0:N-1)进行采样,求N 点DFT 的幅值谱。
请分别画出N=45; N=50;N=55;N=60时的幅值曲线。
数字信号处理实验一1.(1) L=5;N=20;60,7)4(;60,5)3(;40,5)2(;20,5)1()](~[)(~,2,1,01)1(,01,1)(~=========±±=⎩⎨⎧-+≤≤+-+≤≤=N L N L N L N L n x DFS k X m N m n L mN L mN n mN n x )52.0cos()48.0cos()(n n n x ππ+=)8cos(5)4sin(2)(t t t x ππ+=n=1:N;xn=[ones(1,L),zeros(1,N-L)];Xk=dfs(xn,N);magXk=abs([Xk(N/2+1:N) Xk(1:N/2+1)]);k=[-N/2:N/2];figure(1)subplot(2,1,1);stem(n,xn);xlabel('n');ylabel('xtide(n)'); title('DFS of SQ.wave:L=5,N=20');subplot(2,1,2);stem(k,magXk);axis([-N/2,N/2,0,16]);xlabel('k');ylabel('Xtide(k)');(2)L=5;N=40;n=1:N;xn=[ones(1,L),zeros(1,N-L)];Xk=dfs(xn,N);magXk=abs([Xk(N/2+1:N) Xk(1:N/2+1)]);k=[-N/2:N/2];figure(2)subplot(2,1,1);stem(n,xn);xlabel('n');ylabel('xtide(n)'); title('DFS of SQ.wave:L=5,N=40');subplot(2,1,2);stem(k,magXk);axis([-N/2,N/2,0,16]);xlabel('k');ylabel('Xtide(k)');(3)L=5;N=60;n=1:N;xn=[ones(1,L),zeros(1,N-L)];Xk=dfs(xn,N);magXk=abs([Xk(N/2+1:N) Xk(1:N/2+1)]);k=[-N/2:N/2];figure(3)subplot(2,1,1);stem(n,xn);xlabel('n');ylabel('xtide(n)'); title('DFS of SQ.wave:L=5,N=60');subplot(2,1,2);stem(k,magXk);axis([-N/2,N/2,0,16]);xlabel('k');ylabel('Xtide(k)');(4)L=7;N=60;n=1:N;xn=[ones(1,L),zeros(1,N-L)];Xk=dfs(xn,N);magXk=abs([Xk(N/2+1:N) Xk(1:N/2+1)]);k=[-N/2:N/2];figure(4)subplot(2,1,1);stem(n,xn);xlabel('n');ylabel('xtide(n)'); title('DFS of SQ.wave:L=7,N=60');subplot(2,1,2);stem(k,magXk);axis([-N/2,N/2,0,16]);xlabel('k');ylabel('Xtide(k)');2. (1)M=10;N=10;n=1:M;xn=cos(0.48*pi*n)+cos(0.52*pi*n);n1=[0:1:N-1];y1=[xn(1:1:M),zeros(1,N-M)]; figure(1)subplot(2,1,1);stem(n1,y1);xlabel('n'); title('signal x(n),0<=n<=10');axis([0,N,-2.5,2.5]);Y1=fft(y1);magY1=abs(Y1(1:1:N/2+1));k1=0:1:N/2;w1=2*pi/N*k1;subplot(2,1,2);title('Samples of DTFT Magnitude');stem(w1/pi,magY1); axis([0,1,0,10]);xlabel('frequency in pi units');(2)M=10;N=100;n=1:M;xn=cos(0.48*pi*n)+cos(0.52*pi*n);n1=[0:1:N-1];y1=[xn(1:1:M),zeros(1,N-M)]; figure(2)subplot(2,1,1);stem(n1,y1);xlabel('n'); title('signal x(n),0<=n<=10');axis([0,N,-2.5,2.5]);Y1=fft(y1);magY1=abs(Y1(1:1:N/2+1));k1=0:1:N/2;w1=2*pi/N*k1;subplot(2,1,2);title('Samples of DTFT Magnitude');stem(w1/pi,magY1); axis([0,1,0,10]);xlabel('frequency in pi units');(3)M=100;N=100;n=1:M;xn=cos(0.48*pi*n)+cos(0.52*pi*n);n1=[0:1:N-1];y1=[xn(1:1:M),zeros(1,N-M)]; figure(3)subplot(2,1,1);stem(n1,y1);xlabel('n'); title('signal x(n),0<=n<=100');axis([0,N,-2.5,2.5]);Y1=fft(y1);magY1=abs(Y1(1:1:N/2+1));k1=0:1:N/2;w1=2*pi/N*k1;subplot(2,1,2);title('Samples of DTFT Magnitude');stem(w1/pi,magY1); axis([0,1,0,10]);xlabel('frequency in pi units');3.figure(1)subplot(2,2,1)N=45;n=0:N-1;t=0.01*n;q=n*2*pi/N;x=2*sin(4*pi*t)+5*cos(8*pi*t); y=fft(x,N);plot(q,abs(y))stem(q,abs(y))title('FFT N=45')%subplot(2,2,2)N=50;n=0:N-1;t=0.01*n;q=n*2*pi/N;x=2*sin(4*pi*t)+5*cos(8*pi*t); y=fft(x,N);plot(q,abs(y))title('FFT N=50')%subplot(2,2,3)N=55;n=0:N-1;t=0.01*n;q=n*2*pi/N;x=2*sin(4*pi*t)+5*cos(8*pi*t); y=fft(x,N);plot(q,abs(y))title('FFT N=55')%subplot(2,2,4)N=16;n=0:N-1;t=0.01*n;q=n*2*pi/N;x=2*sin(4*pi*t)+5*cos(8*pi*t); y=fft(x,N);plot(q,abs(y))title('FFT N=16')function[Xk]=dfs(xn,N)n=[0:1:N-1];k=[0:1:N-1];WN=exp(-j*2*pi/N);nk=n'*k;WNnk=WN.^nk;Xk=xn*WNnk;实验二 用双线性变换法设计IIR 数字滤波器 一、 实验目的1. 熟悉用双线性变换法设计IIR 数字滤波器的原理与方法; 2. 掌握数字滤波器的计算机仿真方法;3.通过观察对实际心电图的滤波作用,获得数字滤波器的感性知识。
数字信号处理实验报告MATLAB

数字信号处理实验报告姓名:班级:09电信一班学号:2)]得下图二,图二图一3.将如下文件另存为:sigadd.m文件function [y,n] = sigadd(x1,n1,x2,n2)% 实现y(n) = x1(n)+x2(n)% -----------------------------% [y,n] = sigadd(x1,n1,x2,n2)% y = 在包含n1 和n2 的n点上求序列和,% x1 = 在n1上的第一序列% x2 = 在n2上的第二序列(n2可与n1不等)n = min(min(n1),min(n2)):max(max(n1),max(n2)); % y(n)的长度y1 = zeros(1,length(n)); y2 = y1; % 初始化y1(find((n>=min(n1))&(n<=max(n1))==1))=x1; % 具有y的长度的x1y2(find((n>=min(n2))&(n<=max(n2))==1))=x2; % 具有y的长度的x2y = y1+y2;在命令窗口输入:x1=[1,0.5,0.3,0.4];n1=-1:2;x2=[0.2,0.3,0.4,0.5,0.8,1];n2=-2:3; [y,n] = sigadd(x1,n1,x2,n2)得:y =n=-1:10;x=sin(0.4*pi*n);y=fliplr(x);n1=-fliplr(n);subplot(2,1,1),stem(n,x) subplot(2,1,2),stem(n1,y在命令窗口键入:n=-1:10; x=sin(0.4*pi*n);n (samples)实验结果:1.(1)在命令窗口输入:tic; [am,pha]=dft1(x)N=length(x);w=exp(-j*2*pi/N);for k=1:Nsum=0;for n=1:Nsum=sum+x(n)*w^((k-1)*(n-1));endam(k)=abs(sum);pha(k)=angle(sum);end;toc得到如下结果:am =Columns 1 through 11120.0000 41.0066 20.9050 14.3996 11.3137 9.6215 8.6591 8.1567 8.0000 8.1567 8.6591Columns 12 through 169.6215 11.3137 14.3996 20.9050 41.0066pha =Columns 1 through 110 1.7671 1.9635 2.1598 2.3562 2.5525 2.7489 2.9452 3.1416 -2.9452 -2.7489Columns 12 through 16-2.5525 -2.3562 -2.1598 -1.9635 -1.7671Elapsed time is 0.047000 seconds.(2)在命令窗口输入:tic;[am,pha]=dft2(x)N=length(x);n=[0:N-1];k=[0:N-1];w=exp(-j*2*pi/N);nk=n’*k;wnk=w.^(nk); Xk=x*wnk; am= abs(Xk); pha=angle(Xk); toc得到下图:figure(1)00.10.20.30.40.50.60.70.80.91signal x(n), 0 <= n <= 99(2)在命令窗口键入:n3=[0:1:99];y3=[x(1:1:10) zeros(1,90)]; %添90个零。
数字信号处理实验报告

《数字信号处理》实验报告实验一:Z 变换及离散时间系统分析给定系统)8.0/(2.0)(2+-=z z H ,编程并绘出系统的单位阶跃响应y(n),频率响应)e (jw H 。
给出实验报告。
实验代码clear;x=ones(100); t=1:100;b=[0 0 -0.2 ]; a=[1 0 0.8]; y=filter(b,a,x); (t,x,'r.',t,y,'k-'); grid on ;ylabel('x(n) and y(n)') xlabel('n')单位阶跃响应单位抽样:b=[0 0 -0.2 ]; a=[1 0 0.8];[h,t]=impz(b,a,70);stem(t,h, '.')幅頻,相频b=[0 0 -0.2 ];a=[1 0 0.8];[H,w]=freqz(b,a,256,1);Hr=abs(H);Hphase=angle(H);Hphase=unwrap(Hphase); subplot(211)plot(w,Hr);grid on;ylabel(' 幅频.')subplot(212)plot(w,Hphase);grid on; ylabel(' 相频')零极点图:b=[0 0 -0.2 ];a=[1 0 0.8];subplot(221);zplane(b,a);实验二:快速傅里叶变换设x(n)由三个实正弦组成,频率分别是8Hz,9Hz,10Hz,抽样频率为60 Hz,时域取256点,作FFT变换,观察波形,给出实验报告。
实验代码:clear all;N=256;f1=8;f2=9;f3=10;fs=60;w=2*pi/fs;x=sin(w*f1*(0:N-1))+sin(w*f2*(0:N-1))+sin(w*f3*(0:N-1)); subplot(3,1,1);plot(x(1:N/4));f=-0.5:1/N:0.5-1/N;X=fft(x);=ifft(X);(3,1,2);plot(f,fftshift(abs(X)));subplot(3,1,3);plot(real(y(1:N/4)));实验三:无限冲击响应数字滤波器设计设计一个数字带通滤波器,参数自定。
数字信号处理实验报告(全)
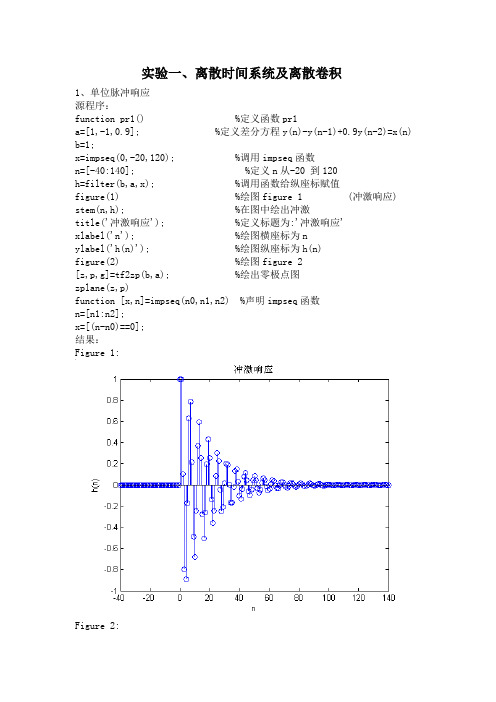
实验一、离散时间系统及离散卷积1、单位脉冲响应源程序:function pr1() %定义函数pr1a=[1,-1,0.9]; %定义差分方程y(n)-y(n-1)+0.9y(n-2)=x(n) b=1;x=impseq(0,-20,120); %调用impseq函数n=[-40:140]; %定义n从-20 到120h=filter(b,a,x); %调用函数给纵座标赋值figure(1) %绘图figure 1 (冲激响应) stem(n,h); %在图中绘出冲激title('冲激响应'); %定义标题为:'冲激响应'xlabel('n'); %绘图横座标为nylabel('h(n)'); %绘图纵座标为h(n)figure(2) %绘图figure 2[z,p,g]=tf2zp(b,a); %绘出零极点图zplane(z,p)function [x,n]=impseq(n0,n1,n2) %声明impseq函数n=[n1:n2];x=[(n-n0)==0];结果:Figure 1:Figure 2:2、离散系统的幅频、相频的分析源程序:function pr2()b=[0.0181,0.0543,0.0543,0.0181];a=[1.000,-1.76,1.1829,-0.2781];m=0:length(b)-1; %m从0 到3l=0:length(a)-1; %l从0 到3K=5000;k=1:K;w=pi*k/K; %角频率wH=(b*exp(-j*m'*w))./(a*exp(-j*l'*w));%对系统函数的定义magH=abs(H); %magH为幅度angH=angle(H); %angH为相位figure(1)subplot(2,1,1); %在同一窗口的上半部分绘图plot(w/pi,magH); %绘制w(pi)-magH的图形grid;axis([0,1,0,1]); %限制横纵座标从0到1xlabel('w(pi)'); %x座标为 w(pi)ylabel('|H|'); %y座标为 angle(H)title('幅度,相位响应'); %图的标题为:'幅度,相位响应' subplot(2,1,2); %在同一窗口的下半部分绘图plot(w/pi,angH); %绘制w(pi)-angH的图形grid; %为座标添加名称xlabel('w(pi)'); %x座标为 w(pi)ylabel('angle(H)'); %y座标为 angle(H)结果:3、卷积计算源程序:function pr3()n=-5:50; %声明n从-5到50u1=stepseq(0,-5,50); %调用stepseq函数声用明u1=u(n)u2=stepseq(10,-5,50); %调用stepseq函数声用明u2=u(n-10) %输入x(n)和冲激响应h(n)x=u1-u2; %x(n)=u(n)-u(n-10)h=((0.9).^n).*u1; %h(n)=0.9^n*u(n)figure(1)subplot(3,1,1); %绘制第一个子图stem(n,x); %绘制图中的冲激axis([-5,50,0,2]); %限定横纵座标的范围title('输入序列'); %规定标题为:'输入序列'xlabel('n'); %横轴为nylabel('x(n)'); %纵轴为x(n)subplot(3,1,2); %绘制第二个子图stem(n,h); %绘制图中的冲激axis([-5,50,0,2]); %限定横纵座标的范围title('冲激响应序列'); %规定标题为:'冲激响应序列'xlabel('n'); %横轴为nylabel('h(n)'); %纵轴为h(n)%输出响应[y,ny]=conv_m(x,n,h,n); %调用conv_m函数subplot(3,1,3); %绘制第三个子图stem(ny,y);axis([-5,50,0,8]);title('输出响应'); %规定标题为:'输出响应'xlabel('n');ylabel('y(n)'); %纵轴为y(n)%stepseq.m子程序%实现当n>=n0时x(n)的值为1function [x,n]=stepseq(n0,n1,n2)n=n1:n2;x=[(n-n0)>=0];%con_m的子程序%实现卷积的计算function [y,ny]=conv_m(x,nx,h,nh)nyb=nx(1)+nh(1);nye=nx(length(x))+nh(length(h));ny=[nyb:nye];y=conv(x,h);结果:实验二、离散傅立叶变换与快速傅立叶变换1、离散傅立叶变换(DFT)源程序:function pr4()F=50;N=64;T=0.000625;n=1:N;x=cos(2*pi*F*n*T); %x(n)=cos(pi*n/16)subplot(2,1,1); %绘制第一个子图x(n)stem(n,x); %绘制冲激title('x(n)'); %标题为x(n)xlabel('n'); %横座标为nX=dft(x,N); %调用dft函数计算x(n)的傅里叶变换magX=abs(X); %取变换的幅值subplot(2,1,2); %绘制第二个子图DFT|X|stem(n,X);title('DFT|X|');xlabel('f(pi)'); %横座标为f(pi)%dft的子程序%实现离散傅里叶变换function [Xk]=dft(xn,N)n=0:N-1;k=0:N-1;WN=exp(-j*2*pi/N);nk=n'*k;WNnk=WN.^nk;Xk=xn*WNnk;结果:F=50,N=64,T=0.000625时的波形F=50,N=32,T=0.000625时的波形:2、快速傅立叶变换(FFT)源程序:%function pr5()F=50;N=64;T=0.000625;n=1:N;x=cos(2*pi*F*n*T); %x(n)=cos(pi*n/16) subplot(2,1,1);plot(n,x);title('x(n)');xlabel('n'); %在第一个子窗中绘图x(n)X=fft(x);magX=abs(X);subplot(2,1,2);plot(n,X);title('DTFT|X|');xlabel('f(pi)'); %在第二个子图中绘图x(n)的快速傅%里叶变换结果:3、卷积的快速算法源程序:function pr6()n=0:14;x=1.^n;h=(4/5).^n;x(15:32)=0;h(15:32)=0;%到此 x(n)=1, n=0~14; x(n)=0,n=15~32% h(n)=(4/5)^n, n=0~14; h(n)=0,n=15~32subplot(3,1,1);stem(x);title('x(n)');axis([1,32,0,1.5]); %在第一个子窗绘图x(n)横轴从1到32,纵轴从0到1.5 subplot(3,1,2);stem(h);title('h(n)');axis([1,32,0,1.5]); %在第二个子窗绘图h(n)横轴从1到32,纵轴从0到1.5 X=fft(x); %X(n)为x(n)的快速傅里叶变换H=fft(h); %H(n)为h(n)的快速傅里叶变换Y=X.*H; %Y(n)=X(n)*H(n)%Y=conv(x,h);y=ifft(Y); %y(n)为Y(n)的傅里叶反变换subplot(3,1,3) %在第三个子窗绘图y(n)横轴从1到32,纵轴从0到6 stem(abs(y));title('y(n=x(n)*h(n))');axis([1,32,0,6]);结果:实验三、IIR数字滤波器设计源程序:function pr7()wp=0.2*pi;ws=0.3*pi;Rp=1;As=25;T=1;Fs=1/T;OmegaP=(2/T)*tan(wp/2); %OmegaP(w)=2*tan(0.1*pi) OmegaS=(2/T)*tan(ws/2); %OmegaS(w)=2*tan(0.15*pi)ep=sqrt(10^(Rp/10)-1);Ripple=sqrt(1/(1+ep.^2));Attn=1/10^(As/20);N=ceil((log10((10^(Rp/10)-1)/(10^(As/10)-1)))/(2*log10(OmegaP/OmegaS) ));OmegaC=OmegaP/((10.^(Rp/10)-1).^(1/(2*N)));[cs,ds]=u_buttap(N,OmegaC);[b,a]=bilinear(cs,ds,Fs);[mag,db,pha,w]=freqz_m(b,a);subplot(3,1,1); %在第一个子窗绘制幅度响应的图形plot(w/pi,mag);title('幅度响应');xlabel('w(pi)');ylabel('H');axis([0,1,0,1.1]);set(gca,'XTickmode','manual','XTick',[0,0.2,0.35,1.1]);set(gca,'YTickmode','manual','YTick',[0,Attn,Ripple,1]);grid;subplot(3,1,2); %在第二个子窗以分贝为单位绘制幅度响应的图形plot(w/pi,db);title('幅度响应(dB)');xlabel('w(pi)');ylabel('H');axis([0,1,-40,5]);set(gca,'XTickmode','manual','XTick',[0,0.2,0.35,1.1]);set(gca,'YTickmode','manual','YTick',[-50,-15,-1,0]);grid;subplot(3,1,3); %在第三个子窗绘制相位响应的图形plot(w/pi,pha);title('相位响应');xlabel('w(pi)');ylabel('pi unit');%axis([0,1,0,1.1]);set(gca,'XTickmode','manual','XTick',[0,0.2,0.35,1.1]);set(gca,'YTickmode','manual','YTick',[-1,0,1]);grid;function [b,a]=u_buttap(N,OmegaC)[z,p,k]=buttap(N);p=p*OmegaC;k=k*OmegaC.^N;B=real(poly(z));b0=k;b=k*B;a=real(poly(p));function [mag,db,pha,w]=freqz_m(b,a)[H,w]=freqz(b,a,1000,'whole');H=(H(1:501))';w=(w(1:501))';mag=abs(H);db=20*log10((mag+eps)/max(mag));pha=angle(H);结果:实验四、FIR数字滤波器的设计源程序:function pr8()wp=0.2*pi;ws=0.35*pi;tr_width=ws-wp;M=ceil(6.6*pi/tr_width)+1;n=0:M-1;wc=(ws+wp)/2;alpha=(M-1)/2;m=n-alpha+eps;hd=sin(wc*m)./(pi*m);w_ham=(hamming(M))';h=hd.*w_ham;[mag,db,pha,w]=freqz_m(h,[1]);delta_w=2*pi/1000;Rp=-(min(db(1:wp/delta_w+1)));As=-round(max(db(ws/delta_w+1:501)));subplot(2,2,1);stem(n,hd);title('理想冲激响应');axis([0,M-1,-0.1,0.3]);ylabel('hd(n)');subplot(2,2,2);stem(n,h);title('实际冲激响应');axis([0,M-1,-0.1,0.3]);ylabel('h(n)');subplot(2,2,3);plot(w/pi,pha);title('滤波器相位响应');axis([0,1,-pi,pi]);ylabel('pha');set(gca,'XTickmode','manual','XTick',[0,0.2,0.3,1.1]); set(gca,'YTickmode','manual','YTick',[-pi,0,pi]); grid;subplot(2,2,4);plot(w/pi,db);title('滤波器幅度响应');axis([0,1,-100,10]);ylabel('H(db)');set(gca,'XTickmode','manual','XTick',[0,0.2,0.3,1.1]); set(gca,'YTickmode','manual','YTick',[-50,-15,0]);function [mag,db,pha,w]=freqz_m(b,a)[H,w]=freqz(b,a,1000,'whole');H=(H(1:501))';w=(w(1:501))';mag=abs(H);db=20*log10((mag+eps)/max(mag));pha=angle(H);结果:。
- 1、下载文档前请自行甄别文档内容的完整性,平台不提供额外的编辑、内容补充、找答案等附加服务。
- 2、"仅部分预览"的文档,不可在线预览部分如存在完整性等问题,可反馈申请退款(可完整预览的文档不适用该条件!)。
- 3、如文档侵犯您的权益,请联系客服反馈,我们会尽快为您处理(人工客服工作时间:9:00-18:30)。
Name:Section:Laboratory Exercise 2DISCRETE-TIME SYSTEMS: TIME-DOMAIN REPRESENTATION 2.1 SIMULATION OF DISCRETE-TIME SYSTEMSProject 2.1The Moving Average SystemA copy of Program P2_1 is given below:% Program P2_1% Simulation of an M-point Moving Average Filter% Generate the input signaln = 0:100;s1 = cos(2*pi*0.05*n); % A low-frequency sinusoids2 = cos(2*pi*0.47*n); % A high frequency sinusoidx = s1+s2;% Implementation of the moving average filterM = input('Desired length of the filter = ');num = ones(1,M);y = filter(num,1,x)/M;% Display the input and output signalsclf;subplot(2,2,1);plot(n, s1);axis([0, 100, -2, 2]);xlabel('Time index n'); ylabel('Amplitude');title('Signal #1');subplot(2,2,2);plot(n, s2);axis([0, 100, -2, 2]);xlabel('Time index n'); ylabel('Amplitude');title('Signal #2');subplot(2,2,3);plot(n, x);axis([0, 100, -2, 2]);xlabel('Time index n'); ylabel('Amplitude');title('Input Signal');subplot(2,2,4);plot(n, y);axis([0, 100, -2, 2]);xlabel('Time index n'); ylabel('Amplitude');title('Output Signal');axis;Answers:Q2.1 The output sequence generated by running the above program for M = 2 with x[n] = s1[n]+s2[n] as the input is shown below.The component of the input x[n] suppressed by the discrete-time system simulated bythis program is–s2Q2.2Program P2_1 is modified to simulate the LTI system y[n] = 0.5(x[n]–x[n–1]) and process the input x[n] = s1[n]+s2[n] resulting in the output sequence shown below:s3=cos(2*pi*0.05*(n-1));s4= cos(2*pi*0.47*(n-1));z=s3+s4;y = 0.5*(x-z);The effect of changing the LTI system on the input is - Project 2.2 (Optional) A Simple Nonlinear Discrete-Time SystemA copy of Program P2_2 is given below:% Program P2_2% Generate a sinusoidal input signalclf;n = 0:200;x = cos(2*pi*0.05*n);% Compute the output signalx1 = [x 0 0]; % x1[n] = x[n+1]x2 = [0 x 0]; % x2[n] = x[n]x3 = [0 0 x]; % x3[n] = x[n-1]y = x2.*x2-x1.*x3;y = y(2:202);% Plot the input and output signalssubplot(2,1,1)plot(n, x)xlabel('Time index n');ylabel('Amplitude');title('Input Signal')subplot(2,1,2)plot(n,y)xlabel('Time index n');ylabel('Amplitude');title('Output signal');Answers:Q2.5The sinusoidal signals with the following frequencies as the input signals were used to generate the output signals:The output signals generated for each of the above input signals are displayed below:The output signals depend on the frequencies of the input signal according to the following rules:This observation can be explained mathematically as follows:Project 2.3 Linear and Nonlinear SystemsA copy of Program P2_3 is given below:% Program P2_3% Generate the input sequencesclf;n = 0:40;a = 2;b = -3;x1 = cos(2*pi*0.1*n);x2 = cos(2*pi*0.4*n);x = a*x1 + b*x2;num = [2.2403 2.4908 2.2403];den = [1 -0.4 0.75];ic = [0 0]; % Set zero initial conditionsy1 = filter(num,den,x1,ic); % Compute the output y1[n]y2 = filter(num,den,x2,ic); % Compute the output y2[n]y = filter(num,den,x,ic); % Compute the output y[n]yt = a*y1 + b*y2;d = y - yt; % Compute the difference output d[n]% Plot the outputs and the difference signalsubplot(3,1,1)stem(n,y);ylabel('Amplitude');title('Output Due to Weighted Input: a \cdot x_{1}[n] + b \cdot x_{2}[n]');subplot(3,1,2)stem(n,yt);ylabel('Amplitude');title('Weighted Output: a \cdot y_{1}[n] + b \cdot y_{2}[n]');subplot(3,1,3)stem(n,d);xlabel('Time index n');ylabel('Amplitude');title('Difference Signal');Answers:Q2.7 The outputs y[n], obtained with weighted input, and yt[n], obtained by combining the two outputs y1[n] and y2[n] with the same weights, are shown below along with the difference between the two signals:The two sequences are –same ;we can regard 10(-15) as 0The system is – a liner systemQ2.9Program 2_3 was run with the following non-zero initial conditions -ic = [2 2];The plots generated are shown below -Based on these plots we can conclude that the system with nonzero initial conditions is –as same as the zero initial condition with the time goneProject 2.4 Time-invariant and Time-varying SystemsA copy of Program P2_4 is given below:% Program P2_4% Generate the input sequencesclf;n = 0:40; D = 10;a = 3.0;b = -2;x = a*cos(2*pi*0.1*n) + b*cos(2*pi*0.4*n);xd = [zeros(1,D) x];num = [2.2403 2.4908 2.2403];den = [1 -0.4 0.75];ic = [0 0]; % Set initial conditions% Compute the output y[n]y = filter(num,den,x,ic);% Compute the output yd[n]yd = filter(num,den,xd,ic);% Compute the difference output d[n]d = y - yd(1+D:41+D);% Plot the outputssubplot(3,1,1)stem(n,y);ylabel('Amplitude');title('Output y[n]'); grid;subplot(3,1,2)stem(n,yd(1:41));ylabel('Amplitude');title(['Output due to Delayed Input x[n ?, num2str(D),']']); grid;subplot(3,1,3)stem(n,d);xlabel('Time index n'); ylabel('Amplitude');title('Difference Signal'); grid;Answers:Q2.12The output sequences y[n] and yd[n-10] generated by running Program P2_4 are shown below -These two sequences are related as follows–same, the output don’t change with the timeThe system is - Time invariant systemQ2.15 The output sequences y[n] and yd[n-10] generated by running Program P2_4 for non-zero initial conditions are shown below - ic = [5 2];These two sequences are related as follows – just as the sequences aboveThe system is–not related to the initial conditions2.2 LINEAR TIME-INVARIANT DISCRETE-TIME SYSTEMSProject 2.5Computation of Impulse Responses of LTI SystemsA copy of Program P2_5 is shown below:% Program P2_5% Compute the impulse response yclf;N = 40;num = [2.2403 2.4908 2.2403];den = [1 -0.4 0.75];y = impz(num,den,N);% Plot the impulse responsestem(y);xlabel('Time index n'); ylabel('Amplitude');title('Impulse Response'); grid;Answers:Q2.19 The first 41 samples of the impulse response of the discrete-time system of Project2.3 generated by running Program P2_5 is given below:Project 2.6 Cascade of LTI SystemsA copy of Program P2_6 is given below:% Program P2_6% Cascade Realizationclf;x = [1 zeros(1,40)]; % Generate the inputn = 0:40;% Coefficients of 4th order systemden = [1 1.6 2.28 1.325 0.68];num = [0.06 -0.19 0.27 -0.26 0.12];% Compute the output of 4th order systemy = filter(num,den,x);% Coefficients of the two 2nd order systemsnum1 = [0.3 -0.2 0.4];den1 = [1 0.9 0.8];num2 = [0.2 -0.5 0.3];den2 = [1 0.7 0.85];% Output y1[n] of the first stage in the cascadey1 = filter(num1,den1,x);% Output y2[n] of the second stage in the cascadey2 = filter(num2,den2,y1);% Difference between y[n] and y2[n]d = y - y2;% Plot output and difference signalssubplot(3,1,1);stem(n,y);ylabel('Amplitude');title('Output of 4th order Realization'); grid;subplot(3,1,2);stem(n,y2)ylabel('Amplitude');title('Output of Cascade Realization'); grid;subplot(3,1,3);stem(n,d)xlabel('Time index n');ylabel('Amplitude');title('Difference Signal'); grid;Answers:Q2.23The output sequences y[n], y2[n], and the difference signal d[n] generated by running Program P2_6 are indicated below:The relation between y[n] and y2[n] is– y[n] is the Convolution of y2[n] and y1[n]The 4th order system can do the same job as the cascade systemQ2.24 The sequences generated by running Program P2_6 with the input changed to asinusoidal sequence are as follows:x = sin(2*pi*0.05*n);The relation between y[n] and y2[n] in this case is–same as the relation aboveProject 2.7 ConvolutionA copy of Program P2_7 is reproduced below:% Program P2_7clf;h = [3 2 1 -2 1 0 -4 0 3]; % impulse responsex = [1 -2 3 -4 3 2 1]; % input sequencey = conv(h,x);n = 0:14;subplot(2,1,1);stem(n,y);xlabel('Time index n'); ylabel('Amplitude');title('Output Obtained by Convolution'); grid;x1 = [x zeros(1,8)];y1 = filter(h,1,x1);subplot(2,1,2);stem(n,y1);xlabel('Time index n'); ylabel('Amplitude');title('Output Generated by Filtering'); grid;Answers:Q2.28 The sequences y[n] and y1[n] generated by running Program P2_7 are shown below:The difference between y[n] and y1[n] is - sameThe reason for using x1[n]as the input, obtained by zero-padding x[n], for generating y1[n] is–the length of x is 7,but the length of the Convolution is 14,and n=14,we need the length of filter to be 14Project 2.8 Stability of LTI SystemsA copy of Program P2_8 is given below:% Program P2_8% Stability test based on the sum of the absolute% values of the impulse response samplesclf;num = [1 -0.8]; den = [1 1.5 0.9];N = 200;h = impz(num,den,N+1);parsum = 0;for k = 1:N+1;parsum = parsum + abs(h(k));if abs(h(k)) < 10^(-6), break, endend% Plot the impulse responsen = 0:N;stem(n,h)xlabel('Time index n'); ylabel('Amplitude');% Print the value of abs(h(k))disp('Value =');disp(abs(h(k)));Answers:Q2.32The discrete-time system of Program P2_8 is -[h,t] = impz(hd) computes the instantaneous impulse response of the discrete-time filter hd choosing the number of samples for you, and returns theresponse in column vector h and a vector of times or sample intervalsin t where (t = [0 1 2...]'). impz returns a matrix h if hd is avector. Each column of the matrix corresponds to one filter in thevector. When hd is a vector of discrete-time filters, impz returns thematrix h. Each column of h corresponds to one filter in the vector hd. impz(hd) uses FVTool to plot the impulse response of the discrete-time filter hd. If hd is a vector of filters, impz plots the response and for eachfilter in the vector.The impulse response generated by running Program P2_8 is shown below:The value of |h(K)| here is - 1.6761e-005From this value and the shape of the impulse response we can conclude that the system is - ?By running Program P2_8 with a larger value of N the new value of |h(K)| is -9.1752e-007N = 400;From this value we can conclude that the system is - ? Project 2.9 Illustration of the Filtering ConceptA copy of Program P2_9 is given below:% Program P2_9% Generate the input sequenceclf;n = 0:299;x1 = cos(2*pi*10*n/256);x2 = cos(2*pi*100*n/256);x = x1+x2;% Compute the output sequencesnum1 = [0.5 0.27 0.77];y1 = filter(num1,1,x); % Output of System #1den2 = [1 -0.53 0.46];num2 = [0.45 0.5 0.45];y2 = filter(num2,den2,x); % Output of System #2% Plot the output sequencessubplot(2,1,1);plot(n,y1);axis([0 300 -2 2]);ylabel('Amplitude');title('Output of System #1'); grid;subplot(2,1,2);plot(n,y2);axis([0 300 -2 2]);xlabel('Time index n'); ylabel('Amplitude');title('Output of System #2'); grid;Answers:Q2.34The output sequences generated by this program are shown below:The filter with better characteristics for the suppression of the high frequency component of the input signal x[n] is–system#2Date: Signature:。