MATLAB简单程序大全
matlab实用程序百例

1-32是:图形应用篇33-66是:界面设计篇67-84是:图形处理篇85-100是:数值分析篇实例1:三角函数曲线(1)function shili01h0=figure('toolbar','none',...'position',[198 56 350 300],...'name','实例01');h1=axes('parent',h0,...'visible','off');x=-pi:0.05:pi;y=sin(x);plot(x,y);xlabel('自变量X');ylabel('函数值Y');title('SIN( )函数曲线');grid on实例2:三角函数曲线(2)function shili02h0=figure('toolbar','none',...'position',[200 150 450 350],...'name','实例02');x=-pi:0.05:pi;y=sin(x)+cos(x);plot(x,y,'-*r','linewidth',1);grid onxlabel('自变量X');ylabel('函数值Y');title('三角函数');实例3:图形的叠加function shili03h0=figure('toolbar','none',...'position',[200 150 450 350],...'name','实例03');x=-pi:0.05:pi;y1=sin(x);y2=cos(x);plot(x,y1,...'-*r',...x,y2,...'--og');grid onxlabel('自变量X');ylabel('函数值Y');title('三角函数');实例4:双y轴图形的绘制function shili04h0=figure('toolbar','none',...'position',[200 150 450 250],...'name','实例04');x=0:900;a=1000;b=0.005;y1=2*x;y2=cos(b*x);[haxes,hline1,hline2]=plotyy(x,y1,x,y2,'semilogy','plot'); axes(haxes(1))ylabel('semilog plot');axes(haxes(2))ylabel('linear plot');实例5:单个轴窗口显示多个图形function shili05h0=figure('toolbar','none',...'position',[200 150 450 250],...'name','实例05');t=0:pi/10:2*pi;[x,y]=meshgrid(t);subplot(2,2,1)plot(sin(t),cos(t))axis equalsubplot(2,2,2)z=sin(x)-cos(y);plot(t,z)axis([0 2*pi -2 2])subplot(2,2,3)h=sin(x)+cos(y);plot(t,h)axis([0 2*pi -2 2])subplot(2,2,4)g=(sin(x).^2)-(cos(y).^2);plot(t,g)axis([0 2*pi -1 1])实例6:图形标注function shili06h0=figure('toolbar','none',...'position',[200 150 450 400],...'name','实例06');t=0:pi/10:2*pi;h=plot(t,sin(t));xlabel('t=0到2\pi','fontsize',16);ylabel('sin(t)','fontsize',16);title('\it{从0to2\pi 的正弦曲线}','fontsize',16) x=get(h,'xdata');y=get(h,'ydata');imin=find(min(y)==y);imax=find(max(y)==y);text(x(imin),y(imin),...['\leftarrow最小值=',num2str(y(imin))],...'fontsize',16)text(x(imax),y(imax),...['\leftarrow最大值=',num2str(y(imax))],...'fontsize',16)实例7:条形图形function shili07h0=figure('toolbar','none',...'position',[200 150 450 350],...'name','实例07');tiao1=[562 548 224 545 41 445 745 512];tiao2=[47 48 57 58 54 52 65 48];t=0:7;bar(t,tiao1)xlabel('X轴');ylabel('TIAO1值');h1=gca;h2=axes('position',get(h1,'position'));plot(t,tiao2,'linewidth',3)set(h2,'yaxislocation','right','color','none','xticklabel',[])实例8:区域图形function shili08h0=figure('toolbar','none',...'position',[200 150 450 250],...'name','实例08');x=91:95;profits1=[88 75 84 93 77];profits2=[51 64 54 56 68];profits3=[42 54 34 25 24];profits4=[26 38 18 15 4];area(x,profits1,'facecolor',[0.5 0.9 0.6],...'edgecolor','b',...'linewidth',3)hold onarea(x,profits2,'facecolor',[0.9 0.85 0.7],...'edgecolor','y',...'linewidth',3)hold onarea(x,profits3,'facecolor',[0.3 0.6 0.7],...'edgecolor','r',...'linewidth',3)hold onarea(x,profits4,'facecolor',[0.6 0.5 0.9],...'edgecolor','m',...'linewidth',3)hold offset(gca,'xtick',[91:95])set(gca,'layer','top')gtext('\leftarrow第一季度销量')gtext('\leftarrow第二季度销量')gtext('\leftarrow第三季度销量')gtext('\leftarrow第四季度销量')xlabel('年','fontsize',16);ylabel('销售量','fontsize',16);实例9:饼图的绘制function shili09h0=figure('toolbar','none',...'position',[200 150 450 250],...'name','实例09');t=[54 21 35;68 54 35;45 25 12;48 68 45;68 54 69];x=sum(t);h=pie(x);textobjs=findobj(h,'type','text');str1=get(textobjs,{'string'});val1=get(textobjs,{'extent'});oldext=cat(1,val1{:});names={'商品一:';'商品二:';'商品三:'};str2=strcat(names,str1);set(textobjs,{'string'},str2)val2=get(textobjs,{'extent'});newext=cat(1,val2{:});offset=sign(oldext(:,1)).*(newext(:,3)-oldext(:,3))/2; pos=get(textobjs,{'position'});textpos=cat(1,pos{:});textpos(:,1)=textpos(:,1)+offset;set(textobjs,{'position'},num2cell(textpos,[3,2]))实例10:阶梯图function shili10h0=figure('toolbar','none',...'position',[200 150 450 400],...'name','实例10');a=0.01;b=0.5;t=0:10;f=exp(-a*t).*sin(b*t);stairs(t,f)hold onplot(t,f,':*')hold offglabel='函数e^{-(\alpha*t)}sin\beta*t的阶梯图'; gtext(glabel,'fontsize',16)xlabel('t=0:10','fontsize',16)axis([0 10 -1.2 1.2])实例11:枝干图function shili11h0=figure('toolbar','none',...'position',[200 150 450 350],...'name','实例11');x=0:pi/20:2*pi;y1=sin(x);y2=cos(x);h1=stem(x,y1+y2);hold onh2=plot(x,y1,'^r',x,y2,'*g');hold offh3=[h1(1);h2];legend(h3,'y1+y2','y1=sin(x)','y2=cos(x)') xlabel('自变量X');ylabel('函数值Y');title('正弦函数与余弦函数的线性组合');实例12:罗盘图function shili12h0=figure('toolbar','none',...'position',[200 150 450 250],...'name','实例12');winddirection=[54 24 65 84256 12 235 62125 324 34 254];windpower=[2 5 5 36 8 12 76 14 10 8];rdirection=winddirection*pi/180;[x,y]=pol2cart(rdirection,windpower); compass(x,y);desc={'风向和风力','北京气象台','10月1日0:00到','10月1日12:00'};gtext(desc)实例13:轮廓图function shili13h0=figure('toolbar','none',...'position',[200 150 450 250],...'name','实例13');[th,r]=meshgrid((0:10:360)*pi/180,0:0.05:1); [x,y]=pol2cart(th,r);z=x+i*y;f=(z.^4-1).^(0.25);contour(x,y,abs(f),20)axis equalxlabel('实部','fontsize',16);ylabel('虚部','fontsize',16);h=polar([0 2*pi],[0 1]);delete(h)hold oncontour(x,y,abs(f),20)实例14:交互式图形function shili14h0=figure('toolbar','none',...'position',[200 150 450 250],...'name','实例14');axis([0 10 0 10]);hold onx=[];y=[];n=0;disp('单击鼠标左键点取需要的点'); disp('单击鼠标右键点取最后一个点'); but=1;while but==1[xi,yi,but]=ginput(1);plot(xi,yi,'bo')n=n+1;disp('单击鼠标左键点取下一个点');x(n,1)=xi;y(n,1)=yi;endt=1:n;ts=1:0.1:n;xs=spline(t,x,ts);ys=spline(t,y,ts);plot(xs,ys,'r-');hold off实例14:交互式图形function shili14h0=figure('toolbar','none',...'position',[200 150 450 250],...'name','实例14');axis([0 10 0 10]);hold onx=[];y=[];n=0;disp('单击鼠标左键点取需要的点'); disp('单击鼠标右键点取最后一个点'); but=1;while but==1[xi,yi,but]=ginput(1);plot(xi,yi,'bo')n=n+1;disp('单击鼠标左键点取下一个点');x(n,1)=xi;y(n,1)=yi;endt=1:n;ts=1:0.1:n;xs=spline(t,x,ts);ys=spline(t,y,ts);plot(xs,ys,'r-');hold off实例15:变换的傅立叶函数曲线function shili15h0=figure('toolbar','none',...'position',[200 150 450 250],...'name','实例15');axis equalm=moviein(20,gcf);set(gca,'nextplot','replacechildren')h=uicontrol('style','slider','position',...[100 10 500 20],'min',1,'max',20)for j=1:20plot(fft(eye(j+16)))set(h,'value',j)m(:,j)=getframe(gcf);endclf;axes('position',[0 0 1 1]);movie(m,30)实例16:劳伦兹非线形方程的无序活动function shili15h0=figure('toolbar','none',...'position',[200 150 450 250],...'name','实例15');axis equalm=moviein(20,gcf);set(gca,'nextplot','replacechildren') h=uicontrol('style','slider','position',...[100 10 500 20],'min',1,'max',20) for j=1:20plot(fft(eye(j+16)))set(h,'value',j)m(:,j)=getframe(gcf);endclf;axes('position',[0 0 1 1]);movie(m,30)实例17:填充图function shili17h0=figure('toolbar','none',...'position',[200 150 450 250],...'name','实例17');t=(1:2:15)*pi/8;x=sin(t);y=cos(t);fill(x,y,'r')axis square offtext(0,0,'STOP',...'color',[1 1 1],...'fontsize',50,...'horizontalalignment','center')例18:条形图和阶梯形图function shili18h0=figure('toolbar','none',...'position',[200 150 450 250],...'name','实例18');subplot(2,2,1)x=-3:0.2:3;y=exp(-x.*x);bar(x,y)title('2-D Bar Chart')subplot(2,2,2)x=-3:0.2:3;y=exp(-x.*x);bar3(x,y,'r')title('3-D Bar Chart')subplot(2,2,3)x=-3:0.2:3;y=exp(-x.*x);stairs(x,y)title('Stair Chart')subplot(2,2,4)x=-3:0.2:3;y=exp(-x.*x);barh(x,y)title('Horizontal Bar Chart')实例19:三维曲线图function shili19h0=figure('toolbar','none',...'position',[200 150 450 400],...'name','实例19');subplot(2,1,1)x=linspace(0,2*pi);y1=sin(x);y2=cos(x);y3=sin(x)+cos(x);z1=zeros(size(x));z2=0.5*z1;z3=z1;plot3(x,y1,z1,x,y2,z2,x,y3,z3)grid onxlabel('X轴');ylabel('Y轴');zlabel('Z轴');title('Figure1:3-D Plot')subplot(2,1,2)x=linspace(0,2*pi);y1=sin(x);y2=cos(x);y3=sin(x)+cos(x);z1=zeros(size(x));z2=0.5*z1;z3=z1;plot3(x,z1,y1,x,z2,y2,x,z3,y3)grid onxlabel('X轴');ylabel('Y轴');zlabel('Z轴');title('Figure2:3-D Plot')实例20:图形的隐藏属性function shili20h0=figure('toolbar','none',...'position',[200 150 450 300],...'name','实例20');subplot(1,2,1)[x,y,z]=sphere(10);mesh(x,y,z)axis offtitle('Figure1:Opaque')hidden onsubplot(1,2,2)[x,y,z]=sphere(10);mesh(x,y,z)axis offtitle('Figure2:Transparent')hidden off实例21PEAKS函数曲线function shili21h0=figure('toolbar','none',...'position',[200 100 450 450],...'name','实例21');[x,y,z]=peaks(30);subplot(2,1,1)x=x(1,:);y=y(:,1);i=find(y>0.8&y<1.2);j=find(x>-0.6&x<0.5);z(i,j)=nan*z(i,j);surfc(x,y,z)xlabel('X轴');ylabel('Y轴');zlabel('Z轴');title('Figure1:surfc函数形成的曲面')subplot(2,1,2)x=x(1,:);y=y(:,1);i=find(y>0.8&y<1.2);j=find(x>-0.6&x<0.5);z(i,j)=nan*z(i,j);surfl(x,y,z)xlabel('X轴');ylabel('Y轴');zlabel('Z轴');title('Figure2:surfl函数形成的曲面') 实例22:片状图function shili22h0=figure('toolbar','none',...'position',[200 150 550 350],...'name','实例22');subplot(1,2,1)x=rand(1,20);y=rand(1,20);z=peaks(x,y*pi);t=delaunay(x,y);trimesh(t,x,y,z)hidden offtitle('Figure1:Triangular Surface Plot');subplot(1,2,2)x=rand(1,20);y=rand(1,20);z=peaks(x,y*pi);t=delaunay(x,y);trisurf(t,x,y,z)title('Figure1:Triangular Surface Plot');实例23:视角的调整function shili23h0=figure('toolbar','none',...'position',[200 150 450 350],...'name','实例23');x=-5:0.5:5;[x,y]=meshgrid(x);r=sqrt(x.^2+y.^2)+eps;z=sin(r)./r;subplot(2,2,1)surf(x,y,z)xlabel('X-axis')ylabel('Y-axis')zlabel('Z-axis')title('Figure1')view(-37.5,30)subplot(2,2,2)surf(x,y,z)xlabel('X-axis')ylabel('Y-axis')zlabel('Z-axis')title('Figure2')view(-37.5+90,30)subplot(2,2,3)surf(x,y,z)xlabel('X-axis')ylabel('Y-axis')zlabel('Z-axis')title('Figure3')view(-37.5,60)subplot(2,2,4)surf(x,y,z)xlabel('X-axis')ylabel('Y-axis')zlabel('Z-axis')title('Figure4')view(180,0)实例24:向量场的绘制function shili24h0=figure('toolbar','none',...'position',[200 150 450 350],...'name','实例24');subplot(2,2,1)z=peaks;ribbon(z)title('Figure1')subplot(2,2,2)[x,y,z]=peaks(15);[dx,dy]=gradient(z,0.5,0.5); contour(x,y,z,10)hold onquiver(x,y,dx,dy)hold offtitle('Figure2')subplot(2,2,3)[x,y,z]=peaks(15);[nx,ny,nz]=surfnorm(x,y,z);surf(x,y,z)hold onquiver3(x,y,z,nx,ny,nz)hold offtitle('Figure3')subplot(2,2,4)x=rand(3,5);y=rand(3,5);z=rand(3,5);c=rand(3,5);fill3(x,y,z,c)grid ontitle('Figure4')实例25:灯光定位function shili25h0=figure('toolbar','none',...'position',[200 150 450 250],...'name','实例25');vert=[1 1 1;1 2 1;2 2 1;2 1 1;1 1 2;12 2;2 2 2;2 1 2];fac=[1 2 3 4;2 6 7 3;4 3 7 8;15 8 4;1 2 6 5;5 6 7 8];grid offsphere(36)h=findobj('type','surface');set(h,'facelighting','phong',...'facecolor',...'interp',...'edgecolor',[0.4 0.4 0.4],...'backfacelighting',...'lit')hold onpatch('faces',fac,'vertices',vert,...'facecolor','y');light('position',[1 3 2]);light('position',[-3 -1 3]);material shinyaxis vis3d offhold off实例26:柱状图function shili26h0=figure('toolbar','none',...'position',[200 50 450 450],...'name','实例26');subplot(2,1,1)x=[5 2 18 7 39 8 65 5 54 3 2];bar(x)xlabel('X轴');ylabel('Y轴');title('第一子图');subplot(2,1,2)y=[5 2 18 7 39 8 65 5 54 3 2];barh(y)xlabel('X轴');ylabel('Y轴');title('第二子图');实例27:设置照明方式function shili27h0=figure('toolbar','none',...'position',[200 150 450 350],...'name','实例27');subplot(2,2,1)sphereshading flatcamlight leftcamlight rightcolorbaraxis offtitle('Figure1')subplot(2,2,2)sphereshading flatcamlight leftcamlight rightlighting gouraudcolorbaraxis offtitle('Figure2')subplot(2,2,3)sphereshading interpcamlight rightcamlight leftlighting phongcolorbaraxis offtitle('Figure3')subplot(2,2,4)sphereshading flatcamlight leftcamlight rightlighting nonecolorbaraxis offtitle('Figure4')实例28:羽状图function shili28h0=figure('toolbar','none',...'position',[200 150 450 350],...'name','实例28');subplot(2,1,1)alpha=90:-10:0;r=ones(size(alpha));m=alpha*pi/180;[u,v]=pol2cart(m,n);feather(u,v)title('羽状图')axis([0 20 0 10])subplot(2,1,2)t=0:0.5:10;x=0.05+i;y=exp(-x*t);feather(y)title('复数矩阵的羽状图')实例29:立体透视(1)function shili29h0=figure('toolbar','none',...'position',[200 150 450 250],...'name','实例29');[x,y,z]=meshgrid(-2:0.1:2,...-2:0.1:2,...-2:0.1:2);v=x.*exp(-x.^2-y.^2-z.^2);grid onfor i=-2:0.5:2;h1=surf(linspace(-2,2,20),...linspace(-2,2,20),...zeros(20)+i);rotate(h1,[1 -1 1],30)dx=get(h1,'xdata');dy=get(h1,'ydata');dz=get(h1,'zdata');delete(h1)slice(x,y,z,v,[-2 2],2,-2)hold onslice(x,y,z,v,dx,dy,dz)hold offaxis tightview(-5,10)drawnowend实例30:立体透视(2)function shili30h0=figure('toolbar','none',...'position',[200 150 450 250],...'name','实例30');[x,y,z]=meshgrid(-2:0.1:2,...-2:0.1:2,...-2:0.1:2);v=x.*exp(-x.^2-y.^2-z.^2);[dx,dy,dz]=cylinder;slice(x,y,z,v,[-2 2],2,-2)for i=-2:0.2:2h=surface(dx+i,dy,dz);rotate(h,[1 0 0],90)xp=get(h,'xdata');yp=get(h,'ydata');zp=get(h,'zdata');delete(h)hold onhs=slice(x,y,z,v,xp,yp,zp);axis tightxlim([-3 3])view(-10,35)drawnowdelete(hs)hold offend实例31:表面图形function shili31h0=figure('toolbar','none',...'position',[200 150 550 250],...'name','实例31');subplot(1,2,1)x=rand(100,1)*16-8;y=rand(100,1)*16-8;r=sqrt(x.^2+y.^2)+eps;z=sin(r)./r;xlin=linspace(min(x),max(x),33); ylin=linspace(min(y),max(y),33); [X,Y]=meshgrid(xlin,ylin);Z=griddata(x,y,z,X,Y,'cubic');mesh(X,Y,Z)axis tighthold onplot3(x,y,z,'.','Markersize',20)subplot(1,2,2)k=5;n=2^k-1;theta=pi*(-n:2:n)/n;phi=(pi/2)*(-n:2:n)'/n;X=cos(phi)*cos(theta);Y=cos(phi)*sin(theta);Z=sin(phi)*ones(size(theta));colormap([0 0 0;1 1 1])C=hadamard(2^k);surf(X,Y,Z,C)axis square实例32:沿曲线移动的小球h0=figure('toolbar','none',...'position',[198 56 408 468],...'name','实例32');h1=axes('parent',h0,...'position',[0.15 0.45 0.7 0.5],...'visible','on');t=0:pi/24:4*pi;y=sin(t);plot(t,y,'b')n=length(t);h=line('color',[0 0.5 0.5],...'linestyle','.',...'markersize',25,...'erasemode','xor');k1=uicontrol('parent',h0,...'style','pushbutton',...'position',[80 100 50 30],...'string','开始',...'callback',[...'i=1;',...'k=1;,',...'m=0;,',...'while 1,',...'if k==0,',...'break,',...'end,',...'if k~=0,',...'set(h,''xdata'',t(i),''ydata'',y(i)),',...'drawnow;,',...'i=i+1;,',...'if i>n,',...'m=m+1;,',...'i=1;,',...'end,',...'end,',...'end']);k2=uicontrol('parent',h0,...'style','pushbutton',...'position',[180 100 50 30],...'string','停止',...'callback',[...'k=0;,',...'set(e1,''string'',m),',...'p=get(h,''xdata'');,',...'q=get(h,''ydata'');,',...'set(e2,''string'',p);,',...'set(e3,''string'',q)']); k3=uicontrol('parent',h0,...'style','pushbutton',...'position',[280 100 50 30],...'string','关闭',...'callback','close');e1=uicontrol('parent',h0,...'style','edit',...'position',[60 30 60 20]);t1=uicontrol('parent',h0,...'style','text',...'string','循环次数',...'position',[60 50 60 20]);e2=uicontrol('parent',h0,...'style','edit',...'position',[180 30 50 20]); t2=uicontrol('parent',h0,...'style','text',...'string','终点的X坐标值',...'position',[155 50 100 20]); e3=uicontrol('parent',h0,...'style','edit',...'position',[300 30 50 20]); t3=uicontrol('parent',h0,...'style','text',...'string','终点的Y坐标值',...'position',[275 50 100 20]);实例33:曲线转换按钮h0=figure('toolbar','none',...'position',[200 150 450 250],...'name','实例33');x=0:0.5:2*pi;y=sin(x);h=plot(x,y);grid onhuidiao=[...'if i==1,',...'i=0;,',...'y=cos(x);,',...'delete(h),',...'set(hm,''string'',''正弦函数''),',...'h=plot(x,y);,',...'grid on,',...'else if i==0,',...'i=1;,',...'y=sin(x);,',...'set(hm,''string'',''余弦函数''),',...'delete(h),',...'h=plot(x,y);,',...'grid on,',...'end,',...'end'];hm=uicontrol(gcf,'style','pushbutton',...'string','余弦函数',...'callback',huidiao);i=1;set(hm,'position',[250 20 60 20]);set(gca,'position',[0.2 0.2 0.6 0.6])title('按钮的使用')hold on实例34:栅格控制按钮h0=figure('toolbar','none',...'position',[200 150 450 250],...'name','实例34');x=0:0.5:2*pi;y=sin(x);plot(x,y)huidiao1=[...'set(h_toggle2,''value'',0),',...'grid on,',...huidiao2=[...'set(h_toggle1,''value'',0),',...'grid off,',...];h_toggle1=uicontrol(gcf,'style','togglebutton',...'string','grid on',...'value',0,...'position',[20 45 50 20],...'callback',huidiao1);h_toggle2=uicontrol(gcf,'style','togglebutton',...'string','grid off',...'value',0,...'position',[20 20 50 20],...'callback',huidiao2);set(gca,'position',[0.2 0.2 0.6 0.6])title('开关按钮的使用')实例35:编辑框的使用h0=figure('toolbar','none',...'position',[200 150 350 250],...'name','实例35');f='Please input the letter';huidiao1=[...'g=upper(f);,',...'set(h2_edit,''string'',g),',...];huidiao2=[...'g=lower(f);,',...'set(h2_edit,''string'',g),',...];h1_edit=uicontrol(gcf,'style','edit',...'position',[100 200 100 50],...'HorizontalAlignment','left',...'string','Please input the letter',...'callback','f=get(h1_edit,''string'');',...'background','w',...'max',5,...'min',1);h2_edit=uicontrol(gcf,'style','edit',...'HorizontalAlignment','left',...'position',[100 100 100 50],...'background','w',...'min',1);h1_button=uicontrol(gcf,'style','pushbutton',...'string','小写变大写',...'position',[100 45 100 20],...'callback',huidiao1);h2_button=uicontrol(gcf,'style','pushbutton',...'string','大写变小写',...'position',[100 20 100 20],...'callback',huidiao2);实例36:弹出式菜单h0=figure('toolbar','none',...'position',[200 150 450 250],...'name','实例36');x=0:0.5:2*pi;y=sin(x);h=plot(x,y);grid onhm=uicontrol(gcf,'style','popupmenu',...'string',...'sin(x)|cos(x)|sin(x)+cos(x)|exp(-sin(x))',...'position',[250 20 50 20]);set(hm,'value',1)huidiao=[...'v=get(hm,''value'');,',...'switch v,',...'case 1,',...'delete(h),',...'y=sin(x);,',...'h=plot(x,y);,',...'grid on,',...'case 2,',...'delete(h),',...'y=cos(x);,',...'h=plot(x,y);,',...'grid on,',...'case 3,',...'delete(h),',...'y=sin(x)+cos(x);,',...'h=plot(x,y);,',...'grid on,',...'case 4,',...'delete(h),',...'y=exp(-sin(x));,',...'h=plot(x,y);,',...'grid on,',...'end'];set(hm,'callback',huidiao)set(gca,'position',[0.2 0.2 0.6 0.6])title('弹出式菜单的使用')实例37:滑标的使用h0=figure('toolbar','none',...'position',[200 150 450 250],...'name','实例37');[x,y]=meshgrid(-8:0.5:8);r=sqrt(x.^2+y.^2)+eps;z=sin(r)./r;h0=mesh(x,y,z);h1=axes('position',...[0.2 0.2 0.5 0.5],...'visible','off');htext=uicontrol(gcf,...'units','points',...'position',[20 30 45 15],...'string','brightness',...'style','text');hslider=uicontrol(gcf,...'units','points',...'position',[10 10 300 15],...'min',-1,...'max',1,...'style','slider',...'callback',...'brighten(get(hslider,''value''))');实例38:多选菜单h0=figure('toolbar','none',...'position',[200 150 450 250],...'name','实例38');[x,y]=meshgrid(-8:0.5:8);r=sqrt(x.^2+y.^2)+eps;z=sin(r)./r;h0=mesh(x,y,z);hlist=uicontrol(gcf,'style','listbox',...'string','default|spring|summer|autumn|winter',...'max',5,...'min',1,...'position',[20 20 80 100],...'callback',[...'k=get(hlist,''value'');,',...'switch k,',...'case 1,',...'colormap default,',...'case 2,',...'colormap spring,',...'case 3,',...'colormap summer,',...'case 4,',...'colormap autumn,',...'case 5,',...'colormap winter,',...'end']);实例39:菜单控制的使用h0=figure('toolbar','none',...'position',[200 150 450 250],...'name','实例39');x=0:0.5:2*pi;y=cos(x);h=plot(x,y);grid onset(gcf,'toolbar','none')hm=uimenu('label','example');huidiao1=[...'set(hm_gridon,''checked'',''on''),',...'set(hm_gridoff,''checked'',''off''),',...'grid on'];huidiao2=[...'set(hm_gridoff,''checked'',''on''),',...'set(hm_gridon,''checked'',''off''),',...'grid off'];hm_gridon=uimenu(hm,'label','grid on',...'checked','on',...'callback',huidiao1);hm_gridoff=uimenu(hm,'label','grid off',...'checked','off',...'callback',huidiao2);实例40:UIMENU菜单的应用h0=figure('toolbar','none',...。
如何使用MATLAB创建一个最简单的程序

如何使用MATLAB创建一个最简单的程序使用MATLAB创建一个最简单的程序可以按照以下步骤进行:
例如,你可以使用disp函数在命令窗口中打印消息:
```
disp('Hello, World!');
```
或者,你可以使用fprintf函数在命令窗口中输出格式化的文本:```
fprintf('The sum of 2 and 3 is %d\n', 2+3);
```
这里,%d是一个格式化占位符,它将被替换为一个整数值。
4.运行程序。
在MATLAB命令窗口中,输入脚本文件名(不带.m扩展名),并按下回车键即可运行程序。
例如,如果你的脚本文件名为hello_world,你可以在命令窗口中输入:
```
hello_world
```
这将执行你所编写的MATLAB程序,并在命令窗口中显示输出结果。
以上是创建最简单的MATLAB程序的基本步骤。
此外,MATLAB还提供了一系列丰富的功能和工具箱,可以用于进行数值计算、绘图和数据分析等。
你可以在程序中使用这些功能来实现更复杂的任务。
matlab_简明实例教程
matlab_简明实例教程MATLAB是一种强大的科学计算工具,广泛应用于科学研究、数据分析和工程计算等领域。
它具有简单易用的语法和丰富的函数库,可以快速实现复杂的计算任务。
本教程将为你提供一些简单实例,帮助你入门MATLAB。
1.计算圆的面积和周长```matlabradius = input('请输入圆的半径:');area = pi * radius^2;circumference = 2 * pi * radius;disp(['圆的面积为:', num2str(area)]);disp(['圆的周长为:', num2str(circumference)]);```2.计算两个向量的点积```matlabv1 = input('请输入向量1(用逗号分隔元素):');v2 = input('请输入向量2(用逗号分隔元素):');dot_product = dot(v1, v2);disp(['两个向量的点积为:', num2str(dot_product)]);```3.绘制正弦曲线```matlabx = 0:0.1:2*pi;y = sin(x);plot(x, y);xlabel('x');ylabel('sin(x)');title('正弦曲线');```4.求解方程```matlabsyms x;eqn = x^2 - 4 == 0;sol = solve(eqn, x);disp(['方程的解为:', char(sol)]); ```5.读取和写入文件```matlabfilename = 'data.txt';data = importdata(filename);disp('文件中的数据:');disp(data);output = [1 2 3; 4 5 6; 7 8 9];dlmwrite('result.txt', output, 'delimiter', '\t', 'precision', 4);disp('结果已保存到result.txt文件中。
matlab简单实例

matlab简单实例
当谈到MATLAB的简单实例时,有很多可以选择的示例。
以下是一个关于计算圆的面积和周长的简单实例:
matlab.
% 输入圆的半径。
radius = input('请输入圆的半径,');
% 计算圆的面积。
area = pi radius^2;
% 计算圆的周长。
circumference = 2 pi radius;
% 显示结果。
fprintf('圆的面积为,%.2f\n', area);
fprintf('圆的周长为,%.2f\n', circumference);
在这个实例中,我们首先通过`input`函数从用户获取圆的半径。
然后,我们使用半径计算圆的面积和周长,分别存储在`area`和
`circumference`变量中。
最后,我们使用`fprintf`函数将结果显
示出来。
这个实例展示了MATLAB的基本语法和数学计算功能。
你可以根
据需要修改和扩展这个实例,以适应更复杂的计算或问题。
除了计算圆的面积和周长,MATLAB还可以用于数据分析、图像
处理、信号处理、控制系统设计等各种应用领域。
你可以根据自己
的兴趣和需求,选择适合的实例进行学习和实践。
希望这个简单的实例能够帮助你了解MATLAB的基本用法和潜力。
如果你有其他关于MATLAB的问题,请随时提问。
MATLAB操作命令大全
MATLAB操作命令大全1.基本操作:- clear: 清除工作区中的所有变量。
- clc: 清除命令窗口的内容。
- close all: 关闭所有图形窗口。
- help function-name: 显示与函数相关的帮助文档。
- who: 显示当前工作区中的所有变量。
- save file-name: 保存当前工作区中的所有变量到指定的文件。
- load file-name: 从文件中加载变量到当前工作区。
2.变量操作:-=:赋值操作符,将右边的值赋给左边的变量。
-+:加法操作符。
--:减法操作符。
-*:乘法操作符。
-/:除法操作符。
-^:幂运算操作符。
- sqrt(x): 计算 x 的平方根。
- abs(x): 计算 x 的绝对值。
- max(x): 返回 x 中的最大值。
- min(x): 返回 x 中的最小值。
- sum(x): 计算 x 中所有元素的和。
3.数组操作:- zeros(m, n): 创建一个 m 行 n 列的全零数组。
- ones(m, n): 创建一个 m 行 n 列的全一数组。
- eye(n): 创建一个 n 行 n 列的单位矩阵。
- size(x): 返回 x 的维度。
- length(x): 返回 x 的长度。
- reshape(x, m, n): 将 x 重新排列为一个 m 行 n 列矩阵。
- transpose(x): 将 x 的行和列互换。
4.控制流程:- if-else: 条件语句,根据条件执行不同的代码块。
- for loop: 循环语句,执行指定次数的代码块。
- while loop: 循环语句,根据条件反复执行代码块。
- break: 在循环中使用,用来跳出当前循环。
- continue: 在循环中使用,用来跳过当前循环的剩余部分。
5.统计分析:- mean(x): 计算 x 的平均值。
- median(x): 计算 x 的中位数。
- std(x): 计算 x 的标准差。
matlab编程实例100例(精编文档).doc
【最新整理,下载后即可编辑】1-32是:图形应用篇33-66是:界面设计篇67-84是:图形处理篇85-100是:数值分析篇实例1:三角函数曲线(1)function shili01h0=figure('toolbar','none',...'position',[198****0300],...'name','实例01');h1=axes('parent',h0,...'visible','off');x=-pi:0.05:pi;y=sin(x);plot(x,y);xlabel('自变量X');ylabel('函数值Y');title('SIN( )函数曲线');grid on实例2:三角函数曲线(2)function shili02h0=figure('toolbar','none',...'position',[200 150 450 350],...'name','实例02');x=-pi:0.05:pi;y=sin(x)+cos(x);plot(x,y,'-*r','linewidth',1);grid onxlabel('自变量X');ylabel('函数值Y');title('三角函数');实例3:图形的叠加function shili03h0=figure('toolbar','none',...'position',[200 150 450 350],...'name','实例03');x=-pi:0.05:pi;y1=sin(x);y2=cos(x);plot(x,y1,...'-*r',...x,y2,...'--og');grid onxlabel('自变量X');ylabel('函数值Y');title('三角函数');实例4:双y轴图形的绘制function shili04h0=figure('toolbar','none',...'position',[200 150 450 250],...'name','实例04');x=0:900;a=1000;b=0.005;y1=2*x;y2=cos(b*x);[haxes,hline1,hline2]=plotyy(x,y1,x,y2,'semilogy','plot'); axes(haxes(1))ylabel('semilog plot');axes(haxes(2))ylabel('linear plot');实例5:单个轴窗口显示多个图形function shili05h0=figure('toolbar','none',...'position',[200 150 450 250],...'name','实例05');t=0:pi/10:2*pi;[x,y]=meshgrid(t);subplot(2,2,1)plot(sin(t),cos(t))axis equalsubplot(2,2,2)z=sin(x)-cos(y);plot(t,z)axis([0 2*pi -2 2])subplot(2,2,3)h=sin(x)+cos(y);plot(t,h)axis([0 2*pi -2 2])subplot(2,2,4)g=(sin(x).^2)-(cos(y).^2);plot(t,g)axis([0 2*pi -1 1])实例6:图形标注function shili06h0=figure('toolbar','none',...'position',[200 150 450 400],...'name','实例06');t=0:pi/10:2*pi;h=plot(t,sin(t));xlabel('t=0到2\pi','fontsize',16);ylabel('sin(t)','fontsize',16);title('\it{从0to2\pi 的正弦曲线}','fontsize',16) x=get(h,'xdata');y=get(h,'ydata');imin=find(min(y)==y);imax=find(max(y)==y);text(x(imin),y(imin),...['\leftarrow最小值=',num2str(y(imin))],...'fontsize',16)text(x(imax),y(imax),...['\leftarrow最大值=',num2str(y(imax))],...'fontsize',16)实例7:条形图形function shili07h0=figure('toolbar','none',...'position',[200 150 450 350],...'name','实例07');tiao1=[562 548 224 545 41 445 745 512];tiao2=[47 48 57 58 54 52 65 48];t=0:7;bar(t,tiao1)xlabel('X轴');ylabel('TIAO1值');h1=gca;h2=axes('position',get(h1,'position'));plot(t,tiao2,'linewidth',3)set(h2,'yaxislocation','right','color','none','xticklabel',[]) 实例8:区域图形function shili08h0=figure('toolbar','none',...'position',[200 150 450 250],...'name','实例08');x=91:95;profits1=[88 75 84 93 77];profits2=[51 64 54 56 68];profits3=[42 54 34 25 24];profits4=[26 38 18 15 4];area(x,profits1,'facecolor',[0.5 0.9 0.6],...'edgecolor','b',...'linewidth',3)hold onarea(x,profits2,'facecolor',[0.9 0.85 0.7],...'edgecolor','y',...'linewidth',3)hold onarea(x,profits3,'facecolor',[0.3 0.6 0.7],...'edgecolor','r',...'linewidth',3)hold onarea(x,profits4,'facecolor',[0.6 0.5 0.9],...'edgecolor','m',...'linewidth',3)hold offset(gca,'xtick',[91:95])set(gca,'layer','top')gtext('\leftarrow第一季度销量') gtext('\leftarrow第二季度销量') gtext('\leftarrow第三季度销量') gtext('\leftarrow第四季度销量') xlabel('年','fontsize',16);ylabel('销售量','fontsize',16);实例9:饼图的绘制function shili09h0=figure('toolbar','none',...'position',[200 150 450 250],...'name','实例09');t=[54 21 35;68 54 35;45 25 12;48 68 45;68 54 69];x=sum(t);h=pie(x);textobjs=findobj(h,'type','text');str1=get(textobjs,{'string'});val1=get(textobjs,{'extent'});oldext=cat(1,val1{:});names={'商品一:';'商品二:';'商品三:'};str2=strcat(names,str1);set(textobjs,{'string'},str2)val2=get(textobjs,{'extent'});newext=cat(1,val2{:});offset=sign(oldext(:,1)).*(newext(:,3)-oldext(:,3))/2; pos=get(textobjs,{'position'});textpos=cat(1,pos{:});textpos(:,1)=textpos(:,1)+offset;set(textobjs,{'position'},num2cell(textpos,[3,2]))实例10:阶梯图function shili10h0=figure('toolbar','none',...'position',[200 150 450 400],...'name','实例10');a=0.01;b=0.5;t=0:10;f=exp(-a*t).*sin(b*t);stairs(t,f)hold onplot(t,f,':*')hold offglabel='函数e^{-(\alpha*t)}sin\beta*t的阶梯图'; gtext(glabel,'fontsize',16)xlabel('t=0:10','fontsize',16)axis([0 10 -1.2 1.2])实例11:枝干图function shili11h0=figure('toolbar','none',...'position',[200 150 450 350],...'name','实例11');x=0:pi/20:2*pi;y1=sin(x);y2=cos(x);h1=stem(x,y1+y2);hold onh2=plot(x,y1,'^r',x,y2,'*g');hold offh3=[h1(1);h2];legend(h3,'y1+y2','y1=sin(x)','y2=cos(x)') xlabel('自变量X');ylabel('函数值Y');title('正弦函数与余弦函数的线性组合'); 实例12:罗盘图function shili12h0=figure('toolbar','none',...'position',[200 150 450 250],...'name','实例12');winddirection=[54 24 65 84256 12 235 62125 324 34 254];windpower=[2 5 5 36 8 12 76 14 10 8];rdirection=winddirection*pi/180;[x,y]=pol2cart(rdirection,windpower); compass(x,y);desc={'风向和风力','北京气象台','10月1日0:00到','10月1日12:00'};gtext(desc)实例13:轮廓图function shili13h0=figure('toolbar','none',...'position',[200 150 450 250],...'name','实例13');[th,r]=meshgrid((0:10:360)*pi/180,0:0.05:1); [x,y]=pol2cart(th,r);z=x+i*y;f=(z.^4-1).^(0.25);contour(x,y,abs(f),20)axis equalxlabel('实部','fontsize',16);ylabel('虚部','fontsize',16);h=polar([0 2*pi],[0 1]);delete(h)hold oncontour(x,y,abs(f),20)实例14:交互式图形function shili14h0=figure('toolbar','none',...'position',[200 150 450 250],...'name','实例14');axis([0 10 0 10]);hold onx=[];y=[];n=0;disp('单击鼠标左键点取需要的点'); disp('单击鼠标右键点取最后一个点'); but=1;while but==1[xi,yi,but]=ginput(1);plot(xi,yi,'bo')n=n+1;disp('单击鼠标左键点取下一个点');x(n,1)=xi;y(n,1)=yi;endt=1:n;ts=1:0.1:n;xs=spline(t,x,ts);ys=spline(t,y,ts);plot(xs,ys,'r-');hold off实例14:交互式图形function shili14h0=figure('toolbar','none',...'position',[200 150 450 250],...'name','实例14');axis([0 10 0 10]);hold onx=[];y=[];n=0;disp('单击鼠标左键点取需要的点'); disp('单击鼠标右键点取最后一个点'); but=1;while but==1[xi,yi,but]=ginput(1);plot(xi,yi,'bo')n=n+1;disp('单击鼠标左键点取下一个点');x(n,1)=xi;y(n,1)=yi;endt=1:n;ts=1:0.1:n;xs=spline(t,x,ts);ys=spline(t,y,ts);plot(xs,ys,'r-');hold off实例15:变换的傅立叶函数曲线function shili15h0=figure('toolbar','none',...'position',[200 150 450 250],...'name','实例15');axis equalm=moviein(20,gcf);set(gca,'nextplot','replacechildren')h=uicontrol('style','slider','position',...[100 10 500 20],'min',1,'max',20)for j=1:20plot(fft(eye(j+16)))set(h,'value',j)m(:,j)=getframe(gcf);endclf;axes('position',[0 0 1 1]);movie(m,30)实例16:劳伦兹非线形方程的无序活动function shili15h0=figure('toolbar','none',...'position',[200 150 450 250],...'name','实例15');axis equalm=moviein(20,gcf);set(gca,'nextplot','replacechildren')h=uicontrol('style','slider','position',...[100 10 500 20],'min',1,'max',20)for j=1:20plot(fft(eye(j+16)))set(h,'value',j)m(:,j)=getframe(gcf);endclf;axes('position',[0 0 1 1]);movie(m,30)实例17:填充图function shili17h0=figure('toolbar','none',...'position',[200 150 450 250],...'name','实例17');t=(1:2:15)*pi/8;x=sin(t);y=cos(t);fill(x,y,'r')axis square offtext(0,0,'STOP',...'color',[1 1 1],...'fontsize',50,...'horizontalalignment','center') 例18:条形图和阶梯形图function shili18h0=figure('toolbar','none',...'position',[200 150 450 250],...'name','实例18');subplot(2,2,1)x=-3:0.2:3;y=exp(-x.*x);bar(x,y)title('2-D Bar Chart')subplot(2,2,2)x=-3:0.2:3;y=exp(-x.*x);bar3(x,y,'r')title('3-D Bar Chart')subplot(2,2,3)x=-3:0.2:3;y=exp(-x.*x);stairs(x,y)title('Stair Chart')subplot(2,2,4)x=-3:0.2:3;y=exp(-x.*x);barh(x,y)title('Horizontal Bar Chart')实例19:三维曲线图function shili19h0=figure('toolbar','none',...'position',[200 150 450 400],...'name','实例19');subplot(2,1,1)x=linspace(0,2*pi);y1=sin(x);y2=cos(x);y3=sin(x)+cos(x);z1=zeros(size(x));z2=0.5*z1;z3=z1;plot3(x,y1,z1,x,y2,z2,x,y3,z3)grid onxlabel('X轴');ylabel('Y轴');zlabel('Z轴');title('Figure1:3-D Plot')subplot(2,1,2)x=linspace(0,2*pi);y1=sin(x);y2=cos(x);y3=sin(x)+cos(x);z1=zeros(size(x));z2=0.5*z1;z3=z1;plot3(x,z1,y1,x,z2,y2,x,z3,y3)grid onxlabel('X轴');ylabel('Y轴');zlabel('Z轴');title('Figure2:3-D Plot')实例20:图形的隐藏属性function shili20h0=figure('toolbar','none',...'position',[200 150 450 300],...'name','实例20');subplot(1,2,1)[x,y,z]=sphere(10);mesh(x,y,z)axis offtitle('Figure1:Opaque')hidden onsubplot(1,2,2)[x,y,z]=sphere(10);mesh(x,y,z)axis offtitle('Figure2:Transparent') hidden off实例21PEAKS函数曲线function shili21h0=figure('toolbar','none',...'position',[200 100 450 450],...'name','实例21');[x,y,z]=peaks(30);subplot(2,1,1)x=x(1,:);y=y(:,1);i=find(y>0.8&y<1.2);j=find(x>-0.6&x<0.5);z(i,j)=nan*z(i,j);surfc(x,y,z)xlabel('X轴');ylabel('Y轴');zlabel('Z轴');title('Figure1:surfc函数形成的曲面') subplot(2,1,2)x=x(1,:);y=y(:,1);i=find(y>0.8&y<1.2);j=find(x>-0.6&x<0.5);z(i,j)=nan*z(i,j);surfl(x,y,z)xlabel('X轴');ylabel('Y轴');zlabel('Z轴');title('Figure2:surfl函数形成的曲面') 实例22:片状图function shili22h0=figure('toolbar','none',...'position',[200 150 550 350],...'name','实例22');subplot(1,2,1)x=rand(1,20);y=rand(1,20);z=peaks(x,y*pi);t=delaunay(x,y);trimesh(t,x,y,z)hidden offtitle('Figure1:Triangular Surface Plot'); subplot(1,2,2)x=rand(1,20);y=rand(1,20);z=peaks(x,y*pi);t=delaunay(x,y);trisurf(t,x,y,z)title('Figure1:Triangular Surface Plot'); 实例23:视角的调整function shili23h0=figure('toolbar','none',...'position',[200 150 450 350],...'name','实例23');x=-5:0.5:5;[x,y]=meshgrid(x);r=sqrt(x.^2+y.^2)+eps;z=sin(r)./r;subplot(2,2,1)surf(x,y,z)xlabel('X-axis')ylabel('Y-axis')zlabel('Z-axis')title('Figure1')view(-37.5,30)subplot(2,2,2)surf(x,y,z)xlabel('X-axis')ylabel('Y-axis')zlabel('Z-axis')title('Figure2')view(-37.5+90,30) subplot(2,2,3)surf(x,y,z)xlabel('X-axis')ylabel('Y-axis')zlabel('Z-axis')title('Figure3')view(-37.5,60)subplot(2,2,4)surf(x,y,z)xlabel('X-axis')ylabel('Y-axis')zlabel('Z-axis')title('Figure4')view(180,0)实例24:向量场的绘制function shili24h0=figure('toolbar','none',...'position',[200 150 450 350],...'name','实例24');subplot(2,2,1)z=peaks;ribbon(z)title('Figure1')subplot(2,2,2)[x,y,z]=peaks(15);[dx,dy]=gradient(z,0.5,0.5); contour(x,y,z,10)hold onquiver(x,y,dx,dy)hold offtitle('Figure2')subplot(2,2,3)[x,y,z]=peaks(15);[nx,ny,nz]=surfnorm(x,y,z);surf(x,y,z)hold onquiver3(x,y,z,nx,ny,nz)hold offtitle('Figure3')subplot(2,2,4)x=rand(3,5);y=rand(3,5);z=rand(3,5);c=rand(3,5);fill3(x,y,z,c)grid ontitle('Figure4')实例25:灯光定位function shili25h0=figure('toolbar','none',...'position',[200 150 450 250],...'name','实例25');vert=[1 1 1;1 2 1;2 2 1;2 1 1;1 1 2;12 2;2 2 2;2 1 2];fac=[1 2 3 4;2 6 7 3;4 3 7 8;15 8 4;1 2 6 5;5 6 7 8];grid offsphere(36)h=findobj('type','surface');set(h,'facelighting','phong',...'facecolor',...'interp',...'edgecolor',[0.4 0.4 0.4],...'backfacelighting',...'lit')hold onpatch('faces',fac,'vertices',vert,...'facecolor','y');light('position',[1 3 2]);light('position',[-3 -1 3]);material shinyaxis vis3d offhold off实例26:柱状图function shili26h0=figure('toolbar','none',...'position',[200 50 450 450],...'name','实例26'); subplot(2,1,1)x=[5 2 18 7 39 8 65 5 54 3 2];bar(x)xlabel('X轴');ylabel('Y轴');title('第一子图');subplot(2,1,2)y=[5 2 18 7 39 8 65 5 54 3 2];barh(y)xlabel('X轴');ylabel('Y轴');title('第二子图');实例27:设置照明方式function shili27h0=figure('toolbar','none',...'position',[200 150 450 350],...'name','实例27');subplot(2,2,1)sphereshading flatcamlight leftcamlight rightlighting flatcolorbaraxis offtitle('Figure1')subplot(2,2,2)sphereshading flatcamlight leftcamlight rightlighting gouraudcolorbaraxis offtitle('Figure2')subplot(2,2,3)sphereshading interpcamlight rightcamlight leftlighting phongaxis offtitle('Figure3')subplot(2,2,4)sphereshading flatcamlight leftcamlight rightlighting nonecolorbaraxis offtitle('Figure4')实例28:羽状图function shili28h0=figure('toolbar','none',...'position',[200 150 450 350],...'name','实例28');subplot(2,1,1)alpha=90:-10:0;r=ones(size(alpha));m=alpha*pi/180;n=r*10;[u,v]=pol2cart(m,n);feather(u,v)title('羽状图')axis([0 20 0 10])subplot(2,1,2)t=0:0.5:10;y=exp(-x*t);feather(y)title('复数矩阵的羽状图')实例29:立体透视(1)function shili29h0=figure('toolbar','none',...'position',[200 150 450 250],...'name','实例29');[x,y,z]=meshgrid(-2:0.1:2,...-2:0.1:2,...-2:0.1:2);v=x.*exp(-x.^2-y.^2-z.^2);grid onfor i=-2:0.5:2;h1=surf(linspace(-2,2,20),...linspace(-2,2,20),...zeros(20)+i);rotate(h1,[1 -1 1],30)dx=get(h1,'xdata');dy=get(h1,'ydata');dz=get(h1,'zdata');delete(h1)slice(x,y,z,v,[-2 2],2,-2)hold onslice(x,y,z,v,dx,dy,dz)hold offaxis tightview(-5,10)drawnowend实例30:立体透视(2)function shili30h0=figure('toolbar','none',...'position',[200 150 450 250],...'name','实例30');[x,y,z]=meshgrid(-2:0.1:2,...-2:0.1:2,...-2:0.1:2);v=x.*exp(-x.^2-y.^2-z.^2); [dx,dy,dz]=cylinder;slice(x,y,z,v,[-2 2],2,-2)for i=-2:0.2:2h=surface(dx+i,dy,dz);rotate(h,[1 0 0],90)xp=get(h,'xdata');yp=get(h,'ydata');zp=get(h,'zdata');delete(h)hold onhs=slice(x,y,z,v,xp,yp,zp);axis tightxlim([-3 3])view(-10,35)drawnowdelete(hs)hold offend实例31:表面图形function shili31h0=figure('toolbar','none',...'position',[200 150 550 250],...'name','实例31');subplot(1,2,1)x=rand(100,1)*16-8;y=rand(100,1)*16-8;r=sqrt(x.^2+y.^2)+eps;z=sin(r)./r;xlin=linspace(min(x),max(x),33); ylin=linspace(min(y),max(y),33); [X,Y]=meshgrid(xlin,ylin);Z=griddata(x,y,z,X,Y,'cubic'); mesh(X,Y,Z)axis tighthold onplot3(x,y,z,'.','Markersize',20) subplot(1,2,2)k=5;n=2^k-1;theta=pi*(-n:2:n)/n;phi=(pi/2)*(-n:2:n)'/n;X=cos(phi)*cos(theta);Y=cos(phi)*sin(theta);Z=sin(phi)*ones(size(theta)); colormap([0 0 0;1 1 1])C=hadamard(2^k);surf(X,Y,Z,C)axis square实例32:沿曲线移动的小球h0=figure('toolbar','none',...'position',[198****8468],...'name','实例32');h1=axes('parent',h0,...'position',[0.15 0.45 0.7 0.5],...'visible','on');t=0:pi/24:4*pi;y=sin(t);plot(t,y,'b')n=length(t);h=line('color',[0 0.5 0.5],...'linestyle','.',...'markersize',25,...'erasemode','xor');k1=uicontrol('parent',h0,...'style','pushbutton',...'position',[80 100 50 30],...'string','开始',...'callback',[...'i=1;',...'k=1;,',...'m=0;,',...'while 1,',...'if k==0,',...'break,',...'end,',...'if k~=0,',...'set(h,''xdata'',t(i),''ydata'',y(i)),',...'drawnow;,',...'i=i+1;,',...'if i>n,',...'m=m+1;,',...'i=1;,',...'end,',...'end,',...'end']);k2=uicontrol('parent',h0,...'style','pushbutton',...'position',[180 100 50 30],...'string','停止',...'callback',[...'k=0;,',...'set(e1,''string'',m),',...'p=get(h,''xdata'');,',...'q=get(h,''ydata'');,',...'set(e2,''string'',p);,',...'set(e3,''string'',q)']); k3=uicontrol('parent',h0,...'style','pushbutton',...'position',[280 100 50 30],...'string','关闭',...'callback','close');e1=uicontrol('parent',h0,...'style','edit',...'position',[60 30 60 20]);t1=uicontrol('parent',h0,...'style','text',...'string','循环次数',...'position',[60 50 60 20]);e2=uicontrol('parent',h0,...'style','edit',...'position',[180 30 50 20]);t2=uicontrol('parent',h0,...'style','text',...'string','终点的X坐标值',...'position',[155 50 100 20]);e3=uicontrol('parent',h0,...'style','edit',...'position',[300 30 50 20]);t3=uicontrol('parent',h0,...'style','text',...'string','终点的Y坐标值',...'position',[275 50 100 20]);实例33:曲线转换按钮h0=figure('toolbar','none',...'position',[200 150 450 250],...'name','实例33');x=0:0.5:2*pi;y=sin(x);h=plot(x,y);grid onhuidiao=[...'if i==1,',...'i=0;,',...'y=cos(x);,',...'delete(h),',...'set(hm,''string'',''正弦函数''),',...'h=plot(x,y);,',...'grid on,',...'else if i==0,',...'i=1;,',...'y=sin(x);,',...'set(hm,''string'',''余弦函数''),',...'delete(h),',...'h=plot(x,y);,',...'grid on,',...'end,',...'end'];hm=uicontrol(gcf,'style','pushbutton',...'string','余弦函数',...'callback',huidiao);i=1;set(hm,'position',[250 20 60 20]);set(gca,'position',[0.2 0.2 0.6 0.6])title('按钮的使用')hold on实例34:栅格控制按钮h0=figure('toolbar','none',...'position',[200 150 450 250],...'name','实例34');x=0:0.5:2*pi;y=sin(x);plot(x,y)huidiao1=[...'set(h_toggle2,''value'',0),',...'grid on,',...];huidiao2=[...'set(h_toggle1,''value'',0),',...'grid off,',...];h_toggle1=uicontrol(gcf,'style','togglebutton',...'string','grid on',...'value',0,...'position',[20 45 50 20],...'callback',huidiao1);h_toggle2=uicontrol(gcf,'style','togglebutton',...'string','grid off',...'value',0,...'position',[20 20 50 20],...'callback',huidiao2);set(gca,'position',[0.2 0.2 0.6 0.6])title('开关按钮的使用')实例35:编辑框的使用h0=figure('toolbar','none',...'position',[200 150 350 250],...'name','实例35');f='Please input the letter';huidiao1=[...'g=upper(f);,',...'set(h2_edit,''string'',g),',...];huidiao2=[...'g=lower(f);,',...'set(h2_edit,''string'',g),',...];h1_edit=uicontrol(gcf,'style','edit',...'position',[100 200 100 50],...'HorizontalAlignment','left',...'string','Please input the letter',...'callback','f=get(h1_edit,''string'');',...'background','w',...'max',5,...'min',1);h2_edit=uicontrol(gcf,'style','edit',...'HorizontalAlignment','left',...'position',[100 100 100 50],...'background','w',...'max',5,...'min',1);h1_button=uicontrol(gcf,'style','pushbutton',...'string','小写变大写',...'position',[100 45 100 20],...'callback',huidiao1);h2_button=uicontrol(gcf,'style','pushbutton',...'string','大写变小写',...'position',[100 20 100 20],...'callback',huidiao2);实例36:弹出式菜单h0=figure('toolbar','none',...'position',[200 150 450 250],...'name','实例36');x=0:0.5:2*pi;y=sin(x);h=plot(x,y);grid onhm=uicontrol(gcf,'style','popupmenu',...'string',...'sin(x)|cos(x)|sin(x)+cos(x)|exp(-sin(x))',...'position',[250 20 50 20]);set(hm,'value',1)huidiao=[...'v=get(hm,''value'');,',...'switch v,',...'case 1,',...'delete(h),',...'y=sin(x);,',...'h=plot(x,y);,',...'grid on,',...'case 2,',...'delete(h),',...'y=cos(x);,',...'h=plot(x,y);,',...'grid on,',...'case 3,',...'delete(h),',...'y=sin(x)+cos(x);,',...'h=plot(x,y);,',...'grid on,',...'case 4,',...'delete(h),',...'y=exp(-sin(x));,',...'h=plot(x,y);,',...'grid on,',...'end'];set(hm,'callback',huidiao)set(gca,'position',[0.2 0.2 0.6 0.6]) title('弹出式菜单的使用')实例37:滑标的使用h0=figure('toolbar','none',...'position',[200 150 450 250],...'name','实例37');[x,y]=meshgrid(-8:0.5:8);r=sqrt(x.^2+y.^2)+eps;z=sin(r)./r;h0=mesh(x,y,z);h1=axes('position',...[0.2 0.2 0.5 0.5],...'visible','off');htext=uicontrol(gcf,...'units','points',...'position',[20 30 45 15],...'string','brightness',...'style','text');hslider=uicontrol(gcf,...'units','points',...'position',[10 10 300 15],...'min',-1,...'max',1,...'style','slider',...'callback',...'brighten(get(hslider,''value''))'); 实例38:多选菜单h0=figure('toolbar','none',...'position',[200 150 450 250],...'name','实例38');[x,y]=meshgrid(-8:0.5:8);r=sqrt(x.^2+y.^2)+eps;z=sin(r)./r;h0=mesh(x,y,z);hlist=uicontrol(gcf,'style','listbox',...'string','default|spring|summer|autumn|winter',...'max',5,...'min',1,...'position',[20 20 80 100],...'callback',[...'k=get(hlist,''value'');,',...'switch k,',...'case 1,',...'colormap default,',...'case 2,',...'colormap spring,',...'case 3,',...'colormap summer,',...'case 4,',...'colormap autumn,',...'case 5,',...'colormap winter,',...'end']);实例39:菜单控制的使用h0=figure('toolbar','none',...'position',[200 150 450 250],...'name','实例39');x=0:0.5:2*pi;y=cos(x);h=plot(x,y);grid onset(gcf,'toolbar','none')hm=uimenu('label','example');huidiao1=[...'set(hm_gridon,''checked'',''on''),',...'set(hm_gridoff,''checked'',''off''),',...'grid on'];huidiao2=[...'set(hm_gridoff,''checked'',''on''),',...'set(hm_gridon,''checked'',''off''),',...'grid off'];hm_gridon=uimenu(hm,'label','grid on',...'checked','on',...'callback',huidiao1);hm_gridoff=uimenu(hm,'label','grid off',...'checked','off',...'callback',huidiao2);实例40:UIMENU菜单的应用h0=figure('toolbar','none',...'position',[200 150 450 250],...'name','实例40');h1=uimenu(gcf,'label','函数');h11=uimenu(h1,'label','轮廓图',...'callback',[...'set(h31,''checked'',''on''),',...'set(h32,''checked'',''off''),',...'[x,y,z]=peaks;,',...'contour3(x,y,z,30)']);h12=uimenu(h1,'label','高斯分布',...'callback',[...'set(h31,''checked'',''on''),',...'set(h32,''checked'',''off''),',...'mesh(peaks);,',...'axis tight']);。
matlab数组插值程序

matlab数组插值程序在MATLAB中,数组插值是一种常见的操作,可以使用interp1函数来实现。
interp1函数可以对一维数据进行插值操作,以下是一个简单的示例程序,演示了如何在MATLAB中进行数组插值操作:matlab.% 创建原始数据。
x = 1:5; % 原始数据的x坐标。
y = [3 6 2 8 4]; % 原始数据的y坐标。
% 创建插值的新x坐标。
xq = 1:0.1:5; % 创建新的x坐标,间隔为0.1。
% 使用interp1进行线性插值。
yq_linear = interp1(x, y, xq, 'linear'); % 线性插值。
% 使用interp1进行三次样条插值。
yq_spline = interp1(x, y, xq, 'spline'); % 三次样条插值。
% 绘制原始数据和插值结果。
plot(x, y, 'o', xq, yq_linear, '-', xq, yq_spline, '--');legend('原始数据', '线性插值', '三次样条插值');在这个示例程序中,我们首先创建了原始数据x和y,然后创建了新的x坐标xq,接着使用interp1函数进行线性插值和三次样条插值,最后将原始数据和插值结果绘制在同一张图上进行对比。
需要注意的是,interp1函数还可以进行其他类型的插值,比如最近邻插值、分段线性插值等,具体可以根据实际需求选择合适的插值方法。
除了interp1函数,MATLAB还提供了其他一些用于数组插值的函数,比如interp2(用于二维数据的插值)、interpn(用于多维数据的插值)等,可以根据具体情况选择合适的插值函数进行操作。
总之,MATLAB提供了丰富的插值函数,可以满足不同数据插值的需求,通过灵活运用这些函数,可以实现对数组的高效插值操作。
简单迭代法matlab例题程序
一、引言在数学建模和计算机编程中,简单迭代法是一种常用的求解方程近似解的方法。
其原理是通过不断迭代计算,逼近实际的解。
在Matlab 编程中,简单迭代法也是一种常见的应用。
本文将介绍简单迭代法的原理,并给出在Matlab中实现简单迭代法的例题程序。
二、简单迭代法原理1. 简单迭代法的基本思想是将需要求解的方程转化为迭代形式,即 x = g(x),然后通过不断迭代计算得到方程的近似解。
2. 简单迭代法的收敛条件是 |g'(x)| < 1,即迭代函数的导数的绝对值小于1时,迭代过程才能收敛。
3. 简单迭代法的收敛速度取决于迭代函数的选择,通常可以通过调整迭代函数来提高收敛速度。
三、Matlab中的简单迭代法实现在Matlab中,可以通过编写脚本文件来实现简单迭代法。
下面给出一个简单的例题:求解方程 x^2 - 3x + 2 = 0 的近似解。
4. 以下是Matlab中实现简单迭代法的脚本文件示例:```matlab定义迭代函数g = (x) 3*x - x^2;设置迭代初值和迭代次数x0 = 0.5;N = 100;迭代计算for k = 1:Nx = g(x0);fprintf('第d次迭代,近似解为:.10f\n', k, x);if abs(x - x0) < 1e-8 判断迭代是否收敛break;endx0 = x;end```5. 通过运行上述脚本文件,即可得到方程 x^2 - 3x + 2 = 0 的近似解。
四、实例分析通过上述例题程序的运行结果可以看出,简单迭代法在Matlab中的实现比较简单直观。
但是需要注意的是,迭代函数的选择和迭代初值的设定对最终的近似解都会产生影响,需要经过一定的调试和优化。
五、总结简单迭代法是一种常用的求解方程近似解的方法,在Matlab编程中也有着广泛的应用。
通过本文的介绍和示例程序,相信读者已经对简单迭代法在Matlab中的实现有了更深入的了解。
MATLAB数学工具软件实例简明教程
MATLAB数学工具软件实例简明教程一、基本操作1.启动MATLAB:双击MATLAB图标即可启动软件。
2.命令窗口:在命令窗口中输入指令,MATLAB会执行相应的操作,并返回结果。
3.变量和赋值:使用等号(=)将数值赋给变量,例如:x=5;。
4.算术运算:可以使用常见的算术运算符(+、-、*、/)进行加减乘除计算。
5.矩阵和数组:MATLAB支持多维数组和矩阵,可以使用方括号([])进行定义。
二、数值计算3. 线性代数运算:MATLAB提供了丰富的线性代数运算函数,如矩阵乘法、矩阵求逆、特征值分解等。
例如,计算矩阵A的特征值和特征向量,可以使用[eigVectors, eigValues] = eig(A)指令。
三、数据分析1. 数据导入和导出:使用readtable函数可以导入CSV、Excel等格式的数据文件;使用writetable函数可以将数据保存为CSV或Excel文件。
2. 数据处理:MATLAB提供了许多用于数据处理和分析的函数,如滤波、数据清洗、数据转换等。
例如,对数据进行平滑处理可以使用smoothdata函数。
3. 统计分析:MATLAB具有广泛的统计分析功能,可进行假设检验、方差分析、回归分析等。
例如,进行t检验可以使用ttest函数。
四、可视化1. 2D绘图:使用plot函数绘制2D线图,可以自定义线型、颜色等属性。
例如,绘制函数y = sin(x)在区间[0, 2*pi]上的图形可以使用plot(x, y)指令。
2. 3D绘图:使用plot3函数绘制3D曲线图;使用surf函数绘制3D曲面。
例如,绘制函数z = sin(sqrt(x^2 + y^2))在区域[-5, 5]上的曲面可以使用[x, y] = meshgrid(-5:0.1:5); z = sin(sqrt(x.^2 +y.^2)); surf(x, y, z)指令。
3. 图像处理:MATLAB提供了丰富的图像处理函数,可进行图像增强、滤波、边缘检测等操作。
Matlab100个实例程序
程序代码:(代码标记[code]...[/code] ) 1-32是:图形应用篇33-66是:界面设计篇67-84是:图形处理篇85-100是:数值分析篇实例1:三角函数曲线(1)function shili01h0=figure('toolbar','none',...'position',[198****0300],...'name','实例01');h1=axes('parent',h0,...'visible','off');x=-pi:0.05:pi;y=sin(x);plot(x,y);xlabel('自变量X');ylabel('函数值Y');title('SIN( )函数曲线');grid on实例2:三角函数曲线(2)function shili02h0=figure('toolbar','none',...'position',[200 150 450 350],...'name','实例02');x=-pi:0.05:pi;y=sin(x)+cos(x);plot(x,y,'-*r','linewidth',1);grid onxlabel('自变量X');ylabel('函数值Y');title('三角函数');实例3:图形的叠加function shili03h0=figure('toolbar','none',...'position',[200 150 450 350],...'name','实例03');x=-pi:0.05:pi;y1=sin(x);y2=cos(x);plot(x,y1,...'-*r',...x,y2,...'--og');grid onxlabel('自变量X');ylabel('函数值Y');title('三角函数');实例4:双y轴图形的绘制function shili04h0=figure('toolbar','none',...'position',[200 150 450 250],...'name','实例04');x=0:900;a=1000;b=0.005;y1=2*x;y2=cos(b*x);[haxes,hline1,hline2]=plotyy(x,y1,x,y2,'semilogy','plot'); axes(haxes(1))ylabel('semilog plot');axes(haxes(2))ylabel('linear plot');实例5:单个轴窗口显示多个图形function shili05h0=figure('toolbar','none',...'position',[200 150 450 250],...'name','实例05');t=0:pi/10:2*pi;[x,y]=meshgrid(t);subplot(2,2,1)plot(sin(t),cos(t))axis equalsubplot(2,2,2)z=sin(x)-cos(y);plot(t,z)axis([0 2*pi -2 2])subplot(2,2,3)h=sin(x)+cos(y);plot(t,h)axis([0 2*pi -2 2])subplot(2,2,4)g=(sin(x).^2)-(cos(y).^2);plot(t,g)axis([0 2*pi -1 1])实例6:图形标注function shili06h0=figure('toolbar','none',...'position',[200 150 450 400],...'name','实例06');t=0:pi/10:2*pi;h=plot(t,sin(t));xlabel('t=0到2\pi','fontsize',16);ylabel('sin(t)','fontsize',16);title('\it{从0to2\pi 的正弦曲线}','fontsize',16) x=get(h,'xdata');y=get(h,'ydata');imin=find(min(y)==y);imax=find(max(y)==y);text(x(imin),y(imin),...['\leftarrow最小值=',num2str(y(imin))],... 'fontsize',16)text(x(imax),y(imax),...['\leftarrow最大值=',num2str(y(imax))],...'fontsize',16)实例7:条形图形function shili07h0=figure('toolbar','none',...'position',[200 150 450 350],...'name','实例07');tiao1=[562 548 224 545 41 445 745 512];tiao2=[47 48 57 58 54 52 65 48];t=0:7;bar(t,tiao1)xlabel('X轴');ylabel('TIAO1值');h1=gca;h2=axes('position',get(h1,'position'));plot(t,tiao2,'linewidth',3)set(h2,'yaxislocation','right','color','none','xticklabel',[])实例8:区域图形function shili08h0=figure('toolbar','none',...'position',[200 150 450 250],...'name','实例08');x=91:95;profits1=[88 75 84 93 77];profits2=[51 64 54 56 68];profits3=[42 54 34 25 24];profits4=[26 38 18 15 4];area(x,profits1,'facecolor',[0.5 0.9 0.6],...'edgecolor','b',...'linewidth',3)hold onarea(x,profits2,'facecolor',[0.9 0.85 0.7],...'edgecolor','y',...'linewidth',3)hold onarea(x,profits3,'facecolor',[0.3 0.6 0.7],... 'edgecolor','r',...'linewidth',3)hold onarea(x,profits4,'facecolor',[0.6 0.5 0.9],... 'edgecolor','m',...'linewidth',3)hold offset(gca,'xtick',[91:95])set(gca,'layer','top')gtext('\leftarrow第一季度销量')gtext('\leftarrow第二季度销量')gtext('\leftarrow第三季度销量')gtext('\leftarrow第四季度销量')xlabel('年','fontsize',16);ylabel('销售量','fontsize',16);实例9:饼图的绘制function shili09h0=figure('toolbar','none',...'position',[200 150 450 250],...'name','实例09');t=[54 21 35;68 54 35;45 25 12;48 68 45;68 54 69];x=sum(t);h=pie(x);textobjs=findobj(h,'type','text');str1=get(textobjs,{'string'});val1=get(textobjs,{'extent'});oldext=cat(1,val1{:});names={'商品一:';'商品二:';'商品三:'}; str2=strcat(names,str1);set(textobjs,{'string'},str2)val2=get(textobjs,{'extent'});newext=cat(1,val2{:});offset=sign(oldext(:,1)).*(newext(:,3)-oldext(:,3))/2; pos=get(textobjs,{'position'});textpos=cat(1,pos{:});textpos(:,1)=textpos(:,1)+offset;set(textobjs,{'position'},num2cell(textpos,[3,2]))实例10:阶梯图function shili10h0=figure('toolbar','none',...'position',[200 150 450 400],...'name','实例10');a=0.01;b=0.5;t=0:10;f=exp(-a*t).*sin(b*t);stairs(t,f)hold onplot(t,f,':*')hold offglabel='函数e^{-(\alpha*t)}sin\beta*t的阶梯图'; gtext(glabel,'fontsize',16)xlabel('t=0:10','fontsize',16)axis([0 10 -1.2 1.2])实例11:枝干图function shili11h0=figure('toolbar','none',...'position',[200 150 450 350],...'name','实例11');x=0:pi/20:2*pi;y1=sin(x);y2=cos(x);h1=stem(x,y1+y2);hold onh2=plot(x,y1,'^r',x,y2,'*g');h3=[h1(1);h2];legend(h3,'y1+y2','y1=sin(x)','y2=cos(x)') xlabel('自变量X');ylabel('函数值Y');title('正弦函数与余弦函数的线性组合');实例12:罗盘图function shili12h0=figure('toolbar','none',...'position',[200 150 450 250],...'name','实例12');winddirection=[54 24 65 84256 12 235 62125 324 34 254];windpower=[2 5 5 36 8 12 76 14 10 8];rdirection=winddirection*pi/180;[x,y]=pol2cart(rdirection,windpower); compass(x,y);desc={'风向和风力','北京气象台','10月1日0:00到','10月1日12:00'};gtext(desc)实例13:轮廓图function shili13h0=figure('toolbar','none',...'position',[200 150 450 250],...'name','实例13');[th,r]=meshgrid((0:10:360)*pi/180,0:0.05:1); [x,y]=pol2cart(th,r);z=x+i*y;f=(z.^4-1).^(0.25);contour(x,y,abs(f),20)xlabel('实部','fontsize',16);ylabel('虚部','fontsize',16);h=polar([0 2*pi],[0 1]);delete(h)hold oncontour(x,y,abs(f),20)实例14:交互式图形function shili14h0=figure('toolbar','none',...'position',[200 150 450 250],... 'name','实例14');axis([0 10 0 10]);hold onx=[];y=[];n=0;disp('单击鼠标左键点取需要的点'); disp('单击鼠标右键点取最后一个点'); but=1;while but==1[xi,yi,but]=ginput(1);plot(xi,yi,'bo')n=n+1;disp('单击鼠标左键点取下一个点'); x(n,1)=xi;y(n,1)=yi;endt=1:n;ts=1:0.1:n;xs=spline(t,x,ts);ys=spline(t,y,ts);plot(xs,ys,'r-');hold off实例15:变换的傅立叶函数曲线function shili15h0=figure('toolbar','none',...'position',[200 150 450 250],...'name','实例15');axis equalm=moviein(20,gcf);set(gca,'nextplot','replacechildren')h=uicontrol('style','slider','position',... [100 10 500 20],'min',1,'max',20) for j=1:20plot(fft(eye(j+16)))set(h,'value',j)m(:,j)=getframe(gcf);endclf;axes('position',[0 0 1 1]);movie(m,30)实例16:劳伦兹非线形方程的无序活动function shili15h0=figure('toolbar','none',...'position',[200 150 450 250],...'name','实例15');axis equalm=moviein(20,gcf);set(gca,'nextplot','replacechildren')h=uicontrol('style','slider','position',... [100 10 500 20],'min',1,'max',20) for j=1:20plot(fft(eye(j+16)))set(h,'value',j)m(:,j)=getframe(gcf);endclf;axes('position',[0 0 1 1]);movie(m,30)实例17:填充图function shili17h0=figure('toolbar','none',...'position',[200 150 450 250],... 'name','实例17');t=(1:2:15)*pi/8;x=sin(t);y=cos(t);fill(x,y,'r')axis square offtext(0,0,'STOP',...'color',[1 1 1],...'fontsize',50,...'horizontalalignment','center')实例18:条形图和阶梯形图function shili18h0=figure('toolbar','none',...'position',[200 150 450 250],... 'name','实例18');subplot(2,2,1)x=-3:0.2:3;y=exp(-x.*x);bar(x,y)title('2-D Bar Chart')subplot(2,2,2)x=-3:0.2:3;y=exp(-x.*x);bar3(x,y,'r')title('3-D Bar Chart')subplot(2,2,3)x=-3:0.2:3;y=exp(-x.*x);stairs(x,y)title('Stair Chart')subplot(2,2,4)x=-3:0.2:3;y=exp(-x.*x);barh(x,y)title('Horizontal Bar Chart')实例19:三维曲线图function shili19h0=figure('toolbar','none',...'position',[200 150 450 400],... 'name','实例19');subplot(2,1,1)x=linspace(0,2*pi);y1=sin(x);y2=cos(x);y3=sin(x)+cos(x);z1=zeros(size(x));z2=0.5*z1;z3=z1;plot3(x,y1,z1,x,y2,z2,x,y3,z3) grid onxlabel('X轴');ylabel('Y轴');zlabel('Z轴');title('Figure1:3-D Plot')subplot(2,1,2)x=linspace(0,2*pi);y1=sin(x);y2=cos(x);y3=sin(x)+cos(x);z1=zeros(size(x));z2=0.5*z1;z3=z1;plot3(x,z1,y1,x,z2,y2,x,z3,y3) grid onxlabel('X轴');zlabel('Z轴');title('Figure2:3-D Plot')实例20:图形的隐藏属性function shili20h0=figure('toolbar','none',...'position',[200 150 450 300],... 'name','实例20');subplot(1,2,1)[x,y,z]=sphere(10);mesh(x,y,z)axis offtitle('Figure1:Opaque')hidden onsubplot(1,2,2)[x,y,z]=sphere(10);mesh(x,y,z)axis offtitle('Figure2:Transparent') hidden off实例21:PEAKS函数曲线function shili21h0=figure('toolbar','none',...'position',[200 100 450 450],... 'name','实例21');[x,y,z]=peaks(30);subplot(2,1,1)x=x(1,:);y=y(:,1);i=find(y>0.8&y<1.2);j=find(x>-0.6&x<0.5);z(i,j)=nan*z(i,j);surfc(x,y,z)xlabel('X轴');ylabel('Y轴');title('Figure1:surfc函数形成的曲面')subplot(2,1,2)x=x(1,:);y=y(:,1);i=find(y>0.8&y<1.2);j=find(x>-0.6&x<0.5);z(i,j)=nan*z(i,j);surfl(x,y,z)xlabel('X轴');ylabel('Y轴');zlabel('Z轴');title('Figure2:surfl函数形成的曲面')实例22:片状图function shili22h0=figure('toolbar','none',...'position',[200 150 550 350],...'name','实例22');subplot(1,2,1)x=rand(1,20);y=rand(1,20);z=peaks(x,y*pi);t=delaunay(x,y);trimesh(t,x,y,z)hidden offtitle('Figure1:Triangular Surface Plot');subplot(1,2,2)x=rand(1,20);y=rand(1,20);z=peaks(x,y*pi);t=delaunay(x,y);trisurf(t,x,y,z)title('Figure1:Triangular Surface Plot');实例23:视角的调整function shili23h0=figure('toolbar','none',...'position',[200 150 450 350],... 'name','实例23');x=-5:0.5:5;[x,y]=meshgrid(x);r=sqrt(x.^2+y.^2)+eps;z=sin(r)./r;subplot(2,2,1)surf(x,y,z)xlabel('X-axis')ylabel('Y-axis')zlabel('Z-axis')title('Figure1')view(-37.5,30)subplot(2,2,2)surf(x,y,z)xlabel('X-axis')ylabel('Y-axis')zlabel('Z-axis')title('Figure2')view(-37.5+90,30)subplot(2,2,3)surf(x,y,z)xlabel('X-axis')ylabel('Y-axis')zlabel('Z-axis')title('Figure3')view(-37.5,60)subplot(2,2,4)surf(x,y,z)xlabel('X-axis')ylabel('Y-axis')zlabel('Z-axis')title('Figure4')view(180,0)实例24:向量场的绘制function shili24h0=figure('toolbar','none',...'position',[200 150 450 350],... 'name','实例24');subplot(2,2,1)z=peaks;ribbon(z)title('Figure1')subplot(2,2,2)[x,y,z]=peaks(15);[dx,dy]=gradient(z,0.5,0.5); contour(x,y,z,10)hold onquiver(x,y,dx,dy)hold offtitle('Figure2')subplot(2,2,3)[x,y,z]=peaks(15);[nx,ny,nz]=surfnorm(x,y,z);surf(x,y,z)hold onquiver3(x,y,z,nx,ny,nz)hold offtitle('Figure3')subplot(2,2,4)x=rand(3,5);y=rand(3,5);z=rand(3,5);c=rand(3,5);fill3(x,y,z,c)grid ontitle('Figure4')实例25:灯光定位function shili25h0=figure('toolbar','none',...'position',[200 150 450 250],... 'name','实例25');vert=[1 1 1;1 2 1;2 2 1;2 1 1;1 1 2;12 2;2 2 2;2 1 2];fac=[1 2 3 4;2 6 7 3;4 3 7 8;15 8 4;1 2 6 5;5 6 7 8];grid offsphere(36)h=findobj('type','surface');set(h,'facelighting','phong',...'facecolor',...'interp',...'edgecolor',[0.4 0.4 0.4],...'backfacelighting',...'lit')hold onpatch('faces',fac,'vertices',vert,... 'facecolor','y');light('position',[1 3 2]);light('position',[-3 -1 3]); material shinyaxis vis3d offhold off实例26:柱状图function shili26h0=figure('toolbar','none',...'position',[200 50 450 450],...'name','实例26');subplot(2,1,1)x=[5 2 18 7 39 8 65 5 54 3 2];bar(x)xlabel('X轴');ylabel('Y轴');title('第一子图');subplot(2,1,2)y=[5 2 18 7 39 8 65 5 54 3 2];barh(y)xlabel('X轴');ylabel('Y轴');title('第二子图');实例27:设置照明方式function shili27h0=figure('toolbar','none',...'position',[200 150 450 350],... 'name','实例27');subplot(2,2,1)sphereshading flatcamlight leftcamlight rightlighting flatcolorbaraxis offtitle('Figure1')subplot(2,2,2)sphereshading flatcamlight leftcamlight rightlighting gouraudcolorbaraxis offtitle('Figure2')subplot(2,2,3)sphereshading interpcamlight rightcamlight leftlighting phongcolorbaraxis offtitle('Figure3')subplot(2,2,4)sphereshading flatcamlight leftcamlight rightlighting nonecolorbaraxis offtitle('Figure4')实例28:羽状图function shili28h0=figure('toolbar','none',...'position',[200 150 450 350],... 'name','实例28');subplot(2,1,1)alpha=90:-10:0;r=ones(size(alpha));m=alpha*pi/180;n=r*10;[u,v]=pol2cart(m,n);feather(u,v)title('羽状图')axis([0 20 0 10])subplot(2,1,2)t=0:0.5:10;x=0.05+i;y=exp(-x*t);feather(y)title('复数矩阵的羽状图')实例29:立体透视(1)function shili29h0=figure('toolbar','none',...'position',[200 150 450 250],... 'name','实例29');[x,y,z]=meshgrid(-2:0.1:2,...-2:0.1:2,...-2:0.1:2);v=x.*exp(-x.^2-y.^2-z.^2); grid onfor i=-2:0.5:2;h1=surf(linspace(-2,2,20),...linspace(-2,2,20),...zeros(20)+i);rotate(h1,[1 -1 1],30)dx=get(h1,'xdata');dy=get(h1,'ydata');dz=get(h1,'zdata');delete(h1)slice(x,y,z,v,[-2 2],2,-2)hold onslice(x,y,z,v,dx,dy,dz)hold offaxis tightview(-5,10)drawnowend实例30:立体透视(2)function shili30h0=figure('toolbar','none',...'position',[200 150 450 250],... 'name','实例30');[x,y,z]=meshgrid(-2:0.1:2,...-2:0.1:2,...-2:0.1:2);v=x.*exp(-x.^2-y.^2-z.^2); [dx,dy,dz]=cylinder;slice(x,y,z,v,[-2 2],2,-2)for i=-2:0.2:2h=surface(dx+i,dy,dz);rotate(h,[1 0 0],90)xp=get(h,'xdata');yp=get(h,'ydata');zp=get(h,'zdata');delete(h)hold onhs=slice(x,y,z,v,xp,yp,zp);axis tightxlim([-3 3])view(-10,35)drawnowdelete(hs)hold offend实例31:表面图形function shili31h0=figure('toolbar','none',...'position',[200 150 550 250],...'name','实例31');subplot(1,2,1)x=rand(100,1)*16-8;y=rand(100,1)*16-8;r=sqrt(x.^2+y.^2)+eps;z=sin(r)./r;xlin=linspace(min(x),max(x),33); ylin=linspace(min(y),max(y),33); [X,Y]=meshgrid(xlin,ylin);Z=griddata(x,y,z,X,Y,'cubic'); mesh(X,Y,Z)axis tighthold onplot3(x,y,z,'.','Markersize',20)subplot(1,2,2)k=5;n=2^k-1;theta=pi*(-n:2:n)/n;phi=(pi/2)*(-n:2:n)'/n;X=cos(phi)*cos(theta);Y=cos(phi)*sin(theta);Z=sin(phi)*ones(size(theta)); colormap([0 0 0;1 1 1])C=hadamard(2^k);surf(X,Y,Z,C)axis square实例32:沿曲线移动的小球h0=figure('toolbar','none',...'position',[198****8468],... 'name','实例32');h1=axes('parent',h0,...'position',[0.15 0.45 0.7 0.5],... 'visible','on');t=0:pi/24:4*pi;y=sin(t);plot(t,y,'b')n=length(t);h=line('color',[0 0.5 0.5],...'linestyle','.',...'markersize',25,...'erasemode','xor');k1=uicontrol('parent',h0,...'style','pushbutton',...'position',[80 100 50 30],...'string','开始',...'callback',[...'i=1;',...'k=1;,',...'m=0;,',...'while 1,',...'if k==0,',...'break,',...'end,',...'if k~=0,',...'set(h,''xdata'',t(i),''ydata'',y(i)),',...'drawnow;,',...'i=i+1;,',...'if i>n,',...'m=m+1;,',...'i=1;,',...'end,',...'end,',...'end']);k2=uicontrol('parent',h0,...'style','pushbutton',...'position',[180 100 50 30],...'string','停止',...'callback',[...'k=0;,',...'set(e1,''string'',m),',...'p=get(h,''xdata'');,',...'q=get(h,''ydata'');,',...'set(e2,''string'',p);,',...'set(e3,''string'',q)']);k3=uicontrol('parent',h0,...'style','pushbutton',...'position',[280 100 50 30],... 'string','关闭',...'callback','close');e1=uicontrol('parent',h0,...'style','edit',...'position',[60 30 60 20]);t1=uicontrol('parent',h0,...'style','text',...'string','循环次数',...'position',[60 50 60 20]);e2=uicontrol('parent',h0,...'style','edit',...'position',[180 30 50 20]);t2=uicontrol('parent',h0,...'style','text',...'string','终点的X坐标值',...'position',[155 50 100 20]);e3=uicontrol('parent',h0,...'style','edit',...'position',[300 30 50 20]);t3=uicontrol('parent',h0,...'style','text',...'string','终点的Y坐标值',...'position',[275 50 100 20]);实例33:曲线转换按钮h0=figure('toolbar','none',...'position',[200 150 450 250],... 'name','实例33');x=0:0.5:2*pi;y=sin(x);h=plot(x,y);grid on'if i==1,',...'i=0;,',...'y=cos(x);,',...'delete(h),',...'set(hm,''string'',''正弦函数''),',...'h=plot(x,y);,',...'grid on,',...'else if i==0,',...'i=1;,',...'y=sin(x);,',...'set(hm,''string'',''余弦函数''),',...'delete(h),',...'h=plot(x,y);,',...'grid on,',...'end,',...'end'];hm=uicontrol(gcf,'style','pushbutton',... 'string','余弦函数',...'callback',huidiao);i=1;set(hm,'position',[250 20 60 20]);set(gca,'position',[0.2 0.2 0.6 0.6]) title('按钮的使用')hold on实例34:栅格控制按钮h0=figure('toolbar','none',...'position',[200 150 450 250],...'name','实例34');x=0:0.5:2*pi;y=sin(x);plot(x,y)huidiao1=[...'set(h_toggle2,''value'',0),',...'grid on,',...];'set(h_toggle1,''value'',0),',...'grid off,',...];h_toggle1=uicontrol(gcf,'style','togglebutton',... 'string','grid on',...'value',0,...'position',[20 45 50 20],...'callback',huidiao1);h_toggle2=uicontrol(gcf,'style','togglebutton',... 'string','grid off',...'value',0,...'position',[20 20 50 20],...'callback',huidiao2);set(gca,'position',[0.2 0.2 0.6 0.6])title('开关按钮的使用')实例35:编辑框的使用h0=figure('toolbar','none',...'position',[200 150 350 250],...'name','实例35');f='Please input the letter';huidiao1=[...'g=upper(f);,',...'set(h2_edit,''string'',g),',...];huidiao2=[...'g=lower(f);,',...'set(h2_edit,''string'',g),',...];h1_edit=uicontrol(gcf,'style','edit',...'position',[100 200 100 50],...'HorizontalAlignment','left',...'string','Please input the letter',...'callback','f=get(h1_edit,''string'');',...'background','w',...'max',5,...'min',1);h2_edit=uicontrol(gcf,'style','edit',...'HorizontalAlignment','left',...'position',[100 100 100 50],...'background','w',...'max',5,...'min',1);h1_button=uicontrol(gcf,'style','pushbutton',... 'string','小写变大写',...'position',[100 45 100 20],...'callback',huidiao1);h2_button=uicontrol(gcf,'style','pushbutton',... 'string','大写变小写',...'position',[100 20 100 20],...'callback',huidiao2);实例36:弹出式菜单h0=figure('toolbar','none',...'position',[200 150 450 250],...'name','实例36');x=0:0.5:2*pi;y=sin(x);h=plot(x,y);grid onhm=uicontrol(gcf,'style','popupmenu',...'string',...'sin(x)|cos(x)|sin(x)+cos(x)|exp(-sin(x))',... 'position',[250 20 50 20]);set(hm,'value',1)huidiao=[...'v=get(hm,''value'');,',...'switch v,',...'case 1,',...'delete(h),',...'y=sin(x);,',...'h=plot(x,y);,',...'grid on,',...'case 2,',...'delete(h),',...'y=cos(x);,',...'h=plot(x,y);,',...'grid on,',...'case 3,',...'delete(h),',...'y=sin(x)+cos(x);,',...'h=plot(x,y);,',...'grid on,',...'case 4,',...'delete(h),',...'y=exp(-sin(x));,',...'h=plot(x,y);,',...'grid on,',...'end'];set(hm,'callback',huidiao)set(gca,'position',[0.2 0.2 0.6 0.6]) title('弹出式菜单的使用')实例37:滑标的使用h0=figure('toolbar','none',...'position',[200 150 450 250],... 'name','实例37');[x,y]=meshgrid(-8:0.5:8);r=sqrt(x.^2+y.^2)+eps;z=sin(r)./r;h0=mesh(x,y,z);h1=axes('position',...[0.2 0.2 0.5 0.5],...'visible','off');htext=uicontrol(gcf,...'units','points',...'position',[20 30 45 15],...'string','brightness',...'style','text');hslider=uicontrol(gcf,...'units','points',...'position',[10 10 300 15],...'min',-1,...'max',1,...'style','slider',...'callback',...'brighten(get(hslider,''value''))');实例38:多选菜单h0=figure('toolbar','none',...'position',[200 150 450 250],...'name','实例38');[x,y]=meshgrid(-8:0.5:8);r=sqrt(x.^2+y.^2)+eps;z=sin(r)./r;h0=mesh(x,y,z);hlist=uicontrol(gcf,'style','listbox',...'string','default|spring|summer|autumn|winter',... 'max',5,...'min',1,...'position',[20 20 80 100],...'callback',[...'k=get(hlist,''value'');,',...'switch k,',...'case 1,',...'colormap default,',...'case 2,',...'colormap spring,',...'case 3,',...'colormap summer,',...'case 4,',...'colormap autumn,',...'case 5,',...'colormap winter,',...'end']);实例39:菜单控制的使用h0=figure('toolbar','none',...'position',[200 150 450 250],...'name','实例39');x=0:0.5:2*pi;y=cos(x);h=plot(x,y);grid onset(gcf,'toolbar','none')hm=uimenu('label','example');huidiao1=[...'set(hm_gridon,''checked'',''on''),',...'set(hm_gridoff,''checked'',''off''),',...'grid on'];huidiao2=[...'set(hm_gridoff,''checked'',''on''),',...'set(hm_gridon,''checked'',''off''),',...'grid off'];hm_gridon=uimenu(hm,'label','grid on',... 'checked','on',...'callback',huidiao1);hm_gridoff=uimenu(hm,'label','grid off',... 'checked','off',...'callback',huidiao2);实例40:UIMENU菜单的应用h0=figure('toolbar','none',...'position',[200 150 450 250],...'name','实例40');h1=uimenu(gcf,'label','函数');h11=uimenu(h1,'label','轮廓图',...'callback',[...'set(h31,''checked'',''on''),',...'set(h32,''checked'',''off''),',...'[x,y,z]=peaks;,',...'contour3(x,y,z,30)']);h12=uimenu(h1,'label','高斯分布',...。
matlab十个简单案例编写
matlab十个简单案例编写1. 求解线性方程组线性方程组是数学中常见的问题之一,而MATLAB提供了用于求解线性方程组的函数。
例如,我们可以使用"linsolve"函数来求解以下线性方程组:2x + 3y = 74x - 2y = 2代码如下所示:A = [2, 3; 4, -2];B = [7; 2];X = linsolve(A, B);disp(X);解释:上述代码定义了一个2x2的矩阵A和一个2x1的矩阵B,分别表示线性方程组的系数矩阵和常数向量。
然后,使用linsolve函数求解线性方程组,结果存储在X中,并通过disp函数打印出来。
运行代码后,可以得到x=2和y=1的解。
2. 求解非线性方程除了线性方程组外,MATLAB还可以用于求解非线性方程。
例如,我们可以使用"fzero"函数求解以下非线性方程:x^2 + 2x - 3 = 0代码如下所示:fun = @(x) x^2 + 2*x - 3;x0 = 0;x = fzero(fun, x0);disp(x);解释:上述代码定义了一个匿名函数fun,表示非线性方程。
然后,使用fzero函数传入fun和初始值x0来求解非线性方程的根,并通过disp函数打印出来。
运行代码后,可以得到x=1的解。
3. 绘制函数图像MATLAB提供了强大的绘图功能,可以帮助我们可视化函数的形状和特征。
例如,我们可以使用"plot"函数绘制以下函数的图像:y = cos(x)代码如下所示:x = linspace(0, 2*pi, 100);y = cos(x);plot(x, y);解释:上述代码首先使用linspace函数生成一个从0到2π的100个等间距点的向量x,然后计算对应的cos值,并存储在向量y中。
最后,使用plot函数将x和y作为横纵坐标绘制出函数图像。
运行代码后,可以看到cos函数的周期性波动图像。
matlab实用程序百例(6)
matlab实用程序百例(6)可设置函数曲线光源的用户界面h0=figure('toolbar','none',...'position',[198****8468],...'name','实例53');h1=axes('parent',h0,...'position',[0.15 0.5 0.7 0.5],...'visible','off');[x,y]=meshgrid(-8:0.5:8);r=sqrt(x.^2+y.^2)+eps;z=sin(r)./r;fh=surf(x,y,z);shading interpview([-60 30])camlight leftlightk=light('position',[0 -2 1]);button1=uicontrol('parent',h0,...'style','pushbutton',...'string','设置光线',...'position',[80 60 70 30],...'callback',[...'an1=inputdlg(''光线来源的X轴坐标'');,',... 'k1=str2num(an1{1});,',...'an2=inputdlg(''光线来源的Y轴坐标'');,',... 'k2=str2num(an2{1});,',...'an3=inputdlg(''光线来源的Z轴坐标'');,',... 'k3=str2num(an3{1});,',...'set(lightk,''position'',[k1 k2 k3]);,',...'set(edit1,''string'',[''['',num2str(k1),'''',num2str(k2),'' '',num2str(k3),'']'']);']);button2=uicontrol('parent',h0,...'style','pushbutton',...'string','关闭',...'position',[250 60 70 30],...'callback','close');edit1=uicontrol('parent',h0,...'style','edit',...'max',2,...'min',0,...'fontsize',15,...'backgroundcolor',[1 1 1],...'string','[0 -2 1]',...'position',[80 110 220 30]);text1=uicontrol('parent',h0,...'style','text',...'backgroundcolor',[0.75 0.75 0.75],...'fontsize',15,...'string','光线来源坐标',...'position',[80 140 220 30]);添加效果h0=figure('toolbar','none',...'position',[200 50 300 350],...'name','实例54');h1=axes('parent',h0,...'position',[0.2 0.4 0.6 0.6],...'visible','off');ezsurf('sin(sqrt(x.^2+y.^2))/sqrt(x.^2+y.^2)',[-6*pi,6*pi]) b1=uicontrol('parent',h0,...'units','points',...'tag','b1',...'style','pushbutton',...'string','设置',...'backgroundcolor',[0.75 0.75 0.75],... 'position',[40 50 50 20],...'callback',[...'view(0,75);,',...'shading interp;,',...'lightangle(-45,30);,',...'k=findobj(gca,''type'',''surface'');,'... 'set(k,''facelighting'',''phong'');,',... 'set(k,''ambientstrength'',0.3);,',...'set(k,''diffusestrength'',0.8);,',...'set(k,''specularstrength'',0.9);,',...'set(k,''specularexponent'',25);,',... 'set(k,''backfacelighting'',''unlit'')']); b2=uicontrol('parent',h0,...'units','points',...'tag','b2',...'style','pushbutton',...'string','关闭',...'backgroundcolor',[0.75 0.75 0.75],... 'position',[120 50 50 20],...'callback','close');查询日期h0=figure('toolbar','none',...'position',[198****8468],...'name','实例55');h1=axes('parent',h0,...'position',[0.15 0.5 0.7 0.5],...'visible','off');huidiao=[...'yearnum=str2num(get(edit1,''string''));,',...'monthnum=str2num(get(edit2,''string''));,',...'daynum=str2num(get(edit3,''string''));,',...'monthday=[0 31 28 31 30 31 30 31 31 30 31 30 31];,',... 'dyear=yearnum-2000;,',...'beishu=fix(dyear/4);,',...'yushu=rem(yearnum,4);,',...'if yushu==0,',...'monthday(3)=29;,',...'end,',...'mday=0;,',...'for i=1:monthnum,',...'mday=monthday(i)+mday;,',...'end,',...'yearday=mday+daynum-1;,',...'noweek=fix(yearday/7);,',...'set(edit5,''string'',[''第'',num2str(noweek),''周'']);,',...'if dyear>0,',...'if yushu==0,',...'beishu=beishu-1;,',...'end,',...'dday=yearday+365*dyear+beishu+1;,',...'end,',...'if dyear<=0,',...'dday=365*dyear+yearday+beishu;,',...'end,',...'mweek=rem(dday,7)+7;,',...'set(edit4,''string'',''Sunday'');,',...'end,',...'if mweek==9,',...'set(edit4,''string'',''Monday'');,',...'end,',...'if mweek==10,',...'set(edit4,''string'',''Tuesday'');,',...'end,',...'if mweek==11,',...'set(edit4,''string'',''Wednesday'');,',... 'end,',...'if mweek==12,',...'set(edit4,''string'',''Thursday'');,',... 'end,',...'if mweek==13,',...'set(edit4,''string'',''Friday'');,',...'end,',...'if mweek==7,',...'set(edit4,''string'',''Saturday'');,',... 'end,',...'if mweek==6,',...'set(edit4,''string'',''Friday'');,',...'end,',...'if mweek==5,',...'set(edit4,''string'',''Thursday'');,',... 'end,',...'if mweek==4,',...'set(edit4,''string'',''Wednesday'');,',... 'end,',...'set(edit4,''string'',''Tuesday'');,',... 'end,',...'if mweek==2,',...'set(edit4,''string'',''Monday'');,',... 'end,',...'if mweek==1,',...'set(edit4,''string'',''Sunday'');,',... 'end'];edit1=uicontrol('parent',h0,...'style','edit',...'horizontalalignment','right',...'position',[40 300 50 20]);text1=uicontrol('parent',h0,...'style','text',...'string','年',...'horizontalalignment','left',...'position',[90 300 50 20]);edit2=uicontrol('parent',h0,...'style','edit',...'horizontalalignment','right',...'position',[160 300 50 20]);text2=uicontrol('parent',h0,...'style','text',...'string','月',...'horizontalalignment','left',...'position',[210 300 50 20]);edit3=uicontrol('parent',h0,...'style','edit',...'horizontalalignment','right',...'position',[280 300 50 20]);text3=uicontrol('parent',h0,... 'style','text',...'string','日',...'horizontalalignment','left',...'position',[330 300 50 20]);edit4=uicontrol('parent',h0,... 'style','edit',...'horizontalalignment','left',...'position',[210 200 120 20]); text4=uicontrol('parent',h0,... 'style','text',...'string','查找的日期为',...'horizontalalignment','right',... 'position',[110 200 100 20]); edit5=uicontrol('parent',h0,... 'style','edit',...'horizontalalignment','left',...'position',[210 100 120 20]); text1=uicontrol('parent',h0,... 'style','text',...'string','该日处于',...'horizontalalignment','left',...'position',[160 100 50 20]); button1=uicontrol('parent',h0,... 'style','pushbutton',...'position',[80 40 80 30],...'string','开始',...'callback',huidiao);button2=uicontrol('parent',h0,...'style','pushbutton',...'position',[220 40 80 30],...'string','关闭',...'callback','close');图形效果(1)h0=figure('toolbar','none',...'position',[198****0468],...'name','实例56');h1=axes('parent',h0,...'position',[0.3 0.45 0.5 0.5],...'visible','off');l1=uimenu(gcf,'label','Draw figure',... 'tag','l1');huidiao=[...'if get(r1,''value'')==1,',...'shading faceted,',...'end,',...'if get(r2,''value'')==1,',...'shading flat,',...'end,',...'if get(r3,''value'')==1,',...'shading interp,',...'end,',...'k=get(p1,''value'');,',...'switch k,',...'case 1,',...'colormap(''cool''),',...'case 2,',...'colormap(''spring''),',...'case 3,',...'colormap(''summer''),',...'case 4,',...'colormap(''autumn''),',...'case 5,',...'colormap(''winter''),',...'end'];l11=uimenu('parent',l1,...'label','Surface',...'tag','l11',...'callback',[...'[x,y]=meshgrid(-8:0.5:8);,',... 'r=sqrt(x.^2+y.^2)+eps;,',... 'z=sin(r)./r;,',...'surf(x,y,z),',... huidiao]);l12=uimenu('parent',l1,...'label','Mesh',...'tag','l12',...'callback',[...'mesh(peaks),',... huidiao]);l13=uimenu('parent',l1,...'label','Membrane',...'tag','l13',...'callback',[...'mesh(membrane),',... huidiao]);f1=uicontrol('parent',h0,... 'units','points',...'listboxtop',0,...'position',[12 6 100 101],...'style','frame',...'tag','f1');r1=uicontrol('parent',h0,...'units','points',...'backgroundcolor',[0.753 0.753 0.753],... 'listboxtop',0,...'position',[19.5 58.5 72.75 16.5],...'string','shading faceted',...'style','radiobutton',...'tag','r1',...'value',1,...'callback',[...'shading faceted,',...'set(r1,''value'',1);,',...'set(r2,''value'',0);,',...'set(r3,''value'',0);']);r2=uicontrol('parent',h0,...'units','points',...'backgroundcolor',[0.753 0.753 0.753],... 'listboxtop',0,...'position',[19.5 35.25 78.75 18.75],...'string','shading flat',...'style','radiobutton',...'tag','r2',...'value',0,...'callback',[...'shading flat,',...'set(r2,''value'',1);,',...'set(r1,''value'',0);,',...'set(r3,''value'',0);']);r3=uicontrol('parent',h0,...'units','points',...'backgroundcolor',[0.753 0.753 0.753],... 'listboxtop',0,...'position',[19.5 12.75 71.25 18.75],...'string','shading interp',...'style','radiobutton',...'tag','r3',...'value',0,...'callback',[...'shading interp,',...'set(r3,''value'',1);,',...'set(r1,''value'',0);,',...'set(r2,''value'',0);']);t1=uicontrol('parent',h0,...'units','points',...'backgroundcolor',[0.753 0.753 0.753],... 'fontsize',12,...'listboxtop',0,...'position',[14.25 75.75 90.75 22.5],...'string','平滑处理',...'style','text',...'tag','t1');t2=uicontrol('parent',h0,...'units','points',...'backgroundcolor',[0.753 0.753 0.753],... 'fontsize',12,...'listboxtop',0,...'position',[117 69 72.75 17.5],...'string','设置色调',...'style','text',...'tag','t2');p1=uicontrol('parent',h0,...'units','points',...'backgroundcolor',[0.753 0.753 0.753],...'listboxtop',0,...'position',[116.25 39 72.75 20.25],...'string','Cool|Spring|Summer|Autumn|Winter',... 'style','popupmenu',...'tag','p1',...'value',1,...'callback',[...'k=get(p1,''value'');,',...'switch k,',...'case 1,',...'colormap(''cool''),',...'case 2,',...'colormap(''spring''),',...'case 3,',...'colormap(''summer''),',...'case 4,',...'colormap(''autumn''),',...'case 5,',...'colormap(''winter''),',...'end']);b1=uicontrol('parent',h0,...'units','points',...'backgroundcolor',[0.753 0.753 0.753],...'listboxtop',0,...'position',[12 243 72.75 30.75],...'string','关闭',...'tag','b1',...'callback','close');b2=uicontrol('parent',h0,...'units','points',...'backgroundcolor',[0.753 0.753 0.753],... 'listboxtop',0,...'position',[216.75 67.5 83.25 18.75],... 'string','Colorbar',...'tag','b2',...'callback','colorbar');图形效果h0=figure('toolbar','none',...'position',[168 94.5 315 289.5],...'name','实例57');h1=axes('parent',h0,...'position',[0.4 0.4 0.5 0.5],...'visible','off');f1=uicontrol('parent',h0,...'style','frame',...'position',[15 10 80 70],...'string','dull',...'units','points',...'backgroundcolor',[0.753 0.753 0.753],... 'listboxtop',0,...'tag','r1',...'value',1,...'callback',[...'set(r1,''value'',1);,',...'set(r2,''value'',0);,',...'set(r3,''value'',0);,',...'material dull']);r1=uicontrol('parent',h0,...'style','radiobutton',...'position',[19.5 58.5 72.75 16.5],...'string','dull',...'units','points',...'backgroundcolor',[0.753 0.753 0.753],... 'listboxtop',0,...'tag','r1',...'value',1,...'callback',[...'set(r1,''value'',1);,',...'set(r2,''value'',0);,',...'set(r3,''value'',0);,',...'material dull']);r2=uicontrol('parent',h0,...'style','radiobutton',...'position',[19.5 35.25 72.75 16.5],...'string','metal',...'units','points',...'backgroundcolor',[0.753 0.753 0.753],... 'listboxtop',0,...'tag','r2',...'value',0,...'callback',[...'set(r2,''value'',1);,',...'set(r1,''value'',0);,',...'set(r3,''value'',0);,',...'material metal']);r3=uicontrol('parent',h0,...'style','radiobutton',...'position',[19.5 12.75 72.75 16.5],...'string','shiny',...'units','points',...'backgroundcolor',[0.753 0.753 0.753],... 'listboxtop',0,...'tag','r3',...'value',0,...'callback',[...'set(r3,''value'',1);,',...'set(r1,''value'',0);,',...'set(r2,''value'',0);,',...'material shiny']);u1=uimenu('parent',h0,...'label','绘图',...'backgroundcolor',[0.753 0.753 0.753],... 'tag','u1',...'callback',[...'[x,y]=meshgrid(-8:0.5:8);,',...'r=sqrt(x.^2+y.^2)+eps;,',...'z=sin(r)./r;,',...'surf(x,y,z),',...'shading interp']);b1=uicontrol('parent',h0,...'style','pushbutton',...'position',[19.5 150 60 20],...'string','light',...'units','points',...'backgroundcolor',[0.753 0.753 0.753],... 'listboxtop',0,...'tag','b1',...'callback','camlight headlight');b2=uicontrol('parent',h0,...'style','pushbutton',...'position',[19.5 100 60 20],...'string','关闭',...'units','points',...'backgroundcolor',[0.753 0.753 0.753],... 'listboxtop',0,...'tag','b2',...'callback','close');可控制小球运动速度的用户界面h0=figure('toolbar','none',...'position',[198****0468],...'name','实例58');h1=axes('parent',h0,...'position',[0.25 0.45 0.5 0.5],...'visible','off');t=0:0.1:4*pi;x=sin(t);y=cos(t);plot(x,y)axis equalaxis offh=line('color',[1 0 0],...'linestyle','.',...'xdata',0,...'ydata',1,...'markersize',20,...'erasemode','xor');n=length(t);i=1;speed=0.01;k=0;b1huidiao=[...'k=0;,',...'while 1,',...'set(h,''xdata'',x(i),''ydata'',y(i));,',... 'drawnow,',...'pause(speed),',...'i=i+1;,',...'if i>n,',...'i=1;,',...'end,',...'if k==1,',...'break,',...'end,',...'end'];b1=uicontrol('parent',h0,...'units','points',...'tag','b1',...'style','pushbutton',...'string','开始',...'backgroundcolor',[0.75 0.75 0.75],... 'position',[30 80 50 20],...'callback',b1huidiao);b2=uicontrol('parent',h0,...'units','points',...'style','pushbutton',...'string','停止',...'backgroundcolor',[0.75 0.75 0.75],... 'position',[100 80 50 20],...'callback','k=1;');b3=uicontrol('parent',h0,...'units','points',...'tag','b3',...'style','pushbutton',...'string','关闭',...'backgroundcolor',[0.75 0.75 0.75],... 'position',[170 80 50 20],...'callback',[...'k=1;,',...'close']);s1=uicontrol('parent',h0,...'units','points',...'tag','s1',...'style','slider',...'value',50*speed,...'max',1,...'min',0,...'backgroundcolor',[0.75 0.75 0.75],... 'position',[30 115 190 20],...'callback',[...'m=get(s1,''value'');,',...'speed=m/50;']);t1=uicontrol('parent',h0,...'units','points',...'style','text',...'fontsize',15,...'string','小球运动速度',...'backgroundcolor',[0.75 0.75 0.75],...'position',[30 135 190 20]);设置坐标轴纵横轴比h0=figure('name','实例59');h1=axes('parent',h0,...'position',[0.3 0.45 0.5 0.5],...'visible','off');u1=uimenu('parent',h0,...'label','绘图',...'backgroundcolor',[0.753 0.753 0.753],... 'tag','u1',...'callback',[...'[x,y]=meshgrid(-8:0.5:8);,',...'r=sqrt(x.^2+y.^2)+eps;,',...'z=sin(r)./r;,',...'mesh(x,y,z),',...'shading interp,',...'axis normal']);f1=uicontrol('parent',h0,...'units','points',...'listboxtop',0,...'position',[12 6 100 150],...'style','frame',...'tag','f1');t1=uicontrol('parent',h0,...'units','points',...'backgroundcolor',[0.753 0.753 0.753],... 'listboxtop',0,...'position',[19.5 130 72.75 16.5],...'string','坐标纵横比',...'style','text',...'tag','t1');r1=uicontrol('parent',h0,...'units','points',...'backgroundcolor',[0.753 0.753 0.753],... 'listboxtop',0,...'position',[19.5 110 72.75 16.5],...'string','axis equal',...'style','radiobutton',...'tag','r1',...'value',1,...'callback',[...'set(r1,''value'',1);,',...'set(r2,''value'',0);,',...'set(r3,''value'',0);,',...'set(r4,''value'',0);,',...'set(r5,''value'',0);,',...'axis equal']);r2=uicontrol('parent',h0,...'units','points',...'backgroundcolor',[0.753 0.753 0.753],... 'listboxtop',0,...'position',[19.5 85 72.75 16.5],...'string','axis square',...'style','radiobutton',...'tag','r2',...'value',0,...'callback',[...'set(r2,''value'',1);,',...'set(r1,''value'',0);,',...'set(r3,''value'',0);,',...'set(r4,''value'',0);,',...'set(r5,''value'',0);,',...'axis square']);r3=uicontrol('parent',h0,...'units','points',...'backgroundcolor',[0.753 0.753 0.753],... 'listboxtop',0,...'position',[19.5 60 72.75 16.5],...'string','axis image',...'style','radiobutton',...'tag','r3',...'value',0,...'callback',[...'set(r3,''value'',1);,',...'set(r2,''value'',0);,',...'set(r1,''value'',0);,',...'set(r4,''value'',0);,',...'set(r5,''value'',0);,',...'axis image']);r4=uicontrol('parent',h0,...'units','points',...'backgroundcolor',[0.753 0.753 0.753],... 'listboxtop',0,...'position',[19.5 35 72.75 16.5],...'string','axie vis3d',...'style','radiobutton',...'tag','r4',...'value',0,...'callback',[...'set(r4,''value'',1);,',...'set(r2,''value'',0);,',...'set(r3,''value'',0);,',...'set(r1,''value'',0);,',...'set(r5,''value'',0);,',...'axis vis3d']);r5=uicontrol('parent',h0,...'units','points',...'backgroundcolor',[0.753 0.753 0.753],... 'listboxtop',0,...'position',[19.5 10 72.75 16.5],...'string','axis auto',...'style','radiobutton',...'tag','r5',...'value',0,...'callback',[...'set(r5,''value'',1);,',...'set(r2,''value'',0);,',...'set(r3,''value'',0);,',...'set(r4,''value'',0);,',...'set(r1,''value'',0);,',...'axis auto']);b1=uicontrol('parent',h0,...'units','points',...'backgroundcolor',[0.753 0.753 0.753],... 'listboxtop',0,...'position',[12 243 72.75 30.75],...'string','关闭',...'tag','b1',...'callback','close');b2=uicontrol('parent',h0,...'units','points',...'backgroundcolor',[0.753 0.753 0.753],... 'listboxtop',0,...'position',[216.75 67.5 83.25 18.75],... 'string','Colorbar',...'tag','b2',...'callback','colorbar');动态文本显示h0=figure('toolbar','none',...'position',[198****0468],...'name','实例60');h1=axes('parent',h0,...'position',[0.25 0.45 0.5 0.5],...'visible','off');str1='当前阻尼比=';z=0.52;t=0:0.1:10;y=step(1,[1 2*z 1],t);hline=plot(t,y);grid onr1=uicontrol('parent',h0,...'units','points',...'tag','r1',...'style','radio',...'string','grid on',...'position',[30 120 60 20],...'backgroundcolor',[0.75 0.75 0.75],... 'value',1,...'callback',[...'grid on,',...'set(r1,''value'',1);,',...'set(r2,''value'',0)']);r2=uicontrol('parent',h0,...'units','points',...'tag','r2',...'style','radio',...'string','grid on',...'position',[30 95 60 20],...'backgroundcolor',[0.75 0.75 0.75],... 'value',0,...'callback',[...'grid off,',...'set(r2,''value'',1);,',...'set(r1,''value'',0)']);s1=uicontrol('parent',h0,...'units','points',...'tag','s1',...'style','slider',...'value',z,...'position',[100 95 150 20],...'backgroundcolor',[0.75 0.75 0.75],... 'max',1,...'min',0,...'callback',[...'z=get(s1,''value'');,',...。
matlab操作大全
MATLAB常用操作大全1.点乘,点除,点乘方点乘(对应元素相乘),必须同维或者其中一个是标量,a.*b点除,a.\b表示矩阵b的每个元素除以a中对应元素或者除以常数a,a./b表示常数a除以矩阵b中每个元素或者矩阵a除以矩阵b对应元素或者常数b点乘方a.^b,矩阵a中每个元素按b中对应元素乘方或者b是常数2.矩阵中元素的操作矩阵a中第r行,a(r,:),第r列,a(:,r),依次提取每一列组成一个列向量a(:),提取子矩阵第i到j行和第k到t列a(i:j,k:t)可以通过下标引用,但是元素下标从1开始,也可通过序号引用,但是按列存储,也就是说对于3*3的矩阵a,a(4)是a(1,2)不是a(2,1)3.求极限syms x;f表达式limit(f,0)//表示x趋于0时的极限4.因式分解syms xfactor(表达式)5.求积分syms xint(y,3,4)//在区间3到4求积分或者quad('sin(x)',4,6) %必加引号5 . 求n阶导数diff(函数表达式,阶数n)//注意并不是在x = n时的一阶导数值6.解一元方程syms xy = X^3 - 1//y必须是个式子,也就是说x必须是符号变量不可是具体的数,否则一直空解solve(y)或者求方程3x4+7x3 +9x2-23=0的全部根。
p=[3,7,9,0,-23]; %建立多项式系数向量x=roots(p) %求根7.whos用于显示驻留在工作区内的变量的详细信息,采用clear 变量名把该变量清理出内存8.linspace(a,b,n) 其中a和b是生成向量的第一个和最后一个元素,n是元素总数。
显然,linspace(a,b,n)与a:(b-a)/(n-1):b等价。
9.size(矩阵名),输出行数和列数,比如产生和矩阵a同维的全一阵,ones(size(a))10.常用的产生通用特殊矩阵的函数有:zeros:产生全0矩阵(零矩阵)。
一些简单的算法MATLAB代码

一些简单的算法MATLAB代码1.冒泡排序算法```matlabfunction sortedArray = bubbleSort(array)n = length(array);for i = 1:n-1for j = 1:n-iif array(j) > array(j+1)temp = array(j);array(j) = array(j+1);array(j+1) = temp;endendendsortedArray = array;end```2.选择排序算法```matlabfunction sortedArray = selectionSort(array) n = length(array);for i = 1:n-1minIndex = i;for j = i+1:nif array(j) < array(minIndex)minIndex = j;endendif minIndex ~= itemp = array(i);array(i) = array(minIndex);array(minIndex) = temp;endendsortedArray = array;end```3.插入排序算法```matlabfunction sortedArray = insertionSort(array) n = length(array);for i = 2:nkey = array(i);j=i-1;while j >= 1 && array(j) > keyarray(j+1) = array(j);j=j-1;endarray(j+1) = key;endsortedArray = array;end```4.快速排序算法```matlabfunction sortedArray = quickSort(array)n = length(array);if n <= 1sortedArray = array;return;endpivot = array(1);smaller = [];larger = [];for i = 2:nif array(i) <= pivotsmaller = [smaller array(i)];elselarger = [larger array(i)];endendsortedArray = [quickSort(smaller) pivot quickSort(larger)]; end```5.阶乘算法```matlabfunction factorial = calculateFactorial(n)if n == 0factorial = 1;elsefactorial = n * calculateFactorial(n-1);endend```6.斐波那契数列算法```matlabfunction fibonacci = generateFibonacci(n) fibonacci = zeros(n, 1);fibonacci(1) = 0;fibonacci(2) = 1;for i = 3:nfibonacci(i) = fibonacci(i-1) + fibonacci(i-2); endend```7.素数判断算法```matlabfunction isPrime = checkPrime(n) isPrime = true;if n <= 1isPrime = false;return;endfor i = 2:sqrt(n)if rem(n, i) == 0isPrime = false;break;endendend```8.最大公约数算法(辗转相除法)```matlabfunction gcd = calculateGCD(a, b)if b == 0gcd = a;elsegcd = calculateGCD(b, rem(a, b));endend```9.最小公倍数算法```matlabfunction lcm = calculateLCM(a, b)lcm = a * b / calculateGCD(a, b);end```10.线性算法```matlabfunction index = linearSearch(array, target) n = length(array);index = -1;for i = 1:nif array(i) == targetindex = i;break;endendend```这些简单的算法代码可以用于排序、数字计算和等问题。
matlab语言常用算法程序集
matlab语言常用算法程序集MATLAB是一种常用的数值计算和科学计算语言,常用于工程、科学、统计分析和数据可视化等领域。
其功能强大且易于学习和使用,同时还提供了丰富的算法和函数库,用于实现各种常用算法。
以下是一些MATLAB常用算法程序集。
1.线性代数算法:MATLAB提供了一系列强大的线性代数函数,用于矩阵运算和线性方程求解。
包括矩阵乘法、求逆矩阵、求解线性方程组、特征值和特征向量计算等。
2.优化算法:MATLAB提供了多种优化算法,用于寻找函数的最小值或最大值。
包括最优化问题的求解、约束优化、非线性优化、整数规划等。
3.插值与拟合算法:MATLAB提供了多种插值和拟合函数,用于通过已知数据点求未知点的值或者近似函数。
常用的算法包括线性插值、多项式拟合、样条插值、最小二乘拟合等。
4.数值积分与微分算法:MATLAB提供了多种数值积分和微分函数,用于计算函数的定积分或求解微分方程。
包括常用的数值积分法(如梯形法、辛普森法)、微分方程求解(如欧拉法、四阶龙格库塔法)等。
5.图像处理算法:MATLAB提供了图像处理工具箱,包括图像读取、显示、滤波、变换等功能。
常用的算法包括图像平滑、边缘检测、图像分割、形态学运算等。
6.信号处理算法:MATLAB提供了信号处理工具箱,用于处理和分析信号数据。
包括滤波、傅里叶变换、频谱分析、信号降噪等。
7.统计分析算法:MATLAB提供了丰富的统计分析工具,用于数据分析和建模。
包括描述性统计、假设检验、ANOVA分析、回归分析、时间序列分析等。
8.机器学习算法:MATLAB提供了机器学习工具箱,用于实现各种机器学习算法。
包括监督学习算法(如线性回归、逻辑回归、支持向量机)、无监督学习算法(如聚类分析、主成分分析)等。
9.计算几何算法:MATLAB提供了计算几何工具箱,用于解决各种计算几何问题。
包括点线面的计算、多边形和曲线的操作、三维几何变换等。
10.数值分析算法:MATLAB提供了多种数值分析函数,用于数值计算和近似求解。
matlab 矩阵运算程序
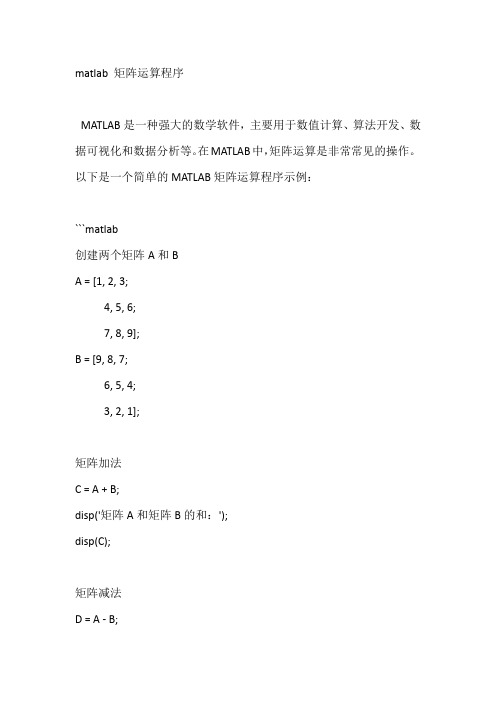
matlab 矩阵运算程序MATLAB是一种强大的数学软件,主要用于数值计算、算法开发、数据可视化和数据分析等。
在MATLAB中,矩阵运算是非常常见的操作。
以下是一个简单的MATLAB矩阵运算程序示例:```matlab创建两个矩阵A和BA = [1, 2, 3;4, 5, 6;7, 8, 9];B = [9, 8, 7;6, 5, 4;3, 2, 1];矩阵加法C = A + B;disp('矩阵A和矩阵B的和:');disp(C);矩阵减法D = A - B;disp('矩阵A和矩阵B的差:'); disp(D);矩阵乘法E = A * B;disp('矩阵A和矩阵B的乘积:'); disp(E);矩阵转置T = transpose(A);disp('矩阵A的转置:');disp(T);求矩阵的行列式det_A = det(A);disp('矩阵A的行列式:');disp(det_A);求矩阵的逆矩阵inv_A = inv(A);disp('矩阵A的逆矩阵:');disp(inv_A);求矩阵的秩rank_A = rank(A);disp('矩阵A的秩:');disp(rank_A);求矩阵的特征值eig_A = eig(A);disp('矩阵A的特征值:');disp(eig_A);```以上程序演示了MATLAB中的一些基本矩阵运算,如加法、减法、乘法、转置、求行列式、求逆矩阵、求秩和求特征值等。
您可以根据实际需求修改矩阵A和B的值,然后运行该程序以观察结果。
需要注意的是,这里的矩阵运算都是在MATLAB环境下进行的。
如果要编写比MATLAB更快的矩阵运算程序,可以尝试使用如C、C++等编程语言,并链接到高性能的数学库,如Intel的Math Kernel Library(MKL)。
MATLAB操作命令大全

MATLAB操作命令大全1.基本操作- help:查看函数的帮助文档。
- save:将变量保存到文件中。
- load:从文件中加载变量。
- clear:清除当前工作空间中的变量。
- who:列出当前工作空间中的变量。
- whos:显示当前工作空间中变量的详细信息。
- quit:退出MATLAB。
2.变量操作-=:赋值操作,将值赋给变量。
- disp:显示变量的值。
- length:返回数组的长度。
- size:返回数组的大小。
- max:返回数组的最大值。
- min:返回数组的最小值。
- sum:返回数组元素的和。
3.数学操作-+:加法操作,将两个数值相加。
--:减法操作,将两个数值相减。
-*:乘法操作,将两个数值相乘。
-/:除法操作,将两个数值相除。
-^:指数操作,将一个数值提高到指定次幂。
- sqrt:返回一个数值的平方根。
- abs:返回一个数值的绝对值。
4.矩阵操作- eye:创建一个单位矩阵。
- zeros:创建一个全0矩阵。
- ones:创建一个全1矩阵。
- rand:创建一个0到1之间的随机矩阵。
- diag:返回对角线元素。
- inv:返回矩阵的逆矩阵。
- det:返回矩阵的行列式。
5.图形操作- plot:绘制二维线图。
- scatter:绘制散点图。
- bar:绘制柱状图。
- hist:绘制直方图。
- surf:绘制三维曲面图。
- contour:绘制等高线图。
- imagesc:绘制矩阵的颜色图。
6.控制流程操作- if:用于条件判断。
- for:用于循环操作。
- while:用于循环操作。
- switch:用于多条件判断。
- break:跳出循环。
- continue:跳过当前循环,并继续执行下一次循环。
7.文件操作- fopen:打开文件。
- fclose:关闭文件。
- fprintf:将数据写入文件。
- fscanf:从文件中读取数据。
- fseek:设置文件指针的位置。
- 1、下载文档前请自行甄别文档内容的完整性,平台不提供额外的编辑、内容补充、找答案等附加服务。
- 2、"仅部分预览"的文档,不可在线预览部分如存在完整性等问题,可反馈申请退款(可完整预览的文档不适用该条件!)。
- 3、如文档侵犯您的权益,请联系客服反馈,我们会尽快为您处理(人工客服工作时间:9:00-18:30)。
MATLAB简单程序大全求特征值特征向量A=[2 3 4;1 5 9;8 5 2]det(A)A'rank(A)inv(A)rref(A)eig(A)%求特征值和特征向量卫星运行问题h=200,H=51000,R=6378;a=(h+H+2*R)/2;c=(H-h)/2;b=(a^2-c^2)^(1/2);e=c/a;f=sqrt(1-exp(2).*cos(t)^2);l=int(f,t,0,pi/2)L=4*a.*l动态玫瑰线n=3;N=10000;theta=2*pi*(0:N)/N;r=cos(n*theta);x=r.*cos(theta);y=r.*sin(theta);comet(x,y)二重积分syms x yf=x^2*sin(y);int(int(f,x,0,1),y,0,pi)ezmesh(f,[0,1,0,pi])函数画图syms x;f=exp(-0.2*x)*sin(0.5*x);ezplot(f,[0,8*pi])玫瑰线theta=0:0.01:2*pi;r=cos(3*theta);polar(theta,r,'r')求x^2+y^2=1和x^2+z^2=1所围成的体积syms x y z Rr=1;Z=sqrt(1-x^2);y0=Z;V=8*int(int(Z,y,0,y0),x,0,1)求导数及图像f='1/(5+4*cos(x))';subplot(1,2,1);ezplot(f)f1=diff(f)subplot(1,2,2);ezplot(f1)绕x轴旋转t=(0:20)*pi/10;r=exp(-.2*t).*sin(.5*t);theta=t;x=t'*ones(size(t));y=r'*cos(theta);z=r'*sin(theta);mesh(x,y,z)colormap([0 0 0])某年是否闰年year=input('input year:=');n1=year/4;n2=year/100;n3=year/400;if n1==fix(n1)&n2~=fix(n2)disp('是闰年')elseif n1==fix(n1)&n3==fix(n3)disp('是闰年')elsedisp('不是闰年')End玫瑰线的绘制theta=0:0.001:2*pi;rho=2*cos(3*theta);figure(1);polar(theta,rho)x=rho.*cos(theta);y=rho.*sin(theta);figure(2);comet(x,y)相遇问题function k=moto(A,B)if nargin==0,A=0;B=100;end va=10;vb=8;vc=60;f=1;k=0;while(B-A)>0.2if f==1tk=(B-A)/(vb+vc);elsetk=(B-A)/(vc+va);endA=A+va*tk;B=B-vb*tk;f=-f;k=k+1;End数学实验syms x; x=1:100;f(x)=exp(-0.2*x).*sin(0.5*x); syms x; x=1:100;f(x)=exp(-0.2*x).*sin(0.5*x); plot(x,f(x))syms x; x=0:0.1:2*pi;f(x)=exp(-0.2*x)*sin(0.5*x); plot(x,f(x))syms x; x=0:0.1:2*pi;f(x)=exp(-0.2*x).*sin(0.5*x);plot(x,f(x))syms x; x=0:0.1:2*pi;f(x)=exp(-0.2*x).*sin(0.5*x); zplot(x,f(x))clcf=sym('sin(x)/x');limit(f)f1=sym('(1+a/x)^x')limit(f1)f1=sym('(1+a/x)^x'),x=inf;limit(f1)clcf1=sym('(1+1/x)^x');limit(f1,'inf')f1=sym('(1+1/x)^x');limit(f1,'inf')clcf1=sym('(1+1/x)^x');limit(f1,'x',inf)Clc相遇问题A=0;B=100;va=10;vb=8;vc=60;f=1;k=0;plot(A,0,'ro',B,0,'go'),hold on while(B-A)>0.2if f==1tk=(B-A)/(vb+vc);elsetk=(B-A)/(vc+va);endA=A+va*tk;B=B-vb*tk;plot(A,0,'R.',B,0,'g.'),pause(1)f=-f;k=k+1;endk,tk,A,B数学实验f=[0 9 13.5;0.1 0 0;0 0.2 0]x=[100;100;100]y=xfor n=1:3x=f*xy=[y,x]endyfigure(1),bar(y(1,:))figure(2),bar(y(2,:))figure(3),bar(y(3,:))[p,d]=eig(f)a=p(:,1)b=a/sum(a)x1=b*300y1=x1for n=1:3x1=f*x1y1=[y1,x1]endy1figure(4),bar(y1(1,:))figure(5),bar(y1(2,:))figure(6),bar(y1(3,:))杨辉三角function Y=yang(n)if nargin==0,n=3;endY=eye(n);Y(:,1)=ones(n,1);for k=3:nY(k,2:k-1)=Y(k-1,1:k-2)+Y(k-1,2:k-1);End实例2 寻找水仙花数一、实验内容数153有一个特殊的性质,即153=1^3+5^3+3^3,那么有没有其他这样的数呢?我们怎样利用MATLAB程序设计快速寻求这些水仙花数呢?二、实验分析把任一数各位数字的立方和求出,再求所得的各位数字的立方和,依次进行下去,总可以得到一个水仙花数.如把76按这样的运算进行下去:33333333333376559,559979,9791801,1801514,+=++=++=+++=333333333333514190,190730,730370,370370++=++=++=++=结果得到一个水仙花数370。
三、实验程序(寻求水仙花数经典的程序)for a=1:9for b=0:9;for c=0:9;if a^3+b^3+c^3==a*100+b*10+c;sxh=a*100+b*10+cendendendend四、实验结果sxh =153,370, 371, 407。
实例4 住房贷款的等额本息还款法计算一、实验内容当前在银行放贷项目中,住房按揭贷款占相当大的比重。
这一贷款促进了房地产事业的迅速发展,它不但改善了居民的居住条件,也促进了建筑行业、钢铁行业和其他相关行业的发展,与此同时,也创造了大量的就业机会。
在这中间,银行利率起了巨大的杠杆作用,过高的利率会使按揭购房减少,房价下跌;过低的利率会使按揭贷款购房者数量增加,当房源供不应求时,受供求关系的影响,房价将上涨。
假设某购房者向银行贷款的金额为p0,银行的月利率为a ,贷款期限为 n 个月,求每月的还款金额为r.二、实验分析我们用等比级数求解:第一月末贷款的本息之和为(1)0(1)p p a r =+-,第二月末贷款的本息之和为:2(2)(1)(1)0(1)(1)p p a r p a r a r =+-=+-+-,第三月末贷款的本息之和为32(3)(2)(1)0(1)(1)(1)p p a r p a r a r a r =+-=+-+-+-, 第n 月末贷款的本息之和为1()(1)(1)0(1)[(1)...(1)1]n n p n p n a r p a r a a -=-+-=+-+++++, 考虑第n 个月还清贷款,则p(n)=0,求得0*(1)/[(1)1]n n r p a a a =++-.假设银行贷款20万,月利率0.465%,借款期限为10年,即为120个月,问每月应还金额和10年内共计支付多少利息。
三、实验程序n=120;p0=2e+6;a=0.00465;r=p0*a*(1+a)^n/((1+a)^n-1) %每月还款金额interest=r*n-p0 %10年内应支付的利息四、实验结果r =2.1785e+004, 即每个月还款2178.5元。
interest =6.1415e+005,即10应支付的利息为61415元。