Local electrochemical impedance measurements on
电池测试之电化学阻抗谱的详细资料简介
电池测试之电化学阻抗谱的详细资料简介许多研究电池的小伙伴,在最开始接触交流阻抗相关知识时,可能会非常排斥。
因为无论是巴德的《电化学原理与应用》还是曹楚南、张鉴清的《电化学阻抗谱导论》,书中都是通过严谨公式推导来讲述的。
今天,我们将尽量的避开公式,尽可能的分析交流阻抗谱尤其是其在锂电池中的应用。
电化学阻抗谱是一种相对来说比较新的电化学测量技术,它的发展历史不长,但是发展很迅速,目前已经越来越多地应用于电池、燃料电池以及腐蚀与防护等电化学领域。
电化学阻抗谱(Electrochemical Impedance Spectroscopy,EIS)即给电化学系统施加一个频率不同的小振幅的交流正弦电势波,测量交流电势与电流信号的比值(系统的阻抗)随正弦波频率ω的变化,或者是阻抗的相位角f随ω的变化。
可以更直观的从这个示意图来看,利用波形发生器,产生一个小幅正弦电势信号,通过恒电位仪,施加到电化学系统上,将输出的电流/电势信号,经过转换,再利用锁相放大器或频谱分析仪,输出阻抗及其模量或相位角。
通过改变正弦波的频率,可获得一些列不同频率下的阻抗、阻抗的模量和相位角,作图即得电化学阻抗谱-这种方法就称为电化学阻抗谱法。
由于扰动电信号是交流信号,所以电化学阻抗谱也叫做交流阻抗谱。
利用EIS可以分析电极过程动力学、双电层和扩散等,可以研究电极材料、固体电解质、导电高分子以及腐蚀防护机理等。
基本思路——将电化学系统看成等效电路利用电化学阻抗谱研究一个电化学系统时,它的基本思路是将电化学系统看作是一个等效电路,这个等效电路是由电阻(R)、电容(C)、电感(L)等基本元件按串联或并联等不同方式组合而成。
通过EIS,可以定量的测定这些元件的大小,利用这些元件的电化学含义,来分析电化学系统的结构和电极过程的性质。
我们可以将内部结构未知的电化学系统当作一个黑箱,给黑箱输入一个扰动函数(激励函数),黑箱就会输出一个响应信号。
用来描述扰动与响应之间关系的函数,称为传输函数。
氧化还原反应中的电极电势测量

氧化还原反应中的电极电势测量氧化还原反应是化学中重要的基本反应之一,也被广泛应用于电化学领域。
在氧化还原反应中,电极电势是一个重要的物理量,用来描述反应的进行程度和倾向性。
本文将介绍氧化还原反应中的电极电势测量方法和相关原理。
前言氧化还原反应是一类化学反应,涉及原子或分子的电子转移,其中一个物质发生氧化,即失去电子,而另一个物质发生还原,即获得电子。
电极电势是描述电化学反应进行方向和倾向的物理量,在氧化还原反应中起到关键作用。
一、标准氢电极标准氢电极(简称SHE)是电化学测量中常用的参考电极之一。
它的电极电势被定义为零,作为其他电极的参照。
标准氢电极由氢气(1 atm)在酸性溶液中的反应与铂电极构成。
通过测量与标准氢电极之间的电势差,可以确定其他电极的电势。
二、麦克斯韦电池麦克斯韦电池是另一种常见的参考电池。
它由两个半电池构成,其中一个半电池是标准氢电极,另一个是特定反应的电极。
麦克斯韦电池可以根据反应的自发性来确定一个物质的电势。
三、电动势的计算公式在氧化还原反应中,电极电势可以通过计算得出。
电动势(Ecell)可以使用以下公式计算:Ecell = Ecathode - Eanode其中,Ecathode是还原反应(半电池)的电极电势,Eanode是氧化反应(半电池)的电极电势。
根据电动势的正负,可以判断反应的进行方向和强弱。
四、电极电势测量方法1. 直接测量法直接测量法是最常见的电极电势测量方法之一。
它通过将待测电极与参比电极连接,使用电压表或电位计测量两电极之间的电势差。
可根据电动势公式计算待测电极的电势。
2. 分析法分析法是另一种电极电势测量的方法。
它基于庞特定律(Potentiometric method)。
在庞特定律中,电势与溶液中物质的活性有关。
通过测量待测电极与参比电极之间的电势差,可以推算出溶液中特定物质的活性系数及浓度。
五、电极电势的应用电极电势测量在化学、生物、环境等多个领域有重要应用。
Electrochemical_Impedance_Spectroscopy_Intro电化学阻抗谱
Electrochemical Impedance Spectroscopy Electrochemical Impedance Spectroscopy (EIS) is an electrochemical technique with applications in corrosion, battery development, fuel cell development, paint characterization, sensor development, and physical electrochemistry. The reason for this popularity is the high information content of EIS. EIS provides a more thorough understanding of an electrochemical system than any other electrochemical technique.Why is EIS so powerful?Because the EIS experiment involves the application of a sinusoidal electrochemical perturbation (potential or current) to the sample that covers a wide range of frequencies.This multi-frequency excitation allows(1) the measurement of several electrochemical reactions that take place at very different rates and(2) the measurement of the capacitance of the electrode.AC ImpedanceA typical experiment sweeps from 10 kHz to 0.01 Hz with a 10 mV perturbation around the rest potential. The usual result is an Nyquist impedance plot of half a semi-circle: the high frequency part giving the solution resistance and the width of the semi-circle giving the corrosion rate in the same manner as LPR. The analysis of this data is performed by circle fitting in the analysis software. One useful benefit of AC is the ability to measure the solution resistance at high frequency. This allows any instrument that incorporates AC to perform automatic IR compensation during DC tests.At each frequency a sine wave is generated and fed into the potentiostat. This wave is then imposed on the cell and its potential and current flow measured. The measured values of current and voltage are compared for amplitude and phase and an impedance calculated. This is repeated for the rest of the frequencies and a plot generated. The standard starting point with AC impedance is the basic Randles circuit below.An alternate name for AC impedance is Electrochemical Impedance Spectroscopy (EIS)./tech/applicationnotes.shtml ConcreteSteel encased in intact concrete with no chloride carbonation stray currents or cracks should experience a pH of 12.5 and passivate remaining good for centuries. In practice problems do occur and finding the problem deep under the surface is no easy task. Some of the problems faced include; very high resistivity difficult connection to the reinforcing bar and the geometry of the test. Often the auxiliary and reference sit on the surface of the concrete with multiple strands of rebar some distance beneath. Knowing the extent of polarization is often a matter of experience. The simplest electrochemical test is potential mapping this gives an idea of corrosion activity but does not give corrosion rate data. More sophisticated tests use the Field Machine to determine corrosion rate from LPR IR compensated LPR and AC Impedance. Variants of the Field Machine have been supplied incorporating a guard ring to focus the measurement on a better defined area of rebar.A test has been devised to measure chloride uptake in the laboratory. It consists of three bars mounted one above the other two in concrete and connected by a ZRA. A bath of 3% NaCl is mounted on the top and when the chloride permeates through the top bar becomes and anode with respect to the bottom two as Cathode.This test block can also be used to measure IR compensated LPR and AC Impedance by applying a test frequency from 10000 Hz to 1 mHz mechanistic information of the corrosion processes can be obtained by studying the time constants revealed..Linear Polarization Noise for Corrosion Monitoring in Multiple PhaseEnvironments.Linear Polarization Resistance Noise gives two results: the average monitored corrosion rate and the corrosivity of the conductive fluid. It works in situations where other more established techniques have technical difficulties and especially in every location where Current & Voltage Noise is used to calculate corrosion rate.In many cases the Corrosivity of the Conductive Fluid is the most valuable result. For instance in a pipeline where there is a possibility of separation and localized pooling the corrosivity of the conductive fluid can be of greater value when calculating the injection rate for inhibitors.Multiple Phase Systems are typically any which interrupt the conductivity between the test electrodes used to obtain the measurement. Examples are electrodes situated in a splash zone or multiple phase flow involving mixtures of saline water gas and oil. Traditional techniques such as Current and Voltage Noise Linear Polarization Resistance and Electrical Resistance all have limitations when operating in these environments. These are briefly noted below. Linear Polarization Resistance is generally upset in multiple phase environments leading to erratic spiky results if the conductivity between the electrodes changes significantly throughout a test. The situation is worse in three electrode systems where a feedback loop through the cell is used to control the Cell Potential. Current & Voltage Noise.Often thought of as the solution to all monitoring problems the technique simply employs a two electrode Potentiostat that polarizes the electrodes at 0mV with respect to each other. A third electrode is then used to monitor Potential fluctuations. Unfortunately during periods of low conductivity large Potential Perturbations do not correspond to significant current activity due to high solution resistance. This is a fundamental error in the technique which leads to corrosion rates that are lower than expected.Electrical Resistance.This gives a reading of the metal loss on the metals surface. Trends in the data can then be used to calculate the historic corrosion rate. The technique is limited however in that it only gives the average historic corrosion rate at the probe and does not attempt to give the corrosivity of the conductive elements in the multiple phase medium.Linear Polarization Noise.This combines the practical nature of Linear Polarization Resistance with thesubtlety of Noise. The technique works with two electrode probes of a standard design and is resistant to any changes in the medium surrounding the electrodes as like Current Noise no feedback mechanism operates through the test fluid. Two results are obtained from the technique the Average Monitored Corrosion Rate and the Corrosivity of the Conductive Fluid. Data trends are presented in real time in mpy or mmpy.As with Current and Voltage Noise the technique has further possibilities with regards to monitoring of localized corrosion as well. Knowledge of the system under test is paramount.The technique is available as an option for operation with the portable Field Machine or desk top models such as our Gill AC. Models suitable for in-situ monitoring on site can also be supplied on request./Linear Polarization ResistanceThe LPR technique is the most frequently used being both quick and easy. A small sweep from typically -10 mV to +10 mV at 10 mV/min around the rest potential is performed. The resulting current/voltage plot usually exhibits a straight line the inverse slope of which is proportional to the corrosion rate. The Gill AC Gill 8 and 12 the Field Machine the Pocket Machine the LPR meter and the Bubble Test software all use this method.The step method is used in hand held instruments for example the pocket machine. The current is measured at points A and B once the initial current surge has steadied. The voltage sweep results in a response shown above a best fit straight line gives the charge transfer resistance. A variant of the LPR test is the pitting index. This is a measure of the asymmetry between anodic and cathodic current response a feature built into to the portable LPR meter where it is available as a switched option between corrosion rate and pitting index. The LPR method is ideal for plant monitoring offering an almost instantaneous indication of corrosion rate allowing for quick evaluation of remedial action and minimizing unscheduled downtime. As an example and guide to allow the new operator to obtain a feeling for the numbers involved the table below gives a qualitative classification of corrosion rates of carbon steel in a water cooling system.To convert a corrosion current in mA/cm2 to a corrosion rate in mm/year multiply the current by 12.The sources of error in LPR tests include uncertainty in the parameter B used in the Stern and Geary equation where icorr = B/Rp B = (ba.bc)/(2.3(ba+bc)) choice of a scan rate that is too fast neglect of the solution resistance and non linearity. In practice a value of 20 mV usually works well for B a scan rate of 0.2 mV/sec is often adequate the solution resistance can be compensated by positive feedback and the non-linearity error is only a small percentage of the result. Linear polarization resistance can be done either three or two electrodes. The two electrode method relies on both electrodes been similar so that when they are coupled and offset the test is still in the linear region. This matching of electrodes is not needed when using the three electrode method as the potentiostat measures the rest potential and offsets the test around that.。
电化学阻抗谱与数据处理与解析

G 0, k 1,2,...,m Ck
可以写成一个由m个线性代数方程所组成的 方程组
从方程组可以解出 1 , 2 , .... , m 的值,将其代 入下式,即可求得Ck 的估算值:
Ck = C0k + k, k = 1, 2, …, m,
计算得到的参数估计值Ck比C0k 更接近于真值。 在这种情况下可以用由上式 求出的Ck作为新的初 始值C0k,重复上面的计算,求出新的Ck 估算值 这样的拟合过程就称为是“均匀收敛”的拟合过 程。
按规则(1)将这一等效电路表示为: R CE-1 按规则(2),CE-1可以表示为(Q CE-2)。因此 整个电路可进一步表示为: R(Q CE-2) 将复合元件CE-2表示成(Q(W CE-3))。整个等效 电路就表示成: R(Q(W CE-3)) 剩下的就是将简单的复合元件 CE-3 表示出来。 应表示为(RC)。于是电路可以用如下的 CDC 表示: R(Q(W(RC)))
电化学阻抗谱方法是一种以小振幅的 正弦波电位(或电流)为扰动信号的电化 学测量方法。由于以小振幅的电信号对体 系扰动,一方面可避免对体系产生大的影 响,另一方面也使得扰动与体系的响应之 间近似呈线性关系,这就使测量结果的数 学处理变得简单。
同时,电化学阻抗谱方法又是一种频 率域的测量方法,它以测量得到的频率范 围很宽的阻抗谱来研究电极系统,因而能 比其他常规的电化学方法得到更多的动力 学信息及电极界面结构的信息。
0 0 G G( X, C1 , C0 , C 2 m ) + 1 m
G Ck C k
S (gi - G i ) (gi - G i 1
2 0 1 1
n
n
m
G Ck ) 2 Ck
如何用电化学手段评价性能

锂离子电池中的EIS应用
与经典电化学体系中电化学反应都是发生 在电极/电解液界面上的电子传递反应不同, 锂离子在嵌合物电极中的脱出和嵌入过程 是一种特殊的电化学反应,通常称为电化 学嵌入反应。该反应进行时,在电极/电解 液界面上发生的不是电子的传递,而是离 子的迁越,同时,在电化学嵌入反应过程 中,离子嵌入电极内部,使电极的组成和 性质逐渐改变。EIS能够根据电化学嵌入反 应每一步弛豫时间常数的不同,在较宽频 率范围内表征电化学嵌入反应的每一步。
锂离子电池电性能研究
[1] 古宁宇, 钱新明, 赵峰, 董绍俊, 分析化学, 30 (2002) 1-5.
左图为实验中EIS测试图谱的应 用举例。从图中可以看出,样 品的阻抗谱图主要由一个高中 频区的半圆和一条低频区的直 线构成。[1]高中频区的半圆主 要是由电解液和正极材料之间 的化学反应引起的,主要包括 材料颗粒表面形成的SEI膜的迁 移电阻,颗粒之间的接触电阻 等;低频区的直线主要是由 Warburg阻抗引起的,为离子 的扩散电阻。
• 基于CV曲线的电容器容量计算,可以根据下列公式计算:
• 对于一个电容器来说,在一定的扫速下做CV测试。充电 状态下,通过电容器的电流i是一个恒定的正值,而放电状 态下的电流则为一个恒定的负值。这样,在CV图上就表 现为一个理想的矩形。由于界面可能会发生氧化还原反应, 实际电容器的CV图总是会略微偏离矩形。因此,CV曲线 的形状可以反映所制备材料的电容性能。对双电层电容器, CV曲线越接近矩形,说明电容性能越理想;而对于赝电 容型电容器,从循环伏安了哪些氧化还原反应。
[4] E. Frackowiak, V. Khomenko, K. Jurewicz, K. Lota, F. Beguin, J Power Sources, 153 (2006) 413418.
电化学阻抗谱中ohms和ohm cm2转换
电化学阻抗谱中ohms和ohm cm2转换1. 介绍电化学阻抗谱电化学阻抗谱(Electrochemical Impedance Spectroscopy,EIS)是一种用于研究电化学反应动力学和界面特性的分析技术。
通过测量电化学系统对交流电信号的阻抗响应,可以揭示电化学界面的特性,包括电化学反应速率、电化学界面的电荷转移和质传过程等信息。
2. EIS中的阻抗单位:ohms和ohm cm2在电化学阻抗谱中,阻抗通常以ohms(Ω)为单位。
而在某些情况下,我们也会遇到以ohm cm2(Ω cm2)为单位的阻抗。
两者之间的转换关系是非常重要的,因为在不同的研究领域和实验中可能会涉及到不同的阻抗单位。
3. Ohms和ohm cm2的转换关系在电化学阻抗谱中,阻抗的单位通常是以ohms(Ω)表示的。
当需要将ohms转换为ohm cm2时,需要考虑到电化学系统的几何形状和实际电极尺寸。
在电化学研究中,通常会用到标准电极表面积来表示电化学反应发生的实际表面大小,标准电极表面积的单位通常是cm2。
要将ohms转换为ohm cm2,可以使用以下公式:R (ohm cm2) = R (ohm s) × A其中,R代表阻抗,A代表标准电极表面积。
通过这个公式,可以将ohms转换为ohm cm2,以更准确地表示电化学系统的阻抗特性。
4. 实际案例分析举例来说,如果一个电化学系统的阻抗为1000 ohms,而标准电极表面积为0.1 cm2,那么将其转换为ohm cm2的计算如下:R (ohm cm2) = 1000 ohms × 0.1 cm2 = 100 ohm cm2通过这个简单的例子,可以清楚地看到ohms和ohm cm2之间的转换关系,以及在实际应用中的重要性。
5. 结语在电化学研究中,对于阻抗谱中的ohms和ohm cm2的转换,需要考虑到电化学系统的结构和实际表面积,并使用适当的转换公式进行计算。
eis弥散效应
EIS(Electrochemical Impedance Spectroscopy)是一种电化学技术,用于研究电化学系 统中的界面和电荷传递过程。EIS可以通过测量系统的阻抗来获取关于电化学界面的信息。
EIS弥散效应是指在电化学系统中,由于电解质溶液的扩散和传导限制,导致电流在界面上的 分布不均匀。这种不均匀分布会导致电化学反应速率的非均匀性,从而影响系统的阻抗响应。
总之,EIS弥散效应是电化学系统中由于电解质溶液的扩散和传导限制导致的电流分布 不均匀现象。了解和减小EIS弥散效应对于准确研究电化学界面的特性和电荷传递过程非常 重要。
EIS弥散效应通常表现为在低频区域出现的斜率较大的阻抗谱。这是由于在低频下,电流的扩 散传导过程对电荷传递过程起主导作用。当电流在界面上扩散布不均匀。这种不均匀分布会导致界面上的反应速率差异,从而产生 较大的阻抗响应。
eis弥散效应
为了减小EIS弥散效应对实验结果的影响,可以采取一些措施,如增加搅拌速度、使用 更高浓度的电解质溶液、改变电极材料等。这些措施可以提高电解质溶液中离子的扩散速 率,减小电流的分布不均匀性,从而减小EIS弥散效应的影响。
电化学阻抗法计算极片迂曲度
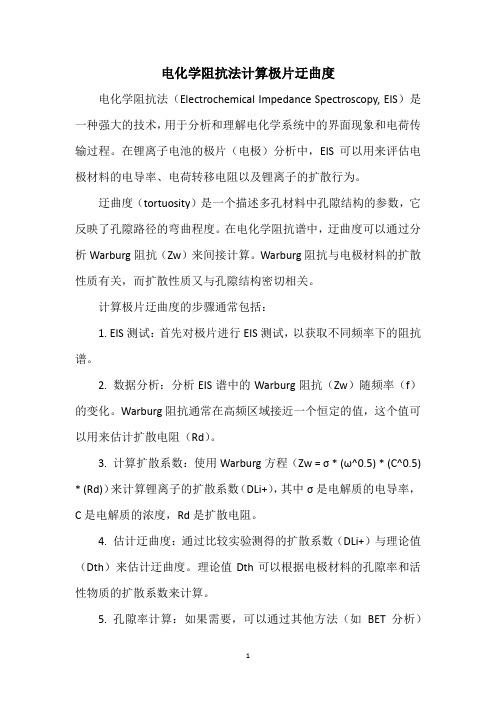
电化学阻抗法计算极片迂曲度电化学阻抗法(Electrochemical Impedance Spectroscopy, EIS)是一种强大的技术,用于分析和理解电化学系统中的界面现象和电荷传输过程。
在锂离子电池的极片(电极)分析中,EIS可以用来评估电极材料的电导率、电荷转移电阻以及锂离子的扩散行为。
迂曲度(tortuosity)是一个描述多孔材料中孔隙结构的参数,它反映了孔隙路径的弯曲程度。
在电化学阻抗谱中,迂曲度可以通过分析Warburg阻抗(Zw)来间接计算。
Warburg阻抗与电极材料的扩散性质有关,而扩散性质又与孔隙结构密切相关。
计算极片迂曲度的步骤通常包括:1. EIS测试:首先对极片进行EIS测试,以获取不同频率下的阻抗谱。
2. 数据分析:分析EIS谱中的Warburg阻抗(Zw)随频率(f)的变化。
Warburg阻抗通常在高频区域接近一个恒定的值,这个值可以用来估计扩散电阻(Rd)。
3. 计算扩散系数:使用Warburg方程(Zw = σ * (ω^0.5) * (C^0.5) * (Rd))来计算锂离子的扩散系数(DLi+),其中σ是电解质的电导率,C是电解质的浓度,Rd是扩散电阻。
4. 估计迂曲度:通过比较实验测得的扩散系数(DLi+)与理论值(Dth)来估计迂曲度。
理论值Dth可以根据电极材料的孔隙率和活性物质的扩散系数来计算。
5. 孔隙率计算:如果需要,可以通过其他方法(如BET 分析)来测量电极材料的孔隙率。
6. Bruggeman关系式:使用Bruggeman关系式来估算迂曲度,该式通常用于描述多孔材料的电导率与孔隙率之间的关系。
需要注意的是,通过EIS计算迂曲度是一个相对复杂的过程,需要专业的电化学阻抗谱分析软件和适当的实验数据。
此外,EIS提供的是关于整个电极系统的信息,而不是单个颗粒或孔隙的信息,因此计算得到的迂曲度是一个宏观的参数,它反映了电极整体的结构特性。
电化学阻抗谱及其数据处理与解析-张鉴清
• 总的说来,电化学阻抗谱的线性条件只 能被近似地满足。我们把近似地符合线 性条件时扰动信号振幅的取值范围叫做 线性范围。每个电极过程的线性范围是 不同的,它与电极过程的控制参量有关。 如:对于一个简单的只有电荷转移过程 的电极反应而言,其线性范围的大小与 电极反应的塔菲尔常数有关,塔菲尔常 数越大,其线性范围越宽。
按规则(1)将这一等效电路表示为: R CE-1 按规则(2), CE-1 可以表示为( Q CE-2 )。因 此整个电路可进一步表示为: R(Q CE-2) 将复合元件CE-2表示成(Q(W CE-3))。整个等效电 路就表示成: R(Q(W CE-3)) 剩下的就是将简单的复合元件 CE-3 表示出来。应 表示为( RC )。于是电路可以用如下的 CDC 表示: R(Q(W(RC)))
G( ) = G’( ) + j G”( )
阻抗或导纳的复平面图
• 复合元件(RC)频响特征的阻抗复平面图
导纳平面图
Байду номын сангаас
阻抗波特(Bode)图
复合元件(RC)阻抗波特图
两个时间常数等效电路A
两个时间常数等效电路B
阻抗的复平面图
阻抗波特(Bode)图
电化学阻抗谱的基本条件
• 因果性条件:当用一个正弦波的电位信号对电极 系统进行扰动,因果性条件要求电极系统只对 该电位信号进行响应。 • 线性条件。当一个状态变量的变化足够小,才 能将电极过程速度的变化与该状态变量的关系 作线性近似处理。 • 稳定性条件。对电极系统的扰动停止后,电极 系统能回复到原先的状态,往往与电极系统的 内部结构亦即电极过程的动力学特征有关。
从阻纳数据求等效电路的数据处理方法
电路描述码 我们对电学元件、等效元件,已经用符号 RC、RL或RQ表示了R与C、L或Q串联组 成的复合元件,用符号 (RC) 、(RL) 或 (RQ)表示了R与C、L或Q并联组成的复合 元件。现在将这种表示方法推广成为描述 整个复杂等效电路的方法, 即形成电路 描述码 (Circuit Description Code, 简写为 CDC)。规则如下:
锂电池电化学阻抗谱
锂电池电化学阻抗谱(Electrochemical Impedance Spectroscopy,简称锂电池电化学阻抗谱(Electrochemical Impedance Spectroscopy,简称EIS)是一种用于研究锂离子电池等电化学系统内部反应过程的实验技术。
它通过测量电池在不同频率下的电压响应和电流响应,得到一个复数阻抗谱图,从而分析电池的内部结构、电荷传输过程以及电极/电解质界面的性质。
锂电池电化学阻抗谱的主要组成部分包括:
1. 高频区(Warburg区域):在高频范围内,阻抗谱呈现出一个斜率较小的直线,这是由于锂离子在电极表面的扩散过程引起的。
这个区域的斜率与电极/电解质界面的扩散系数成正比,因此可以通过测量斜率来了解锂离子在电极表面的扩散速率。
2. 中频区(中间区域):在中频范围内,阻抗谱呈现出一个半圆弧状的曲线,这是由于锂离子在电极内部的扩散和表面反应过程共同作用的结果。
这个区域的半径与锂离子在电极内部的扩散系数和表面反应速率有关,因此可以通过测量半径来了解锂离子在电极内部的扩散和表面反应特性。
3. 低频区(低频区域):在低频范围内,阻抗谱呈现出一个斜率较大的直线,这是由于锂离子在电解质中的扩散过程引起的。
这个区域的斜率与电解质的离子传导性能有关,因此可以通过测量斜率来了解电解质的离子传导性能。
通过对锂电池电化学阻抗谱的分析,可以了解电池的内部结构、电荷传输过程以及电极/电解质界面的性质,从而为电池的设计、优化和故障诊断提供重要信息。
关于超级电容器电极材料性能测试常用的三种电化学手段
循环伏安cyclic voltammetry (CV)由CV曲线,可以直观的知道大致一下三个方面的信息• Voltage window(水系电解液的电位窗口大致在1V左右,有机电解液的电位窗口会在2.5V 左右)关于很多虫虫问,电位窗口应该从具体的哪个电位到哪个电位,这个应该和你的参比电极和测试体系有关。
工作站所测试的电位都应该是相对于参比电极的,所以不要纠结于为什么别人的是0-1V,而你测试的是-0.5-0.5V,这个与参比电极的本身电位(相对于氢标的电位)以及测试的体系本身有很大关系。
•Speci fic capacitance (比电容,这个是超级电容器重要的参数之一,可以利用三种测试手段来计算,我一般都是利用恒电流充放电曲线来计算)•Cycle life (超级电容器电极材料好坏的另一个比较重要的参数,因为一个很棒的电极材料应该是要做到既要有比较高的比电容又要有比较好的循环稳定性)测试的时候比较重要的测试参数:扫描速度和电位扫描范围。
电位的扫描范围,一般会在一个比较宽的范围扫描一次然后选择电容性能还比较好的区间再进行线性扫描,扫描速度会影响比电容,相同的电极材料相同测试体系扫速越大计算出的比电容会越小。
恒电流充放电galvanostatic charge–discharge (GCD)由GCD测试曲线,一般可以得到以下几方面的信息:•the change of specific capacitance(比电容的变化可以从有限多次的恒电流充放电中体现,直观的就是每次充放电曲线的放电时间的变化)•degree of reversibility(由充放电曲线的对称也可以中看出电极材料充放电的可逆性) •Cycle life(循环寿命,换句话也就是随着充放电次数的增多,电极材料比电容的保持率)恒电流充放电测试过程中比较重要的测试参数有电流密度,还有充放电反转的电位值。
电流密度可以设置为电流/电极面积,也可以设置为电流/活性物质质量。
电化学阻抗法
电化学阻抗法
第一节电化学阻抗概念
1、电化学阻抗(Electrochemical Impedance,简称EIS)是一种光电测量技术,是测量电化学反应过程中发生的电位变化及其相关电位波动的一种测量方法。
由于电位变化是相变过程中变化的,因此它需要在相变的特定过程中进行测量,并以此来研究其反应特性,从而更快获得结果。
2、电化学阻抗是一种获取电化学反应过程中物理和化学信息的可靠方法,通俗来说,它是在电化学反应过程中,测量每个阶段的电阻抗,以获取反应过程的物理和化学变化。
它可以更容易、更可靠地提取电化学反应过程的数据,并可以显著改善传统实验方法的精度。
3、电化学阻抗的另一个重要特点是它可以解决传统实验方法无法解决的问题,例如:获取电化学反应的复杂动力学行为和反应机理的计算等。
可以帮助我们更好地理解电化学反应的机制,从而分析出最佳的操作参数,为研究者提供更好的质量管理系统。
第二节电化学阻抗方法优缺点
1、优点:
(1)电化学阻抗测量技术简单灵活,可以实现自动化测量,并可以测量各种形式的反应,提供全面、精确的实验测量结果;
(2)技术可以精确描述各种形式的电化学反应,包括复杂的电化学反应过程;
(3)可以更加精确地确定反应机制,从而使研究者对电化学反
应的机制有更深入的了解,并可以有效地确定操作参数;
(4)所得数据可以更好地传输、存储,从而可以更加直观地再现电化学反应的完整过程。
2、缺点:
(1)电化学阻抗测量技术所需的仪器比较复杂,相关软件也比较昂贵;
(2)由于仪器技术发展比较慢,普通的仪器无法满足复杂反应的测量要求;
(3)实验数据获取和分析过程繁琐,需要耗费大量的时间和精力。
电化学阻抗测量技术与阻抗谱的数据处理

电化学阻抗谱的数据处理与解析
1. 数据处理的目的与途径 2. 阻纳数据的非线性最小二乘法拟合原理 3. 从阻纳数据求等效电路的数据处理方法 (Equivcrt) 4. 依据已知等效电路模型的数据处理方法 (Impcoat) 5. 依据数学模型的数据处理方法 (Impd)
数据处理的目的
1.根据测量得到的EIS谱图, 确定EIS的等效 电路或数学模型,与其他的电化学方法相结 合,推测电极系统中包含的动力学过程及其 机理; 2.如果已经建立了一个合理的数学模型或等 效电路,那么就要确定数学模型中有关参数 或等效电路中有关元件的参数值,从而估算 有关过程的动力学参数或有关体系的物理参 数
• 对于复杂的电路,首先将整个电路分解 成2个或2个以上互相串联或互相并联 的“盒”,每个盒必须具有可以作为输 入和输出端的两个端点。这些盒可以是 等效元件、简单的复合元件(即由等效 元件简单串联或并联组成的复合元件)、 或是既有串联又有并联的复杂电路。对 于后者,可以称之为复杂的复合元件。 如果是简单的复合元件,就按规则(1) 或(2)表示。于是把每个盒,不论其 为等效元件、简单的复合元件还是复杂 的复合元件,都看作是一个元件,按各 盒之间是串联或是并联,用规则(1) 或(2)表示。然后用同样的方法来分 解复杂的复合元件,逐步分解下去,直 至将复杂的复合元件的组成都表示出来 为止。
现在用C1,C2,…,Cm表示这m个参量的估计值, 将它们代入到式 (8.2.1) 中,就可以计算出相应于 Xi的Gi 的数值。gi - Gi 表示测量值与计算值之 间的差值。在C 1,C 2 ,…,C m 为最佳估计值时, 测量值与估计值之差的平方和S的数值应该最小。 S 就称为目标函数: S =Σ (gi - Gi )2 由统计分析的原理可知,这样求得的估计值C1, C2,…,Cm为无偏估计值。求各参量最佳估计值 的过程就是拟合过程
电化学阻抗谱英文
电化学阻抗谱英文
电化学阻抗谱是一种非常常见的电化学技术,常用于研究电化学反应的动力学、电化学介质的性质以及材料的表面性质等。
电化学阻抗谱可以通过测量电极在交流电场中的阻抗来获得,其中阻抗是指电极对交流电场的反应程度。
电化学阻抗谱的英文为Electrochemical Impedance Spectroscopy,简称EIS。
EIS是一种广泛应用于材料科学、化学、电化学、生物医学工程等领域的工具,它能够提供有关电化学体系的详细信息,包括电极-电解质界面、液-液界面、膜、涂层和复合材料等的电学和动力学特性。
电化学阻抗谱通常以Nyquist图和Bode图来表示,其中Nyquist 图用于表示电阻和电容的分布,Bode图用于表示频率响应曲线。
这些图形可以帮助研究者快速分析电化学体系的特性,并且可以获得关于电子传输、离子传输和质量传输的定量信息。
总之,电化学阻抗谱是一种非常重要的电化学技术,能够帮助研究者深入了解电化学体系的动力学和电学性质,并且有助于发现新的材料和装置。
- 1 -。
eis电荷转移电阻和扩散电阻
eis电荷转移电阻和扩散电阻
EIS (Electrochemical Impedance Spectroscopy)是一种电化学技术,用于研究电化学过程中的交流电阻(small-signal impedance)。
在EIS中,电化学系统被置于一个小幅度的正弦电势下,其产生的小幅度响应被记录下来。
这些响应被用来计算不同频率下的电化学阻抗。
在电解液中,电流的传输机制包括电荷传输和物质扩散。
两种机制都可以在电化学阻抗谱中表现出来。
具体来说,电荷转移电阻和扩散电阻是电化学阻抗谱中最常见的两种阻抗成分。
电荷转移电阻(resistance to charge transfer)是指由于电子或离子移动的限制而导致的电流流动的阻力。
这种电阻通常由电极表面上的电化学反应引起,如氧化还原反应。
电荷转移电阻会产生一个行为类似于电阻的直线段,并且可以通过在高频段中拟合这个直线段来确定电极表面上反应的反应速率。
当反应速率较慢时,电荷转移电阻就会是瓶颈,限制反应的速率。
扩散电阻(diffusion resistance)是指电解液中离子扩散的阻碍作用。
这种电阻通常由离子在电解液中的迁移距离和物种浓度的限制引起。
在电化学阻抗谱中,扩散电阻表现为一个行为类似于电容的半圆形。
通过半圆的位置和形状,可以得到不同种类离子的扩散系数,并计算出反应的速率。
总结:EIS技术可以用来研究电化学体系中电荷转移和扩散的机制和速率,并通
过电化学阻抗谱中的不同成分得到这些参数的值。
电荷转移电阻和扩散电阻是EIS分析中最常见的两种阻抗成分,能够为电化学过程提供重要的信息。
eis阻抗谱扩散过程乱点
eis阻抗谱扩散过程乱点
EIS(Electrochemical Impedance Spectroscopy)阻抗谱是一种用于研究电化学系统的技术,通过测量电化学系统的阻抗来分析其性质
和行为。
在 EIS 测试中,有时会出现扩散过程乱点的情况,这可能是
由于以下原因导致的:
1. 电极表面不均匀:电极表面的不均匀性可能导致电流分布不均匀,从而导致扩散过程乱点。
这可能是由于电极表面的污染、腐蚀或
其他表面缺陷引起的。
2. 溶液中的杂质:溶液中的杂质可能会干扰扩散过程,导致乱点
的出现。
这些杂质可能来自于实验设备、试剂或其他来源。
3. 实验条件不稳定:实验条件的不稳定性,如温度、搅拌速度或
溶液浓度的变化,也可能导致扩散过程乱点的出现。
4. 数据采集和处理问题:数据采集和处理过程中的问题,如噪声、干扰或数据处理算法的不准确性,也可能导致扩散过程乱点的出现。
为了减少扩散过程乱点的出现,可以采取以下措施:
1. 电极预处理:在实验前,对电极进行预处理,如抛光、清洗或
其他表面处理,以确保电极表面的均匀性。
2. 溶液净化:使用纯净的试剂和实验设备,以减少溶液中的杂质。
3. 控制实验条件:保持实验条件的稳定性,如温度、搅拌速度或
溶液浓度等。
4. 数据处理:采用合适的数据处理算法,如平滑、滤波或其他数据处理方法,以减少噪声和干扰的影响。
通过采取这些措施,可以减少EIS 测试中扩散过程乱点的出现,提高测试结果的准确性和可靠性。
离子交换膜扩散边界层厚度的测试方法比较
离子交换膜扩散边界层厚度的测试方法比较张文娟;马军;王执伟;刘惠玲【摘要】电化学阻抗谱和线性扫描伏安法均可用来测定离子交换膜扩散边界层的厚度.本文比较了两种方法测定的扩散边界层厚度大小,并考察了不同流速和温度对阳离子交换膜和阴离子交换膜扩散边界层厚度的影响.研究发现:线性扫描伏安法的测试结果高于电化学阻抗谱法的结果,这与前者测试过程中施加电压过高使界面层发生破坏有关;随着流速的增大,电化学阻抗谱测定的扩散边界层厚度显著降低,而线性扫描伏安法的测定值基本不变,前者的测定值更接近实际值;阳离子交换膜和阴离子交换膜的扩散边界层厚度不同,且受温度的影响程度不同.研究结果对于优化离子交换膜的电化学评价技术具有重要意义.%Electrochemical impedance spectroscopy (EIS) and Linear sweep voltammetry (LSV) can be used to measure the thickness of diffusion boundary layers (DBL) in ion exchange membranes.The DBL thickness from these two methods was compared and the effects of flow rate and temperature on the DBL thickness of two ion exchange membranes were investigated.It is found that the DBL thickness measured from LSV was higher than that from EIS,which was due to the higher voltage imposed to the membrane leading to the destruction of membrane interface;when the flow rate increased,the DBL thickness decreased for EIS measurements while did not change significantly for LSV measurements,which indicated that the data from EIS was close to the real value;the DBL thickness was different for anion exchange membrane and cation exchange membrane,and the effect of temperature on them was also different.Research results are of major importance for optimization ofcharacterization techniques on membrane transport properties of ion exchange membranes.【期刊名称】《膜科学与技术》【年(卷),期】2017(037)002【总页数】7页(P12-18)【关键词】离子交换膜;线性扫描伏安法;电化学阻抗谱;扩散边界层厚度【作者】张文娟;马军;王执伟;刘惠玲【作者单位】哈尔滨工业大学市政环境工程学院城市水资源与环境国家重点实验室,哈尔滨150090;哈尔滨工业大学市政环境工程学院城市水资源与环境国家重点实验室,哈尔滨150090;哈尔滨工业大学市政环境工程学院城市水资源与环境国家重点实验室,哈尔滨150090;哈尔滨工业大学市政环境工程学院城市水资源与环境国家重点实验室,哈尔滨150090【正文语种】中文【中图分类】TQ15离子交换膜已被广泛应用到电渗析、反向电渗析和燃料电池等领域中[1-6].近年来,为研究离子交换膜体系中复杂的传输现象,膜的电化学性质和传质机理越来越受到关注.在阳离子交换膜中含有带负电的固定电荷基团,而在阴离子交换膜中则含有带正电的固定电荷基团[7].当一个离子交换膜放置在电解质溶液中并施加一个电流或电压时,膜内电流的导通主要是通过反离子的传输(唐南排斥作用,Donnanexclusion),而溶液中则通过正、负离子的定向移动,由于膜内反离子的迁移数与溶液中不同,所以溶液和膜表面会形成浓差极化现象.Park[8]证明,离子交换膜体系中包括3个子层:膜本身,双电层和扩散边界层,其中,双电层和扩散边界层构成了离子交换膜的界面层,该层可显著降低体系导电性[9-10].离子交换膜体系的界面特性受膜的物理特性(离子交换容量、表面粗糙度等)和实验条件(电解质浓度、流速、温度等)的影响.实验条件对扩散边界层电阻的影响在很多文献中都有报道[8, 11-13],而关于扩散边界层厚度随实验条件变化的报道则较少.电化学阻抗谱(electrochemical impedance spectroscopy, EIS)在早期的电化学资料中被称为交流阻抗(alternative current impedance, AC impedance),最初应用于研究线性电路网络的频率响应特性,后来引用到电极的研究过程中,成为表征电化学性质的一种方法.现在EIS方法也应用于材料表面特性、电化学反应速率、材料的介电特性和传输性能的研究[14],以及评价复合膜[15]、离子交换膜[8]、双极膜的结构等[16]方面.EIS实验中,在一对电极(一个工作电极和一个对电极)两侧施加一个小振幅的正弦交流电流或电压作为扰动信号,然后通过这两个电极或参比电极测试体系的响应信号.EIS数据的处理(又被称为EIS数据的解析)通常是利用等效电路对数据进行非线性最小二乘法拟合,此方法是最直接有效的解析体系电化学信息的方法[17].在解析离子交换膜的阻抗数据时,膜表面的电容通常被忽略,但是电容值对于表征离子交换膜的表面形态和扩散边界层的厚度是必不可少的.我们在之前的研究中报道了通过电容值和电阻值推导扩散边界层厚度的计算公式[18].本文利用常用的扩散边界层厚度测试方法——线性扫描伏安法(Linear sweep voltammetry, LSV)和EIS分别研究了离子交换膜的扩散边界层厚度随温度和流速的变化,并对两种方法获得的数据进行比较.1 材料与方法1.1 实验材料和药品本文主要研究了两种均相离子交换膜:AEM-Type I阴离子交换膜和CEM-Type I 阳离子交换膜(Fujifilm Manufacturing Europe B.V.Fujifilm,荷兰),其中,阳离子交换膜中的固定电荷基团为磺酸根[18],阴离子交换膜中的固定电荷基团为季铵根,两种膜的基本参数如表1所示.其中,膜的厚度为湿膜状态下的值,Zeta电位的测试溶液为1 mmol/L KCl溶液.膜样品的活化步骤如下:在0.5 mol/L氯化钠溶液中浸泡24 h,期间更换4次溶液,以去除膜内残留的化学溶剂.实验中所用药品为氯化钠(科密欧,天津,优级纯)和硫酸钠(科密欧,天津,优级纯).实验中,氯化钠和硫酸钠溶液的浓度均为0.5 mol/L,配置溶液所用的溶剂均为超纯水(电阻率18 MΩ·cm).表1 实验测定的离子交换膜的基本性质[18]Table 1 The list of ion exchange membrane properties determined by experiments[18]离子交换膜厚度/μm离子交换容量/(meq·g-1)溶胀度/%固定电荷密度/(mol·L-1)Zeta电位/mVAEM-TypeI118±21.41±0.141.4±1.03.4±0.165.6±2.0CEM-TypeI132±11.50±0.0166.0±2.92.3±0.1-80.9±1.91.2 实验装置瑞士万通(Metrohm)公司的电化学工作站(PARSTAT302N)用于EIS和LSV测试.测试装置为实验室自制的4电极体系测试装置(如图1所示):EIS测试装置中所用工作电极和对电极是2个圆片形的Ag/AgCl电极(可减少电极上水分子分解反应的发生),直径为10 mm;LSV装置中所用工作电极和对电极是2个Pt电极,形状和尺寸与EIS测试装置中的Ag/AgCl电极相同;参比电极是2个放置在鲁金毛细管中的Ag/AgCl电极,主要用于测试膜两侧的电势差和阻抗.4电极测试方法可降低电极-溶液界面的阻抗影响[19-20].两种测试方法的测试槽示意图如图2所示,图中的CEM和AEM分别为CEM-Type I和AEM-Type I.1.工作电极;2.参比电极;3.离子交换膜;4.电化学工作站;5.计算机图1 实验装置示意图Fig.1 Schematic view of the experimental setup1.氯化钠溶液(0.5 mol/L);2.硫酸钠溶液(0.5 mol/L);3.待测离子交换膜;4.工作电极和对电极;5.参比电极6.电化学工作站图2 EIS(a)和LSV(b)测试槽示意图Fig.2 Schematic diagrams of the test cells for EIS (a) and LSV (b)1.3 EIS中的扩散边界层厚度的计算公式EIS的测试频率为1 000~0.01 Hz,交流电压的振幅为0.1 V,每次测试取50个点.测试开始前的开路电势(OCP, open circuit potential)设置为装置的初始电势. 在EIS等效电路中,扩散边界层通常表示为一个电阻器(Rd)和电容器(Cd)相并联,如图3所示,其厚度δ的计算公式是:(1)式中,Rd和Cd分别是扩散边界层的电阻值和电容值,并分别表示扩散边界层的导电能力和储存电荷的能力;D为溶液的扩散系数.扩散边界层的电阻值(Rd)和电容值(Cd)可从电化学阻抗谱拟合数据中得出.因此,其厚度可以从方程(1)中计算出来. Rd:扩散边界层的电阻; Cd:扩散边界层的电容图3 电化学阻抗谱中扩散边界层的等效电路示意图Fig.3 Equivalent circuit used to represent the EIS spectra of diffusion boundary layer (DBL)1.4 LSV中的扩散边界层厚度的计算公式LSV的测试电压为0~1.4 V,扫速为0.01 V/s.扩散边界层的厚度通常由线性扫描伏安法中的极限电流密度计算得到,其厚度δ′计算公式如下:(2)式中,Ilim为极限电流密度(A/m2),z为反离子价态,F为法拉第常数(96 485.33 C/mol),Cs为电解质溶液浓度,tm和ts分别是反离子在膜内和溶液中的迁移数(溶液中tNa+=0.369,tCl-=0.631).膜内的离子迁移数tm通过计时电位滴定测试方法进行测定[21],所用装置与图2(b)中的装置相同,其操作方法为:在测试槽两侧施加一个超过极限电流密度值的电流强度(A/m2),测试膜两侧的过渡时间(τ, s),然后通过Sand方程计算有效离子迁移数,计算公式如下:(3)实验中分别选择了4个不同的电流值(均高于极限电流密度),持续时间为50 s或达到电化学工作站的最大槽压10 V时为止.2 结果与讨论2.1 EIS测试结果研究对象的电化学信息可通过将EIS实验数据利用等效电路进行拟合得到,本文所用的等效电路与文献[18]中相同.图4为离子交换膜CEM-Type I在0.5 mol/L NaCl溶液中不同流速下的Nyquist图,温度为(20±2) ℃.Nyqui st图中曲线与实轴(x轴)在高频处的交点(1 000 Hz)对应着膜和溶液的电阻之和(Rm+s),该值基本上与溶液的流速无关,而曲线与实轴在低频处的交点对应于该体系的总电阻(Rm+s+Redl+Rd),从图中可以看出该值随着流速的增大明显降低.低频下的圆弧对应的是扩散边界层,从图中可以看出,随着流速的增大,圆弧的半径逐渐减小,说明扩散边界层的电阻和电容逐渐减小.图4 膜CEM-Type I在不同流速下的Nyquist图Fig.4 Nyquist plot of CEM-Type II with different flow rate图5为离子交换膜CEM-Type I在0.5 mol/L NaCl溶液中不同温度下的Nyquist 图,其流速为1 cm/s.从图中可以看出,随着温度的升高,曲线与实轴(x轴)在高频处的交点(1 000 Hz),即膜和溶液的电阻之和显著降低,且代表扩散边界层的圆弧半径减小(可通过圆弧顶点的纵坐标比较).图5 膜CEM-Type I在不同温度下的Nyquist图Fig.5 Nyquist plot of CEM-Type II with different temperature2.2 LSV测试结果极限电流密度可以通过LSV曲线中两条直线的交点求出.图6和7分别为膜CEM-Type I在不同流速和不同温度下的LSV曲线.从图6中可以看出,电流-电压曲线随流速的变化不明显,达到极限电流后,继续增加膜两侧的电压,曲线呈现波动的趋势,该现象与溶液的对流现象有关[22].从图7中可以看出,随着温度的升高,极限电流密度逐渐增大.LSV曲线中,当低于极限电流时,膜电流与施加电压成正比——随施加电压的增大而增大,电流-电压曲线的斜率为膜电阻的倒数(1/R).从图6中可以看出,低于极限电流时,电流-电压曲线的斜率随流速基本不变,说明流速对膜电阻的影响不大.而图7中,电流-电压曲线的斜率随温度的增大而增大,说明膜电阻随温度增大而减小.图6 膜CEM-Type I在不同流速下的电流-电压图Fig.6 Current-voltage plot of CEM-Type II with different flow rate图7 膜CEM-Type I在不同温度下的电流-电压图Fig.7 Current-voltage plot of CEM-Type II with different temperature2.3 流速对扩散边界层厚度的影响本节研究了流速对AEM-Type I和CEM-Type I两种离子交换膜扩散层厚度的影响,流速分别为1、2、3、4 cm/s,EIS和LSV的计算结果如图8所示.从图中可以看出,两种方法测出的扩散边界层厚度均在几十~几百μm范围,与Choi[23],Amatore[24]及Shaposhnik[25]等的结论一致,而且阴离子交换膜AEM-Type I的扩散层厚度高于阳离子交换膜CEM-Type I,这与我们之前的研究结果一致[18].在两个图中,LSV方法测出的厚度均高于EIS方法测出的值,这是由于LSV测试过程中,电流密度达到极限电流密度后,膜内和膜表面界面层的溶液发生对流[26-27],界面层的平衡被打破有关,从而使测试结果不准确.根据文献报道[18,23,26-28],扩散边界层的厚度在几百μm级别时,会受到溶液流速的影响,且研究结果表明,扩散边界层的电阻随流速的增大而降低,如图8中EIS的测试结果所示,其厚度随流速的增大而显著降低,而图中LSV方法测定的厚度值基本上不随流速而变化,因此可以判定EIS方法推算出的扩散边界层厚度更接近实际值.2.4 温度对扩散边界层厚度的影响本节研究了温度对两种离子交换膜扩散边界层厚度的影响,温度分别为10、20、30和40 ℃,实验结果如图9所示.从图中可以看出,随着温度的升高,两种方法测定的扩散边界层厚度均显著降低,这可能是由于溶液中的离子迁移速率随温度的升高而增大,使固定电荷基团和溶液中离子之间静电作用力的屏蔽效应增强.同时,温度升高使膜材料本身的溶胀度等物理性质发生变化及Donnan作用的降低也可能是导致扩散边界层厚度降低的原因.从图中还可以看出,AEM-Type I的扩散边界层厚度受温度的影响比CEM-Type I更明显,这是由溶液中阴、阳离子的迁移速率的不同导致的(υCl-/υNa+ ≈ 1.5).3 结论本文对电化学阻抗谱和线性扫描伏安法两种测定离子交换膜扩散边界层厚度的方法进行了比较研究,并分别考察了不同流速和温度对阴离子交换膜和阳离子交换膜扩散边界层厚度的影响,得到如下结论:图8 流速对(a)AEM-Type I和(b)CEM-Type I扩散边界层厚度的影响Fig.8 The effect of flow rate on diffusion boundary layer thickness of (a) AEM-Type I and (b) CEM-Type I图9 温度对(a)AEM-Type I和(b)CEM-Type I扩散边界层厚度的影响Fig.9 The effect of temperature on diffusion boundary layer thickness of (a) AEM-Type I and (b) CEM-Type I1) LSV测定的扩散边界层厚度高于EIS的测试结果,这与LSV测试过程中施加电压过高,破坏了膜表面界面层有关.LSV方法计算扩散边界层厚度还需要测试膜内离子的迁移数,测试和计算过程更复杂.2) EIS的测试结果表明,扩散边界层厚度随流速的增大而显著降低,而LSV方法测定的厚度值基本上不随流速而变化,与以往研究结果中扩散边界层电阻随流速增大而降低的结果不符,因此可以判定EIS方法推算出的扩散边界层厚度更接近实际值.3) AEM-Type I的扩散边界层厚度高于CEM-Type I,且AEM-Type I的扩散边界层厚度受温度的影响比CEM-Type I更明显,这是由溶液中阴、阳离子的迁移速率的不同导致的(υCl-/υNa+≈1.5).参考文献:[1] Sadrzadeh M, Mohammadi T. Sea water desalination using electrodialysis[J]. Desalination, 2008, 221(1): 440-447.[2] Strathmann H. Electrodialysis, a mature technology with a multitude of new applications[J]. Desalination,2010, 264(3): 268-288.[3] Post J W, Veerman J, Hamelers H V M, et al. Salinity-gradient power: Evaluation of pressure-retarded osmosis and reverse electrodialysis[J].J Membr Sci,2007, 288(1): 218-230.[4] Vermaas D A, Guler E, Saakes M, et al. Theoretical power density from salinity gradients using reverse electrodialysis[J]. Energy Procedia, 2012, 20: 170-184.[5] Vermaas D A, Saakes M, Nijmeijer K. Power generation using profiled membranes in reverse electrodialysis[J].J Membr Sci, 2011, 385(1): 234-242.[6] Kariduraganavar M Y, Nagarale R K, Kittur A A, et al. Ion-exchangemembranes: preparative methods for electrodialysis and fuel cell applications[J]. Desalination, 2006, 197(1): 225-246.[7] Fu R Q, Xu T W, Yang W H, et al. A new derivation and numerical analysis of current-voltage characteristics for an ion-exchange membrane under limiting current density[J]. Desalination, 2005, 173(2): 143-155. [8] Park J S, Choi J H, Woo J J, et al. An electrical impedance spectroscopic (EIS) study on transport characteristics of ion-exchange membrane systems[J].J Colloid Interf Sci,2006, 300(2): 655-662.[9] Islam N, Bulla N, Islam S. Electrical double layer at the peritoneal membrane/electrolyte interface[J].J Membr Sci, 2006, 282(1): 89-95. [10] Sang S, Huang H, Wu Q. An investigation on ion transfer resistance of cation exchange membrane/solution interface[J].Colloid Surf A Physicochem Eng Asp, 2008, 315(1): 98-102.[11] Fontananova E, Zhang W, Nicotera I, et al. Probing membrane and interface properties in concentrated electrolyte solutions[J].J Membr Sci, 2014, 459: 177-189.[12] Dugoecki P, Anet B, Metz S J, et al. Transport limitations in ion exchange membranes at low salt concentrations[J].J Membr Sci, 2010, 346(1): 163-171.[13] Dugoecki P, Ogonowski P, Metz S J, et al. On the resistances of membrane, diffusion boundary layer and double layer in ion exchange membrane transport[J].J Membr Sci, 2010, 349(1): 369-379.[14] Macdonald D D. Reflections on the history of electrochemical impedance spectroscopy[J].Electrochim Acta, 2006, 51(8): 1376-1388.[15] Xu Y, Wang M, Ma Z, et al. Electrochemical impedance spectroscopy analysis of sulfonated polyethersulfone nanofiltration membrane[J]. Desalination,2011, 271(1): 29-33.[16] Chilcott T C, Coster H G L,George E P. A novel method for the characterisation of the double fixed charge (bipolar) membrane using impedance spectroscopy[J].J Membr Sci, 1995, 108(1): 185-197.[17] Nikonenko V V, Kozmai A E. Electrical equivalent circuit of an ion-exchange membrane system[J].Electrochim Acta, 2011,56(3): 1262-1269.[18] Zhang W, Ma J, Wang P, et al. Investigations on the interfacial capacitance and the diffusion boundary layer thickness of ion exchange membrane using electrochemical impedance spectroscopy[J].J Membr Sci, 2016, 502: 37-47.[19] Coster H G L, Chilcott T C, Coster A C F. Impedance spectroscopy of interfaces, membranes and ultrastructures[J].Bioelectroch Bioener, 1996, 40(2): 79-98.[20] 张东方,潘牧,罗志平,等.四电极质子补偿法测量质子交换膜的电导率[J].电池工业, 2003, 8(1):11-14.[21] Pawlowski S, Sistat P, Crespo J G, et al. Mass transfer in reverse electrodialysis: Flow entrance effects and diffusion boundary layer thickness[J].J Membr Sci, 2014, 471: 72-83.[22] Pismenskaia N, Sistat P, Huguet P, et al. Chronopotentiometry applied to the study of ion transfer through anion exchange membranes[J].J Membr Sci,2004, 228(1): 65-76.[23] Choi J H, Park J S, Moon S H. Direct measurement of concentrationdistribution within the boundary layer of an ion-exchange membrane[J].J Colloid Interf Sci, 2002, 251(2): 311-317.[24] Amatore C, Szunerits S, Thouin L, et al. The real meaning of Nernst's steady diffusion layer concept under non-forced hydrodynamic conditions.A simple model based on Levich′s seminal view of convection[J]. J Electroanal Chem, 2001, 500(1): 62-70.[25] Shaposhnik V A, V asil′eva V I, O.V. Grigorchuk. Diffusion boundary layers during electrodialysis[J]. Russian J of Electrochem, 2006, 42(11): 1202-1207.[26] Larchet C, Nouri S, Nikonenko V. Application of chronopotentiometry to study the diffusion layer thickness adjacent to an ion-exchange membrane under natural convection[J]. Desalination, 2006, 200(1): 146-148.[27] Larchet C, Nouri S, Auclair B, et al. Application of chronopotentiometry to determine the thickness of diffusion layer adjacent to an ion-exchange membrane under natural convection[J].Adv Colloid Interface Sci, 2008,139(1): 45-61.[28] Ota M, Izuo S, Nishikawa K, et al. Measurement of concentration boundary layer thickness development during lithium electrodeposition onto a lithium metal cathode in propylene carbonate[J] J Electroanal Chem, 2003, 559: 175-183.。
薄液膜下铝合金与不锈钢电偶腐蚀研究
薄液膜下铝合金与不锈钢电偶腐蚀研究刘艳洁;王振尧;柯伟【摘要】目的研究与不锈钢偶接时铝合金的腐蚀行为与机理.方法依据ASTMG149标准制备电偶试样,在循环盐雾箱中模拟薄液膜下2024铝合金与316L不锈钢之间的电偶腐蚀过程,分别在腐蚀6,12,18,24,30 d后取出试样,进行质量损失分析、截面与点蚀坑形貌分析、以及电化学阻抗谱测试.结果偶接之后2024铝合金的质量损失量是非偶接条件下的将近10倍.偶接后2024铝合金在腐蚀6d后就形成了约20μm厚的腐蚀产物层,且随着腐蚀时间的增加,腐蚀产物层越来越致密,越来越厚.偶接后点蚀坑则主要在横向扩展,在纵深方向扩展较小.结论电偶作用不仅加速了铝合金的腐蚀,还改变了其腐蚀过程,而且这种作用在腐蚀的初期不明显,在腐蚀后期较为显著.【期刊名称】《装备环境工程》【年(卷),期】2015(012)001【总页数】6页(P1-5,24)【关键词】铝合金;不锈钢;电偶腐蚀;形貌分析;电化学阻抗谱【作者】刘艳洁;王振尧;柯伟【作者单位】中国科学院金属研究所,沈阳110016;中国科学院金属研究所,沈阳110016;中国科学院金属研究所,沈阳110016【正文语种】中文【中图分类】TJ011;TG172.3在工业生产中,为了得到所需的性能,异种材料之间的连接非常常见,此时,电偶腐蚀会成为降低材料使用寿命,制约行业发展,甚至造成重大事故的主要因素。
因此,诸多学者对电偶腐蚀进行了详细研究,希望能弄清电偶腐蚀发生的机理,并寻找避免电偶腐蚀发生的方法。
电偶腐蚀的发生是由于不同材料之间存在着电位差,当外界环境适合时,电位较低的材料就会被加速腐蚀。
关于电偶腐蚀的研究目前主要有两个方向,一方面通过实验的方法研究电偶腐蚀的过程及影响因素,主要关注了锌与钢、镁合金与铝合金、镁合金与钢、铝合金与碳纤维复合材料、钢与钛合金等材料间的电偶腐蚀[1—8];另一方面通过有限元等方法对电偶腐蚀过程进行计算机模拟[9—16],希望通过简单的模型计算研究电偶腐蚀的机理,并为工业应用奠定基础。
电化学工作站说明书
电化学工作站说明书篇一:电化学工作站使用说明电化学工作站使用说明使用步骤:1、打开电脑,电化学工作站,(工作站一般需要稳定一段时间,在测试样品)2、电路连接:绿色铁夹接工作电极,红色铁夹接对电极,黄色铁夹接参比电极。
3、打开软件,按工作站右边的“复位”按钮,工作站自动进行连接,如果连接对话框消失,说明连接成功;如果长时间不消失,点击取消,重复过程,直至连接成功。
4、循环伏安测定:点击方法分类中的“线性扫描技术”,双击实验方法中的“循环伏安法”,出现循环伏安法参数设定菜单,初始电位和开关电位设定值一样,电流极性设为“氧化”,如果实验出现电流溢出的现象(图像未出现峰,出现水平线),将灵敏度调高,其他设置随实验方法不同而改变。
例如测MnO2是主要更改的参数设是:灵敏度(1MA),电流极性(氧化),初始电位=开关电位1(0V),开关电位2(1V),扫描速率(2,5,10,20,50mV/S),循环次数(>=10次)。
5、打开“控制”下的“开始实验”,界面右上角出现“剩余时间”6、实验结束,“剩余时间”将消失,将实验结果另存为目标文件,此文件类型为工作站的默认类型,Excell无法打开7、打开目标文件下的实验图形,打开数据处理下的“查看数据”,选择显示曲线(不选第一次循环),确定。
出现数据列表对话框,点击保存,保存类型为Excel。
8、阻抗测定:(1)、开路电位测定:点击方法分类中的“恒电位技术”,双击实验方法中的“开路电位-时间曲线”,出现参数设定菜单,电流极性设为氧化,初始电位设为0,采样间隔时间设为0.5秒,等待时间1秒,测量时间>=15秒,其它参数不变。
测量结束,记下开路电位数值。
(2)点击工具栏中“设置”的“交流阻抗”中的“启动”。
出现交流阻抗界面,点击“测量”中的“阻抗-频率扫描法”,出现参数设定界面:电位为开路电位值(注意:测得的开路电位值与此处的单位不同),最大频率为100000.最小频率为0.01,电流量程为1mA/V,其它参数设置不变。
- 1、下载文档前请自行甄别文档内容的完整性,平台不提供额外的编辑、内容补充、找答案等附加服务。
- 2、"仅部分预览"的文档,不可在线预览部分如存在完整性等问题,可反馈申请退款(可完整预览的文档不适用该条件!)。
- 3、如文档侵犯您的权益,请联系客服反馈,我们会尽快为您处理(人工客服工作时间:9:00-18:30)。
Electrochimica Acta 54(2009)6070–6074Contents lists available at ScienceDirectElectrochimicaActaj o u r n a l h o m e p a g e :w w w.e l s e v i e r.c o m /l o c a t e /e l e c t a c taLocal electrochemical impedance measurements on inclusion-containing stainless steels using microcapillary-based techniquesH.Krawiec a ,∗,V.Vignal b ,J.Banas aa AGH,University of Science and Technology,Department of Foundry,ul.Reymonta 23,30-059Cracow,Poland bICB,UMR 5209CNRS-Universitéde Bourgogne,BP 47870,21078Dijon Cedex,Francea r t i c l e i n f o Article history:Received 31October 2008Received in revised form 29November 2008Accepted 14December 2008Available online 24December 2008Keywords:Local impedance spectroscopy Inclusions Stainless steel Equivalent circuita b s t r a c tMnS inclusions are good precursor sites for pitting corrosion of stainless steel.The objective of this paper was to quantify the passive properties of resulfurized stainless steel after immersion in chloride media.This was done by combining microcapillary techniques with electrochemical impedance spectroscopy and numerical analysis (specific equivalent circuit).It was shown that sulfur species produced in the electrolyte during the dissolution of inclusions react with the native passive film to CrS and FeSO 4.Local electrochemical impedance spectroscopy measurements provided data describing the behaviour of the affected matrix at the microscale.For example,the value of the charge transfer and migration of point defects resistance decreases from 51,700 cm 2,in sites free of any metallurgical heterogeneity down to 12,200 cm 2,in sites containing a high density of inclusions.It was also shown that the integrity of the microcapillary can be altered by the presence of high quantity of sulfur in the electrolyte.Local impedance data allowed the detection of such problems.©2008Elsevier Ltd.All rights reserved.1.IntroductionMnS inclusions are good precursor sites for pitting corrosion of stainless steel [1–3].The first step leading to pit initiation is the dis-solution of MnS inclusions and the adsorption of the sulfur species,released into the solution on the surrounding passive film.Data collected from microcapillary techniques enabled to evaluate some key parameters,such as the potential for MnS dissolution [4–8].On the other hand,sulfur species that appear in the solution were detected using the scanning electrochemical microscope (SECM)with I −/I 3−as a redox mediator [9].Experiments performed,using UV spectrophotometry,confirmed that S 2O 32−ions are formed dur-ing electrochemical dissolution [10,11].Changes in the passive film composition induced by the presence of sulfur in the electrolyte species have then been quantified [12].On the other hand,only a few research groups have attempted to combine microcapillary-based techniques with other techniques.These include scanning vibrating electrode technique [12],elec-tron backscatter diffraction measurements [13]and impedance spectroscopy [14].By combining different techniques it is possible to describe more accurately processes taking place on the speci-men surface.Regarding MnS inclusions,small wires of W,Ag and Pt were placed as second microprobes within an electrochemical∗Corresponding author.Tel.:+48126172763;fax:+48126336348.E-mail address:krawiec@.pl (H.Krawiec).microcell to detect changes in the pH value,sulfide and thiosul-fate concentrations during voltammograms [4].The object of this paper was to combine microcapillary techniques with electrochem-ical impedance spectroscopy to quantify the passive properties of resulfurized stainless steel after immersion in chloride media.2.ExperimentalMeasurements were performed on resulfurized 304L stain-less steel (chemical composition Cr:18.3wt.%,Ni:8.75,Mn:1.7,S:0.17,Si:0.5,N:0.055,C:0.05,P:<0.035and Al:0.02).Spec-imens were mechanically sanded with SiC emery papers down to 4000grit and polished with diamond pastes down to 1m.Between each polishing stage samples were ultrasonically rinsed in ethanol.Local electrochemical impedance data were obtained using the electrochemical microcell technique [15].Glass capillaries with a diameter in the range of 50–250m were used.The microcap-illary tip was covered with a layer of silicon rubber.When the microcapillary was in contact with the specimen surface an elastic deformation of the silicon rubber was ing this method,it was possible to do measurements with extremely small microcapil-laries (diameter less than 10m)[16].The microcell was mounted on a microscope for precise positioning of the microcapillary on the surface.In addition,the wetted area on the specimen was accurately calculated using a specific image analysis procedure.Cal-culation of the current density could be validated by performing0013-4686/$–see front matter ©2008Elsevier Ltd.All rights reserved.doi:10.1016/j.electacta.2008.12.022H.Krawiec et al./Electrochimica Acta 54(2009)6070–60746071measurements with different microcapillary diameters and numer-ical simulation [17].Experiments were carried out using a PGSTAT30AUTOLAB potentiostat/frequency response analyzer.Impedance spectra were determined using ac signals of amplitude 20mV peak to peak within the frequency range of 10kHz to 10mHz.All the potentials were measured vs.Ag/AgCl reference electrode (saturated solution)and a platinum wire counter electrode.Measurements were per-formed after immersion of specimens in 1M NaCl,pH 3(adjusted with HCl),at +150mV vs.Ag/AgCl for 10min.3.Results and discussion3.1.Potentiodynamic and potentiostatic measurementsLocal polarisation curves (1mV s −1)were first obtained on sites of the resulfurized 304L stainless steel containing the pure matrix and the matrix with a MnS inclusion (Fig.1(a)).These experi-ments were carried out using 50m in diameter microcapillaries.MnS inclusion started to dissolve from an applied potential of +150mV vs.Ag/AgCl,leading to the current increase observed in Fig.1(a).Stable pitting was systematically observed during this pro-cess (above 250mV vs.Ag/AgCl).By contrast,a large current plateau was observed in the pure matrix and no pitting potential could be identified.As it was explained in Section 1,dissolution of MnS inclu-sions and pit initiation and propagation have widely been studied in theliterature.Fig.1.(a)Local polarisation curves (1mV s −1)obtained on sites containing the purematrix and the matrix with a single MnS inclusion of resulfurized 304L stainless steel in 1M NaCl,pH 3,at 25◦C.(b)Evolution of the current density vs.time in various sites of pure 304L and resulfurized 304L stainless steels in 1M NaCl,pH 3,at +150mV vs.Ag/AgCl.Fig.2(a)shows that sulfur was only detected in inclusions after polishing.Sulfur species released in the electrolyte,react with the native passive film formed on the surrounding grains.Sulfur species were then detected in the matrix using secondary ion mass spec-trometry (SIMS),as shown in Fig.2(b).Previous works based on XPS analysis [12]have shown that this yields the formation of CrS and FeSO 4on the specimen surface.Such changes affect the elec-trochemical behaviour of stainless steel (both cathodic and anodic reactions).The evolution of the current density vs.time was then monitored at +150mV vs.Ag/AgCl using 250m in diameter microcapillaries.The applied potential corresponds to the onset of MnS dissolution.On the pure 304L sample (no inclusion),the current at the steady state was very low—about 0.25A cm −2.This indicates that the passive film was protective.In the case of sites with a few inclu-sions (resulfurized stainless steel),a small quantity of sulfur species was released in the electrolyte.Fig.2(c)shows an example of such sites.The passive film was not significantly affected and the cur-rent density at the steady state was then found to increase up to values around 0.9A cm −2.When the quantity of sulfur species in the solution was high (sites with numerous inclusions,such as in Fig.2(c)),the chemical composition of the passive film was signifi-cantly changed.High current values were then reached at the steady state (1.5A cm −2,Fig.1(b)).3.2.Simulation fitting procedure for impedance dataThe fitting procedure was performed using the equivalent cir-cuit insert in Fig.3.This circuit takes into account the response of both the material and the microcapillary.The resistance R 1and the capacitance C 1were associated to an additional time constant related to ohmic drop effects induced by the use of the microcap-illary [18].On the other hand,R 2and CPE2were added to model semi-infinite linear diffusion of species in the microcapillary where only the linear distance from the electrode was taken into account.Previous publications,using a finite element approach [17,19],have proved that the diffusive flux of species,depends on the cell geom-etry.The diffusive flux is much higher in the microcapillary than in the classical macrocell.These results justify the use of R 2and CPE2in the low frequency range.Impedance data were fitted to the appropriate equivalent circuit,using the Z-view software package.The first fitting was performed without any constraints.Parameters with a relative error less than 2%were then fixed,and the fitting procedure was re-started.This method was applied until all the relative errors were smaller than 2%.3.3.Impedance measurements on the pure 304L stainless steel at the microscaleImpedance measurements were first carried out on the pure 304L stainless steel,after immersion at +150mV vs.Ag/AgCl for 10min,as shown in Fig.3.Experimental (black line)and numerical (black symbols)diagrams show very good correlation.Numerical values used for each component are reported in Table 1.The power index of CPE2(CPE2-)was systematically around 0.5,confirming that CPE2can be assimilated to the Warburg impedance given by Z W =ω1/2(1−i )=1√2CPE2−T ω1/2(1−i )(1)where is the Warburg coefficient ( s −1/2).Once the fitting procedure was performed,it was possible to plot the response of the material (red diamonds corresponding to R HF −R 3/CPE3).The two numerical diagrams (black circles corre-sponding to the full equivalent circuit and red diamonds related to the material response)were then compared.As the used electrolyte6072H.Krawiec et al./Electrochimica Acta 54(2009)6070–6074Fig.2.Repartition of sulfur species determined from SIMS experiments on various sites (resulfurized stainless steel).(a)After mechanical polishing and (b)after immersion in 1M NaCl,pH 3,for 10min.(c)Optical micrograph of the resulfurized stainless steel surface.is highly conductive,the use of the microcapillary has nearly no influence on impedance measurements in the high frequency range (above 100Hz).In this case,the two diagrams almost overlap and impedance measurements roughly describe the sample behaviour.By contrast,diffusion processes are strongly affected by the pres-ence of the microcapillary below 0.5Hz.Under these conditions,the equivalent circuit has to be used to extract the material response and to avoid misinterpretation of impedance data.3.4.Impedance measurements on the resulfurized 304L stainless steel at the microscaleImpedance measurements were then carried out on sites of the resulfurized stainless steel containing a few inclusions (Fig.4).As it was explained previously,the chemical composition of the passive film was affected (formation of CrS and FeSO 4).The same values of R 1,C 1,R 2and CPE2,as in the absence of inclusions,were obtained (Table 1).This confirms that these parameters only depend on the characteristics of the microcapillary.Note that similar results have been obtained on various passive systems.They include stainless steel [18]and pure aluminum [20]in chloride media.The resistance R 3decreases significantly (16,600 cm 2instead of 51,700 cm 2in the absence of inclusions),as reported in Table 1.It is considered that this parameter includes the contributions of the charge-transfer resistance and the migration of point defectsmediating the growth of the passive film and dissolution of metal through it.Observed decrease in the value of R 3indicates that the protective properties of the passive film decrease with the forma-tion of CrS and FeSO 4.In sites containing numerous inclusions (resulfurized stainless steel),the chemical composition of the passive film was strongly modified.Fig.5shows impedance diagrams obtained in such sites.The resistance R 3again decreases to values of about 12,200 cm 2(Table 1).This value is four times lower than that obtained on sites free of any metallurgical heterogeneity.The values of R HF ,R 1and C 1(related to ohmic drop effects)were unchanged,whereas R 2decreases significantly,as reported in Table 1.In some sites,fitting could not converge because of large errors in the value of R 2.Convergence conditions were fulfilled by removing this element from the equivalent circuit.This indicates that the micro-capillary characteristics evolve during the corrosion test.When the concentration of sulfur is high,one may assume that it is absorbed on the silicon rubber.This process perturbs diffusion mechanisms in the close vicinity of the sample surface and affects the values of R 2and CPE2.Analysis of the chemical composition of the silicon rubber has been performed after corrosion tests to confirm this assumption.In addition,it appears that impedance measurements are a good method to detect any alterations of the microcapillary during corrosion tests that could generate arti-facts.H.Krawiec et al./Electrochimica Acta 54(2009)6070–60746073Table 1Comparison of numerical fitting obtained on various sites in 1M NaCl,pH 3,at +150mV vs.Ag/AgCl for 10min.R HF ( cm 2)R 1( cm 2)C 1(×10−5F cm 2)R 2( cm 2)CPE2-T(×10−5F cm 2),CPE2-R 3( cm 2)CPE3-T(×10−5F cm 2),CPE3-Pure 304L,pure matrix2.550.87 1.7184,4609.21,0.651,6878.71,0.93Resulfurized 304L,matrix +few inclusions2.770.821.93184,500 4.55,0.416,623 5.43,0.90Resulfurized 304L,matrix +numerous inclusions 2.16 1.070.71342,77010.2,0.5915,3838.62,0.90Resulfurized 304L,matrix +numerous inclusions2.21.170.7292.5,0.6612,2137.9,0.93Fig.3.Bode diagrams determined on pure 304L stainless steel (no inclusion)after immersion in 1M NaCl at +150mV for 10min.Both experimental data (line)and numerical plots obtained from equivalent circuits (symbols)are presented.Fig.4.Bode diagrams determined on sites containing the matrix and a few inclu-sions (resulfurized 304L stainless steel)after immersion in 1M NaCl at +150mV for 10min.Both experimental data (line)and numerical plots obtained from equivalent circuits (symbols)are presented.Fig.5.Bode diagrams determined on two different sites containing numerous inclu-sions (resulfurized stainless steel),after immersion in 1M NaCl at +150mV for 10min.Both experimental data (line)and numerical plots obtained from equivalent circuits (symbols).4.ConclusionsThis study shows that local electrochemical impedance spec-troscopy measurements,based on the use of microcapillaries,combined with the proposed numerical analysis,provide data describing the behaviour of metallic alloys at the microscale.As these data do not depend on the microcapillary characteristics,no misinterpretation of the results can be done.This method was applied in case of stainless steel contain-ing MnS inclusions which was considered as a model system.SIMS analysis demonstrated that sulfur species,released in the electrolyte,react with the native passive film formed on the sur-rounding grains.CrS and FeSO 4are then formed,modifying the passive properties of the passive film.This was quantified from impedance measurements.It has been shown that the value of R 3decreases from 51,700 cm 2,in sites free of any metallurgical het-erogeneity to 12,200 cm 2,in sites containing a high density of inclusions.It has also been shown that the integrity of the micro-capillary can be altered by the presence of a high quantity of sulfur in the electrolyte.Although impedance measurements depend on such changes,the values of R 3and CPE3,which are derived from the numerical analysis,and which describe the behaviour of the sample,are not affected by this process.References[1]Z.Szklarska-Smialowska,Corros.NACE 28(1972)388.[2]G.S.Eklund,J.Electrochem.Soc.121(1974)467.[3]G.Wranglen,Corros.Sci.14(1974)331.[4]E.G.Webb,R.C.Alkire,J.Electrochem.Soc.149(2002)B280.6074H.Krawiec et al./Electrochimica Acta54(2009)6070–6074[5]E.G.Webb,R.C.Alkire,J.Electrochem.Soc.149(2002)B272.[6]H.Bohni,T.Suter,A.Schreyer,Electrochim.Acta40(1995)1361.[7]I.Muto,Y.Izumiyama,N.Hara,J.Electrochem.Soc.154(2007)C439.[8]H.Krawiec,V.Vignal,R.Oltra,mun.6(2004)655.[9]C.H.Paik,H.S.White,R.C.Alkire,J.Electrochem.Soc.147(2000)4120.[10]S.E.Lott,R.C.Alkire,J.Electrochem.Soc.136(1989)973.[11]S.E.Lott,R.C.Alkire,J.Electrochem.Soc.136(1989)3256.[12]V.Vignal,H.Krawiec,O.Heintz,R.Oltra,Electrochim.Acta52(2007)4994.[13]K.A.Lill,A.W.Hassel,G.Frommeyer,M.Stratmann,Electrochim.Acta51(2005)978.[14]N.Birbilis,B.N.Padgett,R.G.Buchheit,Electrochim.Acta50(2005)3536.[15]H.Bohni,T.Suter,F.Assi,Surf.Coat.Technol.130(2000)80.[16]H.Krawiec,V.Vignal,Z.Szklarz,J.Solid State Electrochem.doi:10.1007/s10008-008-0638-8.[17]H.Krawiec,V.Vignal,R.Akid,Surf.Interf.Anal.40(2008)315.[18]J.B.Jorcin,H.Krawiec,N.Pebere,V.Vignal,Electrochim.Acta,submitted forpublication.[19]H.Krawiec,V.Vignal,R.Akid,Electrochim.Acta53(2008)5252.[20]A.Perron,H.Krawiec,O.Politano,V.Vignal,Les Ann.Chim./Sci.Mat.33(2008)115–122.。