sharpmap
开源SharpMap实例讲解(二)

1 运行过程
首先打开Simple.aspx,可知此页面有一组单选框和 一个图像按钮,用于显示地图。它的代码在 Simple.aspx.cs中。 打开Simple.aspx.cs,在Page_Load函数中是页面初始 化代码。可知地图生成分两步:
1.1 初始化地图 myMap = MapHelper.InitializeMap(new System.Drawing.Size((int)imgMap.Width.Value,(int)i mgMap.Height.Value)); 我们找到MapHelper.InitializeMap函数,查看代码,地 图的初始化分为四个步骤 (1)创建地图,创建图层 (2)基本的图层显示设置 (3)加入图层到地图 (4)地图放缩比例、背景颜色、中心点设置
2.渲染地图的相关函数
GenerateMap() 掌握并能修改 Map.cs中的GetMap() 了解 Layer.Render了解 几何要素renderer:了解 VectorRenderer的函数分析了解
2.渲染地图的相关函数 VectorRenderer的函数分析
现在我们对渲染地图的全过程已经有了个总体概念和初 步理解,下面来具体看一下 SharpMap.Rendering.VectorRenderer的各个函数: 2.1 DrawLabel public static void DrawLabel(System.Drawing.Graphics g, System.Drawing.PointF LabelPoint, System.Drawing.PointF Offset, System.Drawing.Font font, System.Drawing.Color forecolor, System.Drawing.Brush backcolor, System.Drawing.Pen halo, float rotation, string text, SharpMap.Map map) 2.2 DrawLineString public static void DrawLineString(System.Drawing.Graphics g, Geometries.LineString line, System.Drawing.Pen pen, SharpMap.Map map) 采用DrawPath进行具体绘制。
关于sharpmap的中文编码问题

关于sharpmap的中⽂编码问题关于 sharp map 的⽂章其实很多了这⾥我所有的⽂字都是⾃⼰的⼼得,但是不敢说原创,因为都是取材于前辈们的经验。
我会慢慢的写整个sharp map 的系列包括很多⽹上找不到的技术。
sharp map本⾝是开源的,基于他开发的程序应该也需要开源,但是实际上在中国⼤家都是不分享的。
特别是你问了某些前辈,他们就说给你⼀个思路,实际上真的没有给什么帮助。
我这⾥不是指责那些不分享成果的⼈,毕竟路遥⾃⼰⾛,但是⼀个简单的Demo 也许真的会帮助很多⼈。
好了开始今天的正题:前提:读取shp⽂件(其他格式没有测试)只要是⽤过 sharp map 的朋友都知道在读取数据⽂件的时候,如果是中⽂就会出现乱码。
如果不分析 sharp map的源程序,只看官⽅的demo是不能解决问题的。
这⾥也是官⽅的⼀个疏忽(个⼈认为是)。
因为在我们读取shp⽂件的时候,使⽤了这样的⽅式://Set up a river layeryers.VectorLayer layRivers = new yers.VectorLayer("Rivers");//Set the datasource to a shapefile in the App_data foldernts = new NtsProvider(new SharpMap.Data.Providers.ShapeFile(HttpContext.Current.Server.MapPath(@"~\App_data\rivers.shp"), true));layRivers.DataSource = nts; //Define a blue 1px wide penlayRivers.Style.Line = new Pen(Color.Blue, 1);layRivers.SRID = 4326;这样在⽂件读取的时候就有⼀个问题,没有地⽅有编码相关的信息。
地图引擎是怎么做出来的

支持的数据格式:
PostGreSQL/PostGIS,ESRI Shapefile 支持WMS layers 支持ECW 和 JPEG2000 栅格数据格式
SharpMap介绍
Windows Forms 控件,可以移动和缩放 通过HttpHandler支持程序 点、线、多边形、多点、多线和多多边形等几何类型
由于一张地图有多个图层,所以我们将图层放入一个
列表。
在绘制地图时遍历图层,调用每个图层的Render()方
法,画出一张完整的地图。
对于图层列表,大家马上会想到使用List类,但图层
绘制是需要有顺序的,如在行政图上面叠加地名,需 要先画行政图,再填地名,否则行政图会把地名盖住, 所以在图层的样式(LayerStyle)中放了一个ZOrder属 性,通过它来控制图层顺序。
Control(用户控件),封装了Map类,用于
Geometries名称空间,包括了SharpMap要使用到的各种几何类及其接口类,例如点、线、面等类。
是SharpMap的基础之一,所有几何对象都继承自Geometry这个抽象类,其中定义了几何对象应该具备的 公共操作,例如大小、ID、外接矩阵、几何运算等等。
HttpHandler和Caching类,用于网络环境。
源码结构
SharpMap.Map myMap = new SharpMap.Map(picMap.Size); 这句代码创建了一个新的Map的对象,Map对象包括了中点、大小、缩放比例、图层等字段, Layers集合对象包括了地图的各个图层,可以通过Layers.Add方法增加新的图层,通过 GetLayerByName方法返回某个图层。缩放等方法是通过Center和Zoom属性来控制的。当地图 图层修改和地图渲染后会触发相应的事件。 接着就需要新建不同的Layer对象,设置其属性和数据源以及样式。例如: yers.VectorLayer myLayer = new yers.VectorLayer("My layer"); string ConnStr = "Server=127.0.0.1;Port=5432;UserId=postgres;Password=password;Database=myGisDb;"; //创建图层的数据源 myLayer.DataSource = new SharpMap.Providers.PostGIS(ConnStr, "myTable", the_geom", 32632); 不同的Providers对象,例如PostGIS或者Shape对象负责打开相应的空间数据集,读取数据, 返回部分或者全部的空间对象。 接着就需要设置Layer的样式,例如填充、线形等属性。目前,Style对象只是简单的封装了 System.Drawing.Pen、System.Drawing.Brush、System.Drawing.Bitmap等对象。并增加图层 到Map的Layers集合: yers.Add(myLayer); 我们可以通过设置Map的Center、Zoom、Size等属性来进行Map操作,例如缩放、平移等操作, 例如封装Map对象为一个User Control控件,主要的动作就是操作Map的各个属性。 最后,我们就可以通过GetMap对象返回一个System.Drawing.Image对象,代表目前的地图, 用于显示或输出: System.Drawing.Image imgMap = myMap.GetMap(); //Renders the map
吴焕萍:见证GIS在中央气象台的应用历程
吴焕萍:见证GIS在中央气象台的应用历程GIS(Geographic Information Systems,地理信息系统)是一门近年发展起来的多种学科交叉的信息分析技术,在气象信息化建设中发挥了重要的作用。
通过我五年的一线工作经历,见证了以MESIS应用为主的GIS技术在中央气象台应用与发展的历程,在这里要特别感谢所有关心和帮助过我们的领导和同事,有了他们的支持才使得GIS应用发展一步一步深入,渐入佳境,所经历的那些事儿也自然成了我们开发团队(罗兵、吴焕萍、唐卫、郑卫江、吕终亮、郑金伟)最美好的记忆。
在此谨以此文纪念中央气象台成立六十周年。
艰难起步 GIS利器小试牛刀初显锋芒2005年7月,我从北京大学博士毕业后来了国家气象中心(中央气象台)预报系统开放实验室工作。
按照系统室罗兵主任的总体安排,我被分配到曹姐(曹莉)的开发小组实习,当时她正在负责面雨量预报服务系统开发,技术路线采用了ESRI公司的轻量级GIS组件MapObject,算是专业对口了。
经过三个月左右时间的接触,知道了曹姐是一个细心、认真、负责并具有丰富开发经验的人,也开始渐渐的进入工作状态。
也就在此时,我了解到了中央气象台已经购买了ESRI公司的ARCGIS产品,也了解到农业气象、交通气象方面也有了一些基于桌面(DESKTOP)的初步应用。
在尽力了解、思索GIS能在气象领域发挥什么作用的同时,我也注意到了只有好好地补习一下气象方面的基础知识才可能真正做出一些成果。
于是在配合曹姐工作的同时,利用网络等媒体收集了一些气象资料进行快餐式的恶补。
时间很快到了2005年底,罗主任安排我从事以面向决策气象服务为业务目标的原型系统建设。
结合未来GIS技术的发展方向,我果断决定采用ArcEngine 作为GIS平台进行二次开发。
ArcEngine尽管代表了未来组件式开发方向,但它却只是刚刚推出的新产品,再加上我在博士硕士期间也主要做的底层GIS平台与关键算法研发,对ArcEngine的开发并不太了解,于是在罗主任的支持下,我找来了已经在公司上班的硕士同学朱春华来协助走出第一步(公司往往有些技术是走在最前列的);此时的曹姐已经安排进入MICAPS3.0版本的前期调研工作了,只能从需求上把关,幸好也得到了决策服务中心(现气象服务室)张建忠等同事在需求方面很好的讨论与帮助。
开源SharpMap实例讲解(五)

实例2:做精确的交集判断
做精确的交集判断,通过点击,高亮 选择对象,返回相应的属性。
可以使'ntsDataSource'对象指向一个 矢量图层对象(vectorlayer),点击 并高亮选择对象。可以通过 ImageButton ()或者 PictureBox (Windows.Forms)的点击 事件(Click-Event)来触发的:
开源SharpMap实例讲解 (五)
空间分析 在SharpMap中使用NetTopologySuite
NetTopologySuite
由于目前SharpMap的功能仅包括地图数据的渲染,缺 乏空间分析相应的功能,限制了SharpMap的应用,但 好在还有NetTopologySuite。 NetTopologySuite是著名的JTS Topology Suite的 C#/.net版本,简称NTS,其网址为: /,JTS Topology Suite为一个OpenGIS标准的GIS分析、操作类库。NTS 项目的目的是提供一个基于.net,快速、稳定的GIS 解决方案,以应用于所有.net平台,包括各类嵌入式 设备(.net Compact)。
………
实例2:做精确的交集判断
。。。。。。。 if (ds.Tables.Count > 0) //得到了结果 { //增加点击选择的对象到selection图层 //这样就新增了一个图层,因此渲染该副地图则显示选 中对象 yers.VectorLayer laySelected = new yers.VectorLayer("Selection"); laySelected.DataSource = new GeometryProvider(ds.Tables[0]); laySelected.Style.Fill = new System.Drawing.SolidBrush(System.Drawing.Color. Yellow); yers.Add(laySelected); } //渲染地图 GenerateMap(); }
VS报错和SharpMap使用中出现的常见异常

SharpMap使用中出现的常见异常一,添加layer时,出现未将设置引用到对象的实例,其实是在下面的函数GetShapeLayer 出现了问题,该函数在LayerFactory.CS中public static ILayer GetShapeLayer(string layername,string shapefile){ShapeFile shapeFileData = new ShapeFile(shapefile);//这一句,就出现了layer.Envelope的异常,无法获取其_Envelope范围。
ILayer layer = new V ectorLayer(layername, shapeFileData);//这里导致layer无法被赋值,为null,所以出现没有引用到对象的实例。
return layer;//return new V ectorLayer(layername,shapeFileData);}异常是:Envelope =”layer.Envelop”引发了“System.ArgumentOutOfRangeException”类型的异常解决思路:由于SharpMap的版本问题,要重新生成利用SharpMap要使用最原始的版本:二,加载mapview时常常出现无法进行反序列化加载的问题,如system. colections.generic.List 等,可以在其对应窗体的.RESX中修改,打开它在资源管理器中,选用代码方式打开即可。
在打开的resx中,删除无法加载的部分所对应的代码段,即<value>和</value>之间的数字段,然后再在.designer.CS中删除由该段所加载的一些控件即可。
三,vs报错:错误67 “LC.exe”已退出,代码为-1。
解决方法:vs认为程序中加载了第三方软件,因此只要把Properties下的license.licx删除即可;从解决方案资源管理器中进行移除是最好的四,报错说引用的文件无法复制,正在被另一个文件使用?解决思路:你把这两个项目加入到统一解决方法中试一下,或者将A项目的生成路径改为B 项目的生成路径下,这个样子B可以自动引用最新的dll了。
SharpMap在实现湖南省降水色斑图显示中的应用
if r a in o a in t e e aem a a e sa d d t a es t e e d p e iiain d t o g n r t h r p ehcm a n o m to fs t o g n rt p ly r n aa ly r, h n r a r cp tt aat e eae c o o lt i p t o o
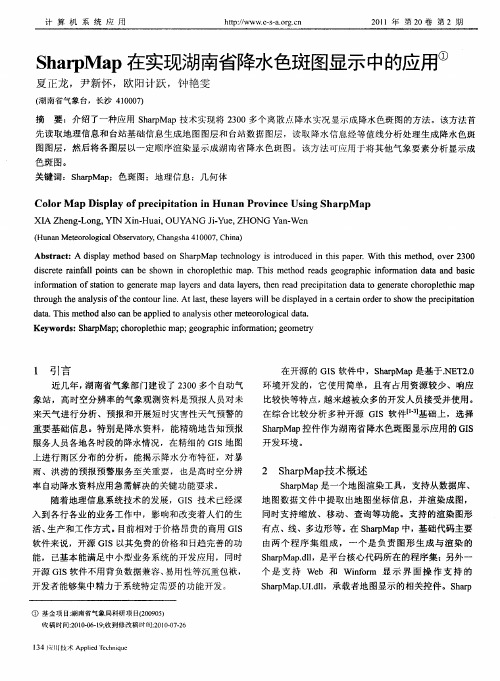
地 理 数 据 封 闭生 成 闭合 等 值 线 集 ,再 通 过 多边 形 几 何 体 生 成 色 斑 图层 ,在 渲 染 显 示 时 通 过 填 充 降水 数 据 值 对 应 的 颜 色 信 息 来 完 成 色 斑 图 图层 显 示 。 降水 色 斑 图 显 示 的流 程 如 图 l 示 。 所
tr u ht ea ay i f h o t u i e At a t te ely r l b ip a e nac rano d rt h w ep e i tt n h o g h n l sso t ec n o rln . s,h s a e swil eds ly d i e ti r e os o t r cpi i l h ao
l ¨ tJ f e … t … I I i >
1 t
a sg j l c p D t n 口 a1 c P5 n j a a ^1 a u it ¨ 【1
I 口 c 儿 P t c f1¨ _】 I u Ii 0{ f |l f) , _
SharpMap开发教程——图层标注
SharpMap开发教程——图层标注在GIS开发中,根据图层属性字段对要素进⾏标注(图层标注)是⼀项常规的、必备的功能。
在基于SharpMap开发GIS应⽤时,也可以⽅便的实现该功能。
1、加载Shapefile图层数据yers.VectorLayer vLayer = new yers.VectorLayer("States");vLayer.DataSource = new SharpMap.Data.Providers.ShapeFile("ShpData\\Provinces_R.shp", true);yers.Add(vLayer);添加图层、设置图层显⽰样式,详细步骤可参考2、添加图层标注与⼀般GIS软件不同,SharpMap的图层标注是以⼀类特殊的图层(LabelLayer)⽽存在的。
belLayer lLayer = new belLayer("labels");lLayer.DataSource = vLayer.DataSource;lLayer.Enabled = true;belColumn = "name";yers.Add(lLayer);创建⼀个标注图层lLayer,然后指定标注图层的数据源,也就是指定对哪⼀个⽮量图层做标注,再指定标注字段即可。
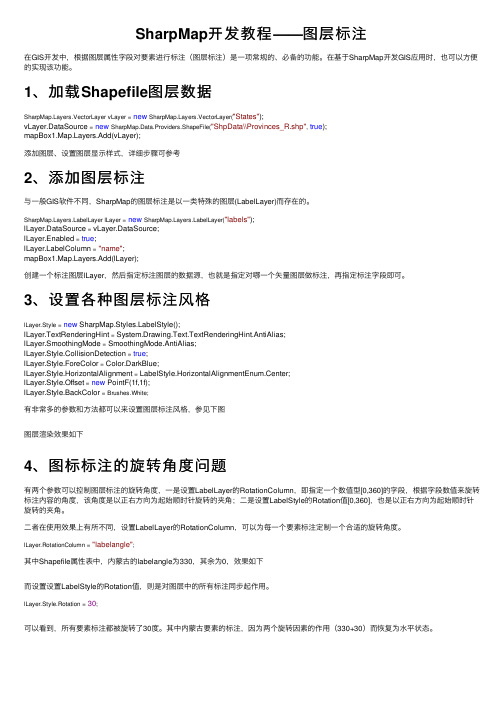
3、设置各种图层标注风格lLayer.Style = new belStyle();lLayer.TextRenderingHint = System.Drawing.Text.TextRenderingHint.AntiAlias;lLayer.SmoothingMode = SmoothingMode.AntiAlias;lLayer.Style.CollisionDetection = true;lLayer.Style.ForeColor = Color.DarkBlue;lLayer.Style.HorizontalAlignment = LabelStyle.HorizontalAlignmentEnum.Center;lLayer.Style.Offset = new PointF(1f,1f);lLayer.Style.BackColor = Brushes.White;有⾮常多的参数和⽅法都可以来设置图层标注风格,参见下图图层渲染效果如下4、图标标注的旋转⾓度问题有两个参数可以控制图层标注的旋转⾓度,⼀是设置LabelLayer的RotationColumn,即指定⼀个数值型[0,360]的字段,根据字段数值来旋转标注内容的⾓度,该⾓度是以正右⽅向为起始顺时针旋转的夹⾓;⼆是设置LabelStyle的Rotation值[0,360],也是以正右⽅向为起始顺时针旋转的夹⾓。
开源SharpMap实例讲解(三)剖析

要素查询
实例一:拉框查询要素属性 实例二:点击查询要素属性 实例三:属性查询
实例一:拉框查询要素属性
代码剖析 1、单击事件中调用代码 2、QueryMapByClick函数 3、ExecuteIntersectionQuery函 数
4
2、QueryMapByClick函数
…………………. //Execute click-query on first layer in layers collection yers.VectorLayer objVLyr = yers["站点"] as yers.VectorLayer; if (!objVLyr.DataSource.IsOpen) objVLyr.DataSource.Open();
2、QueryMapByClick函数
private SharpMap.Data.FeatureDataSet QueryMapByClick(SharpMap.Geometries.Point clickPoint1, SharpMap.Geometries.Point clickPoint2) { SharpMap.Data.FeatureDataSet ds = new SharpMap.Data.FeatureDataSet(); SharpMap.Geometries.BoundingBox objBounds; if (clickPoint1.X != clickPoint2.X) objBounds = new SharpMap.Geometries.BoundingBox(clickPoint1.X, clickPoint1.Y, clickPoint2.X, clickPoint2.Y); else objBounds = new SharpMap.Geometries.BoundingBox(clickPoint1.X - 0.01, clickPoint1.Y - 0.01, clickPoint1.X + 0.01, clickPoint1.Y + 0.01);
开源SharpMap实例讲解(一)

图2简单地图浏览
图3 样式图浏览
图4 分级图浏览
图5 饼图浏览
三、SharpMap源码结构
SharpMap由SharpMap和其他14个次级名 称空间组成,其中SharpMap名称空间下的 Map类为这个系统的核心所在。
三、SharpMap源码结构
二、SharpMap的安装部署及Demo 演示
(1)安装VS .NET 2005 (2)设置IIS 为2.0 这点必须注意,因为默认的IIS 为1.1 做法是打开IIS信息服务管理器,在“默认网站”上 单击右键选择“属性”,弹出如下对话框,在 页设置的版本为2.0.50727; (3)下载SharpMap 到/SharpMap去下载一个 SharpMap,0.9版或者最新版; (4)解压和试运行 解压后可以看到一个demo文件夹,在VS 2005中打 开Simple.aspx,在VS 2005中单击右键,选择“在 浏览器中查看”,则弹出浏览器如下图所示:
Map类,位于SharpMap命名空间下,通过创建Map对象 的实例来生成地图。Map对象由包含Layer对象组成Layer 集合,通过GetMap方法来Render地图。 Converts名称空间,提供数据转换服务。
Forms名称空间,包含MapImage控件,一个简单的User Control(用户控件),封装了Map类,用于Windows Form编程。
开源SharpMap实例讲解 (一)
总体介绍
主要内容
SharpMap简介 SharpMap的安装部署及Demo演 示 SharpMap源码结构 SharpMap运行机制 数据源
一、SharpMap简介
SharpMap加载栅格图件
SharpMap对地图数据的读取和编辑使用了Data.Provider命名空间。
SharpMap自身提供了Shapefile文件的读写,并通过扩展支持PostGIS、MsSqlServerSpatial、OracleSpatial,并通过OGR可以支持其他绝对大多数的GIS数据格式,对于栅格数据的支持也由于OGAL而变得非常强大。
(虽然如此,目前由于SharpMap还不够完善和稳定,支持的格式很有限)。
下面给出一些例子来说明SharpMap是如何加载不同的地图数据的。
1、加载Shapefile文件public void LoadShapefile(){//为图层设置数据源string sDataFile = bine(DATAPATH, "countries.shp");SharpMap.Data.Providers.ShapeFile.ShapeFileProvider oShapeFile = new SharpMap.Data.Providers.ShapeFile.ShapeFileProvider(sDataFile);yers.ILayer oLayer = new GeometryLayer("country", oShapeFile);//设置图层样式SharpMap.Styles.VectorStyle oStyle = new SharpMap.Styles.VectorStyle();oStyle.Fill = new SharpMap.Styles.SolidStyleBrush(SharpMap.Styles.StyleColor.Chocolate);oStyle.Outline.BackgroundBrush = new SharpMap.Styles.SolidStyleBrush(SharpMap.Styles.StyleColor.Blue);oStyle.SelectFill = new SharpMap.Styles.SolidStyleBrush(SharpMap.Styles.StyleColor.White);oStyle.HighlightFill = new SharpMap.Styles.SolidStyleBrush(SharpMap.Styles.StyleColor.White);oStyle.AreFeaturesSelectable = true;oLayer.Style = oStyle;//打开数据源oShapeFile.Open();//重建索引if (!oShapeFile.IsSpatiallyIndexed)oShapeFile.RebuildSpatialIndex();//添加图层到map中_yers.Add(oLayer);this.mapControl.ZoomToExtents();oShapeFile.Close();}2、加载PostGIS空间数据:从PostGIS数据库中读取空间数据,利用了PostgreSqlClient类库,其操作方式和Shapefile 类似string sConn = "Server=127.0.0.1;Port=5432;User Id=postgres;Password=password;Database=PostGIS;";string sTableName = "t_rivers";string sUniqueId = "geoid";PostGis.PostGisProvider oPostGIS = new PostGisProvider(sConn,sTableName,sUniqueId);yers.GeometryLayer oGeometryLayer = newyers.GeometryLayer("postgis", oPostGIS);..... ..... (下面的操作和shapefile一样)3、加载MsSQLServer空间数据:从MsSQLServer数据库中读取空间数据,利用了MsSqlSpatial类库,其操作方式和Shapefile 类似string sConnStr = @"Data Source=.\SQLEXPRESS;AttachDbFilename=|DataDirectory|GeoDatabase.mdf;Integrated Security=True;User Instance=True";SharpMap.Data.Providers.MsSql oMsSql = new SharpMap.Data.Providers.MsSql(ConnStr, "myTable");yers.GeometryLayer oGeometryLayer = new yers.GeometryLayer("postgis", oMsSql );..... ..... (下面的操作和shapefile一样)4、加载OracleSpatial空间数据string sConnStr = "Server=127.0.0.1;Port=5432;User Id=userid;Password=password;Database=myGisDb;";SharpMap.Extensions.Data.Providers.Oracle.OracleSpatialProvider dataSource = new OracleSpatialProvider(sConnStr, "myTable", "GeomColumn", "OidColumn");yers.VectorLayer myLayer = new VectorLayer("My layer", dataSource); ..... ..... (下面的操作和shapefile一样)5、加载MapInfo地图文件:加载mapInfo图层利用了OGR类库yers.VectorLayer vLayerOgr = new yers.VectorLayer("MapInfoLayer"); vLayerOgr.DataSource = new SharpMap.Data.Providers.Ogr(@"D:\GeoData\myWorld.tab"); ..... ..... (下面的操作和shapefile一样)6、加载栅格图片加载栅格图片利用了OGAL类库GdalRasterLayer layGdal = new GdalRasterLayer("Blue Marble", @"C:\data\srtm30plus.tif");yers.Add(layGdal);myMap.ZoomToExtents();。
SharpMap官方教程

How to get SharpMap source codeV0.9/1.0You have two choices:1.Download from CodePlex1.Click on the "Source Code" tab2.Click "Download" in the "Latest Version" frame.3.Accept the license agreement and pick a place to save a zip-file of the currentversion, unpack.4.Open solution and compile.e subversion client (TortoiseSVN)1.Get youself a copy of TortoiseSVN and install.2.Open Explorer, choose place to save your copy of SharpMap, and right-click themouse.3.From the context-menu choose "checkout" and fill in the following url:https:///svn/Trunk *) and maybe change thedestination path. Username and password are the same as on the codeplex site.4.Open solution file and compile.https:///svn/Branches/v1.0Integration of NTS v1.12 (work in progress)V2.0This version is being developed on /p/sharpmapv2.Latest project updates1.Get youself a copy of TortoiseSVN and install.2.Open Explorer, choose place to save your copy of SharpMap, and right-click the mouse.3.From the context-menu choose "checkout", fill in the following url:/svn/trunk **) and maybe change thedestination path. Leave username and password blank.4.Open solution file and compile.**)There are several branches for SharpMapURL Description/svn/branches/initialgdalintegration Gdal-, Ogr- and BrutileProviderLast edited Dec 20 2011 at 6:20 PM by FObermaier, version 10How do I create a map?Initialize the map, add layers, setup style and render it:SharpMap.Map myMap = new SharpMap.Map(new Size(400,300));myMap.Size = new System.Drawing.Size(300,200); //Set output sizemyMap.MinimumZoom = 100; //Minimum zoom allowedmyMap.BackgroundColor = Color.White; //Set backgroundmyMap.Center = new SharpMap.Geometry.Point(725000, 6180000); //Set center of map//Add PostGIS layer:yers.VectorLayer myLayer = new yers.VectorLayer("My layer"); string ConnStr ="Server=127.0.0.1;Port=5432;UserId=postgres;Password=password;Database=myGisDb; ";myLayer.DataSource = new SharpMap.Data.Providers.PostGIS(ConnStr, "myTable", "the_geom", 32632);myLayer.MaxVisible = 40000;yers.Add(myLayer);//Render the map////1st possibility: Set zoom level//myMap.Zoom = 1200; //Set zoom level//2nd. possibility: Zoom to extentsmyMap.ZoomToExtents();System.Drawing.Image imgMap = myMap.GetMap();Note:SharpMap.Data.Providers.Postgis is member of the SharpMap.Extensions project.Last edited Mar 9 2010 at 6:24 AM by FObermaier, version 6Transforming between image coordinates and world coordinates SharpMap has built-in functions to help you transform between image and world coordinates.When the user clicks the map at a given pixel (x,y), you can translate this world coordinates usingthe ImageToWorld method:SharpMap.Geometries.Point p = myMap.ImageToWorld(new System.Drawing.PointF(x, y));Please note that the value is calculated based on the current zoom and center-values of the myMap Map object.If you want to do the opposite transformation, use WorldToImage:System.Drawing.PointF p = myMap.WorldToImage(newSharpMap.Geometries.Point(34.225, 175.432));Last edited Aug 24 2007 at 9:24 AM by rstuven, version 6Creating a clickable mapSystem.Windows.Forms1.Insert a PictureBox for Windows.Forms.2.Set the image to your map-instance. Ex.: imgMap.Image = myMap.GetMap();3.Set up a MouseClick-event for your PictureBox.4.Create a MouseClick-event handler, similar to the one below.protected void imgMap_MouseClick(object sender, MouseClickEventArgs e){//Center the map on the click-pointmyMap.Center = myMap.ImageToWorld(new System.Drawing.PointF(e.X, e.Y), myMap);//Zoom in 2xmyMap.Zoom *= 0.8;//Call function that renders the map and returns it to the clientmyImage.Image = myMap.GetMap();}There are ready-to-use UserControls (MapImage/MapBox) in the SharpMap.UI project. In additionto zooming functionality they offer tools for querying and panning.1.Insert an <asp:ImageButton> for web forms.2.Set the image to your map-instance. Ex.: imgMap.Image = myMap.GetMap();3.Set up a click-event for your ImageButton.4.Create a click-event handler, similar to the one below.protected void imgMap_Click(object sender, ImageClickEventArgs e){//Center the map on the click-pointmyMap.Center = myMap.ImageToWorld(new System.Drawing.PointF(e.X, e.Y), myMap);//Zoom in 2xmyMap.Zoom *= 0.8;//Call function that renders the map and returns it to the clientmyImage.Image = myMap.GetMap();}Note: You need to store the zoom and center values between requests. This can be done usingeither ViewState or Session variables. These should be restored on a postback, and stored whenthey are changed.Last edited Sep 1 2010 at 6:19 PM by FObermaier, version 11How do I add a WMS layer?The WMS Layer support is currently pretty basic. You will have to decipher the server capabilities yourself, and specify the nessesary layers and other properties in the resource property.Here's an example of how to add the Demis WMS server:string wmsUrl = "http://www2.demis.nl/mapserver/request.asp";yers.WmsLayer layWms = new yers.WmsLayer("Demis Map", wmsUrl);layWms.SpatialReferenceSystem = "EPSG:4326"; //Set spatial reference to use for this service//Add layers (browse the RootLayer/ChildLayers collection to find available/valid layer names)layWms.AddLayer("Bathymetry");layWms.AddLayer("Countries");layWms.AddLayer("Rivers");layWms.AddLayer("Ocean features");//Set image format to request from server//See layWms.OutputFormats array for formats supported by this WMSlayWms.SetImageFormat("image/png");//Skip rendering the WMS Map if the server couldn't be requested//If set to false such an event would crash the app.layWms.ContinueOnError = true;layWms.TimeOut = 5000; //Set timeout to 5 secondsyers.Add(layWms); //Add layer to your map's layer collectionYou can get an example of how an image request would look like, by using the GetRequestUrl method. This is also good for debugging the WMS server, since the server often returns an error message on invalid requests.string imageUrl = layWms.GetRequestUrl(new BoundingBox(0,0,360,180), newSize(600,300));Last edited Aug 9 2006 at 5:46 AM by SharpGIS, version 5How do I add a shapefile layer?Use the ShapeFile Provider:yers.VectorLayer layWorld = new yers.VectorLayer("World"); //Specifing true will save the spatial index to a file which will make it load quicker the next timelayWorld.DataSource = new SharpMap.Providers.ShapeFile(@"C:\Data\Countries.shp", true);yers.Add(layWorld);Last edited Aug 4 2006 at 12:55 AM by SharpGIS, version 6How to add a PostGIS datasource to the MapThe PostGIS provider is used for rendering geometry data from an PostGreSQL database. You will need to install the PostGIS extension in PostGreSQL to use it with SharpMap.To get proper performance, make sure you have applied a spatial index to the geometry column.string connStr = "Server=127.0.0.1;Port=5432;UserId=postgres;Password=pass;Database=myMapDB"; //Connectionstringstring tablename = "Roads"; //Name of table in databasestring idColumn = "gid"; //Name of object ID column - MUST be integer!SharpMap.Map myMap = new SharpMap.Map(new System.Drawing.Size(500,250));//Initialize map objectyers.VectorLayer layRoads= new yers.VectorLayer("Roads"); //Create layerlayRoads.DataSource = new SharpMap.Providers.OleDbPoint(connStr, tablename, gid); //Set the datasource to the PostGreSQL tableyers.Add(layRoads); //Add layer to mapmyMap.ZoomToExtents(); //Zoom to extentsImage img = myMap.GetMap(); //Render mapYou can find more help at the PostGIS website on how to load map data into the PostGreSQL database, and how to install PostGIS properly on you database.Note: In earlier versions PostGIS was included in SharpMap, but is now a seperate extension that needs to be added to SharpMap. See PostGISLast edited Aug 4 2006 at 1:16 AM by SharpGIS, version 3This example is derivied from the Add a PostGIS layer example.string tablename = "Roads"; //Name of table in databasestring idColumn = "gid"; //Name of object ID column - MUST be integer!SharpMap.Map myMap = new SharpMap.Map(new System.Drawing.Size(500,250));//Initialize map objectyers.VectorLayer layRoads= new yers.VectorLayer("Roads"); //Create layerlayRoads.DataSource = new SharpMap.Providers.OleDbPoint(connStr, tablename, gid); //Set the datasource to the PostGreSQL table//Set up a road label layerbelLayer layRoadLabel = new belLayer("Road labels");layRoadLabel.DataSource = layRoads.DataSource;layRoadLabel.Enabled = true;belColumn = "RoadOfName";layRoadLabel.Style = new belStyle();layRoadLabel.Style.ForeColor = Color.Black;layRoadLabel.Style.Font = new Font(FontFamily.GenericSerif, 11);layRoadLabel.Style.HorizontalAlignment =belStyle.HorizontalAlignmentEnum.Left;layRoadLabel.Style.VerticalAlignment =belStyle.VerticalAlignmentEnum.Bottom;layRoadLabel.Style.Offset = new PointF(3, 3);layRoadLabel.Style.Halo = new Pen(Color.Yellow, 2);layRoadLabel.TextRenderingHint =System.Drawing.Text.TextRenderingHint.AntiAlias;layRoadLabel.SmoothingMode = SmoothingMode.AntiAlias;layRoadLabel.SRID = 4326;yers.Add(layRoads); //Add layer to mapyers.Add(layRoadLabel); //Add label layer to mapmyMap.ZoomToExtents(); //Zoom to extentsImage img = myMap.GetMap(); //Render mapLast edited Sep 27 2006 at 11:58 PM by Volleyknaller, version 3Rendering X and Y columns from a database as pointsThe OleDbPoint provider is used for rendering point data from an OleDb compatible datasourceThe data source will need to have two double-type columns, xColumn and yColumn that contains the coordinates of the point, and an integer-type column containing a unique identifier for each row.To get good performance, make sure you have applied indexes on ID, xColumn and yColumn in your datasource table.string connStr = "Provider=Microsoft.Jet.OLEDB.4.0;Data Source=database.mdb"; //Connectionstringstring tablename = "pointsTable"; //Name of table in databasestring oid = "ID"; //Name of object ID column - MUST be integer!string xColumn = "X"; //Name of X coordinate column - MUST be double!string yColumn = "Y"; //Name of Y coordinate column - MUST be double!SharpMap.Map myMap = new SharpMap.Map(new System.Drawing.Size(500,250));//Initialize map objectyers.VectorLayer layAddresses = newyers.VectorLayer("Addresses"); //Create layerlayAddresses.DataSource = new SharpMap.Providers.OleDbPoint(connStr, tablename, oid, xColumn, yColumn); //Set the datasource to the databaseyers.Add(layAddresses); //Add layer to mapmyMap.ZoomToExtents(); //Zoom to extentsImage img = myMap.GetMap(); //Render mapLast edited Aug 3 2006 at 8:38 PM by SharpGIS, version 2How do I use the HttpHandler for an application?The HttpHandler is used when caching the rendered map image. To enable the HttpHandler, add the following to your web.config:<configuration xmlns="/.NetConfiguration/v2.0"><system.web><httpHandlers><add verb="*" path="GetMap.aspx"type="SharpMap.Web.HttpHandler,SharpMap"/></httpHandlers></system.web></configuration>To show your map in a webpage, set the ImageUrl of your asp:Image control:string imgID = SharpMap.Web.Caching.InsertIntoCache(5, myMap.GetMap(), Session.SessionID, Context);imgMap.ImageUrl = "getmap.aspx?ID=" + HttpUtility.UrlEncode(imgID);Note:The HttpHandler is using the cache which seem to perform differently on different servers. Often the result is that images are removed from the cache too soon, and thus SharpMap is not able to retrieve it.The recommended approach would be to instead create a dedicated handler that renders the map when requested. This can either be accomplished by embedding nessesary values in the querystring to the handler (ex. getmap.ashx?width=300&height=150¢er=23,34&zoom=450), or to store these values in session-variables and retrieve them prior to rendering the map. This dedicated handler should call the myMap.GetMap() method and stream the generated image directly to the client.Last edited Aug 3 2006 at 11:14 PM by SharpGIS, version 5How do I reference SharpMap?In desktop applications add a reference to SharpMap.dll. For web-applications place SharpMap.dll in the <approot>/bin/ folder.Depending on the providers you intend to use, you may need to add a reference to SharpMap.Extensions.dll.If you want/need to reproject your data, you need to add ProjNet.dll as well.Last edited Mar 14 2010 at 4:41 AM by FObermaier, version 5How do I disable anti aliasing on a layer?Anti aliasing is on by default. To disable it, set the Layer.SmoothingMode property.myLayer.SmoothingMode = System.Drawing.Drawing2D.SmoothingMode.None;Last edited Aug 3 2006 at 12:39 AM by SharpGIS, version 3Applying on-the-fly transformation to a layerSharpMap can project between various projections on-the-fly. All you need to know is the spatial reference system of your input-data to enable you to reproject your maps.Setting up an Universal Transverse Mercator (UTM) projectionSharpMap gives you the full power to specify all the parameters in a projection. The following method demonstrates how to setup a UTM projection:/// <summary>/// Creates a UTM projection for the northern/// hemisphere based on the WGS84 datum /// </summary>/// <param name="utmZone">Utm Zone</param>/// <returns>Projection</returns>private IProjectedCoordinateSystem CreateUtmProjection(int utmZone){CoordinateSystemFactory cFac = newSharpMap.CoordinateSystems.CoordinateSystemFactory();//Create geographic coordinate system based on the WGS84 datumIEllipsoid ellipsoid = cFac.CreateFlattenedSphere("WGS 84", 6378137,298.257223563, LinearUnit.Metre);IHorizontalDatum datum = cFac.CreateHorizontalDatum("WGS_1984", DatumType.HD_Geocentric, ellipsoid, null);IGeographicCoordinateSystem gcs = cFac.CreateGeographicCoordinateSystem("WGS 84", AngularUnit.Degrees, datum,PrimeMeridian.Greenwich, new AxisInfo("Lon", AxisOrientationEnum.East), new AxisInfo("Lat", AxisOrientationEnum.North));//Create UTM projectionCollection<ProjectionParameter> parameters = newCollection<ProjectionParameter>();parameters.Add(new ProjectionParameter("latitude_of_origin", 0));parameters.Add(new ProjectionParameter("central_meridian", -183+6*utmZone)); parameters.Add(new ProjectionParameter("scale_factor", 0.9996));parameters.Add(new ProjectionParameter("false_easting", 500000));parameters.Add(new ProjectionParameter("false_northing", 0.0));IProjection projection = cFac.CreateProjection("Transverse Mercator", "TransverseMercator", parameters);return cFac.CreateProjectedCoordinateSystem("WGS 84 / UTM zone"+utmZone.ToString() +"N", gcs,projection, LinearUnit.Metre, new AxisInfo("East", AxisOrientationEnum.East),new AxisInfo("North", AxisOrientationEnum.North));}Parsing Well-known Text (WKT) projection stringsIf you have a well-known text-representation, you can also create a projection from this. A WKT for an UTM projection might look like this:PROJCS["WGS 84 / UTM zone 32N",GEOGCS"WGS 84",DATUM"WGS1984",SPHEROID"WGS 84",6378137,298.257223563,AUTHORITY"EPSG","7030"]],AUTHORITY["EPSG","6326"]],PRIMEM["Greenwich",0,AUTHORITY"EPSG","8901"],UNIT["degree",0.01745329251994328,AUTHORITY"EPSG","9122"]],AUTHORITY["EPSG","4326"]],PROJECTION["TransverseMercator"],PARAMETER["latitudeoforigin",0],PARAMETER["centralmeridian",9],PARAMETER["scalefactor",0.9996],PARAMETER["falseeasting",500000],PARAMETER["falsenorthing",0],UNIT["metre",1,AUTHORITY"EPSG","9001"]],AUTHORITY["EPSG","32632"]]SharpMap comes with WKT parsers for parsing a WKT to a coordinate system (note: the currentv0.9RC1 has a few bug in its WKT parser, but if you get problems parsing the WKT, use the current source from the repository, where these issues have been resolved)/// <summary>/// Create coordinatesystem based on a Well-Known text/// </summary>/// <param name="wkt"></param>/// <returns></returns>private ICoordinateSystem CreateCoordinateSystemFromWKT(string wkt){CoordinateSystemFactory cFac = new CoordinateSystemFactory();return cFac.CreateFromWkt(strProj);}If your data is based on shapefile data and they have a .prj file defining the coordinatesystem, you can simply retrieve the CS from the shapefile instead. SharpMap automatically reads and parses the PRJ file.((yers[0] as VectorLayer).DataSource as ShapeFile).CoordinateSystem Transform from one coordinate system to anotherThe next step is to create a transformation between two coordinate systems. SharpMap v0.9RC1 only supports transforming between a geographic coordinate system and one of the following projections (this has changed after the RC1 release):Mercator 1-standard parallel (Mercator_1SP)Mercator 2-standard parallels (Mercator_2SP)Transverse mercator (Transverse_Mercator)Lambert Conic Conformal 2-standard parallel (Lambert Conic Conformal (2SP))AlbersUnfortunately datum-shifts and transformations between two projections are also post RC1, so to utilize this feature you will need the newest source and compile.The following shows how to create a transformation and apply it to a vectorlayer (only vector- and label-layers supports on-the-fly transformations)://Create zone UTM 32N projectionIProjectedCoordinateSystem utmProj = CreateUtmProjection(32);//Create geographic coordinate system (lets just reuse the CS from the projection) IGeographicCoordinateSystem geoCS = utmProj.GeographicCoordinateSystem;//Create transformationCoordinateTransformationFactory ctFac = new CoordinateTransformationFactory(); ICoordinateTransformation transform = ctFac.CreateFromCoordinateSystems(source, target);//Apply transformation to a vectorlayer(yers[0] as VectorLayer).CoordinateTransformation = transform;Last edited Mar 27 2007 at 10:14 AM by codekaizen, version 11Can I specify how the ends of lines are rendered?Yes you can even set different end-styles in the two endsmyLayer.Style.Line.StartCap = System.Drawing.Drawing2D.LineCap.ArrowAnchor; myLayer.Style.Line.EndCap = System.Drawing.Drawing2D.LineCap.Round;Last edited Aug 4 2006 at 12:53 AM by SharpGIS, version 4How do I make a dashed line?Use the Layer.Style.Line.DashPattern property:myVectorLayer.Style.Line.DashPattern = new float[] { 4.0f, 2.0f };Last edited Aug 4 2006 at 1:13 AM by SharpGIS, version 6Set styling based on attribute and geometry dataYou can change the rendering style of each object based on it's attributes and geometry. SharpMap uses the "CustomTheme" class to add custom rendering of objects.It also features a GradientTheme which basically is based on CustomTheme. It interpolates between two styles based on a numeric field. Ex. the width of a line varies based on an attribute specifying the width of a road.Click below to see examples of using these types:CustomThemeGradientThemeCustomTheme renderingThe CustomTheme class uses a delegate method to specify the style. The delegate takes a FeatureDataRow as parameter and returns an IStyle (VectorStyle for vectorlayers and LabelStyle for LabelLayers). If the returned style is null, the layer style is used instead.The CustomTheme is for instance used for the SimpleChart extension to render different graphs on each cities.Below is an example of a style delegate for rendering different styling based on various attributes: private SharpMap.Styles.VectorStyle GetCountryStyle(SharpMap.Data.FeatureDataRow row){SharpMap.Styles.VectorStyle style = new SharpMap.Styles.VectorStyle();switch (row["NAME"].ToString().ToLower()){case "denmark": //If country name is Danmark, fill it with greenstyle.Fill = Brushes.Green;return style;case "united states": //If country name is USA, fill it with Blue and add a red outlinestyle.Fill = Brushes.Blue;style.Outline = Pens.Red;return style;case "china": //If country name is China, fill it with redstyle.Fill = Brushes.Red;return style;default:break;}//If country name starts with S make it yellowif (row["NAME"].ToString().StartsWith("S")){style.Fill = Brushes.Yellow;return style;}// If geometry is a (multi)polygon and the area of the polygon is less than 30, make it cyanelse if (row.Geometry.GetType() ==typeof(SharpMap.Geometries.MultiPolygon) &&(row.Geometry as SharpMap.Geometries.MultiPolygon).Area < 30 ||row.Geometry.GetType() == typeof(SharpMap.Geometries.Polygon) &&(row.Geometry as SharpMap.Geometries.Polygon).Area < 30 ) {style.Fill = Brushes.Cyan;return style;}else //None of the above -> Use the default stylereturn null;}To apply this style to a layer, set the Theme property on your VectorLayer:SharpMap.Rendering.Thematics.CustomTheme myTheme = newSharpMap.Rendering.Thematics.CustomTheme(GetCountryStyle);myVectorLayer.Theme = iTheme;Resulting image:Last edited Aug 4 2006 at 6:51 AM by SharpGIS, version 2Gradient ThemeBelow is a few examples on how to create gradient styles, all based on the "PopDens" attribute in the demo-datasource "Countries.shp"Grading Fill and OutlineSharpMap.Styles.VectorStyle min = new SharpMap.Styles.VectorStyle(); SharpMap.Styles.VectorStyle max = new SharpMap.Styles.VectorStyle();//Create a fill that starts from white to red//and an outline that starts from thin black to wide yellowmin.Fill = Color.White;max.Fill = Color.Red;min.Outline = new Pen(Color.Black,1);max.Outline = new Pen(Color.Yellow,5);min.EnableOutline = true;max.EnableOutline = true;//Create theme using a population density from 0 (min) to 400 (max) myVectorLayer.Theme = new SharpMap.Rendering.Thematics.GradientTheme("PopDens", 0, 400, min, max);Using ColorBlendingColor blends automatically creates a gradient between two or more colors. In this case we use a rainbow fill blend based on five colors. The blend properties will override any style set in min and max values.//Create theme using a population density from 0 (min) to 400 (max) SharpMap.Rendering.Thematics.GradientTheme popdens = newSharpMap.Rendering.Thematics.GradientTheme("PopDens", 0, 400,new SharpMap.Styles.VectorStyle(), new SharpMap.Styles.VectorStyle()); //We can make more advanced coloring using the ColorBlend'er.//Setting the FillColorBlend will override any fill-style in the min and max fills. //In this case we just use the predefined Rainbow colorscalepopdens.FillColorBlend = SharpMap.Rendering.Thematics.ColorBlend.Rainbow5; myVectorLayer.Theme = popdens;Grading LabelStylesThe following shows how to change the size and style of a label based on the population density attribute "PopDens".belStyle lblMin = new belStyle(); belStyle lblMax = new belStyle();lblMin.ForeColor = Color.Black;lblMin.Font = new Font(FontFamily.GenericSerif, 6);lblMax.ForeColor = Color.Blue;lblMax.BackColor = new SolidBrush(Color.FromArgb(128, 255, 255, 255));lblMin.BackColor = lblMax.BackColor;lblMax.Font = new Font(FontFamily.GenericSerif, 9);myLabelLayer.Theme = new SharpMap.Rendering.Thematics.GradientTheme("PopDens", 0, 400, lblMin, lblMax);Last edited Aug 4 2006 at 6:49 AM by SharpGIS, version 3Add a primitive geometryThis example shows how to add a simple geometry like a pointor line or both.SharpMap.Map mymap = new SharpMap.Map(new Size(100,100));yers.VectorLayer VLayer = new VectorLayer("GeometryLayer");Collection<SharpMap.Geometries.Geometry> GeomColl = newCollection<SharpMap.Geometries.Geometry>();//Add a single PointGeomColl.Add(new SharpMap.Geometries.Point(10, 10));//Add a LineString with 2 PointsCollection<SharpMap.Geometries.Point> PointColl = newCollection<SharpMap.Geometries.Point>();PointColl.Add(new SharpMap.Geometries.Point(10, 10));PointColl.Add(new SharpMap.Geometries.Point(20, 20));GeomColl.Add(new SharpMap.Geometries.LineString(PointColl)); VLayer.DataSource = new SharpMap.Data.Providers.GeometryProvider(GeomColl);...yers.Add(VLayer);mymap.ZoomToExtents();Last edited Oct 9 2006 at 11:47 PM by Volleyknaller, version 2How do I return a set of feature attribute data from a click on a map?Initialize the map, and add layersSharpMap.Map myMap = new SharpMap.Map(new Size(400,300));myMap.MinimumZoom = 100; //Minimum zoom allowedmyMap.BackgroundColor = Color.White; //Set backgroundmyMap.ZoomToExtents();//Add PostGIS layer:VectorLayer myLayer = new yers.VectorLayer("My layer");string connStr ="Server=127.0.0.1;Port=5432;UserId=postgres;Password=password;Database=myGisDb; ";myLayer.DataSource = new SharpMap.Providers.PostGIS(connStr, "myTable","the_geom", 32632);myLayer.MaxVisible = 40000;yers.Add(myLayer);// Assumes mapImage1 was added to a Windows Form in the WinForm designer mapImage1.MouseUp += new MouseEventHandler(mapImage1_MouseUp);mapImage1.Map = myMap;The mouse up handler of the map control:private void mapImage1_MouseUp(object sender, MouseEventArgs e){SharpMap.Geometries.Point p = mapImage1.Map.ImageToWorld(e.Location);FeatureDataSet ds = new FeatureDataSet();// The data set will contain the features which have a bounding box// which intersects the point's bounding box.yers[0].DataSource.ExecuteIntersectionQuery(p.GetBoundingBox(), ds);// You can now bind ds.Tables[0] to a datagrid, etc.}Last edited Mar 27 2007 at 6:13 AM by codekaizen, version 1How to Do true intersection testing using NetTopologySuite//This example requires references to//- SharpMap.dll (or project)//- SharpMap.Extensions.dll (or project)//- NetTopologySuite.dll, GeoAPI.dll// via NuGet Package manager:// PM> Install-Package NetTopologySuite#region Using Statementsusing SharpMap.Converters.NTS;using SharpMap.Data;using SharpMap.Data.Providers;#endregionnamespace ExampleCodeSnippets{///<summary>///Contains two methods for doing true intersection testing on geometries using NetTopologySuite///</summary>public class TrueIntersectionTestingWithNTS{///<summary>///This method returns a FeatureDataTable containing all the rows from the shapefile that intersect the testGeometry.///The ShapeFile.ExecuteIntersectionQuery method only tests bounding boxes so we use the FilterDelegate property to add a true/// intersection test using NetTopologySuite///</summary>///<param name="pathToShapefile">The path to the shapefile</param>///<param name="testGeometry">The geometry that we want to testagainst</param>///<returns></returns>public FeatureDataTable GetIntersectingFeaturesUsingFilterDelegate(string pathToShapefile, SharpMap.Geometries.Geometry testGeometry){//create a new shapefile providerusing (ShapeFile shapefile = new ShapeFile(pathToShapefile)){//create an nts GeometryFactory。
C#中SharpMap的简单使用实例详解
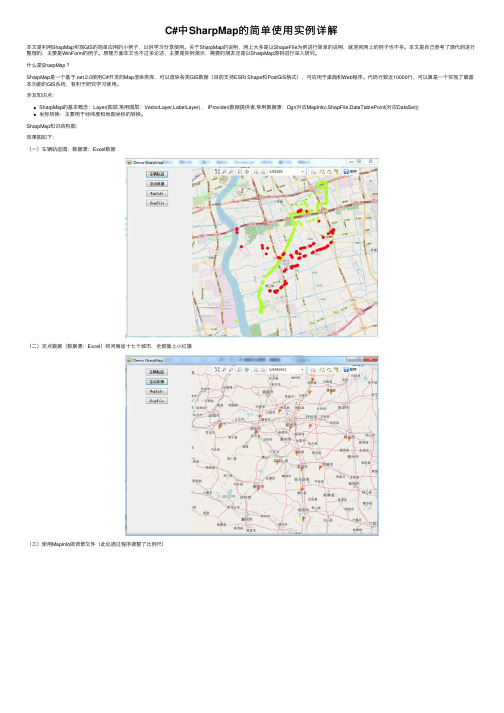
C#中SharpMap的简单使⽤实例详解本⽂是利⽤ShapMap实现GIS的简单应⽤的⼩例⼦,以供学习分享使⽤。
关于SharpMap的说明,⽹上⼤多是以ShapeFile为例进⾏简单的说明,就连官⽹上的例⼦也不多。
本⽂是⾃⼰参考了源代码进⾏整理的,主要是WinForm的例⼦。
原理⽅⾯本⽂也不过多论述,主要是实例演⽰,需要的朋友还是以SharpMap源码进⾏深⼊研究。
什么是SharpMap ?SharpMap是⼀个基于.net 2.0使⽤C#开发的Map渲染类库,可以渲染各类GIS数据(⽬前⽀持ESRI Shape和PostGIS格式),可应⽤于桌⾯和Web程序。
代码⾏数近10000⾏,可以算是⼀个实现了最基本功能的GIS系统,有利于研究学习使⽤。
涉及知识点:SharpMap的基本概念:Layer(图层,常⽤图层:VectorLayer,LabelLayer) , IProvider(数据提供者,常⽤数据源:Ogr(对应MapInfo),ShapFile,DataTablePoint(对应DataSet))坐标转换:主要⽤于经纬度和地图坐标的转换。
SharpMap知识结构图:效果图如下:(⼀)车辆轨迹图:数据源:Excel数据(⼆)定点数据(数据源:Excel)将河南省⼗七个城市,全部插上⼩红旗(三)使⽤MapInfo做背景⽂件(此处通过程序调整了⽐例尺)(四)使⽤ShapFile做背景图核⼼代码using BruTile.Predefined;using GeoAPI.CoordinateSystems.Transformations;using ProjNet.CoordinateSystems;using ProjNet.CoordinateSystems.Transformations;using SharpMap;using SharpMap.Data.Providers;using yers;using SharpMap.Rendering;using SharpMap.Rendering.Thematics;using SharpMap.Styles;using System;using System.Collections.Generic;using System.Data;using System.Data.OleDb;using System.Drawing;using System.Drawing.Drawing2D;using System.Drawing.Text;using System.Linq;using System.Text;using Point = GeoAPI.Geometries.Coordinate;namespace DemoSharpMap{public class SharpMapHelper{private const string XlsConnectionString = "Provider={2};Data Source={0}\\{1};Extended Properties=\"Excel 8.0;HDR=Yes;IMEX=1\""; public static Map InitializeMap(MapType tt,float angle){Map map = null;switch (tt){case MapType.RunLine:map = InitializeMapOsmWithXls(angle);break;case MapType.MapInfo:map = InitializeMapinfo(angle);break;case MapType.ShapeFile:map = InitializeMapOrig(angle);break;case MapType.Static:map = InitializeMapOsmWithXls2(angle);break;default:map = InitializeMapOsmWithXls(angle);break;}return map;}/// <summary>/// MapInfo格式的地图⽂件/// </summary>/// <param name="angle"></param>/// <returns></returns>private static Map InitializeMapinfo(float angle){//Initialize a new map of size 'imagesize'Map map = new Map();//Set up the countries layerVectorLayer layCountries = new VectorLayer("Countries");//Set the datasource to a shapefile in the App_data foldertry{layCountries.DataSource = new Ogr("GeoData/MapInfo/countriesMapInfo.tab");}catch (TypeInitializationException ex){if (ex.Message == "The type initializer for 'OSGeo.OGR.Ogr' threw an exception."){throw new Exception(String.Format("The application threw a PINVOKE exception. You probably need to copy the unmanaged dll's to your bin directory. They are a part of fwtools {0}. You can download it from: /fwtools/", GdalRasterLayer.FWToolsVersion));}throw;}//Set fill-style to greenlayCountries.Style.Fill = new SolidBrush(Color.Green);//Set the polygons to have a black outlinelayCountries.Style.Outline = Pens.Black;layCountries.Style.EnableOutline = true;layCountries.SRID = 4326;//Set up a river layerVectorLayer layRivers = new VectorLayer("Rivers");//Set the datasource to a shapefile in the App_data folderlayRivers.DataSource = new Ogr("GeoData/MapInfo/riversMapInfo.tab");//Define a blue 1px wide penlayRivers.Style.Line = new Pen(Color.Blue, 1);layRivers.SRID = 4326;//Set up a river layerVectorLayer layCities = new VectorLayer("Cities");//Set the datasource to a shapefile in the App_data folderlayCities.DataSource = new Ogr("GeoData/MapInfo/citiesMapInfo.tab");layCities.Style.SymbolScale = 0.8f;layCities.MaxVisible = 40;layCities.SRID = 4326;//Set up a country label layerLabelLayer layLabel = new LabelLayer("Country labels");layLabel.DataSource = layCountries.DataSource;layLabel.Enabled = true;belColumn = "Name";layLabel.Style = new LabelStyle();layLabel.Style.ForeColor = Color.White;layLabel.Style.Font = new Font(FontFamily.GenericSerif, 12);layLabel.Style.BackColor = new SolidBrush(Color.FromArgb(128, 255, 0, 0));layLabel.MaxVisible = 90;layLabel.MinVisible = 30;layLabel.Style.HorizontalAlignment = LabelStyle.HorizontalAlignmentEnum.Center;layLabel.SRID = 4326;layLabel.MultipartGeometryBehaviour = rgest;//Set up a city label layerLabelLayer layCityLabel = new LabelLayer("City labels");layCityLabel.DataSource = layCities.DataSource;layCityLabel.Enabled = true;belColumn = "Name";layCityLabel.Style = new LabelStyle();layCityLabel.Style.ForeColor = Color.Black;layCityLabel.Style.Font = new Font(FontFamily.GenericSerif, 11);layCityLabel.MaxVisible = layLabel.MinVisible;layCityLabel.Style.HorizontalAlignment = LabelStyle.HorizontalAlignmentEnum.Left;layCityLabel.Style.VerticalAlignment = LabelStyle.VerticalAlignmentEnum.Bottom;layCityLabel.Style.Offset = new PointF(3, 3);layCityLabel.Style.Halo = new Pen(Color.Yellow, 2);layCityLabel.TextRenderingHint = TextRenderingHint.AntiAlias;layCityLabel.SmoothingMode = SmoothingMode.AntiAlias;layCityLabel.SRID = 4326;belFilter = LabelCollisionDetection.ThoroughCollisionDetection;layCityLabel.Style.CollisionDetection = true;//Add the layers to the map object.//The order we add them in are the order they are drawn, so we add the rivers last to put them on topyers.Add(layCountries);yers.Add(layRivers);yers.Add(layCities);yers.Add(layLabel);yers.Add(layCityLabel);//增加Layersvar xlsPath = string.Format(XlsConnectionString, System.IO.Directory.GetCurrentDirectory(), "GeoData\\Henan.xls", Properties.Settings.Default.OleDbProvider);var ds = GetDataFromExcel(xlsPath, "Cities");//var ct = GetCoordinateTransformation();//TransCoordinate(ds, ct);string columeName = "Rotation";//Add Rotation ColumnAddColumeToDataSet(ds, columeName, -angle);var xlsLayer = GetLayerFromDataSet2(ds, Color.GreenYellow);//Set up provideryers.Add(xlsLayer); //Add layer to mapmap.Center = xlsLayer.Envelope.Centre;// new Point(0, 0);map.MapScale = 350;//map.Center = new Point(0, 0);//_ogrSampleDataset = "MapInfo";//Matrix mat = new Matrix();//mat.RotateAt(angle, map.WorldToImage(map.Center));//map.MapTransform = mat;//map.ZoomToBox(xlsLayer.Envelope);return map;}/// <summary>/// ShapeFile/// </summary>/// <param name="angle"></param>/// <returns></returns>private static Map InitializeMapOrig(float angle){//Initialize a new map of size 'imagesize'Map map = new Map();//Set up the countries layerVectorLayer layCountries = new VectorLayer("Countries");//Set the datasource to a shapefile in the App_data folderlayCountries.DataSource = new ShapeFile("GeoData/World/countries.shp", true);//Set fill-style to greenlayCountries.Style.Fill = new SolidBrush(Color.FromArgb(64, Color.Green));//Set the polygons to have a black outlinelayCountries.Style.Outline = Pens.Black;layCountries.Style.EnableOutline = true;layCountries.SRID = 4326;//Set up a river layerVectorLayer layRivers = new VectorLayer("Rivers");//Set the datasource to a shapefile in the App_data folderlayRivers.DataSource = new ShapeFile("GeoData/World/rivers.shp", true);//Define a blue 1px wide penlayRivers.Style.Line = new Pen(Color.Blue, 1);layRivers.SRID = 4326;//Set up a cities layerVectorLayer layCities = new VectorLayer("Cities");//Set the datasource to a shapefile in the App_data folderlayCities.DataSource = new ShapeFile("GeoData/World/cities.shp", true);layCities.Style.SymbolScale = 0.8f;layCities.MaxVisible = 40;layCities.SRID = 4326;//Set up a country label layerLabelLayer layLabel = new LabelLayer("Country labels");layLabel.DataSource = layCountries.DataSource;layLabel.Enabled = true;belColumn = "Name";layLabel.Style = new LabelStyle();layLabel.Style.ForeColor = Color.White;layLabel.Style.Font = new Font(FontFamily.GenericSerif, 12);layLabel.Style.BackColor = new SolidBrush(Color.FromArgb(128, 255, 0, 0));layLabel.MaxVisible = 90;layLabel.MinVisible = 30;layLabel.Style.HorizontalAlignment = LabelStyle.HorizontalAlignmentEnum.Center;layLabel.SRID = 4326;layLabel.MultipartGeometryBehaviour = rgest;belFilter = LabelCollisionDetection.ThoroughCollisionDetection;layLabel.Style.CollisionDetection = true;belPositionDelegate = fdr => fdr.Geometry.InteriorPoint.Coordinate;layLabel.PriorityColumn = "POPDENS";//Set up a city label layerLabelLayer layCityLabel = new LabelLayer("City labels");layCityLabel.DataSource = layCities.DataSource;layCityLabel.Enabled = true;belColumn = "Name";layCityLabel.Style = new LabelStyle();layCityLabel.Style.ForeColor = Color.Black;layCityLabel.Style.Font = new Font(FontFamily.GenericSerif, 11);layCityLabel.MaxVisible = layLabel.MinVisible;layCityLabel.Style.HorizontalAlignment = LabelStyle.HorizontalAlignmentEnum.Left;layCityLabel.Style.VerticalAlignment = LabelStyle.VerticalAlignmentEnum.Bottom;layCityLabel.Style.Offset = new PointF(3, 3);layCityLabel.Style.Halo = new Pen(Color.Yellow, 2);layCityLabel.TextRenderingHint = TextRenderingHint.AntiAlias;layCityLabel.SmoothingMode = SmoothingMode.AntiAlias;layCityLabel.SRID = 4326;belFilter = LabelCollisionDetection.ThoroughCollisionDetection;layCityLabel.Style.CollisionDetection = true;layCityLabel.PriorityColumn = "POPULATION";layCityLabel.Theme = new GradientTheme(layCityLabel.PriorityColumn, 250000, 5000000,new LabelStyle{MaxVisible = 10,CollisionBuffer = new Size(0, 0),CollisionDetection = true,Enabled = true,ForeColor = Color.LightSlateGray,Halo = new Pen(Color.Silver, 1),HorizontalAlignment = LabelStyle.HorizontalAlignmentEnum.Center,VerticalAlignment = LabelStyle.VerticalAlignmentEnum.Middle,Font = new Font(GenericFontFamilies.SansSerif.ToString(), 8f, FontStyle.Regular)},new LabelStyle{MaxVisible = layLabel.MinVisible,CollisionBuffer = new Size(3, 3),CollisionDetection = true,Enabled = true,ForeColor = Color.LightSlateGray,Halo = new Pen(Color.Silver, 5),HorizontalAlignment = LabelStyle.HorizontalAlignmentEnum.Center,VerticalAlignment = LabelStyle.VerticalAlignmentEnum.Middle,Font = new Font(GenericFontFamilies.SansSerif.ToString(), 16f, FontStyle.Bold)});bool ignoreLength = false;var layRiverLabel = new LabelLayer("River labels"){DataSource = layRivers.DataSource,Enabled = true,LabelColumn = "Name",TextRenderingHint = TextRenderingHint.AntiAlias,SmoothingMode = SmoothingMode.AntiAlias,SRID = 4326,LabelFilter = LabelCollisionDetection.ThoroughCollisionDetection,MultipartGeometryBehaviour = monCenter,Style =new LabelStyle{ForeColor = Color.DarkBlue,Font = new Font(FontFamily.GenericSansSerif, 11),HorizontalAlignment = LabelStyle.HorizontalAlignmentEnum.Center,VerticalAlignment = LabelStyle.VerticalAlignmentEnum.Middle,//CollisionDetection = true,Halo = new Pen(Color.Azure, 2),IgnoreLength = ignoreLength,Offset = new PointF(0, -10)},};//Add the layers to the map object.//The order we add them in are the order they are drawn, so we add the rivers last to put them on top//map.BackgroundLayer.Add(AsyncLayerProxyLayer.Create(layCountries));yers.Add(layCountries);yers.Add(layRivers);yers.Add(layCities);yers.Add(layLabel);yers.Add(layCityLabel);yers.Add(layRiverLabel);//增加Layersvar xlsPath = string.Format(XlsConnectionString, System.IO.Directory.GetCurrentDirectory(), "GeoData\\Henan.xls", Properties.Settings.Default.OleDbProvider); var ds = GetDataFromExcel(xlsPath, "Cities");//var ct = GetCoordinateTransformation();//TransCoordinate(ds, ct);string columeName = "Rotation";//Add Rotation ColumnAddColumeToDataSet(ds, columeName, -angle);var xlsLayer = GetLayerFromDataSet2(ds, Color.GreenYellow);//Set up provideryers.Add(xlsLayer); //Add layer to map//limit the zoom to 360 degrees width//map.MaximumZoom = 360;//map.BackColor = Color.LightBlue;//map.Zoom = 360;map.Center = xlsLayer.Envelope.Centre;// new Point(0, 0);map.MapScale = 350;//Matrix mat = new Matrix();//mat.RotateAt(angle, map.WorldToImage(map.Center));//map.MapTransform = mat;//map.ZoomToBox(xlsLayer.Envelope);return map;}/// <summary>/// 在线显⽰,圆点显⽰轨迹/// </summary>/// <param name="angle"></param>/// <returns></returns>private static Map InitializeMapOsmWithXls(float angle){var map = new Map();var tileLayer = new TileAsyncLayer(KnownTileSources.Create(KnownTileSource.OpenStreetMap), "TileLayer - OSM with XLS");tileLayer.SRID = 4326;map.BackgroundLayer.Add(tileLayer);//Get data from excelvar xlsPath = string.Format(XlsConnectionString, System.IO.Directory.GetCurrentDirectory(), "GeoData\\Cities.xls", Properties.Settings.Default.OleDbProvider);var ds = GetDataFromExcel(xlsPath, "Cities");var ds1 = GetDataFromExcel(xlsPath, "Cities2");var ct = GetCoordinateTransformation();TransCoordinate(ds, ct);TransCoordinate(ds1, ct);string columeName = "Rotation";//Add Rotation ColumnAddColumeToDataSet(ds, columeName, -angle);AddColumeToDataSet(ds1, columeName, -angle);var xlsLayer = GetLayerFromDataSet(ds, Color.GreenYellow);//Set up provideryers.Add(xlsLayer); //Add layer to mapvar xlsLayer1 = GetLayerFromDataSet(ds1, Color.Red);yers.Add(xlsLayer1);var xlsLabelLayer = GetLabelLayerByVectorLayer(xlsLayer, "XLSLabel");xlsLabelLayer.Theme = new SharpMap.Rendering.Thematics.FontSizeTheme(xlsLabelLayer, map) { FontSizeScale = 1000f };yers.Add(xlsLabelLayer);map.ZoomToBox(xlsLayer.Envelope.ExpandedBy(xlsLayer1.Envelope));return map;}/// <summary>/// 在线显⽰,图标显⽰轨迹/// </summary>/// <param name="angle"></param>/// <returns></returns>private static Map InitializeMapOsmWithXls2(float angle){var map = new Map();var tileLayer = new TileAsyncLayer(KnownTileSources.Create(KnownTileSource.OpenStreetMap), "TileLayer - OSM with XLS");tileLayer.SRID = 4326;map.BackgroundLayer.Add(tileLayer);//Get data from excelvar xlsPath = string.Format(XlsConnectionString, System.IO.Directory.GetCurrentDirectory(), "GeoData\\Henan.xls", Properties.Settings.Default.OleDbProvider);var ds = GetDataFromExcel(xlsPath, "Cities");var ct = GetCoordinateTransformation();TransCoordinate(ds, ct);string columeName = "Rotation";//Add Rotation ColumnAddColumeToDataSet(ds, columeName, -angle);var xlsLayer = GetLayerFromDataSet2(ds, Color.GreenYellow);//Set up provideryers.Add(xlsLayer); //Add layer to mapvar xlsLabelLayer = GetLabelLayerByVectorLayer(xlsLayer, "XLSLabel");xlsLabelLayer.Theme = new FontSizeTheme(xlsLabelLayer, map) { FontSizeScale = 1000f };yers.Add(xlsLabelLayer);map.ZoomToBox(xlsLayer.Envelope);return map;}/// <summary>/// 从Excel中读取数据/// </summary>private static DataSet GetDataFromExcel(string xlsPath, string sheetName){DataSet ds = new DataSet("XLS");string sql = string.Format("SELECT * FROM [{0}$];", sheetName);using (var cn = new OleDbConnection(xlsPath)){cn.Open();using (var da = new OleDbDataAdapter(new OleDbCommand(sql, cn))){da.Fill(ds);}}return ds;}/// <summary>/// 获取坐标转换对象/// </summary>/// <returns></returns>private static ICoordinateTransformation GetCoordinateTransformation(){//The SRS for this datasource is EPSG:4326, therefore we need to transfrom it to OSM projectionvar ctf = new CoordinateTransformationFactory();var cf = new CoordinateSystemFactory();var epsg4326 = cf.CreateFromWkt("GEOGCS[\"WGS 84\",DATUM[\"WGS_1984\",SPHEROID[\"WGS 84\",6378137,298.257223563,AUTHORITY[\"EPSG\",\"7030\"]],AUTHORITY[\"EPSG\",\"6326\"]],PRIMEM[\"Greenwich\",0,AUTHORITY[\"EPSG\",\"8901\"] var epsg3857 = cf.CreateFromWkt("PROJCS[\"Popular Visualisation CRS / Mercator\", GEOGCS[\"Popular Visualisation CRS\", DATUM[\"Popular Visualisation Datum\", SPHEROID[\"Popular Visualisation Sphere\", 6378137, 0, AUTHORITY[\"EPSG\",\"7059 var ct = ctf.CreateFromCoordinateSystems(epsg4326, epsg3857);return ct;}/// <summary>/// 转换地球经纬度到坐标/// </summary>/// <param name="ds"></param>/// <param name="ct"></param>private static void TransCoordinate(DataSet ds, ICoordinateTransformation ct){foreach (System.Data.DataRow row in ds.Tables[0].Rows){if (row["X"] == DBNull.Value || row["Y"] == DBNull.Value) continue;var coords = new[] { Convert.ToDouble(row["X"]), Convert.ToDouble(row["Y"]) };coords = ct.MathTransform.Transform(coords);row["X"] = coords[0];row["Y"] = coords[1];}}/// <summary>/// 增加列/// </summary>/// <param name="ds"></param>/// <param name="columeName"></param>/// <param name="columeValue"></param>private static void AddColumeToDataSet(DataSet ds, string columeName, float columeValue){ds.Tables[0].Columns.Add(columeName, typeof(float));foreach (System.Data.DataRow row in ds.Tables[0].Rows){row["Rotation"] = -columeValue;}}/// <summary>/// 轨迹⽤点表⽰/// </summary>/// <param name="ds"></param>/// <param name="c"></param>/// <returns></returns>private static VectorLayer GetLayerFromDataSet(DataSet ds, Color c){var xlsProvider = new DataTablePoint(ds.Tables[0], "OID", "X", "Y");var xlsLayer = new VectorLayer("XLS", xlsProvider){ Style = new VectorStyle() { PointColor = new SolidBrush(c) } };return xlsLayer;}/// <summary>/// 获取带图标的图层/// </summary>/// <param name="ds"></param>/// <param name="c"></param>/// <returns></returns>private static VectorLayer GetLayerFromDataSet2(DataSet ds, Color c){var xlsProvider = new DataTablePoint(ds.Tables[0], "OID", "X", "Y");var xlsLayer = new VectorLayer("XLS", xlsProvider){ Style = { Symbol=Properties.Resources.redflag} };return xlsLayer;}private static LabelLayer GetLabelLayerByVectorLayer(VectorLayer xlsLayer, string layerName){var xlsLabelLayer = new LabelLayer(layerName){DataSource = xlsLayer.DataSource,LabelColumn = "NAME",//PriorityColumn = "Population",Style ={CollisionBuffer = new System.Drawing.SizeF(2f, 2f),CollisionDetection = true},LabelFilter = LabelCollisionDetection.ThoroughCollisionDetection};return xlsLabelLayer;}}public enum MapType {ShapeFile = 0,MapInfo = 1,RunLine = 2,//运⾏轨迹Static = 3 //定点数据}}备注:1. 因⽤的MapInfo和Shape源⽂件为源码⾥⾯的,所有为英⽂显⽰。
SharpMap在供水管网调度系统分层处理中的应用

近年来GIS被引入到供水行业,以GIS 和S CA DA为核心的供水管网调度系统在自来水公司信息化建设中很受欢迎。
大部分供水管网G I S的开发平台为A rcGIS和Map GIS,这些开发平台价格高,中小型供水企业接受不了。
虽然这些平台功能强而全,可中小型供水企业不一定全用得上,但是却没有一些系统(如与S C A D A、Ep a N et)的集成功能,这些平台不是开源的,无法进行二次开发。
利用开源GIS进行二次开发可以与其他系统充分进行资源共享,开发出技术含量高的软件。
1 SharpMap简介利用开源GIS作为开发平台,这样不仅成本低廉,还可以开发具有完全版权且自主创新的软件产品。
S h a r p M a p是一个基于.N E T 2.0使用C#开发的M a p渲染类库,可以渲染ESRI Sh a p e、PostGIS、M S SQL等格式的GIS数据。
选择S h a r p M a p作为开发平台具以下优点:(1)占用资源较少,响应比较快。
(2)它是基于.NET 2.0环境开发的,对于.NET环境支持较好,可利用资源多。
(3)使用简单,便于推广。
只要在.NET项目中引用相应的dll文件即可,没有复杂的安装步骤。
2 供水管网的分层管理供水管网调度系统分为几层:管道层、阀门层、水表层、流量监控层、压力监控层、节点层等,采用分层管理,方便对管道类型及附件(如阀门等)进行分类管理,在显示时可以单独显示,一目了然,便于突出重点。
也可以叠加显示和综合考虑。
以下是供水管网调度系统的界面,各个层可以分别显示,也可以重叠显示。
3 SharpMap图层对象概述S h a r p M A P中所有图层(L aye r)都是从ILayer接口派生的,采用了面向接口的编程思想。
虽然各种不同的图层,如矢量图层和标注图层相差很大,但它们都有共同的特点:图层的名称、最大最小可视范围、是否渲染等,而且图层都使用Re nder方法来渲染自己。
开源地图SharpMap源码解析-(1)简介
开源地图SharpMap源码解析-(1)简介1.简介SharpMap实现功能:(1)符合OpenGIS的简单要素规范,⽀持点、线、⾯、多点、多线、多⾯、集合对象集合等要素集合。
(2)⽀持常规的地图操作,例如旋转、平移、缩放等。
(3)实时的地图投影转换。
(4)使⽤异步委托实现效率最⼤化,可编制展⽰复杂的地图主体渲染。
(5)⽀持Web地图展⽰,⽀持AJAX地图控件,⽀持WMS服务。
(6)有很好的接⼝⽀持数据格式和图层的扩展。
SharpMap⽀持的格式:(1)⽀持⽮量数据格式:例如ESRI Shape File、PostGIS、Oracle、Microsoft SQLServer、SQLite等。
(2)⽀持栅格数据格式:例如.bmp、.gif、.tif、.png、.dem等格式。
(3)WMS地图服务。
SharpMap使⽤的第三⽅开源库:SharpMap源码结构(1)SharpMap名称空间是SharpMap的核⼼,Base⽂件夹是基础的资源释放接⼝。
Converters⽂件夹是数据格式转换类。
CoordinateSystems⽂件夹是坐标系统的矩阵转换类。
Data⽂件夹下是数据格式类。
Geometries⽂件夹是对GeoAPI的扩展。
Layers⽂件夹是图层类管理。
Map⽂件夹是核⼼,其中Map是地图对象,MapViewportGuard是⽬录树管理。
Rendering⽂件夹下是渲染类。
Styles⽂件夹下是样式类。
Utilities⽂件夹下是公共类主要提供⼀些算法。
Web⽂件夹下是web访问地图的接⼝。
(2)SharpMap.UI名称空间是WinForm编程的核⼼,在其Forms⽂件夹下是MapBox类是核⼼,他本质上是⼀个⾃定义组件(Component)继承与WinForm的Control控件类。
ToolBar⽂件夹下是⼯具条类都继承⾃System.Windows.Forms.ToolStrip,它们也是⾃定义组件。
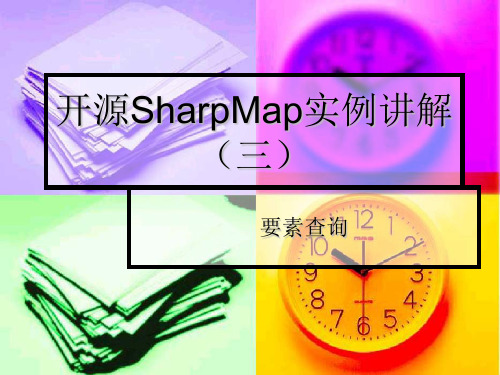
开源SharpMap实例讲解(三)
………..
1、单击事件中调用代码
…. //打开显示站点属性的页面
if (strNames.Length > 0) strNames = strNames.Substring(0, strNames.Length - 1); string strURL = "StationInfo.aspx?StationName=" + strNames; string strPage = "<script type='text/javascript'>window.open('" + strURL + "','站点属性 ','height=450,width=470,status=no,toolbar=no,menubar=no,scr bars=yes,location=no');</script>"; Response.Write(strPage);
1、单击事件中调用代码ຫໍສະໝຸດ 在 图形的ImgMap_Click事件单击,查询要素属性,所调用的代码 { SharpMap.Geometries.Point ClickPnt = myMap.ImageToWorld(new System.Drawing.Point(e.X, e.Y)); SharpMap.Data.FeatureDataSet dsResult; dsResult = QueryMapByClick(ClickPnt2, ClickPnt); if (dsResult.Tables.Count > 0) { Session["THETABLE"] = dsResult; Session["TABLENUM"] = 1; string strNames = ""; //如何获取选中要素的属性数据 foreach (DataRow dr in dsResult.Tables[0].Rows) { strNames = strNames + dr[0].ToString() + ","; }
- 1、下载文档前请自行甄别文档内容的完整性,平台不提供额外的编辑、内容补充、找答案等附加服务。
- 2、"仅部分预览"的文档,不可在线预览部分如存在完整性等问题,可反馈申请退款(可完整预览的文档不适用该条件!)。
- 3、如文档侵犯您的权益,请联系客服反馈,我们会尽快为您处理(人工客服工作时间:9:00-18:30)。
private SharpMap.Map myMap;
/// <summary> /// Creates the map, inserts it into the cache and sets the ImageButton Url /// </summary> private void GenerateMap() {
我不是小菜
QQ:563549269
//Save the current mapcenter and zoom in the viewstate ViewState.Add("mapCenter", myMap.Center); ViewState.Add("mapZoom", myMap.Zoom);
新开发了一些新的模块。这些都将在以后的文章中有所阐述。
基于 Jackey.Framework 开发 Windows 应用程序示例
我不是小菜
QQ在窗体装载事件中调用该方法。
private void init() { //Set buddy control. this.tocControl1.MapControl = this.mapControl1;
我不是小菜
QQ:563549269
((SharpMap.Rendering.SimpleFeatureRenderer)layRoad.Renderer).Symbol = new SharpMap.Symbols.LineSymbol(Color.Green, 2f);
//create a vector layer and set the default renderer. yers.VectorLayer layCoasts = new yers.VectorLayer("Coasts"); layCoasts.DataSource = new SharpMap.Data.Providers.ShapeFileProvider(@"D:\ArcGIS\DeveloperKit\SamplesNE T\data\GulfOfStLawrence\data\Coasts.shp");
protected void Page_Load(object sender, EventArgs e) {
//Set up the map. We use the method in the App_Code folder for initializing the map
myMap = MapHelper.InitializeImageMap(new System.Drawing.Size((int)imgMap.Width.Value, (int)imgMap.Height.Value));
//Initialize a new map of size 'imagesize' SharpMap.Map map = new SharpMap.Map(size);
yers.GdalRasterLayer imgLayer = new yers.GdalRasterLayer("Aster", HttpContext.Current.Server.MapPath(@"~\App_data\aster.tif"));
我不是小菜
QQ:563549269
基于 SharpMap 扩展程序开发实例
SharpMap 是基于.Net 平台开发的 GIS 地图渲染组件。在 SharpMap 的内部设 计了基于 OGC 标准的几何模型构架,设计了 IProvider 策略模式的多源矢量地图 数据适配器接口,地图要素渲染的底层主要通过几何变换将 Geometry 转换为.Net 支 持 的 几 何 模 型 如 System.Drawing.Point 、 System.Drawing.Rectangle 、 System.Drawing.Drawing2D.GraphicsPath 等,然后调用 System.Drawing.Graphics 类 的 Draw 方法实现地图要素的绘制。在 SharpMap 内部由于没有设计 Symbol 的构 架,因此,对于需要开发真正的 GIS 系统,需要封装 Symbol 架构,以便实现专
题渲染和地图符号库。 SharpMap 为我们提供了 GIS 系统最基本的功能集合,如地图可视化、空间
查询等功能,因此我们可以利用 SharpMap 提供的部分功能为我们在.Net 平台上
实现地图可视化提供支持,而不需要借助一些商业组件。本文就将简单的介绍一 些基于 SharpMap 实现部分程序的代码示例,希望对研究开源的朋友有所启示和 帮助。注:我已经对 SharpMap 部分 Bug 做了修改,重新设计了系统的构架,也
//zoom the map to the full extent this.mapControl1.ZoomToFullExtent(); }
我不是小菜
开发 应用程序示例
QQ:563549269
页面代码为:
using System; using System.Data; using System.Configuration; using System.Web; using System.Web.Security; using System.Web.UI; using System.Web.UI.WebControls; using System.Web.UI.WebControls.WebParts; using System.Web.UI.HtmlControls;
using System; using System.Data; using System.Configuration; using System.Web; using System.Web.Security; using System.Web.UI; using System.Web.UI.WebControls; using System.Web.UI.WebControls.WebParts; using System.Web.UI.HtmlControls; using System.Drawing; using System.Drawing.Drawing2D;
((SharpMap.Rendering.SimpleFeatureRenderer)layCoasts.Renderer).Symbol = new SharpMap.Symbols.FillSymbol(Color.LightCyan);
//add the layer to the map yers.Add(layCoasts); yers.Add(layRoad); yers.Add(layCity);
protected void Button1_Click(object sender, EventArgs e) {
//ZoomIn SharpMap.Geometries.BoundingBox bbox=myMap.VisibleBounds; bbox.Expand(0.5,0.5,true); myMap.ZoomToBox(bbox); GenerateMap(); } protected void Button2_Click(object sender, EventArgs e) { //ZoomOut SharpMap.Geometries.BoundingBox bbox = myMap.VisibleBounds; bbox.Expand(1.5, 1.5, true); myMap.ZoomToBox(bbox);
//Render map System.Drawing.Image img = myMap.GetMap();
//img.Save("c:\\testsharpmapimg.bmp"); string imgID = SharpMap.Web.Caching.InsertIntoCache(1, img); imgMap.ImageUrl = "getmap.aspx?ID=" + HttpUtility.UrlEncode(imgID); }
//create a vector layer and set the default renderer. yers.VectorLayer layCity=new yers.VectorLayer("City"); layCity.DataSource=new SharpMap.Data.Providers.ShapeFileProvider(@"D:\ArcGIS\DeveloperKit\SamplesNE T\data\GulfOfStLawrence\data\Can_Mjr_Cities.shp");
我不是小菜
QQ:563549269
GenerateMap(); } protected void Button4_Click(object sender, EventArgs e) {
//FullExtent myMap.ZoomToExtents(); GenerateMap(); } protected void imgMap_Click1(object sender, ImageClickEventArgs e) { //Set center of the map to where the client clicked myMap.Center = myMap.ToMapPoint(e.X, e.Y); GenerateMap(); } }
//create a vector layer and set the default renderer. yers.VectorLayer layRoad = new yers.VectorLayer("Road"); layRoad.DataSource = new SharpMap.Data.Providers.ShapeFileProvider(@"D:\ArcGIS\DeveloperKit\SamplesNE T\data\GulfOfStLawrence\data\mjrroads.shp");
