托马斯.A.普格尔 国际贸易 英语chap012
国际金融 第14版 (托马斯.A.普格尔 著) 课后答案

课后答案网 w w w .h a c k s h p .c n课后答案网 您最真诚的朋友 网团队竭诚为学生服务,免费提供各门课后答案,不用积分,甚至不用注册,旨在为广大学生提供自主学习的平台!课后答案网:视频教程网:PPT 课件网:课后答案网 w w w .h a c k s h p .c n《国际金融》课后题的答案,托马斯-A-普格尔主编。
Suggested Answer for International Finance Chap 22.Disagree,at least as a general statement.One meaning of a current account surplus is thatthe country is exporting more goods and services than it is importing.One might easily judge that this is not good—the country is producing goods and services that are exported,but the country is not at the same time getting the imports of goods and services that would allow it do more consumption and domestic investment.In this way a current account deficit might be considered good—the extra imports allow the country to consume and invest domestically more than the value of its current production.Another meaning of a current account surplus is that the country is engaging in foreign financial investment—it is building up its claims on foreigners,and this adds to national wealth.This sounds good,but as noted above it comes at the cost of foregoing current domestic purchases of goods and services.A current account deficit is the country running down its claims on foreigners or increasing its indebtedness to foreigners.This sounds bad,but itcomes with the benefit of higher levels of current domestic expenditure.Different countries at different times may weigh the balance of these costs and benefits differently,so that we cannot simply say that a current account surplus is better than a current account deficit.4.Disagree.If the country has a surplus (a positive value)for its official settlements balance,then the value for its official reserves balance must be a negative value of the same amount (so that the two add to zero).A negative value for this asset item means that funds are flowing out in order for the country to acquire more of these kinds of assets.Thus,the country is increasing its holdings of official reserve assets.6.Item e is a transaction in which foreign official holdings of U.S.assets increase.This is a positive (credit)item for official reserve assets and a negative (debit)item for private capital flows as the U.S.bank acquires pound bank deposits.The debit item contributes to a U.S.deficit in the official settlements balance (while the credit item is recorded "below the line,"permitting the official settlements balance to be in deficit).All other transactions involve debit and credit items both of which are included in the official settlements balance,so that they do not directly contribute to a deficit (or surplus)in the official settlements balance.8. a.Merchandise trade balance:$330-198=$132Goods and services balance:$330-198+196-204=$124课后答案网 w w w .h a c k s h p .c nCurrent account balance:$330-198+196-204+3-8=$119Official settlements balance:$330-198+196-204+3-8+102-202+4=$23b.Change in official reserve assets (net)=-official settlements balance =-$23.The country is increasing its net holdings of official reserve assets.10.a.International investment position (billions):$30+20+15-40-25=$0.The country is neither an international creditor nor a debtor.Its holding of international assets equals its liabilities to foreigners.b.A current account surplus permits the country to add to its net claims on foreigners.For this reason the country's international investment position will become a positive value.The flow increase in net foreign assets results in the stock of net foreign assets becoming positive.Chap 32.Exports of merchandise and services result in supply of foreign currency in the foreignexchange market.Domestic sellers often want to be paid using domestic currency,while the foreign buyers want to pay in their currency.In the process of paying for these exports,foreign currency is exchanged for domestic currency,creating supply of foreign currency.International capital inflows result in a supply of foreign currency in the foreign exchange market.In making investments in domestic financial assets,foreign investors often start with foreign currency and must exchange it for domestic currency before they can buy the domestic assets.The exchange creates a supply of foreign currency.Sales of foreign financial assets that the country's residents had previously acquired,and borrowing from foreigners by this country's residents are other forms of capital inflow that can create supply of foreign currency.4.The U.S.firm obtains a quotation from its bank on the spot exchange rate for buying yen with dollars.If the rate is acceptable,the firm instructs its bank that it wants to use dollars from its dollar checking account to buy 1million yen at this spot exchange rate.It also instructs its bank to send the yen to the bank account of the Japanese firm.To carry out this instruction,the U.S.bank instructs its correspondent bank in Japan to take 1million yen from its account at the correspondent bank and transfer the yen to the bank account of the Japanese firm.(The U.S.bank could also use yen at its own branch if it has a branch in Japan.)6.The trader would seek out the best quoted spot rate for buying euros with dollars,either through direct contact with traders at other banks or by using the services of a foreign exchange broker.The trader would use the best rate to buy euro spot.Sometime in the next hour or so (or,typically at least by the end of the day),the trader will enter the课后答案网 w w w .h a c k s h p .c ninterbank market again,to obtain the best quoted spot rate for selling euros for dollars.The trader will use the best spot rate to sell her previously acquired euros.If the spot value of the euro has risen during this short time,the trader makes a profit.8. a.The cross rate between the yen and the krone is too high (the yen value of the krone is toohigh)relative to the dollar-foreign currency exchange rates.Thus,in a profitable triangular arbitrage,you want to sell kroner at the high cross rate.The arbitrage will be:Use dollars to buy kroner at $0.20/krone,use these kroner to buy yen at 25yen/krone,and use the yen to buy dollars at $0.01/yen.For each dollar that you sell initially,you can obtain 5kroner,these 5kroner can obtain 125yen,and the 125yen can obtain $1.25.The arbitrage profit for each dollar is therefore 25cents.b.Selling kroner to buy yen puts downward pressure on the cross rate (the yen price of krone).The value of the cross rate must fall to 20(=0.20/0.01)yen/krone to eliminate the opportunity for triangular arbitrage,assuming that the dollar exchange rates are unchanged.10.a.The increase in supply of Swiss francs puts downward pressure on the exchange-ratevalue ($/SFr)of the franc.The monetary authorities must intervene to defend the fixed exchange rate by buying SFr and selling dollars.b.The increase in supply of francs puts downward pressure on the exchange-rate value ($/SFr)of the franc.The monetary authorities must intervene to defend the fixed exchange rate by buying SFr and selling dollars.c.The increase in supply of francs puts downward pressure on the exchange-rate value ($/SFr)of the franc.The monetary authorities must intervene to defend the fixed exchange rate by buying SFr and selling dollars.d.The decrease in demand for francs puts downward pressure on the exchange-rate value ($/SFr)of the franc.The monetary authorities must intervene to defend the fixed exchange rate by buying SFr and selling dollars.Chap 42.You will need data on four market rates:The current interest rate (or yield)on bondsissued by the ernment that mature in one year,the current interest rate (or yield)on bonds issued by the British government that mature in one year,the current spot exchange rate between the dollar and pound,and the current one-year forward exchange rate between the dollar and pound.Do these rates result in a covered interest differential that is very close to zero?课后答案网 w w w .h a c k s h p .c n4. a.The U.S.firm has an asset position in yen—it has a long position in yen.To hedge itsexposure to exchange rate risk,the firm should enter into a forward exchange contract now in which the firm commits to sell yen and receive dollars at the current forward rate.The contract amounts are to sell 1million yen and receive $9,000,both in 60days.b.The student has an asset position in yen—a long position in yen.To hedge the exposure to exchange rate risk,the student should enter into a forward exchange contract now in which the student commits to sell yen and receive dollars at the current forward rate.The contract amounts are to sell 10million yen and receive $90,000,both in 60days.c.The U.S.firm has an liability position in yen—a short position in yen.To hedge its exposure to exchange rate risk,the firm should enter into a forward exchange contract now in which the firm commits to sell dollars and receive yen at the current forward rate.The contract amounts are to sell $900,000and receive 100million yen,both in 60days.6.Relative to your expected spot value of the euro in 90days ($1.22/euro),the current forward rate of the euro ($1.18/euro)is low—the forward value of the euro is relatively ing the principle of "buy low,sell high,"you can speculate by entering into a forward contract now to buy euros at $1.18/euro.If you are correct in your expectation,then in 90days you will be able to immediately resell those euros for $1.22/euro,pocketing a profit of $0.04for each euro that you bought forward.If many people speculate in this way,then massive purchases now of euros forward (increasing the demand for euros forward)will tend to drive up the forward value of the euro,toward a current forward rate of $1.22/euro.8. a.The Swiss franc is at a forward premium.Its current forward value ($0.505/SFr)is greaterthan its current spot value ($0.500/SFr).b.The covered interest differential "in favor of Switzerland"is ((1+0.005)⋅(0.505)/0.500)-(1+0.01)=0.005.(Note that the interest rate used must match the time period of the investment.)There is a covered interest differential of 0.5%for 30days (6percent at an annual rate).The U.S.investor can make a higher return,covered against exchange rate risk,by investing in SFr-denominated bonds,so presumably the investor should make this covered investment.Although the interest rate on SFr-denominated bonds is lower than the interest rate on dollar-denominated bonds,the forward premium on the franc is larger than this difference,so that the covered investment is a good idea.c.The lack of demand for dollar-denominated bonds (or the supply of these bonds as investors sell them in order to shift into SFr-denominated bonds)puts downward pressure on the prices of U.S.bonds—upward pressure on U.S.interest rates.The extra demand for the franc in the spot exchange market (as investors buy SFr in order to buy SFr-denominated bonds)puts upward pressure on the spot exchange rate.The extra demand for SFr-denominated bonds puts upward pressure on the prices of Swiss bonds—downward pressure on Swiss interest rates.The extra supply of francs in the课后答案网 w w w .h a c k s h p .c nforward market (as U.S.investors cover their SFr investments back into dollars)puts downward pressure on the forward exchange rate.If the only rate that changes is the forward exchange rate,this rate must fall to about $0.5025/SFr.With this forward rate and the other initial rates,the covered interest differential is close to zero.10.In testing covered interest parity,all of the interest rates and exchange rates that areneeded to calculate the covered interest differential are rates that can observed in the bond and foreign exchange markets.Determining whether the covered interest differential is about zero (covered interest parity)is then straightforward (although some more subtle issues regarding timing of transactions may also need to be addressed).In order to test uncovered interest parity,we need to know not only three rates—two interest rates and the current spot exchange rate—that can be observed in the market,but also one rate—the expected future spot exchange rate—that is not observed in any market.The tester then needs a way to find out about investors'expectations.One way is to ask them,using a survey,but they may not say exactly what they really think.Another way is to examine the actual uncovered interest differential after we know what the future spot exchange rate actually turns out to be,and see whether the statistical characteristics of the actual uncovered differential are consistent with an expected uncovered differential of about zero (uncovered interest parity).Chap 52. a.The euro is expected to appreciate at an annual rate of approximately ((1.005-1.000)/1.000)⋅(360/180)⋅100=1%.The expected uncovered interest differential is approximately 3%+1%-4%=0,so uncovered interest parity holds (approximately).b.If the interest rate on 180-day dollar-denominated bonds declines to 3%,then the spot exchange rate is likely to increase—the euro will appreciate,the dollar depreciate.At the initial current spot exchange rate,the initial expected future spot exchange rate,and the initial euro interest rate,the expected uncovered interest differential shifts in favor of investing in euro-denominated bonds (the expected uncovered differential is now positive,3%+1%-3%=1%,favoring uncovered investment in euro-denominated bonds.The increased demand for euros in the spot exchange market tends to appreciate the euro.If the euro interest rate and the expected future spot exchange rate remain unchanged,then the current spot rate must change immediately to be $1.005/euro,to reestablish uncovered interest parity.When the current spot rate jumps to this value,the euro's exchange rate value is not expected to change in value subsequently during the next 180days.The dollar has depreciated immediately,and the uncovered differential then again is zero (3%+0%-3%=0).课后答案网 w w w .h a c k s h p .c n4. a.For uncovered interest parity to hold,investors must expect that the rate of change in thespot exchange-rate value of the yen equals the interest rate differential,which is zero.Investors must expect that the future spot value is the same as the current spot value,$0.01/yen.b.If investors expect that the exchange rate will be $0.0095/yen,then they expect the yen to depreciate from its initial spot value during the next 90days.Given the other rates,investors tend to shift their investments toward dollar-denominated investments.The extra supply of yen (and demand for dollars)in the spot exchange market results in a decrease in the current spot value of the yen (the dollar appreciates).The shift to expecting that the yen will depreciate (the dollar appreciate)sometime during the next 90days tends to cause the yen to depreciate (the dollar to appreciate)immediately in the current spot market.6.The law of one price will hold better for gold.Gold can be traded easily so that any price differences would lead to arbitrage that would tend to push gold prices (stated in a common currency by converting prices using market exchange rates)back close to equality.Big Macs cannot be arbitraged.If price differences exist,there is no arbitrage pressure,so the price differences can persist.The prices of Big Macs (stated in a common currency)vary widely around the world.8.According to PPP,the exchange rate value of the DM (relative to the dollar)has risen since the early 1970s because Germany has experienced less inflation than has the United States—the product price level has risen less in Germany since the early 1970s than it has risen in the United States.According to the monetary approach,the German price level has not risen as much because the German money supply has increased less than the money supply has increased in the United States,relative to the growth rates of real domestic production in the two countries.The British pound is the opposite case—more inflation in Britain than in the United States,and higher money growth in Britain.10.a.Because the growth rate of the domestic money supply (M s )is two percentage pointshigher than it was previously,the monetary approach indicates that the exchange rate value (e)of the foreign currency will be higher than it otherwise would be—that is,the exchange rate value of the country's currency will be lower.Specifically,the foreign currency will appreciate by two percentage points more per year,or depreciate by two percentage points less.That is,the domestic currency will depreciate by two percentage points more per year,or appreciate by two percentage points less.b.The faster growth of the country's money supply eventually leads to a faster rate of inflation of the domestic price level (P).Specifically,the inflation rate will be two percentage points higher than it otherwise would be.According to relative PPP,a faster rate of increase in the domestic price level (P)leads to a higher rate of appreciation of the foreign currency.课后答案网 w w w .h a c k s h p .c n12.a.For the United States in 1975,20,000=k ⋅100⋅800,or k =0.25.For Pugelovia in 1975,10,000=k ⋅100⋅200,or k =0.5.b.For the United States,the quantity theory of money with a constant k means that the quantity equation with k =0.25should hold in 2002:65,000=0.25⋅260⋅1,000.It does.Because the quantity equation holds for both years with the same k,the change in the price level from 1975to 2002is consistent with the quantity theory of money with a constant k.Similarly,for Pugelovia,the quantity equation with k =0.5should hold for 2002,and it does (58,500=0.5⋅390⋅300).14.a.The tightening typically leads to an immediate increase in the country's interest rates.Inaddition,the tightening probably also results in investors'expecting that the exchange-rate value of the country's currency is likely to be higher in the future.The higher expected exchange-rate value for the currency is based on the expectation that the country's price level will be lower in the future,and PPP indicates that the currency will then be stronger.For both of these reasons,international investors will shift toward investing in this country's bonds.The increase in demand for the country's currency in the spot exchange market causes the current exchange-rate value of the currency to increase.The currency may appreciate a lot because the current exchange rate must "overshoot"its expected future spot value.Uncovered interest parity is reestablished with a higher interest rate and a subsequent expected depreciation of the currency.b.If everything else is rather steady,the exchange rate (the domestic currency price of foreign currency)is likely to decrease quickly by a large amount.After this jump,the exchange rate may then increase gradually toward its long-run value—the value consistent with PPP in the long run.Chap 62.We often use the term pegged exchange rate to refer to a fixed exchange rate,becausefixed rates generally are not fixed forever.An adjustable peg is an exchange rate policy in which the "fixed"exchange rate value of a currency can be changed from time to time,but usually it is changed rather seldom (for instance,not more than once every several years).A crawling peg is an exchange rate policy in which the "fixed"exchange rate value of a currency is changed often (for instance,weekly or monthly),sometimes according to indicators such as the difference in inflation rates.4.Disagree.If a country is expected to impose exchange controls,which usually make it more difficult to move funds out of the country in the future,investors are likely to try to shift funds out of the country now before the controls are imposed.The increase in supply of domestic currency into the foreign exchange market (or increase in demand for foreign课后答案网 w w w .h a c k s h p .c ncurrency)puts downward pressure on the exchange rate value of the country's currency—the currency tends to depreciate.6. a.The market is attempting to depreciate the pnut (appreciate the dollar)toward a value of3.5pnuts per dollar,which is outside of the top of the allowable band (3.06pnuts per dollar).In order to defend the pegged exchange rate,the Pugelovian monetary authorities could use official intervention to buy pnuts (in exchange for dollars).Buying pnuts prevents the pnut’s value from declining (selling dollars prevents the dollar’s value from rising).The intervention satisfies the excess private demand for dollars at the current pegged exchange rate.b.In order to defend the pegged exchange rate,the Pugelovian government could impose exchange controls in which some private individuals who want to sell pnuts and buy dollars are told that they cannot legally do this (or cannot do this without government permission,and not all requests are approved by the government).By artificially restricting the supply of pnuts (and the demand for dollars),the Pugelovian government can force the remaining private supply and demand to "clear"within the allowable band.The exchange controls attempt to stifle the excess private demand for dollars at the current pegged exchange rate.c.In order to defend the pegged exchange rate,the Pugelovian government could increase domestic interest rates (perhaps by a lot).The higher domestic interest rates shift the incentives for international capital flows toward investments in Pugelovian bonds.The increased flow of international financial capital into Pugelovia increases the demand for pnuts on the foreign exchange market.(Also,the decreased flow of international financial capital out of Pugelovia reduces the supply of pnuts on the foreign exchange market.)By increasing the demand for pnuts (and decreasing the supply),the Pugelovian government can induce the private market to clear within the allowable band.The increased domestic interest rates attempt to shift the private supply and demand curves so that there is no excess private demand for dollars at the current pegged exchange rate value.8. a.The gold standard was a fixed rate system.The government of each country participatingin the system agreed to buy or sell gold in exchange for its own currency at a fixed price of gold (in terms of its own currency).Because each currency was fixed to gold,the exchange rates between currencies also tended to be fixed,because individuals could arbitrage between gold and currencies if the currency exchange rates deviated from those implied by the fixed gold prices.b.Britain was central to the system,because the British economy was the leader in industrialization and world trade,and because Britain was considered financially secure and prudent.Britain was able and willing to run payments deficits that permitted many other countries to run payments surpluses.The other countries used their surpluses to build up their holdings of gold reserves (and of international reserves in the form of sterling-denominated assets).These other countries were satisfied with the rate of growth课后答案网 w w w .h a c k s h p .c nof their holdings of liquid reserve assets,and most countries were able to avoid the crisis of running low on international reserves.c.During the height of the gold standard,from about 1870to 1914,the economic shocks to the system were mild.A major shock—World War I—caused many countries to suspend the gold standard.d.Speculation was generally stabilizing,both for the exchange rates between the currencies of countries that were adhering to the gold standard,and for the exchange rates of countries that temporarily allowed their currencies to float.10.a.The Bretton Woods system was an adjustable pegged exchange rate system.Countriescommitted to set and defend fixed exchange rates,financing temporary payments imbalances out of their official reserve holdings.If a "fundamental disequilibrium"in a country's international payments developed,the country could change the value of its fixed exchange rate to a new value.b.The United States was central to the system.As the Bretton Woods system evolved,it became essentially a gold-exchange standard.The monetary authorities of other countries committed to peg the exchange rate values of their currencies to the U.S.dollar.The U.S.monetary authority committed to buy and sell gold in exchange for dollars with other countries'monetary authorities at a fixed dollar price of gold.c.To a large extent speculation was stabilizing,both for the fixed rates followed by most countries,and for the exchange rate value of the Canadian dollar,which floated during 1950-62.However,the pegged exchange rate values of currencies sometimes did come under speculative pressure.International investors and speculators sometimes believed that they had a one-way speculative bet against currencies that were considered to be "in trouble.”If the country did manage to defend the pegged exchange rate value of its currency,the investors betting against the currency would lose little.They stood to gain a lot of profit if the currency was devalued.Furthermore,the large speculative flows against the currency required large interventions to defend the currency's pegged value,so that the government was more likely to run so low on official reserves that it was forced to devalue.12.a.The dollar bloc and the euro bloc.A number of countries peg their currencies to the U.S.dollar.A number of European countries use the euro,and,in addition,a number of other countries peg their currencies to the euro.b.The other major currencies that float independently include (as of the beginning of 2002)the Japanese yen,the British pound,the Canadian dollar,and the Swiss franc.c.The exchange rates between the U.S.dollar and the other major currencies have been floating since the early 1970s.The movements in these rates exhibit trends in the long课后答案网 w w w .h a c k s h p .c nrun—over the entire period since the early 1970s.The rates also show substantial variability or volatility in the short and medium runs—periods of less than one year to periods of several years.The long run trends appear to be reasonably consistent with the economic fundamentals emphasized by purchasing power parity—differences in national inflation rates.The variability or volatility in the short or medium run is controversial.It may simply represent rational responses to the continuing flow of economic and political news that has implications for exchange rate values.The effects on rates can be large and rapid,because overshooting occurs as rates respond to important news.However,some part of the large volatility may also reflect speculative bandwagons that lead to bubbles that subsequently burst.Chap 82.Disagree.The recession in the United States reduces U.S.national income,so U.S.residents reduce spending on all kinds of things,including spending on imports.The decrease in U.S.imports is a decrease in the exports of other countries,including Europe’s exports to the United States.The reduction in European exports reduces production in Europe,so the growth of real GDP in Europe declines.A recession in the United States is likely to lower the growth of European real GDP.4. a.The spending multiplier in this small open economy is about 1.82(=1/(0.15+0.4)).If real spending initially declines by $2billion,then domestic product and income will decline by about $3.64billion (=1.82×$2billion)b.If domestic product and income decline by $3.64billion,then the country's imports will decline by about $1.46billion (=$3.64billion ×0.4).c.The decrease in this country's imports reduces other countries'exports,so foreign product and income decline.d.The decline in foreign product and income reduce foreign imports,so the first country's exports decrease.This reinforces the change (decline)in the first country's domestic product and income—an example of foreign-income repercussions.6.External balance is the achievement of a reasonable and sustainable makeup of acountry's overall balance of payments with the rest of the world.While specifying a precise goal is not simple,we often presume that achieving a balance of approximately zero in a country's official settlements balance is external balance.The FE curve shows all combinations of interest rate and domestic product that result in a zero balance for the country's official settlements balance.Thus,any point on the FE curve is consistent with this concept of external balance.。
国际金融托马斯A普格尔第二章

• Bilateral arbitrage with bid-ask spreads
➢ No-arbitrage condition: (FC/DC)bid*(DC/FC)bid ≤ 1,
• Foreign exchange quotation
➢Direct quotation: the amount of DC required to purchase one unit of FC(直接标价)
➢Indirect quotation: the amount of FC required to purchase one unit of DC(间接标价)
国际金融托马斯A普格尔 第二章
2020年5月24日星期日
• Three Significances of the foreign exchange market
The foreign-exchange market is by far the largest and most liquid market in the world.
➢ Solution 2:
•$/€: 0.9836/39 •€/£: 1.5473/1.5480
Imaging you want to convert dollar into
pound: using dollar to buy euro first (1$
=1/0.9839€), and then using the euro to buy pound (1€=1/1.5480£). The resulting cross-rate is 1$ =0.6566 £, or 1£= 1.5231$
托马斯.A.普格尔_国际贸易_英语chap007

McGraw-Hill/Irwin
© 2007 The McGraw-Hill Companies, Inc., All Rights Reserved.
How about the change of trade triangle in three figures?
McGraw-Hill/Irwin
What happen of the size of trade triangle in figure 6.1 when the consumption of wheat increase?
McGraw-Hill/Irwin
© 2007 The McGraw-Hill Companies, Inc., All Rights Reserved.
McGraw-Hill/Irwin
© 2007 The McGraw-Hill Companies, Inc., All Rights Reserved.
Figure 7.2 – Single-Factor Growth: The Rybczynski Theorem
McGraw-Hill/Irwin
McGraw-Hill/Irwin
© 2007 The McGraw-Hill Companies, Inc., All Rights Reserved.
What’s the sources of long-run economic growth?
Increase in countries’ endowments of production factors
Balanced versus biased growth
Growth in only one factor
国际金融 托马斯·普格尔 英文 名词解释

1.The current account includes all debit and credit items that are exports and imports of goods and services, income receipts and income payments, and gifts.2.A financial account is a component of a country’s balance of payments that covers claims on or liabilities to nonresidents, specifically with regard to financial assets.3.Official international reserve assets are money-like assets that are held by governments and that are recognized by governments as fully acceptable for payments between them.4.Statistical Discrepancy is the net result of errors and omissions on both the credit and debit sides.5.The overall balance should indicate whether a country’s balance of payments has achieved an overall pattern that is sustainable over time.6.Arbitrage, the process of buying and selling to make a riskless pure profit, ensures that rates in different locations are essentially the same, and that rates and cross-rates are related and consistent among themselves.C4-C51.A hedge is an investment to reduce the risk of adverse price movements in an asset. Normally,a edge consists of taking an offsetting position in a related security.2.Speculation is the act of conducting a financial transaction that has substantial risk of losing all value but with the expectation of a significant gain.3.A forward premium is a situation in which the forward or expected future price for a currency is greater than the spot price. It is an indication by the market that the current domestic exchange rate is going to increase against the other currency.4.A forward discount is a situation in which the forward or expected future price for a currency is less than the spot price. It is an indication by the market that the current domestic exchange rate is going to decline against another currency.5.Purchasing power parity (PPP) is an economic theory that compares different countries' currencies through a "basket of goods" approach.6.In the short run the actual exchange rate overshoots its long-run value and then reverts back toward it.C6-C71.Sterilization intervention is the reverse operation on domestic market through open market operation to achieve the purpose of constant local currency supply.2. Deficit without tear is a deficit that a country with a key currency, a fixed exchange rate without foreign exchange controls, can eliminate by avoiding strict adjustments such as austerity in its economy.3.Moral hazard occurs when someone increases their exposure to risk when insured, especially when a person takes more risks because someone else bears the cost of those risks. A moral hazard may occur where the actions of one party may change to the detriment of another after a financial transaction has taken place.1.The spend multiplier for a small open economy is ΔY/ΔG=1/S+M(s, the marginal propensity to save.m,the marginal propensity to import).It measures fiscal policy effects on the economy. Any change in the government’s activities will have a significant impact on a country’s economy and consumer purchase power.2.The locomotive theory posits that growth in one or more large economies can raise growth in other small countries that trade with these large countries.3.Foreign-income repercussions:The more our country’s imports affect foreign incomes, and the more the foreign countries have propensity to import from our country,the more our true spending multiplier exceeds the simple formula.4.The marginal propensity to import increase when income goes up by 1 dollar.m=dm/dy5.Internal balance: Full employment, or an acceptably low unemployment rate;Price stability,or an acceptably low inflation rate.6.External balance:Sustainable composition of the country’s balance of payments with the rest of world;Useful indicator, official settlements balance approximately equal to 0.7.Assignment rule: Assign to fiscal policy the task of stabilizing the domestic economy only, and assign to monetary policy the task of stabilizing the balance of payment only.。
托马斯.A.普格尔_国际贸易_英语chap009

2.
3.
4.
McGraw-Hill/Irwin
© 2007 The McGraw-Hill Companies, Inc., All Rights Reserved.
Chapter9
The import quota进口配额
Why protectionists and government officials may favor using quota instead of a tariff?
1.Your initial recognition
2.External effect It costs a particular amount of money
3.This the reality : one dollar, one vote metric
McGraw-Hill/Irwin © 2007 The McGraw-Hill Companies, Inc., All Rights Reserved.
2.The import quota进口配额
McGraw-Hill/Irwin
© 2007 The McGraw-Hill Companies, Inc., All Rights Reserved.
Chapter9
The import quota进口配额
Import
(maximum) total quantity of imports of a product allowed into a country during a period of time
© 2007 The McGraw-Hill Companies, Inc., All Rights Reserved.
McGraw-Hill/Irwin
国际金融英文版(托马斯.A.普格尔 著)---Chapter 3

direct quotation: 1 foreign currency unit = x home currency units indirect quotation: 1 home currency unit = x foreign currency units
THE BASICS OF CURRENCY TRADING
An exchange system quotation is given by stating the number of units of "term currency" (or "price currency" or "quote currency") that can be bought in terms of 1
The Foreign Exchange Market
The basics of currency trading
Demand and supply for foreign exchange Exchange rate system
Arbitrage in the foreign exchange market
THE BASICS OF CURRENCY TRADING
What is exchange rate?
Exchange rate is the price of one nation’s money in terms of another nation’s money. Exchange rate is the rate used by the market participants to convert one currency into another currency. Exchange rates (also known as the foreign-exchange rate, forex rate or FX rate) between two currencies specifies how much one currency is worth in terms of the other.
托马斯.A.普格尔_国际贸易_英语chap002
McGraw-Hill/Irwin lectured by Dengxiaofang
© 2007 The McGraw-Hill Companies, Inc., All Rights Reserved.
Figure 2.1 – Demand and Supply for Motorbikes
McGraw-Hill/Irwin lectured by Dengxiaofang
Importing country Exporting country
Note: one –dollar, one-vote metric (measurement of the net effect of a change using the assumption that each dollar of gain or loss to different individuals and groups is valued equally ) . why do we need such assumption?
Could you answer these questions by your intuition?
McGraw-Hill/Irwin lectured by Dengxiaofang
© 2007 The McGraw-Hill Companies, Inc., All Rights Reserved.
quantity
Which one is more elastic?
McGraw-Hill/Irwin lectured by Dengxiaofang
© 2007 The McGraw-Hill Companies, Inc., All Rights Reserved.
International Trade(14 Edition) 托马斯A普格尔课后习题双数题参考答案

Answers to Even Problems for Thomas Pugel,International Economics Text (14th Edition)TRADE MODULEChapter 1International Economics Is DifferentOverviewThe introduction to the subject of international economics has three major purposes:1. Show that international economics addresses important and interesting current events and issues.2. Show why international economics is special.3. Provide a broad overview of the book.We begin with four controversies that show the importance of current issues addressed by international economics.The first is the rise of international outsourcing (or offshoring) of service activities and jobs from the United States and other industrialized countries to India and other developing countries. Here we introduce the idea that business activities that would be normal and almost unnoticed if they occur within a country can become prominent political issues when they cross national boundaries. A business is always looking for ways to lower costs, and buying inputs from outside suppliers rather than making the inputs itself is one of its standard choices. But buying business services such as telephone call centers and software development from India affects white-collar workers in the industrialized countries. Such a shift can lead to substantial media attention, even though the overall size of the outsourcing is not that large. Even though international outsourcing is just another form of international trade that generally brings national gains overall, political pressures push government officials to do something to defend local jobs. In this case the options for government policies that can reduce the outsourcing are limited, but there have been proposals to prohibit government contracts with private firms if they offshore some of the work.The second is international migration, especially the increasingly vehement complaints about immigrants in many of the major receiving countries. In these countries a rather large (10 percent or more) and rising percentage of the population is foreign-born, including many who are in their new countries illegally. Opponents accuse immigrants of causing general economic harm, imposing fiscal costs as immigrants use government services, and increasing crime. International economics is often about emotional issues like immigration, yet we do our best to use economic analysis to think objectively about actual economic effects. In a preview of the analysis of Chapter 15, we can reach two key conclusions about the effects of immigration on the receiving country. First, as with many issues in international economics, there are both winners and losers in the receiving country. Second, we can determine the net effect on the receiving country. Aswe often conclude when we examine freer international exchange, the net national effect of immigration is positive according to the basic economic model, in this case even if we ignore the gains to the immigrants themselves.The third controversy is the exchange rate value of the Chinese yuan. From the mid-1990s to 2005, the Chinese government maintained a fixed exchange rate of the yuan to the U.S. dollar. As China’s trade surplus increased and the Chinese government continually had to enter the foreign exchange market to buy dollars and sell yuan to keep the exchange rate steady, the United States and the European Union increasingly complained about the fixed rate and urged the Chinese government to allow the yuan to rise in value. In 2005 the Chinese government implemented a small revaluation of the yuan, and then it allowed gradual appreciation of the yuan. Yet, the trade surplus continued to increase into 2007, and foreign complaints grew.In the controversy over China’s exchange rate policy, we can see many of the issues that we will examine in Parts Three and Four of the book, including the measurement and meaning of a country’s balance of payments (including its trade balance), government policies toward the foreign exchange market and how a government defends a fixed exchange rate against market pressure for the exchange rate value to change, foreign financial investments and the role of currency speculators, political pressures that can place limits on how long a country with a fixed exchange rate and a trade surplus can maintain the fixed rate value, and how exchange rates affect not only a country’s trade balance, but also its national macroeconomic performance (including production, employment, and inflation).The fourth controversial development is the rising number and importance of sovereign wealth funds—vehicles for national governments to seek high returns on their foreign financial investments. For some countries that have sovereign wealth funds, the national wealth to invest internationally comes from general intervention in the foreign exchange market (example, China); for other countries the wealth comes from foreign sales of crude oil or other commodities. Controversy arises from the close link of national governments to the foreign investments. A government that has a sovereign wealth fund could alter its national economic policies to make larger financial gains on its investments, or it may use these investments to further its foreign political objectives or other nonfinancial objectives. These concerns have some plausibility, because a national government has the power to make decisions and take actions to pursue its national goals even if other countries view the effects of these decisions and actions as harmfulto their national economies or interests. There is little evidence that anything nefarious has actually occurred as sovereign wealth funds have made their foreign investments. Still, most of these funds are secretive, so the suspicions and controversy stay alive.These four controversies show that international economics addresses important current issues. They also can be used to show why international economics is special—why national boundaries matter in economics. The first reason that international economics is special is that some resources do not move freely between countries. Land is essentially immobile. There are substantial impediments to the movement of labor internationally, as we see in the analysis of international migration, because the personal and economic costs to people of moving from one country to another can be substantial, and because government policies often restrict international movements of labor. Financial capital moves more freely, but there still seems to be a home bias to many people’s financial investments.The second reason that international economics is special is that national government policies matter—in fact, they matter in two ways. One way is that national governments can adopt policies toward international transactions. This is seen in the discussion of political efforts to limit international outsourcing. The other way is that national governments adopt different economic policies. These national policies usually are designed to serve national interests, but they often have international effects. The tension between national interests and international effects is raised in the discussions of China’s exchange rate policy and sovereign wealth funds. Tips for teachingOne good way to begin the first class session is with a look at current events, even before the mechanics and requirements of th e course are presented. The instructor might use the day’s newspaper (for instance, the Financial Times or Wall Street Journal) or the week’s magazine (for instance, the Economist or Business Week) to highlight a few stories related to the content of the c ourse. We have found that this is good way to get the students’ attention and interest. Another good beginning would be to provide a discussion that updates one or more of the four controversies in Chapter 1. For example, the instructor could look at the most recent information on China’s trade balance and the exchange rate value of its yuan.You may want to consider beginning other class sessions of the course (not only the first class session) with a look at one or two stories in that day’s newspaper. The stories should relate in some way to the material covered in the course, but they do have to relate to the specific material covered in that day’s session. We have found that this look at current events reinforces the relevance of international economic analysis. It also encourages students to read a good newspaper or magazine and to keep up with current events. In addition, we can model critical reading, if we both summarize the article’s information and offer our own opinion or analysis (or ask the students for their opinions).The instructor may also point out that there is a lot of information on international issues available on the World Wide Web. Figure A.1 in Appendix A provides a list of some important sites.One issue in teaching is to get student s to “take ownership” of the learning of the material. One good way to accomplish this is to get them to teach some of the material. In doing so they gain greater understanding as well as appreciation for the applicability of what sometimes sound like dry concepts and abstract issues. You may want to consider an assignment like the one that Pugel (and others at New York University) have been using successfully. It asks students working in groups to choose a topic based on current and recent events or developments and prepare and make a brief presentation to the rest of the class, during the second half of the course term. The accompanying pages under the heading “Sample Assignment” show a version of this assignment. It is good to get such an assignment set up early in the term, so that students have enough time to gather information and prepare the talk. One more thought--In evaluating each presentation, you may want to get the students in audience involved by asking each to complete a brief evaluation form for each presentation.Sample assignmentNEW YORK UNIVERSITYPRIVATEStern School of BusinessThe Global EconomyGroup PresentationsEach group will give a presentation to the class from one of the topics listed below. Your presentation is an opportunity to hone your research and presentation skills, to apply concepts from this course (and possibly from other courses), to attack a real issue, and to show off your creativity.A presentation will last no longer than 14 minutes. In addition, you will have 3 minutes for questions from the class. I suggest you plan a talk that fills about 12 or 13 minutes to ensure that you finish within time. Going over the time limit for the presentation will result in a lower evaluation score for “style” and overall assessme nt.For the oral part of the presentation, all group members must be involved in speaking. One aspect of the presentation is the ability to transition from one group member to the next as eachin turn makes part of the presentation.Evaluation will be based on three criteria:Informativeness: How much did we learn from your presentation? Analysis and interpretation: Did you effectively analyze and/or interpret the information that you have on the topic? Did we gain novel insights into the topic? Style: Was your presentation clear and compelling? Were the slides effective? Did you keep within the time limit?Above all, keep your classmates interested. If you use PowerPoint, you should bring your presentation to class on a USB memory stick or CD with the presentation file.Presentation TopicsChoose your topic from the list below. Topics will be allocated on a first-come, first-served basis. If you prefer a topic of your own devising, let me know and we’ll discuss it.Each topic comes with a series of questions. There is some scope to modify the questions, if you think it would lead to a more interesting presentation. Just ask me first.After you know your topic, the group should search for information and start to plan the presentation. After you have an idea of what you will talk about, make an appointment to meet with me. You should come to speak with me at least once before giving your presentation. For many topics you can find much information on the Web. With Web research, it is up to you to verify that a source is credible and accurate.Here are the suggested topics.ASEANThe member countries of ASEAN have committed to forming a true free trade area. What are the goals for this AFTA? How much progress has been made? Why has progress not been faster? Are there important issues that seem to thwart or limit the effort? What will happen over the next five years or so?CAFTAThe United States, Costa Rica, El Salvador, Guatemala, Honduras, Nicaragua, and the Dominican Republic signed the Central American Free Trade Agreement in 2004. What are the key features of the agreement? Why did the various national governments push to reach the agreement? Why has ratification and implementation been rather slow? What will happen in the next three to five years?Byrd AmendmentDefine what this U.S. government policy is and how it works. Why did this policy lead to a dispute settlement case in the WTO? What did the WTO decide? What is the current state of the dispute? Should the United States have more forcefully resisted the WTO pressure to change thispolicy?CottonU.S. policies toward cotton have become globally controversial. What are these policies? What effects do they have on the global cotton market? Why have the policies become controversial? How has the WTO been involved in efforts to alter U.S. cotton policies? What is the outlook for the next several years?Russia and the WTORussia has been in negotiations to join the WTO. What is the process for Russia to accede to membership? How far along is the process? What are the major issues that have been resolved, and what major issues still must be resolved? What is your prediction for when Russia will join? Oil PricesCrude oil prices have increased dramatically since the late 1990s. Is this the reemergence of OPEC as an effective cartel? What is the evidence that OPEC has had an impact? What is the evidence that other factors matter? What do you think will happen to oil prices in the next five years?Malaysia: Did Capital Controls Work?Thailand and Malaysia followed different paths during the Asian crisis, with Malaysia imposing capital controls while Thailand maintained capital mobility. Which worked better? Did Malaysia benefit from reducing its “exposure” to international capital flows?EcuadorEcuador dollarized in 2000. Why did the Ecuadorian government choose this policy? In what ways does it seem to have helped the Ecuadorian economy? In what ways has it hurt or caused problems or costs? Do you think that it was a good or bad idea for Ecuador to dollarize? China’s Yuan Exchange RateThe United States and the European Union have been pressing China’s government to alter its exchange rate policy to allow more flexibility, presumably so that the yuan will appreciate by a substantial amount. What has been an d are China’s policies toward the foreign exchange market? From the point of view of China’s government and the well-being of the Chinese economy and people, what are the main reasons for the Chinese government to allow more flexibility and (probably) subs tantial yuan appreciation? What are the main reasons for China’s government to maintain its current exchange rate policy? What do you think will actually happen in the next two to three years?Euro Area ExpansionThe total number of euro-using countries is now fifteen. But that leaves twelve current EU members still using their national currencies. What is the process for gaining approval to adopt the euro? Which of these other twelve EU members will probably adopt the euro in the next five to ten years? Which will probably not? What are the reasons for these differences?Chapter 2The Basic Theory Using Demand and SupplyOverviewThis chapter indicates why we study theories of international trade and presents the basic theory using supply and demand curves. Trade is important to individual consumers, to workers and other factor owners, to firms, and therefore to the whole economy. The new box, “Trade: Increasingly Important,” provides useful data about the types of products traded and the relatively rapid growth of trade.Trade is also contentious, with perpetual battles over government policies toward trade. To understand the controversy, we need to develop theories of why people trade as they do.It is useful to organize the analysis of international trade by contrasting a world of no trade with a world of free trade, leaving analysis of intermediate cases (e.g., non-prohibitive tariffs) for Part Two. The analysis seeks to answer four key questions about international trade:1.Why do countries trade? What determines the pattern of trade?2.How does trade affect production and consumption in each country?3.What are the gains (or losses) for a country as a whole from trading?4.What are the effects of trade on different groups in a country? Are there groups thatgain and other groups that lose?Theories of international trade provide answers to these four questions.Basic demand and supply analysis can be used to provide early answers to these four questions, as well as to introduce concepts that can be used in more elaborate theories. Using motorbikes as an example, the chapter first reviews the basic analysis of both demand (the demand curve and the role of the product’s price, other influences on quantity demanded, movements along the demand curve and shifts in the demand curve, and the price elasticity of demand as a measure of responsiveness) and supply (the supply curve, the role of marginal cost, other influences on quantity supplied, movements along the supply curve and shifts in the supply curve, and the price elasticity of supply). It pays special attention to the meaning and measurement of consumer surplus and producer surplus. This section, which focuses on review and development of basic tools, ends with the picture of market equilibrium in a national market with no trade as the intersection of the domestic demand curve and the domestic supply curve.The remainder of the chapter examines the use of supply and demand curves to analyze international trade. If there are two national markets for a product and no trade between them, it is likely that the product’s price will differ between the two markets. Someone should notice the difference and try to profit by arbitrage between the two markets. If governments permit free trade, then the export supply from the initially low-priced market (the rest of the world in the textbook example) can satisfy the import demand in the initially high-priced market (the United States in the textbook example), and the world shifts to a free-trade equilibrium. We can show this free trade equilibrium by deriving the supply-of-exports curve for the rest of the world and the demand-for-imports curve for the United States. The international market for the product clears at the intersection of the export-supply and import-demand curves, indicating the equilibrium international or world price and the quantity traded. This equilibrium world price also becomes the domestic price in each country with free trade.The same set of three graphs (the two national markets and the international-trade market) is used to show the effects of the shift from no-trade to free-trade on different groups in each country and to show the net gains from trade for each nation. In the importing country consumers of the product gain consumer surplus and producers of the product lose producer surplus. Using the one-dollar, one-vote metric, the country as a whole gains, because the gain in consumer surplus is larger than the loss of producer surplus. In the exporting country producers of the product gain producer surplus and consumers of the product lose consumer surplus. The analysis shows that the country as a whole gains because the gain in producer surplus is larger than the loss of consumer surplus. Furthermore, the country that gains more from the shift to free trade is the country whose price changes more—the country with the less elastic trade curve (import demand or export supply).TipsWe believe that this chapter is an excellent way to introduce the analysis of trade. The four questions about trade focus student attention on key issues that are interesting to most of them. Students then get a quick payoff through the use of the familiar supply-demand framework. By the end of this short chapter we have preliminary answers to all four trade questions. We have also laid a solid foundation for the analysis of trade using supply and demand curves, the approach that will receive the most attention in Part Two on trade policies.In class presentations it may be useful to show the graphs in a sequence, perhaps using a series of slides. After presenting the review of demand and supply and the national market equilibrium with no trade, the following sequence works well.1.Two national market graphs with no trade, one with a high no-trade price (the United States),and one with a low no-trade price (the rest of the world, or ROW). Question to the class: “If you were the first person to notice this situation, could you make a profit?” This is a goodway to motivate international trade driven by arbitrage.The U.S. national market graph and the international market graph. Question to the class: “Let’s say that the United States is willing to open up to free trade and integrate into the world market. If it does this, the world price will also be the price within the United States. How much will the United States want to import?” It depends on what the world price is. The instructor can pick one or twohypothetical world price(s) (below the no-trade U.S. price), and measure the gap between domestic quantity demanded and domestic quantity supplied. This is the U.S. demand for imports, and these import quantity-price combinations can be used to plot the U.S. demand-for-imports curve in the international market.2. A graph of the international market and the ROW national market. A comparable discussionto item 2 above, to derive the supply-of-exports curve.3.Superimpose the graphs from item 2 on the graphs from item 3. Question to the class: “Whatwill happen with free trade? When there is ongoing free trade, what is the equilibrium world price?” This set of three graphs can be used to show the free-trade equilibrium: world price, quantity traded, and quantities produced and consumed in each country.4. A single graph showing the U.S. national market, to contrast no trade with free trade.Questions to the class: “What group is made happier by the shift from no trade to free trade?What group is a loser? Can we somehow say that the country gains from free trade?”5. A single graph showing the ROW national market, with the same questions in item 5. Subsequent chapters in Part I present additional theories of trade. The figure shown on the accompanying page provides a summary of the key features of these theories. It may be useful to copy and distribute this figure to your students. If it is distributed when the class begins to study the material, it can serve as a roadmap. If it is distributed when the class finishes the lectures on the material, it can serve as a summary and review.For instructors who want to begin with the discussion of absolute and comparative advantage rather than with the supply-and-demand framework that focuses on a single product, this should be possible. After covering the introductory material (the first two pages of Chapter 2, and, possibly, the box “Trade: Increasingly Important”), the course would skip to Chapter 3. The remaining material from Chapter 2 on the supply and demand analysis can be inserted right after Chapter 4’s section referring to analysis using supply and demand curves, or this material can be presented as a separate topic elsewhere in the course.Suggested answers to questions and problems(in the textbook)2. Producer surplus is the net gain to producers from being able to sell a product through amarket. It is the difference between the lowest price at which some producer is willing to supply each unit of the product and the actual market price that is paid, summed over all units that are produced and sold. The lowest price at which someone is willing to supply the unit just covers the extra (marginal) cost of producing that unit. To measure producer surplus for a product using real world data, three major pieces of information are needed. First, the market price. Second, the quantity supplied. Third, some information about the slope (or shape) of the supply curve. How would quantity supplied change if the market price decreased? Or, what are the extra costs of producing each unit up to the actualquantity supplied? Producer surplus could then be measured as the area below the market price line and above the supply curve.4. The country's demand for imports is the amount by which the country's domestic quantitydemanded exceeds the country's domestic quantity supplied. The demand-for-imports curve is derived by finding the difference between domestic quantity demanded anddomestic quantity supplied, for each possible market price for which quantity demanded exceeds quantity supplied. The demand-for-imports curve shows the quantity that the country would want to import for each possible international market price.6.If there were no exports of scrap iron and steel, the domestic market would clear at the price at which domestic quantity demanded equals domestic quantity supplied. But the United States does export scrap iron and steel. The extra demand from foreign buyers increases the market price of scrap iron and steel. Domestic users of scrap iron and steel pay a higher price than they would if there were no exports. Thus, some support aprohibition on these exports, in order to lower the market price of the scrap that they buy. 8. a. With free trade at $67 per barrel:Domestic production Q S : 67 = 0.5 + 35Q S , or Q s = 1.9 billion barrels.Domestic consumption Q D : 67 = 291 - 40Q D , or Q D = 5.6 billion barrels.b. With no imports, domestic quantity supplied must equal domestic quantity demanded Price ($/barrel) 67 1.9 5.6 Quantity (billions of barrels) S US D US(both equal to Q N ) at the domestic equilibrium price P N :291 - 40Q N = 0.5 + 35Q N , or Q N = 3.87 billion barrels produced and consumed.Using one of the equations, we can calculate that the domestic price would be about $136 per barrel.c. Domestic producers of oil would gain, receiving an increase of producer surplus shownas area o in the graph. Domestic consumers of oil would lose, experiencing a loss of consumer surplus shown as area o + i + l in the graph.10. The supply curve S US shifts down (or to the right). The U.S. demand-for-imports curveD m shifts to the left (or down). The equilibrium international price decreases below 1,000—it is shown by the intersection of the new U.S. D m curve and the original S x curve.12. a. In the graphs below, the free trade equilibrium price is P F , the price at which the quantityof exports supplied by Country I equals the quantity of imports demanded by Country II. (The quantity-of-imports demanded curve for country II is the same as the country's regular demand curve.) This world price is above the no-trade price in country I. The quantity traded with free trade is Q T .Price ($/barrel) 136 1.9 3.87 5.6 Quantity(billions of barrels)S US o i l D US 67P P P T T T。
托马斯A普格尔《国际金融》课件

Solution 2: Imaging you want to convert dollar into pound: using dollar to buy euro first (1$ =1/0.9839€), and then using the euro to buy pound (1€=1/1.5480₤). The resulting cross-rate is 1$ =0.6566 ₤, or 1₤= 1.5231$ If you want to convert pound into dollar: using pound to buy euro first (1₤ =1.5473€), and then using the euro to buy dollar (1€=0.9836 $). The resulting cross-rate is 1₤ =1.5219$, or 1$ =0.6571₤. So, the effective $/₤ bid and ask cross-rates is $/₤=1.5219/31, and the effective ₤/$ bid and ask cross-rates is ₤/$=0.6566/71
Cross-rate calculations with bid-ask spreads • Example 2.1: consider the following quotes involving the dollar, pound, and the euro. $/€: 0.9836/39 €/₤: 1.5473/1.5480 Compute the effective $/₤ bid and ask cross-rates, as well as the ₤/$ bid and ask cross-rates?
托马斯.A.普格尔 国际贸易 英语chap015
Multinationals and Migration: International Factor Movements
McGraw-Hill/Irwin
© 2007 The McGraw-Hill Companies, Inc., All Rights Reserved.
Foreign Direct Investment (FDI)
McGraw-Hill/Irwin
© 2007 The McGraw-Hill Companies, Inc., All Rights Reserved.
Should the home country restrict FDI outflow? Should the host country restrict FDI inflows?
McGraw-Hill/Irwin
© 2007 The McGraw-Hill Companies, Inc., All Rights Reserved.
Examples of FDI and Portfolio Investments
McGraw-Hill/Irwin
© 2007 The McGraw-Hill Companies, Inc., All Rights Reserved.
Table: Transfer Price Affects Global After-Tax Profit
McGraw-Hill/Irwin
© 2007 The McGraw-Hill Companies, Inc., All Rights Reserved.
Why Do MNEs Exist?
Flow definition: Flow of funding provided by investors (usually firms) to establish or acquire foreign companies or to expand or finance existing foreign companies that the investors own. Key is sufficient ownership to control or influence the management of the foreign company. Stock definition: Total value of existing funding (equity and debt) of foreign companies that has been provided by investors that own these foreign companies.
托马斯A普格尔国际贸易英语chap011_图文

Export subsidy and no countervailing duty
Contervailing duty is bad for the country imposing it but good for the whole world.
The net national loses w+z when importing country imposes countervailing duty.
The export price is lower than the full unit cost (including a profit margin).
Types
Predatory dumping
A low export price used by the exporting firm with the intention to drive its competitors in the importing country out of business
Dumping
Selling exports at a price that is “too low,” a price below “normal value” or “fair market value.”
The export price is lower than the price charged for comparable domestic sales in the home market of the exporter.
Actual antidumping policies
The WTO rules permit countries to retaliate against dumping, if the dumping injures domestic importcompeting producers.
托马斯A普格尔《国际金融》课件
midpoint price: the average of the bid price and the ask price basic point: usually 0.0001 (0.01 for JPY) or 0.01%
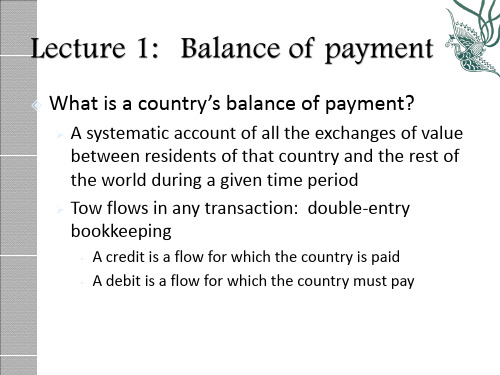
What is a country’s balance of payment?
A systematic account of all the exchanges of value between residents of that country and the rest of the world during a given time period Tow flows in any transaction: double-entry bookkeeping
15
Solution 1:
($/₤)bid = ($/€)bid*(€/₤)bid = 0.9836*1.5473 = 1.5219 dollar per pound bid rate ($/₤)ask = ($/€)ask*(€/₤)ask = 0.9839*1.5480 = 1.5231 dollar per pound ask rate (₤/$)bid = (₤/€)bid*(€/$)bid = [1/(€/₤)ask]*[1/($/€)ask] = (1/1.5480)*(1/0.9839) = 0.6566 pound per dollar bid rate (₤/$)ask = (₤/€)ask*(€/$)ask = [1/(€/₤)bid]*[1/($/€)bid] = (1/1.5473)*(1/0.9836) = 0.6571 pound per dollar ask rate So, the effective $/₤ bid and ask cross-rates is $/₤=1.5219/31, and the effective ₤/$ bid and ask cross-rates is ₤/$=0.6566/71
国际贸易 托马斯.A.普格尔 中国人民大学出版社 英文第15版
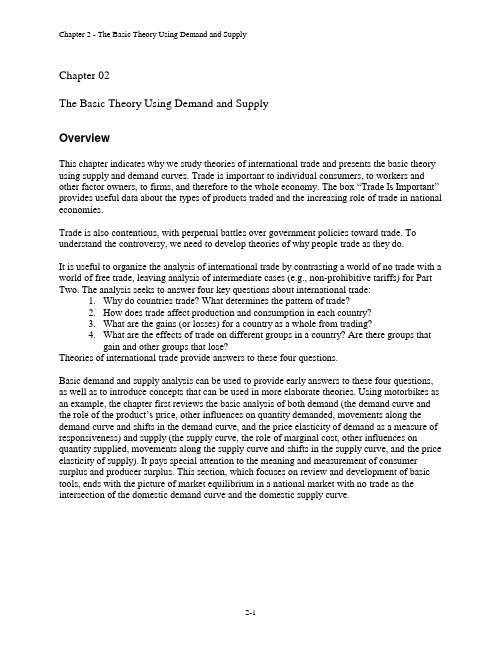
Chapter 02The Basic Theory Using Demand and SupplyOverviewThis chapter indicates why we study theories of international trade and presents the basic theory using supply and demand curves. Trade is important to individual consumers, to workers and other factor owners, to firms, and therefore to the whole economy. The box “Trade Is Important” provides useful data about the types of products traded and the increasing role of trade in national economies.Trade is also contentious, with perpetual battles over government policies toward trade. To understand the controversy, we need to develop theories of why people trade as they do.It is useful to organize the analysis of international trade by contrasting a world of no trade with a world of free trade, leaving analysis of intermediate cases (e.g., non-prohibitive tariffs) for Part Two. The analysis seeks to answer four key questions about international trade:1.Why do countries trade? What determines the pattern of trade?2.How does trade affect production and consumption in each country?3.What are the gains (or losses) for a country as a whole from trading?4.What are the effects of trade on different groups in a country? Are there groups thatgain and other groups that lose?Theories of international trade provide answers to these four questions.Basic demand and supply analysis can be used to provide early answers to these four questions, as well as to introduce concepts that can be used in more elaborate theories. Using motorbikes as an example, the chapter first reviews the basic analysis of both demand (the demand curve and the role of the product’s price, other influences on quantity demanded, movements along the demand curve and shifts in the demand curve, and the price elasticity of demand as a measure of responsiveness) and supply (the supply curve, the role of marginal cost, other influences on quantity supplied, movements along the supply curve and shifts in the supply curve, and the price elasticity of supply). It pays special attention to the meaning and measurement of consumer surplus and producer surplus. This section, which focuses on review and development of basic tools, ends with the picture of market equilibrium in a national market with no trade as the intersection of the domestic demand curve and the domestic supply curve.The remainder of the chapter examines the use of supply and demand curves to analyze international trade. If there are two national markets for a product and no trade between them, it is likely that the product’s price will differ between the two markets. Someone should notice the difference and try to profit by arbitrage between the two markets. If governments permit free trade, then the export supply from the initially low-priced market (the rest of the world in the textbook example) can satisfy the import demand in the initially high-priced market (the United States in the textbook example), and the world shifts to a free-trade equilibrium. We can show this free trade equilibrium by deriving the supply-of-exports curve for the rest of the world and the demand-for-imports curve for the United States. The international market for the product clears at the intersection of the export-supply and import-demand curves, indicating the equilibrium international or world price and the quantity traded. This equilibrium world price also becomes the domestic price in each country with free trade.The same set of three graphs (the two national markets and the international-trade market) is used to show the effects of the shift from no-trade to free-trade on different groups in each country and to show the net gains from trade for each nation. In the importing country consumers of the product gain consumer surplus and producers of the product lose producer surplus. Using the one-dollar, one-vote metric, the country as a whole gains, because the gain in consumer surplus is larger than the loss of producer surplus. In the exporting country producers of the product gain producer surplus and consumers of the product lose consumer surplus. The analysis shows that the country as a whole gains because the gain in producer surplus is larger than the loss of consumer surplus. Furthermore, the country that gains more from the shift to free trade is the country whose price changes more—the country with the less elastic trade curve (import demand or export supply).TipsWe believe that this chapter is an excellent way to introduce the analysis of trade. The four questions about trade focus student attention on key issues that are interesting to most of them. Students then get a quick payoff through the use of the familiar supply-demand framework. By the end of this short chapter we have preliminary answers to all four trade questions. We have also laid a solid foundation for the analysis of trade using supply and demand curves, the approach that will receive the most attention in Part Two on trade policies.In class presentations it may be useful to show the graphs in a sequence, perhaps using a series of slides. After presenting the review of demand and supply and the national market equilibrium with no trade, the following sequence works well.1.Two national market graphs with no trade, one with a high no-trade price (the United States),and one with a low no-trade price (the rest of the world, or ROW). Question to the class: “If you were the first person to notice this situation, could you make a profit?” This is a good way to motivate international trade driven by arbitrage.2.The U.S. national market graph and the international market graph. Question to the class:“Let’s say that the United States is willing to open up to free trade and integrate into the world market. If it does this, the world price will also be the price within the United States.How much will the United States want to import?” It d epends on what the world price is. The instructor can pick one or two hypothetical world price(s) (below the no-trade U.S. price), and measure the gap between domestic quantity demanded and domestic quantity supplied.This is the U.S. demand for imports, and these import quantity-price combinations can be used to plot the U.S. demand-for-imports curve in the international market.3. A graph of the international market and the ROW national market. A comparable discussionto item 2 above, to derive the supply-of-exports curve.4.Superimpose the graphs from item 2 on the graphs from item 3. Question to the class: “Whatwill happen with free trade? When there is ongoing free trade, what is the equilibrium world price?” This set of three graphs can be used to show the free-trade equilibrium: world price, quantity traded, and quantities produced and consumed in each country.5. A single graph showing the U.S. national market, to contrast no trade with free trade.Questions to the class: “What group is made happier by the s hift from no trade to free trade?What group is a loser? Can we somehow say that the country gains from free trade?”6. A single graph showing the ROW national market, with the same questions in item 5.Subsequent chapters in Part I present additional theories of trade. The figure shown on the accompanying page provides a summary of the key features of these theories. It may be useful to copy and distribute this figure to your students. If it is distributed when the class begins to study the material, it can serve as a roadmap. If it is distributed when the class finishes the lectures on the material, it can serve as a summary and review.For instructors who want to begin with the discussion of absolute and comparative advantage rather than with the supply-and-demand framework that focuses on a single product, this should be possible. After covering the introductory material (the first two pages of Chapter 2, and, possibly, the two boxes in the chapter), the course would skip to Chapter 3. The remaining material from Chapter 2 on the supply and demand analysis can be inserted right after Chapter 4’s section referring to analysis using supply and demand curves, or this material can be presented as a separate topic elsewhere in the course.Chapter 2 has the first of six boxes about the global financial and economic crisis that began in 2007 and became dramatically worse in 2008. The box “The Trade Mini-Collapse of 2009” documents and discusses the sharp decline in global trade that began in late 2008 (and the bounce back that occurred in 2010). With the introduction of the global crisis in Chapter One and the series of six boxes, an instructor can weave discussions of the global crisis and its aftermath throughout a course.Suggested answers to questions and problems(in the textbook)2. Producer surplus is the net gain to producers from being able to sell a product through amarket. It is the difference between the lowest price at which some producer is willing to supply each unit of the product and the actual market price that is paid, summed over all units that are produced and sold. The lowest price at which someone is willing to supply the unit just covers the extra (marginal) cost of producing that unit. To measure producer surplus for a product using real world data, three major pieces of information are needed.First, the market price. Second, the quantity supplied. Third, some information about the slope (or shape) of the supply curve. How would quantity supplied change if the market price decreased? Or, what are the extra costs of producing each unit up to the actualquantity supplied? Producer surplus could then be measured as the area below the market price line and above the supply curve.4. The country's demand for imports is the amount by which the country's domestic quantitydemanded exceeds the country's domestic quantity supplied. The demand-for-importscurve is derived by finding the difference between domestic quantity demanded anddomestic quantity supplied, for each possible market price for which quantity demanded exceeds quantity supplied. The demand-for-imports curve shows the quantity that thecountry would want to import for each possible international market price.6. If there were no exports of scrap iron and steel, the domestic market would clear at theprice at which domestic quantity demanded equals domestic quantity supplied. But theUnited States does export scrap iron and steel. The extra demand from foreign buyersincreases the market price of scrap iron and steel. Domestic users of scrap iron and steel pay a higher price than they would if there were no exports. Thus, some support aprohibition on these exports, in order to lower the market price of the scrap that they buy.8. a. With free trade at $60 per barrel:Domestic production Q S: 60 = 2 + 29Q S, or Q s = 2.0 billion barrels.Domestic consumption Q D: 60 = 325 - 50Q D, or Q D = 5.3 billion barrels.b. With no imports, domestic quantity supplied must equal domestic quantity demanded(both equal to Q N ) at the domestic equilibrium price P N :325 - 50Q N = 2 + 29Q N , or Q N = 4.09 billion barrels produced and consumed.Using one of the equations, we can calculate that the domestic price would be almost$121 per barrel.c. Domestic producers of oil would gain, receiving an increase of producer surplusshown as area o in the graph. Domestic consumers of oil would lose, experiencing a loss of consumer surplus shown as area o + i + l in the graph. Price ($/barrel)60 2.0 5.3 Quantity S US D US Price ($/barrel) 1212.0 4.09 5.3 Quantity S US o ilD US6010. The supply curve S US shifts down (or to the right). The U.S. demand-for-imports curveD m shifts to the left (or down). The equilibrium international price decreases below1,000—it is shown by the intersection of the new U.S. D m curve and the original S x curve.12. a. In the graphs below, the free trade equilibrium price is P F, the price at which the quantityof exports supplied by Country I equals the quantity of imports demanded by Country II.(The quantity-of-imports demanded curve for country II is the same as the country'sregular demand curve.) This world price is above the no-trade price in country I. Thequantity traded with free trade is Q T.P PPT TTb. In Country I producer surplus increases by area a + b + c, and consumer surplus falls byarea a + b. The net national gain from free trade is area c. In country II consumer surplus increases by area e and this is also the net national gain from trade. Because there is nodomestic production in Country II with or without trade, there is no change in producersurplus.A guide to the trade theories of Part OneWhat Forces DetermineName of Theory Trade Flows? Some Key Assumptions A. The basic theory Productivities Competition in all markets(Chapters 2-5) Factor Supplies Constant or increasing costsProduct demands Any number of productionfactors (types of labor,land, etc.)B. Supply-oriented theories of trade(special cases of the basic theory,with the demand side neutral):1. Absolute Absolute Competition in all marketsadvantage productivities Constant marginal costs(in Chapter 3) Only one factor (labor)2. Comparative Relative Competition in all marketsadvantage productivities Constant marginal costs(in Chapter 3) Only one factor (labor)3. Factor proportions Relative factor Competition in all markets(Heckscher- endowments Increasing marginal costsOhlin theory, Small number of factorsin Chapters 4-5) Technology neutralC. Additional theories of trade:1. Monopolistic Product differentiation Imperfect competitioncompetition Moderate scale De-emphasize factor(Krugman and economies suppliesothers, in Chapter 6)2. Global oligopoly Substantial internal Imperfect competition(in Chapter 6) scale economies De-emphasize factorHistory, luck, or suppliesgovernment policy3. External economies Substantial external Competition(in Chapter 6) scale economies De-emphasize factorLarge home market, supplieshistory, luck, orgovernment policy4. Technology differences, Technological innovation Competitionincluding product Technological "age" of Importance ofcycle (Vernon and the industry research andothers, in Chapter 7) development。
- 1、下载文档前请自行甄别文档内容的完整性,平台不提供额外的编辑、内容补充、找答案等附加服务。
- 2、"仅部分预览"的文档,不可在线预览部分如存在完整性等问题,可反馈申请退款(可完整预览的文档不适用该条件!)。
- 3、如文档侵犯您的权益,请联系客服反馈,我们会尽快为您处理(人工客服工作时间:9:00-18:30)。
McGraw-Hill/Irwin
© 2007 The McGraw-Hill Companies, Inc., All Rights Reserved.
Common union
A trade bloc in which the member countries remove trade barriers among themselves and adopt a common set of barriers to trade with outside countries
McGraw-Hill/Irwin
© 2007 The McGraw-Hill Companies, Inc., All Rights Reserved.
Types of economic blocs
Trade bloc : A group of countries that have agreed to have low or no barriers on trade among themselves, while maintaining regular barriers to trade with countries outside the bloc.
McGraw-Hill/Irwin
© 2007 The McGraw-Hill Companies, Inc., All Rights Reserved.
Figure 12.2 – Trade Diversion versus Trade Creation in Joining a Trade Bloc: UK Market for Imported Compact Cars
McGraw-Hill/Irwin
© 2007 The McGraw-Hill Companies, Inc., All Rights Reserved.
Other possible gains from a trade bloc
An increase in competion can reduce prices An increase in competion can lower costs of production Firms can lower costs by expanding their scale of production Increases opportunities for business invesments
Free-trade area custom union Common market Economic union
McGraw-Hill/Irwin
© 2007 The McGraw-Hill Companies, Inc., All Rights Reserved.
Free-trade area
McGraw-Hill/Irwin
© 2007 The McGraw-Hill Companies, Inc., All Rights Reserved.
Economic union
a bloc of countries that have a common market and also unify other economic policies
McGraw-Hill/Irwin
© 2007 The McGraw-Hill Companies, Inc., All Rights Reserved.
Common market
a bloc of countries ห้องสมุดไป่ตู้hat have a customs union and also allow freedom of factor flows among themselves
McGraw-Hill/Irwin
© 2007 The McGraw-Hill Companies, Inc., All Rights Reserved.
WTO rules about trade blocs
The basic WTO principle is that trade barriers should be lowered equally and without discrimination for all foreign-trading partner (MFN) But WTO rules permit some deviations from MFN under specific conditions
McGraw-Hill/Irwin
© 2007 The McGraw-Hill Companies, Inc., All Rights Reserved.
Figure 12.1 – Types of Economic Blocs
McGraw-Hill/Irwin
© 2007 The McGraw-Hill Companies, Inc., All Rights Reserved.
McGraw-Hill/Irwin
© 2007 The McGraw-Hill Companies, Inc., All Rights Reserved.
Figure 12.4 – Effects of an Embargo on Exports to Iraq
McGraw-Hill/Irwin
© 2007 The McGraw-Hill Companies, Inc., All Rights Reserved.
McGraw-Hill/Irwin
© 2007 The McGraw-Hill Companies, Inc., All Rights Reserved.
The basic theory of trade blocs: trade creation and trade diversion
Trade creation : The net volume of new trade resulting from forming or joining a trade bloc, and one source of gains in well-being from the trade bloc Trade diversion : The volume of trade shifted from low-cost outside exporters to higher-cost bloc-partner exporters, resulting from forming or joining a trade bloc, and the source of losses of wellbeing from the trade bloc.
Chapter 12
Trade Blocs and Trade Blocks
McGraw-Hill/Irwin
© 2007 The McGraw-Hill Companies, Inc., All Rights Reserved.
Outlines of chapter 12
Types of economic blocs Is trade discrimination good or bad? The basic theory of trade blocs: trade creation and trade diversion Other possible gains from a trade bloc
McGraw-Hill/Irwin
© 2007 The McGraw-Hill Companies, Inc., All Rights Reserved.
Trade creation
Area b represents two gains: gains on extra consumption of the product and gains on replacement of higher-cost by low-cost partner production
Figure 12.5 – Two Kinds of Economically Unsuccessful Embargoes
Some conclusions
the gains from a trade bloc are tied to trade creation and the losses are tied to trade diversion The lower the partner costs relative to the outside-world costs, the greater the gains. Any trade diversion will be less costly The more elastic the import demand, the greater the gains. The trade creation in response to any domestic price decline will be greater.
discussion
Is trade discrimination good or bad?
“stepping stone” (Joseph E.Stiglitz) or a “stumbling stone” (Jagdish.Bhagwati) Good sides: forming a customs union or freetrade area must be good because it is a move toward free trade Bad sides
McGraw-Hill/Irwin
© 2007 The McGraw-Hill Companies, Inc., All Rights Reserved.
Figure 12.3 – Estimates of the Effects of the North American Free Trade Area on National Incomes and Wage Rates