929397 scale data
Autodesk Nastran 2022 用户手册说明书
MPA, MPI (design/logo), MPX (design/logo), MPX, Mudbox, Navisworks, ObjectARX, ObjectDBX, Opticore, Pixlr, Pixlr-o-matic, Productstream,
Publisher 360, RasterDWG, RealDWG, ReCap, ReCap 360, Remote, Revit LT, Revit, RiverCAD, Robot, Scaleform, Showcase, Showcase 360,
TrueConvert, DWG TrueView, DWGX, DXF, Ecotect, Ember, ESTmep, Evolver, FABmep, Face Robot, FBX, Fempro, Fire, Flame, Flare, Flint,
ForceEffect, FormIt, Freewheel, Fusion 360, Glue, Green Building Studio, Heidi, Homestyler, HumanIK, i-drop, ImageModeler, Incinerator, Inferno,
Autodesk Nastran 2022
Reference Manual
Nastran Solver Reference Manual
如何在ImageJ中设置比例尺
如何在ImageJ中设置比例尺
吴旧生(浙江大学,浙江杭州)
前面曾写过利用imageJ进行灰度和长度测量的教程,从浏览和下载的量来看,还是有较多人对此感兴趣,并有部分人来信要求提供比例尺的测量方法。
测量方法如下:
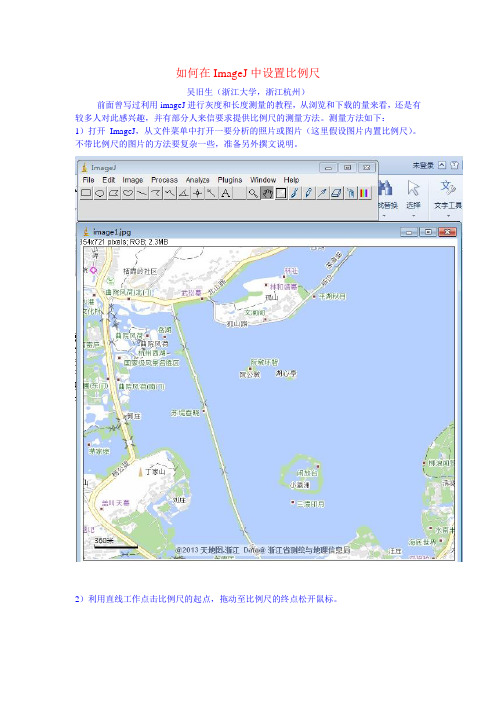
1)打开ImageJ,从文件菜单中打开一要分析的照片或图片(这里假设图片内置比例尺)。
不带比例尺的图片的方法要复杂一些,准备另外撰文说明。
2)利用直线工作点击比例尺的起点,拖动至比例尺的终点松开鼠标。
3)从analysis菜单下选择measure 命令。
取得图片上的内置比例尺的长度(像素值)。
测量结果显示比例的像素值为73.5像素。
4)根据比例尺的像素值和已知长度设置比例尺。
在analysis菜单下选择set scale进行比例尺设置。
在distance in pixels后面填入刚才获得的像素值,在known distance后面填入已知长度(如上图的360,Unit of length后面填上已知长度的单位(上例中是m)。
选定
Global前面的复选框,则比例尺可以多张图像中分享。
设置完毕,点OK搞定。
5)利用比例尺进行长度测量。
选择曲线工具,沿地图上的西湖周边设点,对合后选择analysis菜单下measure命令,结果西湖一周约9407米。
6)。
RT9293 Data Sheet
Electrical Characteristics
(VIN = 3.7V, CIN = 2.2μF, COUT = 0.47μF, IOUT = 20mA, L = 22μH, TA = 25°C, unless otherwise specified)
Parameter
Symbol
Test Conditions
z VIN Operating Range : 2.5V to 5.5V z Internal Power N-MOSFET Switch z Wide Range for PWM Dimming (100Hz to200kHz) z Minimize the External Component Counts z Internal Soft Start z Internal Compensation z Under Voltage Protection z Over Voltage Protection z Over Temperature Protection z Small TSOT-23-6 and 8-Lead WDFN Packages z RoHS Compliant and Halogen Free
RT9293
Small Package, High Performance, Asynchronies Boost for 10 WLED Driver
General Description
Features
The RT9293 is a high frequency, asynchronous boost converter. The internal MOSFET can support up to 10 White LEDs for backlighting and OLED power application, and the internal soft start function can reduce the inrush current. The device operates with 1-MHz fixed switching frequency to allow small external components and to simplify possible EMI problems. For the protection, the RT9293A provides 50V OVP and the RT9293B provides 50V/20V OVP to allow inexpensive and small-output capacitors with lower voltage ratings. The LED current is initially set with the external sense resistor RSET. The
三和激光功率计LP10说明书
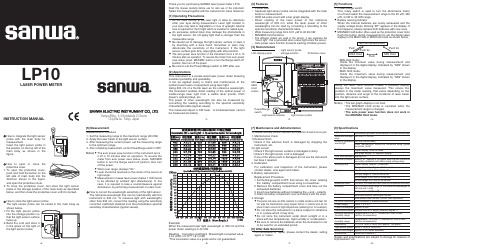
•••••Thank you for purchasing SANWA laser power meter LP10.Read this manual carefully before use for safe use of the instrument. Retain this manual together with the instrument for future reference.[1] Operating PrecautionsDo not stare directly at the laser light or allow its reflections enter your eyes during measurement. Laser light incident to your eyes may lead to degradation or loss of eyesight. Special care is required for the IV light which is invisible for naked eyes.An excessive optical input may damage the photodiode in the light sensor. Do not apply light that is stronger than the measurable range .Be careful not to damage the light sensor surface or stain it by douching with a bare hand. Scratches or stain may deteriorate the sensitivity of the instrument. If the light sensor surface gets dirty, wipe lightly with ethyl alcohol.The auto power save function of the instrument turns it off in 15 minutes after an operation. To resume the meter from auto power save status, press MAX/MIN button or turn the Range switch off position, then turn off the power.Be sure to set the Power/Range switch to OFF after use.This instrument is a pocket-sized laser power meter featuring excellent portability and operability.It can be applied easily in check and maintenance of the optical power levels of equipment using laser light.Using 633 nm of a He-Ne laser as the reference wavelength, this instrument enables direct reading of the optical power of visible-range laser light from a visible laser pointer, DVD player’s optical pickup, etc.The power of other wavelength can also be measured by converting the reading according to the spectral sensitivity characteristic table (typical values).The measured object is CW laser. A modulated laser cannot be measured accurately.[2] Applications[4] Nomenclature••••••••Pocket size.Separate light sensor probe can be integrated with the main body for measurement.4039 full-scale count with a bar graph display.Direct reading of the laser power of the reference wavelength of 633 nm, while the laser power of other wavelengths can be read by converting it according to the spectral sensitivity characteristic table.Wide measuring range from 0.01 μW to 40.39 mW.MIN/MAX hold functions.The diffusion sheets are used in the sensor, it can suppress the “return light” that is generated when a laser light enters the sensor.Auto power save function prevents wasting of battery power.[3] Features Push 2sPushMAX Hold MIN HoldMIN Hold mode:Holds the minimum value during measurement and displays it in the digital display. Indicated by “MIN” shown in the display.MAX Hold mode:Holds the maximum value during measurement and displays it in the digital display. Indicated by “MIN” shown in the display.••The bar graph display is not held.The MIN/MAX Hold mode is canceled when themeasurement range is changed.The auto power save function does not work inthe MIN/MAX Hold mode.Using the MAX Hold function makes it possible display always the maximum value measured. This solves the problem in the meter reading, that varies depending on the position, distance and angle of the incidence of laser beam into the light sensor surface.[5] FunctionsNotes)••••••Power/Range switchThis rotary switch is used to turn the illuminance meter on-off and switch the measurement range to the 40 μW, 400 μW, 4 mW or 40 mW range.Battery warning indicatorWhen the internal batteries are nearly exhausted and the supply voltage drops, blinking “BT” appears in the display. If this happens, please replace both batteries with new ones.MIN/MAX Hold button (Also used as the protection cover lock)Push this button during measurement to set the digital value display to the MAX Hold or MIN Hold mode as shown below.How to integrate the light sensor probe with the main body for measurementInsert the light sensor probe in the position on the top left of the main body as shown in the figure.How to open or close the protective coverTo open the protective cover, push and hold the button on the left side of main body into the direction shown in the figure, and open the protective cover.To close the protective cover, first store the light sensor probe in the storage position of the main body as described below, and then close the protective cover until it is locked.How to store the light sensor probeThe light sensor probe can be stored in the main body as shown below.into the storage position so that the light sensor surface faces up.in the space on the right of the light sensor probe.1.2.1.2.The auto power save function of the instrument turns it off in 15 minutes after an operation. To resume the meter from auto power save status, press MAX/MIN button or turn the Range switch off position, then turn off the power.When over range, displays "OL".Laser should be received on the center of the sensor at right angle.Measurement of weak laser power (below 1 mW) tends to be affected by ambient light (disturbance). In this case, it is required to take a countermeasure against disturbance, by performing measurement in a dark room.Notes)1.2.3.4.Measurement Procedure[6] Measurement••••Set the measuring range to the maximum range (40 mW).Apply the laser beam to the light sensor surface.After measuring the current power, set the measuring range to the optimum range.After completing measurement, set the Power/Range switch to OFF.How to correct the wavelength sensitivity of the light sensor The reference wavelength that can be read directly with this instrument is 633 nm. To measure light with wavelengths other than 633 nm, convert the reading using the sensitivity correction coefficient obtained from the photodiode’s spectral sensitivity characteristics (typical values).Reading Correction coefficient Wavelength-converted value 2.44 (mW) x 0.74 1.81 (mW)*This conversion value is a guide and is not guaranteed.When the measured laser light wavelength is 780 nm and the power meter reading is 2.44 mW:To maintain accuracy, perform calibration and inspection at least once an year.[7] Maintenance and Administration[8] After-Sale ServicingThe panel and case are little resistant to volatile solutions and heat. Do not wipe the thermometer using lacquer thinner or alcohol and do not place it heat a source of high temperatures (soldering iron, for example).Do not store the instrument in a place subject to vibrations or in a place which it may drop.Do not store the instrument under direct sunlight or in a place with low temperatures, high humidity or condensation.Be sure to remove the batteries when the instrument is not to be used for an extended period.For information of repair, please contact the dealer, selling agent or maker.4. StorageSet the Range switch to OFF, then remove the screw retaining the battery compartment cover using a screwdriver.Remove the battery compartment cover and take out the exhausted batteries.Insert new batteries without mistaking the + and – polarity.Attach the battery compartment cover and clamp it with the screw.3. Battery replacement Replacement Procedure:For calibration and inspection of the instrument, please contact dealer, sole agent and maker.2. Calibration1. Maintenance check 1) External finish2) Light sensorCheck if the external finish is damaged by dropping the instrument, etc.Check if the light sensor surface is damaged or durty.Check if the light sensor cord is damaged.If any of the above parts is damaged, do not use the instrument but have it repaired.•••1234••••Light sensor element Measurable wavelength rangeDirectly-readable wavelength DisplayOver load indication Low battery indication Sampling rate RangesMeasured object Accuracy FunctionsEMC directive, RoHS directive Power supplyPower consumption Environmental condition Operating temperature /humidity range Storage temperature /humidity range DimensionsLight sensor probe Sensor cord length AccessoriesSi photodiode (Light sensor surface diameter Ø 9 mm)with diffusion sheet 400 nm to 1100 nm633 nm (He-Ne laser)Other wavelengths should be converted using typical correction factorDigital display: 4039 full scaleBar graph display: 41-segment display displays“OL”Blinking “BT” appears in the display when the built-in batteries are nearly exhausted and battery supply voltage drops Digital display: Approx. 3 times/sec.Bar graph display: Approx. 30 times/sec.40 μW range: 0.01 μW to 40.39 μW 400 μW range: 0.1 μW to 403.9 μW 4 mW range: 0.001 mW to 4.039 mW 40 mW range: 0.01 mW to 40.39 mWCW laser, the modulated laser cannot be measured accurately ±5 % (in the 4 mW range, at the reference wavelength of 633 nm and 1 mW)Temperature: 23 ±2MIN Hold function, MAX Hold functionAuto power save function (15 min. after operation)IEC61326(EMC). EN50581(RoHS).LR44 1.5 V x 2Approx. 8 mWAltitude 2000 m or below, pollution degree Ⅱ.Temperature 0 to 40 , humidity 80 %RH or less (without condensation)Temperature -10 to +50 , humidity 80 %RH or less (without condensation)117(H ) x 76(W ) x 18(D ) mm, approx. 120 grams 84(H ) x 16(W ) x 10(D ) mm Approx. 0.5 m when extended Instruction manual x 1[9] SpecificationsDesign and specifications are subject to change for reasons of improvement, etc.INSTRUCTION MANUALLASER POWER METERDempa Bldg., 4-4 Sotokanda 2-ChomeChiyoda-ku, Tokyo, JapanLP10Light sensor probe -3--2--6--4--5--1--7--8-。
ggplot2代码文档
附录代码library(ggplot2)library(gtable)library(grid)## 需要 editGrob() 函数p <- qplot(wt, mpg, data = mtcars, colour = cyl, main ="Title text")p## 修改图形元件:图形题目字体改为斜体红色g <- ggplotGrob(p)idx <- which(g$layout$name =="title")g$grobs[[idx]]<- editGrob(g$grobs[[idx]], gp = gpar(fontface ="italic", col ="red")) ## 重新绘制grid.draw(g)第一章代码:第二章代码:library(ggplot2)## 图2.1 无代码###### 章节2.2set.seed(1410) # 让样本可重复dsmall <- diamonds[sample(nrow(diamonds), 100), ]###### 章节2.3qplot(carat, price, data = diamonds)###### 章节2.3qplot(log(carat), log(price), data = diamonds)###### 章节2.3qplot(carat, x * y * z, data = diamonds)## 图2.2 将 color 变量映射到点的颜色 (左),cut 变量映射到点的形状 (右)qplot(carat, price, data = dsmall, colour = color)qplot(carat, price, data = dsmall, shape = cut)## 图2.3 将 alpha 值从 1/10(左) 变动到 1/100(中) 再到## 1/200(右),来看大部分的点在哪里进行重叠。
【计算机应用】_频率_期刊发文热词逐年推荐_20140724
107 108 109 110 111 112 113 114 115 116 117 118 119 120 121 122 123 124 125 126 127 128 129 130 131 132 133 134 135 136 137 138 139 140 141 142 143 144 145 146 147 148 149 150 151 152 153 154 155 156 157 158 159 160
环绕立体声 独立分量分析 独立供电 特征融合 特征提取 熊掌 煤自燃 热解机理 热力学性质 火旋风 游戏音箱 混沌 混合语音 混合吸附 流畅 流水线 波束形成 汉明窗 残留频率偏移 残基 模拟退火算法 概率潜在语义分析 标准电压 朴素贝叶斯方法 显存位宽 映泰8400gs 时频分析 无线通信 无线传感器网络 无损除噪 旁路逻辑 方向 方位估计 新事件检测 文本数字化 整合主板 数据读写 数据挖掘 数据库管理系统 数字相关算法 数字电视地面传输 散热技术 散热器 收敛 搜索日志 搜索引擎 排序模糊性 捷波 指纹增强 战斗版显卡 性能 性别识别 快速公交 微指令
2008年 序号 1 2 3 4 5 6 7 8 9 10 11 12 13 14 15 16 17 18 19 20 21 22 23 24 25 26 27 28 29 30 31 32 33 34 35 36 37 38 39 40 41 42 43 44 45 46 47 48 49 50 51 52
1 1 1 1 1 1 1 1 1 1 1 1 1 1 1 1 1 1 1 1 1 1 1 1 1 1 1 1 1 1 1 1 1 1 1 1 1 1 1 1 1 1 1 1 1 1 1 1 1 1 1 1 1 1
53 54 55 56 57 58 59 60 61 62 63 64 65 66 67 68 69 70 71 72 73 74 75 76 77 78 79 80 81 82 83 84 85 86 87 88 89 90 91 92 93 94 95 96 97 98 99 100 101 102 103 104 105 106
信息可视化横版画布大小

信息可视化横版画布大小
多数屏幕分辨率是1920*1080。
按上方排列方式横向分辨率为6*1920=11520px.竖向分辨率为3*1080=3240px。
设计可以按照横竖计算后的总和作为设计尺寸。
但是像这种尺寸过大就不太合适,怎么判断什么时候可按照总和设计什么时候最好不要按照总和设计。
这个地方有一个关键的节点4K,超过4K后现有硬件会产生很多问题,例如:卡顿,GPU压力过大,负荷运行等等。
正常设计最好是保持在4K内,于硬件问题,所以现在大家采用的都是输出4K及以下,既保证流畅度又能在视觉上清晰阅读。
所以设计时也要保持同样的规则。
保持大屏的比例等比缩放即可,应该缩放到多少呢?缩放到输出像素尺寸即可(正常输出像素是和拼接后整体像素值是成比例关系的)。
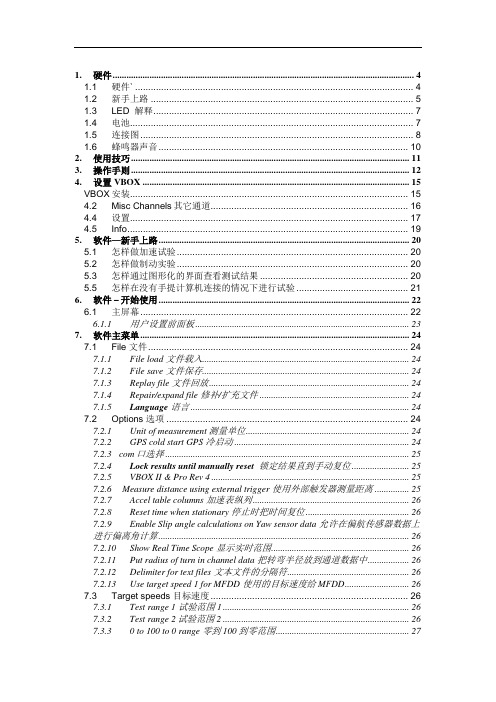
VBO软件操作手册
1.硬件 (4)1.1硬件` (4)1.2新手上路 (5)1.3LED 解释 (7)1.4电池 (7)1.5连接图 (8)1.6蜂鸣器声音 (10)2.使用技巧 (11)3.操作手则 (12)4.设置 VBOX (15)VBOX安装 (15)4.2Misc Channels其它通道 (16)4.4设置 (17)4.5Info (19)5.软件—新手上路 (20)5.1怎样做加速试验 (20)5.2怎样做制动实验 (20)5.3怎样通过图形化的界面查看测试结果 (20)5.5怎样在没有手提计算机连接的情况下进行试验 (21)6.软件–开始使用 (22)6.1主屏幕 (22)6.1.1用户设置前面板 (23)7.软件主菜单 (24)7.1File 文件 (24)7.1.1File load 文件载入 (24)7.1.2File save 文件保存 (24)7.1.3Replay file 文件回放 (24)7.1.4Repair/expand file 修补/扩充文件 (24)7.1.5Language语言 (24)7.2Options 选项 (24)7.2.1Unit of measurement测量单位 (24)7.2.2GPS cold start GPS 冷启动 (24)7.2.3 com口选择 (25)7.2.4Lock results until manually reset锁定结果直到手动复位 (25)7.2.5VBOX II & Pro Rev 4 (25)7.2.6 Measure distance using external trigger 使用外部触发器测量距离 (25)7.2.7Accel table columns 加速表纵列 (26)7.2.8Reset time when stationary 停止时把时间复位 (26)7.2.9Enable Slip angle calculations on Yaw sensor data 允许在偏航传感器数据上进行偏离角计算 (26)7.2.10Show Real Time Scope 显示实时范围 (26)7.2.11Put radius of turn in channel data 把转弯半径放到通道数据中 (26)7.2.12Delimiter for text files 文本文件的分隔符 (26)7.2.13Use target speed 1 for MFDD 使用的目标速度给MFDD (26)7.3Target speeds 目标速度 (26)7.3.1Test range 1 试验范围1 (26)7.3.2Test range 2试验范围2 (26)7.3.30 to 100 to 0 range 零到100到零范围 (27)7.4Real time plot 实时绘图 (27)7.5Select Run 选择运行 (28)7.5.1Default setups 缺省设置 (29)7.5.2Manual setup 手动设置 (31)7.6VBOX Setup VBOX 设置 (31)7.7Graph 图形 (31)7.8Start Finish 起点终点 (31)7.8.1Load start finish line and splits载入起/终点线和分离位置 (31)7.8.2Save start/finish line and splits保存起/终点线和分离位置 (32)7.8.3Start finish line length起/终点线的长度 (32)7.8.4Start finish line tolerance起终点线的公差 (32)7.8.5Accumulative split times 累计分离时间 (32)7.9.1Enable log file creation 允许记录文件产生 (32)7.9.2Include MFDD in logfile 在记录文件中包括MFDD (32)7.9.3Include test range 2 in logfile 在记录文件中包括试验范围2 (32)7.10Help 帮助 (32)8.GRAPH图形 (33)8.1概述 (33)8.2选择通道 (34)8.3设置外部输入信号的比例大小 (35)8.4键盘和鼠标指令 (36)8.5快捷键 (36)8.6定义起点/终点线和分离点。
glmarks2全屏测试代码
glmarks2全屏测试代码近年来,随着科技的不断进步,计算机图形技术也取得了突飞猛进的发展。
在这个领域中,OpenGL作为一种跨平台的图形接口,被广泛应用于游戏、虚拟现实、科学计算等领域。
而glmarks2全屏测试代码作为OpenGL的一个重要测试工具,对于评估计算机图形性能至关重要。
glmarks2全屏测试代码是一个用于测试GPU和CPU性能的开源工具。
它通过运行一系列OpenGL渲染场景来评估计算机的图形处理能力。
这些场景包括复杂的光照、阴影、纹理、几何形状等,可以全面评估计算机的图形性能。
glmarks2全屏测试代码的运行结果以FPS (每秒帧数)的形式展示,帧数越高代表计算机图形性能越好。
glmarks2全屏测试代码的运行非常简单,只需在终端中输入特定的命令即可。
它可以在各种操作系统上运行,如Windows、Linux和macOS等。
通过运行glmarks2全屏测试代码,用户可以了解自己计算机的图形性能,从而更好地选择适合自己需求的应用程序或游戏。
glmarks2全屏测试代码的优势在于它的全面性和准确性。
它通过运行多个渲染场景来测试计算机的图形处理性能,而不是仅仅依靠一两个简单的测试场景。
这样可以更全面地评估计算机的图形性能,使用户能够更准确地了解自己计算机的实际表现。
除了测试计算机的图形性能,glmarks2全屏测试代码还可以用于比较不同计算机之间的图形性能差异。
通过在不同计算机上运行相同的测试代码,用户可以直观地看到它们之间的差异。
这对于选择购买新计算机或进行升级非常有帮助,用户可以根据测试结果选择适合自己需求的计算机配置。
然而,glmarks2全屏测试代码也有一些局限性。
首先,它只能评估计算机的图形性能,而无法评估其他方面的性能,如CPU、内存等。
其次,它的测试结果只是一种参考,用户在选择计算机配置时还需考虑其他因素,如价格、品牌等。
最后,glmarks2全屏测试代码只是一种工具,用户在使用时还需结合自己的实际需求和经验进行判断。
albumentations库 scale参数
在计算机视觉领域,图像预处理是非常重要的一环。
图像预处理的目的是将原始图像转换为模型能够识别的格式,并增强图像的特征,使其更容易被模型识别。
albumentations库是Python中一个流行的图像预处理库,它提供了丰富的图像预处理操作,其中scale参数是其中之一。
scale参数的作用是将图像缩放为指定的大小。
缩放操作可以用于调整图像的分辨率,使其与模型的输入大小相匹配。
此外,缩放操作还可以用于增强图像的特征。
例如,将图像缩小可以突出图像中的主要特征,而将图像放大可以使图像中的细节更加明显。
scale参数的语法如下:scale(scale, interpolation=cv2.INTER_LINEAR, always_apply=False, p=1.0)其中:•scale:缩放比例。
可以是一个数字或一个范围。
•interpolation:插值方法。
默认为cv2.INTER_LINEAR。
•always_apply:是否总是应用此变换。
默认为False。
•p:应用此变换的概率。
默认为1.0。
scale参数的使用方法很简单,只需要在Albumentation对象中添加scale变换即可。
例如:import albumentations as Atransform = pose([A.Scale(scale=0.5, interpolation=cv2.INTER_LINEAR, always_apply=Fal se, p=1.0)])这段代码将创建一个Albumentation对象,该对象将对输入图像进行缩放操作。
缩放比例为0.5,插值方法为cv2.INTER_LINEAR,不会总是应用此变换,并且应用此变换的概率为1.0。
scale参数可以与其他Albumentation变换一起使用,以创建更复杂的图像预处理流水线。
例如,可以将scale变换与随机裁剪变换一起使用,以增强图像的鲁棒性。
import albumentations as Atransform = pose([A.Scale(scale=0.5, interpolation=cv2.INTER_LINEAR, always_apply=Fal se, p=1.0),A.RandomCrop(width=224, height=224)])这段代码将创建一个Albumentation对象,该对象将对输入图像进行缩放操作,然后随机裁剪图像。
minimum-scale 默认值 -回复
minimum-scale 默认值-回复[minimumscale 默认值]是指在制作地图或数据可视化时,地图或图表所能显示的最小缩放级别。
在这个级别上,地图或图表上的所有要素都能清晰可见,而不会显示过于拥挤或模糊的效果。
在本文中,我们将逐步回答有关“minimumscale 默认值”的问题,探讨它的意义、使用场景和调整方法。
第一部分:什么是minimumscale 默认值?minimumscale 默认值是指在使用地图或数据可视化工具时,地图或图表默认情况下所能显示的最小缩放级别。
缩放级别代表着地图的放大程度,较小的缩放级别意味着地图显示的区域范围更大,显示的细节更少。
而较大的缩放级别则表示地图显示的区域范围更小,显示的细节更多。
minimumscale 默认值的作用是控制地图或图表的显示效果,确保在用户进行缩放操作时,地图或图表的要素能够清晰可见,不会出现过于拥挤或模糊的情况。
通过设定适当的minimumscale 默认值,可以保证地图或图表在任何缩放级别下都具备较好的可读性和可视化效果。
第二部分:minimumscale 默认值的使用场景minimumscale 默认值在地图制作和数据可视化的过程中广泛应用。
接下来,我们将介绍一些常见的使用场景:1. 地理信息系统(GIS)应用程序:在GIS应用程序中,地图是一个重要的组成部分。
通过设定适当的minimumscale 默认值,可以确保地图在不同缩放级别下都能够清晰显示地理要素,以便用户能够正确理解和分析地理数据。
2. 数据可视化工具:在使用数据可视化工具制作图表时,minimumscale 默认值可以用来控制图表的详细程度。
较大的minimumscale 默认值将显示更多的数据细节,而较小的minimumscale 默认值则适用于显示整体趋势和概览信息。
3. 地图应用程序:在地图应用程序中,设定适当的minimumscale 默认值可以确保地图在不同缩放级别下的可用性和易用性。
NI ELVIS II系列产品规格说明说明书
Arbitrary Waveform Generator/Analog Output
Number of channels.........................2
DAC resolution................................16 bits
DNL.................................................±1 LSB
Maximum working voltage for analog inputs (signal + common mode) ................ ±11 V of AIGND
CMRR (DC to 60 Hz) ..................... 90 dB
Source..............................................AI<0..15>, ScopeCH0, ScopeCH1
Small signal bandwidth (–3 dB)......1.2 MHz
Input FIFO size................................4095 samples
Scanlist memory ..............................4095 entries
Data B signal stream, programmed I/O
Agilent 11970系列混合器数据手册说明书

Agilent 11970 Series Harmonic MixersData Sheet For use with the Agilent E4407B, 8560E/EC Series, 8566B,71000 Series, and PSA Series spectrum analyzers,plus the N9030A PXA signal analyzerExceptional performanceThe Agilent Technologies 11970 Series harmonic mixers are general purpose mixers employing a dual-diode design to achieve very flat frequency response and lowconversion loss. Each mixer is calibrated across its full band:11970K* 18 to 26.5 GHz 11970A 26.5 to 40 GHz11970Q 33 to 50 GHz 11970U 40 to 60 GHz11970V 50 to 75 GHz 11970W 75 to 110 GHzThis series of mixers has been designed for a local oscillator frequency of 3 to 6.1 GHz. Accurate absolute amplitude measurements can be made by using the mixer’s conversion loss calibration chart. The SWR of the waveguide input is typically 2.2:1 to further minimize measurement uncertainty. The combination of high gain-compression level and low conversion loss provides the maximum dynamic range for measuring input signals.* 11970K is excluded from PXA support18 to 110 GHz11970K*, 11970A, 11970Q, 11970U, 11970V, 11970W19812Easy to useThe excellent frequency response and low conversionloss are achieved without external dc bias or tuning stubs. Since bias and tuning stubs are not required, manualoperation is simplified, and the complexity of hardware and software for automatic systems is greatly reduced. The repeatability of amplitude measurements is also enhanced. The dual-diode design of the mixers further simplifiesmeasurements by suppressing the odd-order harmonics by more than 20 dB, which makes identification of the mixing products easier.RuggedThe rugged Agilent 11970 Series mixers willsurvive input levels up to 100 milliwatts (+20 dBm)with no damage to the mixer diodes. They will withstand shocks up to 30 G’s and the vibration required by MIL-STD 28800C, Type III, Class 3 tests.Figure 1. The 11970 Series mixers have separate LO input and IF output portsAgilent 8560E/EC Series spectrum analyzer Extended frequency 8560E/ECSeriesFrequency extension for the Agilent E4407B,8560E/EC Series, 8566B, and 71000 Series and PSA Series spectrum analyzersThe 11970 Series harmonic mixers are fully compatiblewith the Agilent E4407B, 8560E/EC Series, 8566B (requires a preamplifier), 71000, and PSA Series spectrum analyzers. Accurate frequency and amplitude measurements are made directly from the spectrum analyzer’s display after calibration using the mixer’s calibration chart.Frequency extension for the Agilent N9030A PXA Series signal analyzerThe 11970 Series harmonic mixers (11970K excluded) are also compatible with the N9030A PXA Series high-performance signal analyzer. The PXA offers optional external mixing (Option EXM), enabling it to work with the 11970 Series and other external mixers for frequency extension. An external diplexer is required because the PXA external mixing has a single SMA LO/IF port, whereas the 11970 Series mixers have separate LO and IF ports. Recommended diplexers can be purchased from Agilentas N9020A-E13, or from OML Inc. as DLP.313B.Spectrum analyzerExtended frequency PSA SeriesAgilent E4407B spectrum analyzer Extended frequency E4407B ESA-E SeriesAgilent N9030APXA Series signal analyzer Extended frequency PXA Seriesharmonic mixer3Input frequency, GHzNominal frequency response & conversion loss1826.533 40 50 60 75 110C o n v e r s i o n l o s s , d B50454035302520KAQUVWSpecificationsSpecifications describe the device’s warranted performance over the temperature range 0 to 55° C (except where noted).11970 Series tested with Agilent PSA spectrum analyzersAgilent model number Frequency range (GHz) LOharmonic number Maximum conversion loss (dB) Nominal spectrum analyzer noise (dBm)1 kHz BW Frequency response (dB) Nominal gain compression (dBm)11970K 18 to 26.56– 24 –105 ±1.9 –311970A 26.5 to 40 8– 26 –102 ±1.9 –511970Q 33 to 50 10– 28 –101 ±1.9 –711970U 40 to 60 10– 28 –101 ±1.9 –711970V 50 to 75 14– 40 –92 ±2.1 –311970W75 to 11018–46–85±3.0–1Nominal performance, as noted in the following tables, while not warranted, provides information useful in applying the device.1. An LO power of between 14.5 to 16 dBm at the mixer’s LO input is necessary to achieve the given frequency response and spectrum analyzer amplitude accuracy specifications. When LO power varies between 14 to 18 dBm at the mixer’s LO input, add ±1 dB to the frequency response and spectrum analyzer amplitude accuracy specification.4Agilent model number Flange Weight X Y Z 11970K UG-595/U WR-42 0.17 kg 0.36 lb 36 mm 1.4 in 51 mm 2.0 in 90 mm 3.5 in 11970A UG-599/U WR-28 0.14 kg 0.32 lb 36 mm 1.4 in 51 mm 2.0 in 71 mm 2.8 in 11970Q UG-383/U WR-220.14 kg 0.32 lb36 mm 1.4 in 51 mm 2.0 in 76 mm 3.0 in 11970U UG-383/U-M WR-19 0.14 kg 0.32 lb 36 mm 1.4 in 51 mm 2.0 in 76 mm 3.0 in 11970V UG-385/U WR-15 0.14 kg 0.32 lb 36 mm 51 mm 76 mm 1.4 in 2.0 in 3.0 in 11970WUG-387/U WR-100.14 kg 0.32 lb36 mm 1.4 in51 mm 2.0 in76 mm 3.0 in11970 Series tested with Agilent PXA signal analyzerAgilent model number Frequency range (GHz)LOharmonic number 1Maximum conversion loss (dB)Nominal signalanalyzer noise (dBm)21 kHz BW Frequency response (dB)Nominal gain compression (dBm)11970A 26.5 to 406–/8–26–110/–108±1.9–511970Q 33 to 50 8–/10–28–108/–106±1.9–711970U 40 to 6010–28–106±1.9–711970V 50 to 7512–/14–40 –96/–94±2.1–3 11970W75 to 11018–46 –88±3.0–11. When used with 11970 Series mixer in A-, Q-, or V-band, the PXA’s LO harmonics are automatically switched between two different numbers as listed to optimize conversion loss.2. If the LO harmonics are switched, the noise levels for the signal analyzer/mixer combination will change, corresponding to the different LO harmonic numbers.Ordering Information* Not compatible with N9030A PXA** Required if the 11970 mixer is used with the Agilent PXAWarranty and ServiceStandard warranty for 11970 mixers is 12 monthsStandard warranty for N9029A-E13 diplexer is 3 months, provided by OML, Inc./find/externalmixersAgilent Email Updates/find/emailupdatesGet the latest information on the products and applications you select.LAN eXtensions for Instruments puts the power of Ethernet and the Web inside your test systems. Agilent is a founding member of the LXI consortium.Agilent Channel Partners/find/channelpartnersGet the best of both worlds: Agilent’s measurement expertise and product breadth, combined with channel partner convenience.For more information on Agilent Technologies’ products, applications or services, please contact your local Agilent office. The complete list is available at:/find/contactus Americas Canada (877) 894 4414 Brazil(11) 4197 3500Mexico 01800 5064 800 United States (800) 829 4444 Asia Pacific Australia 1 800 629 485China800 810 0189Hong Kong 800 938 693India 1 800 112 929Japan 0120 (421) 345Korea 080 769 0800Malaysia 1 800 888 848Singapore 180****8100Taiwan0800 047 866Other AP Countries(65) 375 8100Europe & Middle East Belgium 32 (0) 2 404 93 40 Denmark 45 70 13 15 15Finland 358 (0) 10 855 2100France 0825 010 700 * 0.125 €/minute Germany 49 (0) 7031 464 6333 Ireland 1890 924 204Israel 972-3-9288-504/544Italy 39 02 92 60 8484Netherlands 31 (0) 20 547 2111Spain 34 (91) 631 3300Sweden 0200-88 22 55United Kingdom 44 (0) 131 452 0200For other unlisted countries:/find/contactusRevised: June 8, 2011Product specifications and descriptions in this document subject to change without notice.© Agilent Technologies, Inc. 2011Published in USA, September 19, 20115968-1445EAgilent Advantage Services is committed to your success throughout your equipment’s lifetime. To keep you competi-tive, we continually invest in tools and processes that speed up calibration and repair and reduce your cost of ownership. You can also use Infoline Web Services to manage equip-ment and services more effectively. By sharing our measure-ment and service expertise, we help you create the products that change our world./quality/find/advantageservicesAdvancedTCA ® Extensions for Instrumentation and Test (AXIe) is an open standard that extends the Advanced TCA for general purpose and semiconductor test. Agilent is a founding member of the AXIe consortium.PCI eXtensions for Instrumentation (PXI) modular instrumentation delivers a rugged, PC-based high- performance measurement and automation system.。
Keysight NFA系列噪声度分析器说明书
Noise Figure AnalyzersN8972A N8973A N8974A N8975ANFA SeriesA Flexible and Intuitive User InterfaceThe user interface on the new NFA series of Noise Figure Analyzers is intuitive and easy to use, with easy to find keys, which are sized and then placed in the relevant key group according to function. The soft-key depths have been kept to a minimum and there are clear visual indicators on the screen showing the current machine state.Easy Measurement SetupThe NFA series of Noise Figure Analyzers now takes the pain out of complex measurement setups, with their simple but instructive menus. The built-in help button gives key function and remote pro-gramming commands, that should eliminate the need to carry man-uals when setting up measurements.Low Instrumentation UncertaintyWhen making noise figure measurements, a key parameter to be aware of is measurement uncertainty. The NFA has a low instru-mentation uncertainty to aid in accurate and repeatable measure-ment of manufacturers’ components. In addition, to aid customers in setting their components/systems specifications, Agilent has pro-duced a web-based uncertainty calculator that will give customers information on how to improve and classify their measurement specifications more accurately.For more information, visit our web site at: /find/nfIncrease Measurement ThroughputIn manufacturing environments, fast measurement speed and repeatability are critical. The NFA series of Noise Figure Analyzers now include many features that can reduce your measurement time and increase throughput. The frequency list function allows you to select specific points within a complete measurement span to make your measurement. The Sweep averaging function allows a real-time update to the screen during a measurement, as you adjust the per-formance of the DUT during a sweep. Both these functions, as well as the limit line functionality for quick and easy pass/fail testing and the additional ability to recall complete calibrated instrument states, increase productivity and measurement throughput.Enhanced ConnectivityThe built-in floppy disk drive, GPIB, RS232 serial and Printer port connectors allow quick and easy data transfer between the analyzer and a PC or workstation. There is also a built-in VGA connector for connecting a large-screen monitor.Color Graphical DisplayTo enhance usability, the new Noise Figure Analyzers now come with an integrated 17 cm full color LCD display, for simultaneous viewing of noise figure and gain against frequency. There are three different formats for viewing measurements, the two separate chan-nel or combined graph format, a table format, and a spot frequency noise figure and gain measurement “meter” format.Ease of AutomationThe NFA series of Noise Figure Analyzers include 2 industry-stan-dard GPIB ports and an RS232 serial port, to aid in the automated control of the instrument. The second GPIB port is dedicated to Local oscillator control. The default control language is SCPI, but users can also define custom LO commands.Ease of IntegrationTo aid with the integration of the new analyzer into manufacturing environments, Agilent has produced a Programmers Reference Manual containing example programs to help migrate to the new system. The NFA is not code compatible with the 8970B, nor can it control the 8971C.Full Measurement CapabilityFeatures present in all NFA series noise figure analyzers•ENR data automatically loaded into NFA series noise figure analyzer when using SNS noise source•Floppy disk loading and saving of ENR data when used with a 346 or 347 noise source•Enhanced analysis through Limit lines and Marker functions •Enhanced PC and printer connectivity and VGA output•Internal data storage capable of storing up to 30 different state,trace, and setup files (dependent upon measurement complexity)•4 MHz measurement bandwidth•Frequency list mode, which enables the user to avoid known, polluted frequencies during a measurement or, used tactically to speed up a measurementFeatures only Available on the N8973A, N8974A, N8975A•Lower noise figure measurement uncertainty ±<0.05 dB•Six user selectable bandwidths (100 KHz, 200 KHz, 400 KHz, 1 MHz, 2 MHz, and 4 MHz)• Enhanced speed•A flexible and intuitive user interface •Easy measurement setup •Low instrument uncertainty•Color graphical display of noise figure and gain versus frequency •Enhanced PC and printer connectivity•SNS, 346 and 347 Series noise source compatible•Ability to automatically upload ENR calibration data from SNS Series noise source•Local oscillator control through second dedicated GP-IB •3-year warranty as standardN8973ANoise Figure AnalyzersN8972A N8973A N8974A N8975A NFA Series Key SpecificationsSpecifications apply over 0°C to +55°C unless otherwise noted. Theanalyzer will meet its specifications after 2 hours of storage withinthe operating temperature range, 60 minutes after the analyzer isturned on, with Alignment running. A user calibration is requiredbefore corrected measurements can be made.Frequency RangeNFA Series:N8972A10 MHz to 1.5 GHzN8973A10 MHz to 3 GHzN8974A10 MHz to 6.7 GHzN8975A10 MHz to 26.5 GHzMeasurement Speed (nominal)8 Averages 64 AveragesN8972A:<100 ms/measurement<80 ms/measurementN8973A:<50 ms/measurement<42 ms/measurementN8974A:<70 ms/measurement<50 ms/measurementN8975A:<70 ms/measurement <50 ms/measurementMeasurement Bandwidth (nominal)N8972A:4 MHzN8973A, N8974A, N8975A:4 MHz, 2 MHz, 1 MHz, 400 kHz, 200 kHz, 100 kHzNoise Figure and Gain(Performance is dependent upon ENR of noise source used)N8972A Noise Source ENR4 – 7 dB12 – 17 dB20 – 22 dBNoise FigureMeasurement range0 to 20 dB0 to 30 dB0 to 35 dBInstrument uncertainty±<0.1 dB±<0.1 dB±<0.15 dBGainMeasurement range–20 to +40 dBInstrument uncertainty±<0.17 dBN8973A, N8974A and Noise Source ENRN8975A(10 MHz to 3.0 GHz) 4 – 7 dB12 – 17 dB20 – 22 dBNoise FigureMeasurement range0 to 20 dB0 to 30 dB0 to 35 dBInstrument uncertainty±<0.05 dB±<0.05 dB±<0.1 dBGainMeasurement range –20 to +40 dBInstrument uncertainty±<0.17 dBN8974A and N8975A Noise Source ENR(>3.0 GHz) 4 – 7 dB12 – 17 dB20 – 22 dBNoise FigureMeasurement range0 to 20 dB0 to 30 dB0 to 35 dBInstrument uncertainty±<0.15 dB±<0.15 dB±<0.2 dBGainMeasurement range–20 to +40 dBInstrument uncertainty±<0.17 dBCharacteristic1Noise figure at 23ºC ±3ºC (10 MHz to 3.0 GHz)Characteristic1Noise figure at 23ºC ±3ºC (3.0 GHz to 26.5 GHz)Characteristic values are met or bettered by 90% of instruments with 90%confidence.Frequency ReferenceStandard Opt.1D5Aging±<2 ppm1/year±<0.1 ppm/yearTemperature stability±<6 ppm±<0.01 ppmSettability ±<0.5 ppm±<0.01 ppmTuning Accuracy (Start, Stop, Center, Marker)4 MHz Measurement Bandwidth (default on all models of Noise FigureAnalyzer)Frequency Error10 MHz – 3.0 GHz±<Reference error + 100 kHz3.0 GHz – 26.5 GHz±<Reference error + 400 kHz<4MHz Measurement Bandwidth (functionality not present in N8972A)Frequency Error10 MHz – 3.0 GHz±<Reference error + 20 kHz3.0 GHz – 26.5 GHz±<Reference error + 20% of measurementbandwidthParts Per Million (10e-6)1086421050010001500200025003000Frequency (MHz)NoiseFigure(dB)8911112Frequency (MHz)NoiseFigure(dB)3388347756517418833818791871721956118112724136814492153761626171451829189131879716812156522419233342421251225986265Noise Figure AnalyzersN8972A N8973A N8974A N8975AGeneral SpecificationsDimensionsWithout handle: 222 mm H x 375 mm W x 410 mm D With handle (max): 222 mm H x 409 mm W x 515 mm D Weight (typical, without options)N8972A:15.3 kg N8973A:15.5 kg N8974A:17.5 kg N8975A:17.5 kgData Storage (nominal)Internal drive: 30 traces, states or ENR tables Floppy disk: 30 traces, states or ENR tablesPower RequirementsOn (line 1): 90 to 132 V rms, 47 to 440 Hz, 195 to 250 V rms, 47 to 66 Hz Power consumption: <300 W Standby (line 0): <5 W Temperature RangeOperating: 0ºC to +55ºC Storage: –40ºC to +70ºCHumidity RangeOperating: Up to 95% relative humidity to 40ºC (non-condensing)Altitude range: Operating to 4,600 meters Calibration Interval1-year minimum recommendedElectromagnetic CompatibilityComplies with the requirements of the EMC directive 89/336/EEC. This includes Generic Immunity Standard EN 50082-1:1992 and Radiated Interference Standard CISPR 11:1990/EN 55011:1991, Group 1 Class A.The conducted and radiated emissions performance typically meets CISPR 11:1990/EN 55011:1991 Group 1 Class B limits.Warranty3-Year warranty as standardKey LiteratureNoise Figure Analyzers, NFA Series, Brochure, p/n 5980-0166ENoise Figure Analyzers, NFA Series, Data Sheet, p/n 5980-0164ENoise Figure Analyzers, NFA Series, Configuration Guide, p/n 5980-0163EFundamentals of RF and Microwave Noise Figure Measurements, App note 57-1, p/n 5952-8255E Noise Figure Measurement Accuracy, App note 57-2, p/n 5952-370610 Hints for Making Successful Noise Figure Measurements, p/n 5980-0228E N8972A and N8973A, NFA Series, Noise Figure Analyzer ProgrammingExamples, p/n 5968-9498EOrdering InformationN8972A 10 MHz to 1.5 GHz NFA Series Noise Figure Analyzer N8973A 10 MHz to 3.0 GHz NFA Series Noise Figure Analyzer N8974A 10 MHz to 6.7 GHz NFA Series Noise Figure Analyzer N8975A 10 MHz to 26.5 GHz NFA Series Noise Figure AnalyzerAll options, other than those marked with *, can be ordered at any time for use with an instrument.Frequency ReferenceN897xA-1D5NFA series high stability frequency reference*Calibration DocumentationN897xA-A6J NFA series ANSI Z540 compliant calibration with test data*AccessoriesN897xA-1CP NFA series rackmount and handle kit N897xA-UK9NFA series front panel coverN897xA-1FP NFA series calibration, performance verification and adjustment softwareDocumentationA hard copy and CD version of the English language Quick Reference Guide, User’s Guide, Programmers Reference, and Calibration andPerformance Verification Manual are included with the NFA as standard.Selections can be made to change the localization of the manual set or to delete the hardcopy.N897xA-AB0NFA series manual set for Taiwan – Chinese localization N897xA-AB1NFA series manual set – Korean localization N897xA-AB2NFA series manual set – Chinese localization N897xA-ABE NFA series manual set – Spanish localization N897xA-ABF NFA series manual set – French localization N897xA-ABZ NFA series manual set – Italian localization N897xA-ABD NFA series manual set – German localization N897xA-ABJ NFA series manual set – Japanese localization N897xA-0B0Delete hardcopy manual set*Note: The localized options will include a localized version of the Quick Reference Guide and User Guide, and an English language version of the Programmers Reference, and Calibration and Performance Verification Manual.Additional DocumentationN897xA-0B1NFA series manual set (English version)N897xA-0B2NFA series user manual (English version)N897xA-0BF NFA series programmers reference (English version)Service Options:Warranty and Service Standard warranty is 3 years. For warranty and service of 5 years, please order R-51B-001-5F: “3 year Return-to Agilent warranty extended to 5 years” (quantity = 1).Calibration 2For 3 years, order 36 months of the appropriate calibration plan shown below. For 5 years, specify 60 months.R-50C-001Standard calibration plan*R-50C-002Standard compliant calibration plan*Options not available in all countries。
版本九宫格参数
版本九宫格参数
版本九宫格参数(Nine-patch parameters)指的是在Android系统中使用的一种图片拉伸方式。
九宫格图片是一种可缩放的位图,它可以在不失真的情况下改变其大小,以适应各种屏幕的尺寸和分辨率。
九宫格图片被广泛应用于Android应用程序的UI设计中,尤其是在按钮、对话框、背景图等方面。
九宫格图片可以被切分成9个部分,其中4个角落是不变的,4个边缘可以被拉伸,而中央的部分则保持不变。
版本九宫格参数指的是制作九宫格图片时需要设置的参数,它们可以帮助系统正确地分析图片的边缘和中央部分,从而实现图片的缩放和拉伸。
Android系统中使用的版本九宫格参数包括以下几个方面:
1. 拉伸区域(Stretchable area):即可以被拉伸的部分,通常包括图片的四个边缘。
拉伸区域由一些黑色的线条表示,这些线条定义了图片的哪些部分可以被拉伸。
2. 填充区域(Content area):即图片中不会被拉伸的部分,通常是图片的中央部分。
填充区域由一些红色的线条表示,这些线条定义了图片的中央部分。
3. 限制区域(Padding area):即图片周围的空白区域,它可以被用来定义图片
的边缘和中央部分之间的距离。
限制区域由一些绿色的线条表示,这些线条定义了图片的边缘。
4. 透明区域(Transparent area):即图片中完全透明的部分,它们在拉伸和缩放时会被忽略。
以上就是版本九宫格参数的详细解释,它们在制作九宫格图片时非常重要,可以帮助开发者实现自适应UI设计,提高应用程序的用户体验。
艺术字识别训练数据
艺术字识别训练数据
艺术字识别训练数据集是一种用于训练计算机视觉和深度学习算法的数据集,用于识别和分类不同风格和形式的艺术字。
这种数据集通常包含各种类型的艺术字,如手写字体、手绘字体、涂鸦字体等,以及相应的标签或类别。
以下是一些常见的艺术字识别训练数据集:
MORAN: MORAN数据集是一个用于手写数字识别的数据集,包含了1000个不同人写的数字,每个数字都有不同的风格和形式。
IAM: IAM数据集是一个用于手写文字识别的数据集,包含了超过100,000个不同人写的文字样本。
IAM-watch: IAM-watch数据集是一个扩展的IAM数据集,包含了更多的文字样本和更详细的标注信息。
J黄油: J黄油数据集是一个用于涂鸦字体识别的数据集,包含了超过50,000个涂鸦字体样本。
Fonts in Use: Fonts in Use数据集是一个用于识别不同字体风格的数据集,包含了不同字体在不同场景下的应用示例。
这些数据集都可以通过各种方式获得,如公开的数据集网站、学术研究论文或商业资源。
在使用这些数据集时,需要注意版权和使用许可问题。
- 1、下载文档前请自行甄别文档内容的完整性,平台不提供额外的编辑、内容补充、找答案等附加服务。
- 2、"仅部分预览"的文档,不可在线预览部分如存在完整性等问题,可反馈申请退款(可完整预览的文档不适用该条件!)。
- 3、如文档侵犯您的权益,请联系客服反馈,我们会尽快为您处理(人工客服工作时间:9:00-18:30)。
Scales dataQuality management:__________________________10. Jun. 2014 LMT748-0 Signature:Measuring AmplifierMV4 Functional DescriptionID no. 10819176 / Issued 17.10.2011 ENFunctional Description Measuring Amplifier MV42Technical data Product informationProduct type:Measuring amplifier Product description:MV4Document number:10819176 Document identificationCompiled by:Liebherr-Mischtechnik GmbH Issued:17.10. 2011Valid from:MV4Version:1AddressLiebherr-Mischtechnik GmbHPostfach 145D-88423 Bad SchussenriedTel: +49 (0) 7583 / 949 0E-mail: info.lmt@Table of Contents1.TECHNICAL DATA (5)1.1Integration of the measuring amplifier in the plant network (5)1.2Minimum clearances for installation (6)2.START-UP (7)3.SUPPLY & NETWORK CONNECTION (11)3.1Supply voltage (11)3.2Network connection (11)4.WEIGHERS (LMD) (12)4.1Conductor load cells (13)4.1.1.Connection with 6-wire cable (13)4.1.2.Connection with 4-wire cable (13)4.2Conductor load cells (13)4.2.1.Connection with 6-wire cable (13)4.2.2.Connection with 4-wire cable (14)5.ANALOGUE INPUTS ( 0-10V/0-20MA ) (15)5.1Moisture sensors (15)5.2Consistency measuring (16)5.3Temperature sensors (16)6.IMPULSE INPUTS (17)6.1Variant 1 (17)6.2Variant 2 (18)7.PROFIBUS (19)8.CALIBRATION MARKS AND STAMPS (20)9.OPTIONAL 7 SEGMENT DISPLAY FOR WEIGHERS (21)10.WEIGH CELL PRODUCTS (22)10.1HBM (22)10.2Flintec (22)10.3Revere (22)11.MOISTURE SENSOR PRODUCTS (23)11.1Hydronix Hydro Probe ll (23)11.2ACO moisture sensor (23)12.TEMPERATURE SENSOR PRODUCTS (24)12.1FLTF 80 –S/M (Ludwig) (24)13.CONNECTION ALLOCATION FOR MEASURING AMPLIFIER 1 (25)Technical data34Technical dataTechnical data 51.Technical data Stainless steel housing Dimensions: l:460mm, b: 250mm, h: 120mm Permissible temperature range: -10°C to 40°C24V/5A supply voltage 1x 100 Mbit RJ45 (4-pin M12 SACC plug)8 x analogue inputs from 0-10V or 0 –20 mA 8 x analogue outputs from 0-10V or 0 –20mA 8 impulse inputs 8 impulse outputs 1 x serial RS 232 interface (for 7 segment displays)6 LMD (load cells) inputs 10 V supply Max. 40mV input signal Max. 300 mA (for 8 cells, each with 350 ) per channelOptional 4-conductor or 6-conductor connection Calibration approval for maximum 6000D resolution Calibratable in accordance with WELMECOptions:CoDeSys3 SPS with Profibus interfaceExternal 7 segment displayThe measuring amplifier features 6x 11mm PG threaded fittings for the weigher connections and9x 9mmdiameter PG threaded fittings for alternative allocations.1.1Integration of the measuring amplifier in the plant network6Technical data 1.2Minimum clearances for installationAll specifications in millimetres.Start-up 72.Start-up 16 weigher connections (11mm PG threaded fitting)29 freely allocable connections (9mm PG threaded fitting)3LED: CPUIndicates the activity of the CPU by flashing yellow4LED: SupplyLights up green when the MV is connected to the supply5LED: System not calibratedThis LED lights up red if the system is not calibratedIf this LED is flashing alternately with no. 6, the measuring amplifier is in error modeIf this LED is flashing simultaneously with no. 6, the measuring amplifier is in update mode6LED: System calibratedIf this LED lights up green, the measuring amplifier is calibratedIf it flashes green, the MV is calibrated, however, the calibration is not protected by switch ES1If it flashes alternately with no. 5, the MV is in error modeIf it flashes simultaneously with no. 5, the MV is in update mode7Network connection 8Supply voltage8Start-upStart-up10Start-upSupply& network connection 113.Supply & network connection 3.1Supply voltageProduct:Cable type:Amphenol C16-1YML 3x1.03.2Network connectionProduct:Cable type:Product:Phoenix SACC CAT6e Waidmüller FM4512Weighers (LMD)4.Weighers (LMD)Release the plug by pushing back both leversConnect the load cells and lock the plug againRemove the plug from the bushingReinsert on the circuit boardWeighers (LMD)134.1Conductor load cells4.1.1.Connection with 6-wire cableLMD Measuring amplifier Signal +I +Signal -I -Feed +V +R +Feed -V-R -ShieldShieldThe shield must be connected electrically conductive to earth on both sides of the cable.Recommended cable type: LIYCY 6x0.5 (see appendix for colour allocation)4.1.2.Connection with 4-wire cableLMD Measuring amplifier Signal +I +Signal -I -Feed +V +R +Feed -V-R -ShieldShieldThe shield must be connected electrically conductive to earth on both sides of the cable.Recommended cable type: LIYCY 4x0.5 (see appendix for colour allocation)4.2Conductor load cells4.2.1.Connection with 6-wire cableLMDMeasuring amplifierSignal +I +Signal -I -Feed +V +Sense +R +Feed -V-Sense -R -ShieldShieldThe shield must be connected electrically conductive to earth on both sides of the cable.Recommended cable type: LIYCY 6x0.5 (see appendix for colour allocation).14Weighers (LMD)4.2.2.Connection with 4-wire cableLMDMeasuring amplifier Signal +I +Signal -I -Feed +V +Sense +R +Feed -V-Sense -R -ShieldShieldThe shield must be connected electrically conductive to earth on both sides of the cable.Recommended cable type: LIYCY 4x0.5 (see appendix for colour allocation)Analogue inputs ( 0-10V/0-20mA )155.Analogue inputs ( 0-10V/0-20mA ), see page 5Supply voltage for all analogue inputs 24V / 100mAA maximum 9 PG threaded fittings (9mm) for cable feeds (to the analogue, as well as the digital inputs and the Profibus interface) are featured5.1Moisture sensorsMoisture sensorMeasuring amplifier 1-824V Vers for moisture sen-sor GNDInput selector switch:See page 5 ON = 0 –10V OFF = 0 –20mARecommended cable type LIYCY 4x0.55.2Consistency measuringSee page 5ON = 0 –Recommended cable typeLIYCY 4x0.55.3Temperature sensorsSee page 5ON = 0 –Recommended cable typeLIYCY 4x0.516Analogue inputs ( 0-10V/0-20mA )Impulse inputs176.Impulse inputs, see page 5Supply voltage for all equipment with 24V/max. 0.1A impulse outputs6.1Variant 1on page 518Impulse inputs6.2Variant 2on page 5Profibus197.ProfibusSee20Calibration marks and stamps8.Calibration marks and stampsSafeguards in the form of adhesive labels are to be affixed in the following positions on the housingA Above the opening in the safety plate for switch ES-1. Safeguard by way of adhesive label.BAbove the screw indicated, to prevent removal of the safety plate.Labels are to be affixed to the following points on the housing of the measuring amplifierK Label with CE mark and dateS Visual assessment stamp (e.g: self-adhesive label)MGreen adhesive label withmeasuring technology …M“Optional 7 segment display for weighers219.Optional 7 segment display for weighersObject number Description 1Programming plug 2 1 =Off, 2=Off weighers 1-41=On, 2=Off weighers 5-83Connection to measuring amplifier10.Weigh cell products10.1HBMTypes: Z6, C2, U2A, HLC, RSC, Z7A10.2FlintecDescription Colour Excitation (feed) -Black Excitation +Green Signal -White Signal +RedSense -Blue Sense +Brown Shield Yellow Types: PC2, PC2H, SB810.3RevereDescription Colour Input (feed) -BlackInput +Green Output (signal) -Red Output +White Sense -Blue Sense +Yellow Shield Transparent Types: SSB, SHB,BSP22Weigh cell products11.Moisture sensor products11.1Hydronix Hydro Probe llDescription Colour24V supply RedGND BlackIN Blue11.2ACO moisture sensorDescription Colour24V supply WhiteGND Grey & BrownIN GreenShield BlackMoisture sensor products2312.Temperature sensor products12.1FLTF 80 –S/M(Ludwig)24Temperature sensor products13.Connection allocation for measuring amplifier 1Weighers DescriptionLMD/K0Aggregate weigherLMD/K1Cement weigherLMD/K2Water weigherLMD/K3Admixture WeigherLMD/K4LMD/K21Analogue DescriptionChannel 1Moisture Silo 1Channel 2Moisture Silo 2Channel 3Concrete temperature Mixer 1Channel 4Air temperatureChannel 5Consistency Mixer 1Channel 6Concrete temperature Mixer 2Channel 7Consistency Mixer 2Channel 8Impulse DescriptionChannel 1Water meter Mixer 1Channel 2Water meter Mixer 2Channel 3Channel 4Channel 5Channel 6Channel 7Channel 8Connection allocation for measuring amplifier 12526Connection allocation for measuring amplifier 1。
