SAS中计算总和或者计算总数的方法
SAS统计分析报告教程方法总结材料
SAS统计分析报告教程方法总结材料统计分析是对数据进行理性、全面和深入的分析,以发现其中的规律、趋势和关联性。
SAS(Statistical Analysis System)是一个流行的统计分析软件,广泛应用于数据分析、研究和报告编制领域。
本文将介绍SAS统计分析报告的编制方法,帮助读者了解如何利用SAS软件进行统计分析,并撰写专业的统计分析报告。
一、数据导入与准备在进行统计分析之前,首先需要导入数据并对数据进行清洗和准备。
SAS软件支持多种数据格式的导入,包括CSV、Excel、数据库等。
可以使用PROC IMPORT或DATA STEP语句来将数据导入SAS环境中,并使用DATA STEP或PROC SQL语句对数据进行清洗和准备,包括删除缺失值、解决数据异常值等。
二、描述性统计分析描述性统计分析是对数据集中的变量进行统计概括和描述。
在SAS中,可以使用PROCMEANS、PROCFREQ、PROCUNIVARIATE等过程来计算变量的均值、标准差、中位数、众数、频数分布等描述性统计指标。
通过描述性统计分析可以初步了解数据的分布情况,为后续的统计测试和模型建立奠定基础。
三、统计检验统计检验是用来检验数据之间的关系或差异是否显著的一种方法。
在SAS中,可以使用PROCTTEST、PROCANOVA、PROCCORR等过程进行假设检验,检验两组或多组数据之间的显著性差异或相关性。
在进行统计检验时,需要设置显著性水平和备择假设,以便进行准确的统计分析。
四、图形展示图形展示是将数据通过图表的形式呈现出来,更直观地展示数据的特征和规律。
在SAS中,可以使用PROCGPLOT、PROCSGPLOT、PROCGCHART等过程来绘制各种类型的图表,包括直方图、散点图、折线图、饼图等。
通过图形展示,可以更清晰地了解数据的分布情况和变量之间的关系,为数据分析和报告提供有力支持。
五、报告编制报告编制是统计分析的最后一步,将分析结果整理成报告文档,进行数据解释和结论归纳。
sas实现数据汇总和报表制作

2007北京大学
产生汇总表格
编程--计算统计量
例2.6: SALARY数据集有三个变量:性别(SEX),工种
(JOBCODE)和薪金(SALARY).试生成比较各种不 同工种和不同性别间最高薪金的汇总表.
proc tabulate data=salary format=dollar10.0 ; class sex jobcode; var salary; table sex,jocode*salary*max / rts=8; run;
(转到SAS运行print26.sas)
27
2007北京大学
产生汇总表格
编程--计算统计量
28
2007北京大学
产生汇总表格
本节的练习题
1. 使用ANALYST(V8)对数据集 flight(或salary)的数据绘制几种汇 总表格; 2.用编程方法对数据集flight (或 salary)的数据绘制几种汇总表格;
2007北京大学
产生汇总表格
编程--控制表格结构
例2.3: 试生成各航班和日期的并排汇总表.
proc tabulate data=flights; class flight day; table flight day; run;
(转到SAS运行print23.sas)
23
2007北京大学
产生汇总表格
12
2007北京大学
制作列表报告
用Printto过程改变输出位置
将输出结果和运行信息直接记入文件
proc printto print='文件名' log=‘文件名’ new ; 过程步 proc printto ;
filename fileref '文件名';
几种描述性统计分分析的SAS过程

几种描述性统计分分析的SAS过程描述性统计是统计学中的一种方法,用于总结和描述数据集的主要特征。
它有助于了解数据的整体分布、偏差和离散性等。
SAS(统计分析系统)是一种流行的统计软件,具有丰富的分析功能。
以下是几种常用的SAS过程,用于执行描述性统计分析。
1.PROCMEANS:PROCMEANS是一种计算统计指标的SAS过程,包括均值、总和、最小值、最大值、标准差等。
可以使用该过程对数值变量进行描述性统计,并在输出中显示这些统计指标。
可以通过指定多个变量和分组变量来计算针对不同子组的统计指标。
该过程还可以生成频数和百分比。
2.PROCFREQ:PROCFREQ是一种用于计算分类变量频数和百分比的SAS过程。
它可以计算每个类别的频数,并使用该信息生成频数表。
该过程还可以计算两个或更多分类变量之间的交叉频数表,并计算出每个类别的百分比。
3.PROCUNIVARIATE:PROCUNIVARIATE是一种用于执行单变量分析的SAS过程。
它可以计算变量的均值、标准差、峰度、偏度等统计指标。
该过程可以绘制直方图、箱线图、正态检验图和PP图等,以帮助理解数据的分布特征。
还可以执行分位数分析、离散度分析和异常值识别等。
4.PROCCORR:PROCCORR是一种用于计算变量之间相关性的SAS过程。
它可以计算变量间的皮尔逊相关系数,并使用协方差矩阵和相关系数矩阵来描述变量之间的线性关系。
该过程还可以绘制散点图矩阵和相关系数图,以直观地显示变量之间的关系。
5.PROCGLM:PROCGLM是一种用于执行多因素方差分析的SAS过程。
它可以根据自变量的水平和交互作用来分解因变量的方差,并进行显著性检验。
该过程可以计算组间差异的F值和p值,并生成方差分析表。
PROCGLM还支持使用协变量进行调整的方差分析,以控制对方差的影响。
以上是几种常用的SAS过程,用于执行描述性统计分析。
每个过程都有各自的功能和输出,可以根据数据和分析需求选择合适的过程。
sas 四则运算

sas 四则运算
SAS交互式矩阵语言,可以处理各种矩阵运算,拥有丰富的可以直接用于矩阵运算的算符和大量的数学函数,是用SAS系统开发的应用软件。
SAS带有很多可以直接生成矩阵的函数,利用这些函数来创建矩阵不但出错率少,而且可以减少输入工作,提高效率。
其四则运算如下:
“+”:A+B矩阵加法,A,B中可以有一个为数。
“-”:-A或A-B,求负矩阵或矩阵减法。
“#”:元素乘法:
①数乘a#A;②A,B同行同列,A#B为对应元素相乘;③A为n×m,B 为n×1或1×m,为A中元素分别与B中同行(列)元素相乘。
“/”:矩阵除法,A/B,B为与A同行同列的矩阵或数,对应元素相除;A*k(A为方阵,k为不小于-1的整数)为矩阵A连乘k次,k=-1时为求A的逆矩阵。
矩阵转置,A为A的转置矩阵:
矩阵的水平合并,A||B要求A与B同行;矩阵的垂直合并,A//B要求A 与B同列。
SAS软件和统计应用教程
2.1.3 表示数据分散程度的统计量
1. 极差(Range)与半极差(Interquartile range)
极差就是数据中的最大值和最小值之间的差:
极差 = max{xi} – min{xi} 上、下四分位数之差Q3 – Q1称为四分位极差或半极
差,它描述了中间半数观测值的散布情况。
2. 方差(Variance或Var)
RUN;
显示结果如图所示。
2. MEANS过程
(1) 语法格式 MEANS过程的一般格式:
PROC MEANS DATA=<数据集名>[<统计量关键字列表>]; [VAR <分析变量列表>;] [BY <分组变量名>;] [CLASS <分组变量名>;]
RUN;
PROC MEANS语句后的选项主要用来指定所要计算 的统计量,默认情况下,MEANS过程会给出频数、均 数、标准差、最大值和最小值等,其余统计量的计算均 需要在选项中指定。
中位数 x12((n2x1()n2)
x(n1)) 2
n为奇数 n为偶数
3. 众数(Mode)
观测值中出现最多的数称为众数。众数用得不如均值 和中位数普遍。在属性变量分析中,常需考虑频数,因 此众数用得多些。
4. 百分位数(Percentile)
分位数也是描述数据分布和位置的统计量。0.5分位 数就是中位数,0.75分位数和0.25分位数又分别称为上、 下四分位数,并分别记为Q3和Q1。
单击“OK”按钮,即可得到关于变量Income的矩统计 量和基本统计测度
2.2.3 编程实现描述性统计
SAS提供有多个不同的过程来实现统计量的计算,它 们 在 功 能 范 围 上 有 许 多 的 重 复 , 下 面 介 绍 用 FREQ 、 MEANS和UNIVARIATE这三个过程来计算简单的描述 统计量。
如何用SAS进行统计分析
如何用SAS进行统计分析SAS(统计分析系统)是一种用于数据分析和统计建模的软件工具。
它提供了一系列功能和程序,用于数据处理、统计分析、预测建模、图形展示和报告生成等。
本文将介绍如何使用SAS进行统计分析,涵盖数据导入、数据清洗、描述性统计分析、假设检验、回归分析和聚类分析等内容。
1. 数据导入和数据清洗在使用SAS进行统计分析之前,你需要将待分析的数据导入到SAS软件中。
SAS支持多种数据格式,包括CSV、Excel、Access等。
你可以使用SAS提供的PROC IMPORT过程将数据导入到SAS的数据集中。
导入数据后,你需要对数据进行清洗。
数据清洗的目的是去除数据中的错误、缺失或异常值,以确保数据的质量。
你可以使用SAS的数据步骤(DATA STEP)来处理数据,例如删除缺失值、填补缺失值、去除异常值等。
2. 描述性统计分析描述性统计分析是对数据进行总结和描述的过程。
它包括计算数据的中心趋势(均值、中位数、众数)、数据的离散程度(标准差、方差、极差)、数据的分布形态(偏度、峰度)等。
在SAS中,你可以使用PROC MEANS过程进行描述性统计分析。
该过程可以计算多个变量的均值、标准差、最小值、最大值、中位数等统计指标。
此外,你还可以使用PROC UNIVARIATE过程计算数据的偏度、峰度等统计值,并绘制直方图和箱线图来展示数据的分布情况。
3. 假设检验假设检验是对样本数据进行推断性统计分析的一种方法。
它用于判断观察到的样本差异是否显著,从而对总体参数进行推断。
在SAS中,你可以使用PROC TTEST过程进行双样本t检验、单样本t检验和相关样本t检验等。
此外,PROC ANOVA过程可以用于方差分析,PROC FREQ过程可以用于卡方检验。
4. 回归分析回归分析是研究因变量与自变量之间关系的一种统计分析方法。
它用于预测和解释因变量的变化,并评估自变量对因变量的影响程度。
在SAS中,你可以使用PROC REG过程进行简单线性回归分析和多元线性回归分析。
sas 中的proc summary的简易用法
sas 中的proc summary的简易用法在SAS(统计分析系统)中,proc summary是一个非常常用的过程,用于对数据进行汇总和统计分析。
它可以帮助用户快速、准确地计算数据的各种统计量,并生成相应的汇总报告。
本文将介绍proc summary的基本用法,包括如何使用它进行简单的数据汇总和统计分析。
一、简介1.1 proc summary概述proc summary是SAS中用于汇总和统计数据的过程。
它可以对数据进行求和、平均值、中位数、标准差等统计计算,还可以生成频数表、交叉表等汇总报告。
通过proc summary,用户可以快速了解数据的整体特征,发现数据的规律和异常值,为后续的分析和建模工作奠定基础。
1.2 proc summary的优势相比于手动编写数据统计分析的代码,proc summary有以下几个显著的优势:- 简洁高效:proc summary只需要一行或几行代码,就可以完成对数据的多种统计计算,极大地提高了统计分析的效率。
- 灵活多样:proc summary支持对多个变量进行统计计算,可以通过选项参数指定不同的统计方法和输出格式,满足用户不同的统计需求。
- 结果可读性好:proc summary生成的汇总报告结构清晰,包含多种统计量和描述性统计信息,便于用户直观地理解和解释数据。
二、基本用法2.1 proc summary语法proc summary的基本语法如下所示:```sasproc summary data=dataset;var variable1 variable2 ...;output out=summary_data mean=mean_value sum=sum_value; run;```其中,data=dataset指定输入的数据集名称;var variable1 variable2 ...指定需要进行统计计算的变量;outputout=summary_data mean=mean_value sum=sum_value指定输出的汇总数据集和需要计算的统计量。
SAS数据分析与统计
一、数据集的建立1.导入Excel数据表的步骤如下:1) 在SAS应用工作空间中,选择菜单“文件”→“导入数据”,打开导入向导“Import Wizard”第一步:选择导入类型(Select import type)。
2) 在第二步的“Select file”对话框中,单击“Browse”按钮,在“打开”对话框中选择所需要的Excel文件,返回。
然后,单击“Option”按钮,选择所需的工作表。
(注意Excel文件要是2003的!!)3) 在第三步的“Select library and member”对话框中,选择导入数据集所存放的逻辑库以及数据集的名称。
4 ) 在第四步的“Create SAS Statements”对话框中,可以选择将系统生成的程序代码存放的位置,完成导入过程。
2.用INSIGHT创建数据集1)启动SAS INSIGHT模块,在“SAS INSIGHT:Open”对话框的”逻辑库“列表框中,选定库逻辑名2)单击“新建”按钮,在行列交汇处的数据区输入数据值(注意列名型变量和区间型变量,这在后面方差分析相关性分析等都要注意!!)3)数据集的保存:•“文件”→“保存”→“数据”;•选择保存的逻辑库名,并输入数据集名;•单击“确定”按钮。
即可保存新建的数据集。
3.用VIEWTABLE窗口建立数据集1)打开VIEWTABLE窗口2)单击表头顶端单元格,输入变量名3)在变量名下方单元格中输入数据4)变量类型的定义:右击变量名/column attributes…4.用编程方法建立数据集DATA 语句; /*DATA步的开始,给出数据集名*/Input 语句;/*描述输入的数据,给出变量名及数据类型和格式等*/(用于DATA步的其它语句)Cards; /*数据行的开始*/[数据行]; /*数据块的结束*/RUN; /*提交并执行*/例子:data=数据集名字;input name$ phone room height; ($符号代表该列为列名型,就是这一列是文字!!比如名字,性别,科目等等)cards;rebeccah 424 112 (中间是数据集,中间每一行末尾不要加逗号,但是carol 450 112 数据集最后要加一个分号!!)louise 409 110gina 474 110mimi 410 106alice 411 106brenda 414 106brenda 414 105david 438 141betty 464 141holly 466 140;proc print data=; (这一过程步是打印出数据集,可要可不要!)run;*数据集中的框架我会用加粗来显示,大家主要记加粗的,下面的编程部分都是这样!!二、基本统计分析1.用INSIGHT计算统计量1)在INSIGHT中打开数据集在菜单中选择“Solution(解决方案)”→“Analysis(分析)”“Interactive Data Analysis(交互式数据分析)”,打开“SAS/INSIGHT Open”对话框,在对话框中选择数据集,单击“Open(打开)”按钮,即可在INSIGHT中打开数据窗口2)选择菜单“Analyze(分析)”→“Distribution (Y)(分布)”,打开“Distribution (Y)”对话框。
SAS数据整理的16个技巧

SAS数据整理的16个技巧SAS是一种广泛使用的数据分析和统计软件,而数据整理是数据分析过程中的重要一环。
在SAS中,有很多技巧可以帮助我们有效地进行数据整理和清洗。
下面是16个常用的SAS数据整理技巧。
1.了解数据的结构:在开始进行数据整理之前,我们需要先了解数据的结构,包括数据的类型、变量、变量类型等等。
这样有助于我们制定适当的数据整理策略。
2.导入数据:使用SAS的数据导入功能将数据文件导入到SAS中进行处理。
3.查看数据:使用PROCCONTENTS和PROCPRINT等SAS的过程来查看导入的数据,并了解数据的基本信息。
4.缺失值处理:使用IFTHEN语句来判断和处理数据中的缺失值。
可以选择删除缺失值、替换缺失值、插补缺失值等处理方法。
5.去除重复值:使用PROCSORT和PROCSORTNODUPKEY等SAS过程来去除数据中的重复观测值。
6.数据排序:使用PROCSORT对数据进行排序。
可以根据一个或多个变量进行排序。
7.变量重命名:使用RENAME语句来重命名变量名称。
可以将变量名称改为更直观和易懂的名称。
8.缺失值编码:通过对缺失值进行编码,将缺失值特别标记出来,便于后续数据分析。
9.数据变量类型转换:使用DATA步骤和相关函数将数据变量的类型进行转换。
可以将字符型转换为数值型,反之亦然。
10.缺失值填充:使用PROCMEANS、PROCSUMMARY等过程计算变量的均值、中位数等统计量,然后使用DATA步骤和ARRAY和DO循环等SAS技巧将缺失值进行填充。
11.创建指标变量:通过使用IFTHEN语句基于一些条件来创建指标变量。
例如,可以根据一些变量的取值来创建一个二元指标变量。
12.数据合并:使用PROCAPPEND、SET语句和DATA步骤将多个数据集合并成一个数据集。
13.数据分割:使用DATA步骤和IFTHEN语句将数据集按照一些变量进行拆分,例如将数据按照时间、地区等因素进行分割。
SAS的sum语句
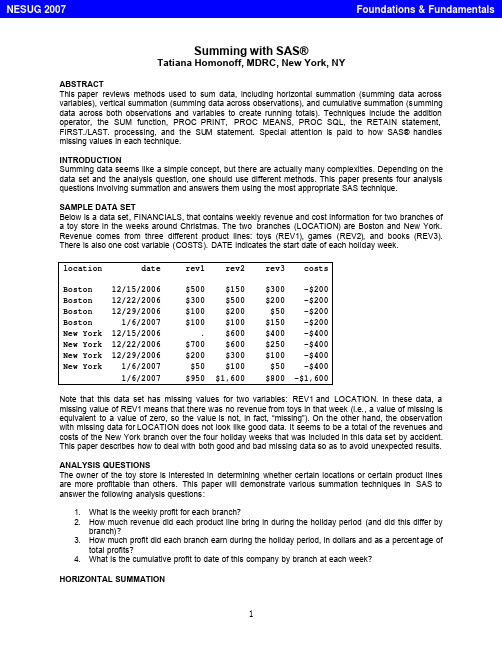
Summing with SAS®Tatiana Homonoff, MDRC, New York, NYABSTRACTThis paper reviews methods used to sum data, including horizontal summation (summing data across variables), vertical summation (summing data across observations), and cumulative summation (summing data across both observations and variables to create running totals). Techniques include the addition operator, the SUM function, PROC PRINT, PROC MEANS, PROC SQL, the RETAIN statement, FIRST./LAST. processing, and the SU M statement. Special attention is paid to how SAS® handles missing values in each technique.INTRODUCTIONSumming data seems like a simple concept, but there are actually many complexities. Depending on the data set and the analysis question, one should use different methods. This paper presents four analysis questions involving summation and answers them using the most appropriate SAS technique.SAMPLE DATA SETBelow is a data set, FINANCIALS, that contains weekly revenue and cost information for two branches of a toy store in the weeks around Christmas. The two branches (LOCATION) are Boston and New York. Revenue comes from three different product lines: toys (REV1), games (REV2), and books (REV3). There is also one cost variable (COSTS). DATE indicates the start date of each holiday week.location date rev1 rev2 rev3 costsBoston 12/15/2006 $500 $150 $300 -$200Boston 12/22/2006 $300 $500 $200 -$200Boston 12/29/2006 $100 $200 $50 -$200Boston 1/6/2007 $100 $100 $150 -$200New York 12/15/2006 . $600 $400 -$400New York 12/22/2006 $700 $600 $250 -$400New York 12/29/2006 $200 $300 $100 -$400New York 1/6/2007 $50 $100 $50 -$4001/6/2007 $950 $1,600 $800 -$1,600Note that this data set has missing values for two variables: REV1 and LOCATION. In these data, a missing value of REV1 means that there was no revenue from toys in that week (i.e., a value of missing is equivalent to a value of zero, so the value is not, in fact, “missing”). On the other hand, the observation with missing data for LOCATION does not look like good data. It seems to be a total of the revenues and costs of the New York branch over the four holiday weeks that was included in this data set by accident. This paper describes how to deal with both good and bad missing data so as to avoid unexpected results. ANALYSIS QUESTIONSThe owner of the toy store is interested in determining whether certain locations or certain product lines are more profitable than others. This paper will demonstrate various summation techniques in SAS to answer the following analysis questions:1. What is the weekly profit for each branch?2. How much revenue did each product line bring in during the holiday period (and did this differ bybranch)?3. How much profit did each branch earn during the holiday period, in dollars and as a percent age oftotal profits?4. What is the cumulative profit to date of this company by branch at each week?HORIZONTAL SUMMATIONHorizontal summation refers to adding values across variables within each observation (or row). Since each observation in our data set has revenue and cost information by week and branch, horizontal summation is used to answer the first question:•What is the weekly profit for each branch?The sum of revenue from the three product lines minus costs (which is actually plus in this data set since the “cost” variable stores negative numbers) by observation is the total weekly profit by branch for each branch and week.THE ADDITION OPERATORThe first and most straightforward horizontal summation method is the addition operator (+). The addition operator returns a numeric value that is the sum of the arguments. The code to produce profit using this method is below. It also deletes the observation where the information on the branch location is missing since this observation was erroneously included in the data.data financials2;set financials;profit = rev1 + rev2 + rev3 + costs ;where location ne ' ';run;The resulting data set, FINANCIALS2, looks as follows:location date rev1 rev2 rev3 costs profitBoston 12/15/2006 500 150 300 -200 750Boston 12/22/2006 300 500 200 -200 800Boston 12/29/2006 100 200 50 -200 150Boston 1/6/2007 100 100 150 -200 150New York 12/15/2006 . 600 400 -400 .New York 12/22/2006 700 600 250 -400 1150New York 12/29/2006 200 300 100 -400 200New York 1/6/2007 50 100 50 -400 -200This method produces the expected value of profit when there are complete data (i.e., no missing values) for all revenue and cost variables, but it assigns a missing value to the profit variable when any of the arguments is missing (as is the case for the toy revenue in the New York branch for the week beginning December 15th). Depending on the data set, this might be the desired result. If there is truly missing revenue data, the profit variable should be missing as well; if the missing data were ignored, SAS would produce a numeric value for the profit variable that would be look complete, but in reality would be inaccurate since it only contained revenue from two out of the three product lines.As mentioned above, however, in this data set, revenue is missing when there was no revenue for that product line and is, in fact, “good” data. So rather than assigning the profit variable a value of missing when there are missing revenue data, SAS should ignore the arguments with missing values and generate the profit variable using only the arguments with non-missing values. This will require a different technique.THE SUM FUNCTIONThe SUM function is another horizontal summation method. It works in the same way that the addition operator does but handles missing values differently. The SUM function ignores missing values and excludes them in the summation. If all values of the arguments are missing, it returns a missing value. I f there is even one non-missing argument, however, it returns the sum. The code to produce profit using the SUM function is:profit = SUM(rev1, rev2, rev3, costs) ;The resulting data set, FINANCIALS2, looks as follows:location date rev1 rev2 rev3 costs profitBoston 12/15/2006 500 150 300 -200 750Boston 12/22/2006 300 500 200 -200 800Boston 12/29/2006 100 200 50 -200 150Boston 1/6/2007 100 100 150 -200 150New York 12/15/2006 . 600 400 -400 600New York 12/22/2006 700 600 250 -400 1150New York 12/29/2006 200 300 100 -400 200New York 1/6/2007 50 100 50 -400 -200SAS ignored the argument with a missing values when calculating the profit variable, which is the desired result.See the appendix for various shortcuts using the SUM function.VERTICAL SUMMATIONNow that the first analysis question has successfully been answered, we turn to the second: •How much revenue did each product line bring in during the holiday period (and did this differ by branch)?While the first analysis question required summation of several variables within observations, the second analysis question requires summation of individual variables across observations. T his is what is called vertical summation.THE PRINT PROCEDUREThe simplest method of vertical summation is the PRINT procedure. PROC PRINT does not allow for the creation of any new variables nor does it create a data set with summary variables. It does, however, print sums of existing variables that are specified in a SUM statement below the raw data. The WHERE statement excludes observations with missing branch data from being printed and being included in the summation. Missing values of the variables in the SUM statement are ignored; if all values are missing, the total is zero.proc print data = financials;sum rev1 rev2 rev3;where location ne ' ';run;SAS prints the following output:location date rev1 rev2 rev3 costsBoston 12/15/2006 500 150 300 -200Boston 12/22/2006 300 500 200 -200Boston 12/29/2006 100 200 50 -200Boston 1/6/2007 100 100 150 -200New York 12/15/2006 . 600 400 -400New York 12/22/2006 700 600 250 -400New York 12/29/2006 200 300 100 -400New York 1/6/2007 50 100 50 -400==== ==== ====1950 2550 1500A BY statement can also be used with PROC PRINT to sum revenue by branch. Both the totals by branch and the grand total are printed. Note that the data must be sorted by the BY variable.proc sort data=financials;by location;run;proc print data = financials;sum rev1 rev2 rev3;where location ne ' ';by location;run;SAS prints the following output:location=Bostondate rev1 rev2 rev3 costs12/15/2006 500 150 300 -20012/22/2006 300 500 200 -20012/29/2006 100 200 50 -2001/6/2007 100 100 150 -200---- ---- ----1000 950 700location=New Yorkdate rev1 rev2 rev3 costs12/15/2006 . 600 400 -40012/22/2006 700 600 250 -40012/29/2006 200 300 100 -4001/6/2007 50 100 50 -400---- ---- ----950 1600 800==== ==== ====1950 2550 1500THE MEANS PROCEDUREThe MEANS procedure is a data summarization tool used to calculate descriptive statistics for variables across all observations and within groups of observations. One of these statistics is SUM. This procedure is far more flexible than PROC PRINT, mainly because it can store results in an output data set that can be manipulated.SUMMATION ACROSS ALL OBSERVATIONSThe first part of question two can be answered by using PROC MEANS to sum each of the three revenue variables across every observation in the data set. Note that without the inclusion of a WHERE statement, the summary variables would include the observation where the branch location was missing, thereby double-counting the revenue from New York.proc means data=financials noprint;var rev1 rev2 rev3;output out=revsum (drop=_type_ _freq_)sum(rev1-rev3)=revsum1-revsum3;where location ne ' ';run;The resulting data set, REVSUM, looks as follows:revsum1 revsum2 revsum31950 2550 1500This data set contains the grand total of the revenue of each product line across all branches and weeks. Note that SAS ignores the missing revenue value in the first product line rather than generating a missing value for the total. While there is no option in PROC MEANS that assigns a missing value to the summary variable when there are missing values for the analysis variable, if the NMISS statistic is specified, SAS will create a variable that counts the number of missing v alues in the specified analysis variable. This variable can be inspected to determine whether the summary variable is excluding any observations due to missing data.SUMMATION BY GROUP USING THE BY STATEMENTThe second part of the second analysis question requires vertical summation by branch rather than across all observations.•How much revenue did each product line bring in during the holiday period (and did this differ by branch)?This can be accomplished by adding a BY statement to the MEANS procedure. The input data set must be sorted by the BY group variable – in this case, LOCATION. Note that PROC MEANS considers a missing value to be a legitimate BY group value. Without the WHERE statement, all observations with a missing branch location would be summed together. T his can create unexpected results if there are many observations with missing branch location values.proc sort data=financials;by location;run;proc means data=financials noprint;var rev1 rev2 rev3;output out=revsum_bybranch (drop=_type_ _freq_)sum(rev1-rev3)=revsum1-revsum3;by location;where location ne ' ';run;The resulting data set, REVSUM_BYBRANCH looks as follows:location revsum1 revsum2 revsum3Boston 1000 950 700New York 950 1600 800THE SQL PROCEDUREThe third analysis question is:•How much profit did each branch earn during the holiday period, in dollars and as a percent of total profits?This question highlights some of the key limitations of PROC PRINT and PROC MEANS. PROC PRINT prints summary statistics, but cannot store them in a SAS data set; therefore, they are not available for future calculations (e.g., creating branch profits as a percent of total profits). While PROC MEANS does allow summary statistics to be stored in an output data set, it only summarizes variables that already exist in the input data set. Since the PROFIT variable does not exist in the raw data set, it would have to becreated in a DATA step before summing vertically using PROC MEANS. A second DATA step is required to create branch profits as a percent of total profits.NESTED SUM FUNCTIONSThe SQL procedure provides a way to do all of this in one step. In PROC SQL, when multiple columns are specified in an aggregate function (like the SUM function), the values in each row of the columns are calculated. If that SUM function is then nested in a second SUM function, SAS produces a grand total of the calculated variable across all observations. In other words, the inner SUM function is performing the horizontal summation while the outer SUM function is performing the vertical summation. This method can be used to calculate total profit over all weeks and branches. Note that SQL does not support variable lists in the SUM function. Observations with missing branch data should be removed with a WHERE clause.proc sql;create table financials_sum asselectsum(sum(rev1,rev2,rev3,costs)) as branch_profitfrom financialswhere location ne ' ';quit;The resulting data set, FINANCIALS_SUM, looks as follows:branch_profit3600THE GROUP BY STATEMENTHowever, the third analysis question asks for the total profits by branch, not overall profits. PROC SQL can vertically sum profit by branch to create the variable BRANCH_PROFIT, dollar amount of profit by branch, using a GROUP BY statement. As with PROC MEANS, PROC SQL ignores missing values of the analysis variables in the SELECT statement, but it treats missing GROUP BY variables as valid data. Unlike PROC MEANS, PROC SQL does not require data to be sorted by the GROUP BY variable(s).proc sql;create table financials_sum asselectlocation,sum(sum(rev1,rev2,rev3,costs)) as branch_profitfrom financialswhere location ne ' 'group by location;quit;The resulting data set, FINANCIALS_SUM, looks as follows:location branch_profitBoston 1850New York 1750THE SELECT STATEMENT SUBQUERYThe previous step calculated profit by branch in dollars, but the analysis question also asks for profit by branch as a percent of total profits. The first step to do this is to add total profits to the data set created above. In PROC MEANS, this would require a second step; in PROC SQL, this can be done in the same step by using a subquery nested in parentheses.A subquery is a query that is nested in another query. This subquery is executed first. Note that the variable TOTAL_PROFIT that is created in the subquery must also be referenced in the outer query inorder to be included in the created table. In order to exclude observations with missing branch information when calculating the BRANCH_PROFIT and TOTAL_PROFIT variables, there must be a WHERE clause in the subquery as well in the outer query.proc sql;create table financials_sum asselectlocation,sum(sum(rev1,rev2,rev3,costs)) as branch_profit,total_profitfrom financials,(selectsum(sum(rev1,rev2,rev3,costs)) as total_profitfrom financialswhere location ne ' ')where location ne ' 'group by location;quit;The resulting data set, FINANCIALS_SUM, looks as follows:location branch_profit total_profitBoston 1850 3600New York 1750 3600The final step to answering this analysis question is to create the variable BRANCH_PCT – the profits by branch as a percent of total profits. This, too, can be created in the same SQL procedure. Note that since BRANCH_PROFIT is calculated in the outer query, it must be preceded by the word “calculated,” but since TOTAL_PROFIT was calculated in the subquery, it is not. This is because the inner subquery result is added to all rows selected by the outer query.proc sql;create table financials_sum asselectlocation,sum(sum(rev1,rev2,rev3,costs)) as branch_profit,total_profit,calculated branch_profit/total_profit as branch_pctformat=percent8.2from financials,(selectsum(sum(rev1,rev2,rev3,costs)) as total_profitfrom financialswhere location ne ' ')where location ne ' 'group by location;quit;The resulting data set, FINANCIALS_SUM, looks as follows:location branch_profit total_profit branch_pctBoston 1850 3600 51.39%New York 1750 3600 48.61%CUMULATIVE SUMMATIONThe final analysis question is:•What is the cumulative profit to date of this company by branch at each week?The previous section showed that PROC SQL was far more versatile than the DATA step and PROC MEANS for answering the analysis questions. SQL, however, does not process rows (observations) in a particular order. There is no easy way to use PROC SQL to sum data cumulatively (i.e., to sum data across variables and observations to create running totals), as the final analysis question requires.THE RETAIN STATEMENT AND THE SUM FUNCTIONThe SUM function was introduced in the section on horizontal summation in order to sum revenue and costs across variables within an observation to create the profit variable. SAS, however, automatically sets variables that are created within an assignment statement (like the profit variable) to “missing” before each iteration of the DATA step.The RETAIN statement can be used to prevent SAS from re-initializing the values of created variables before each iteration of the DATA step. In other words, the value calculated in the previous observation is carried down to the following observation. When the SUM function is combined with the RETAIN statement, the sum from the previous observation is carried down and added to the value in the current observation. This method can be used to calculate a running total of profits, CUMPROFIT, at each observation. In the following code, the variable CUMPROFIT is initialized to zero, summed with the PROFIT variable, then carried down to the following observation. If the zero were omitted from the RETAIN statement. CUMPROFIT would be initialized to “missing.”data financials_cum;set financials;if location ne ' ';profit=sum(rev1,rev2,rev3,costs);retain cumprofit 0;cumprofit=sum(cumprofit,profit);run;The resulting data set, FINANCIALS_CUM, looks as follows:location date rev1 rev2 rev3 costs profit cumprofitBoston 12/15/2006 500 150 300 -200 750 750Boston 12/22/2006 300 500 200 -200 800 1550Boston 12/29/2006 100 200 50 -200 150 1700Boston 1/6/2007 100 100 150 -200 150 1850New York 12/15/2006 . 600 400 -400 600 2450New York 12/22/2006 700 600 250 -400 1150 3600New York 12/29/2006 200 300 100 -400 200 3800New York 1/6/2007 50 100 50 -400 -200 3600FIRST./LAST. PROCESSINGThe cumulative profit variable created above contains the correct cumulative profits for the Boston branch. T he RETAIN statement, however, carries over the final total profit for the Boston branch to the first observation of the New York branch. In order to obtain the correct cumulative profit for the New York branch, the CUMPROFIT variable must be reset to zero at the first observation of the New York branch. This can be done with FIRST./LAST. processing. The following code sets the cumulative profit variable to zero at the first occurrence of each value of LOCATION. Note that this statement must come before the SUM function in order for the cumulative profit to include the profits from the first week in each branch. Observations are sorted by branch and week. The FIRST./LAST. code would c ause errors if the data were not sorted by the BY variable LOCATION, but it does not require that the dates be in order. However, if the dates were out of order, the cumulative profit variable would be meaningless, or at least would not help answer the final analysis question. The next step adds a PROC SORT to ensure that the data are sorted correctly.proc sort data=financials;by location date;run;data financials_cum;set financials;by location;if location ne ' ';profit=sum(rev1,rev2,rev3,costs);retain cumprofit;if first.location then cumprofit=0;cumprofit=sum(cumprofit,profit);run;The resulting data set, FINANCIALS_CUM, looks as follows:location date rev1 rev2 rev3 costs profit cumprofitBoston 12/15/2006 500 150 300 -200 750 750Boston 12/22/2006 300 500 200 -200 800 1550Boston 12/29/2006 100 200 50 -200 150 1700Boston 1/6/2007 100 100 150 -200 150 1850New York 12/15/2006 . 600 400 -400 600 600New York 12/22/2006 700 600 250 -400 1150 1750New York 12/29/2006 200 300 100 -400 200 1950New York 1/6/2007 50 100 50 -400 -200 1750THE SUM STATEMENTThe SUM statement creates the same results as combining the SUM function with the RETAIN statement, but is slightly more efficient. The SUM statement initializes the variable on the left of the plus sign (+) to zero, retains the variable, and adds the value of the expression on the right of the plus sign to the variable. It ignores missing values and treats an expression that produces a missing value as zero. The following code creates the same output as shown above.proc sort data=financials;by location date;run;data financials_cum;set financials;by location;if location ne ' ';profit=sum(rev1,rev2,rev3,costs);if first.location then cumprofit=0;cumprofit+profit;run;CONCLUSIONWhile there are many methods to sum data in SAS, some may be more appropriate or save more time than others. It is important to think critically about the analysis question before deciding which type of summation (horizontal, vertical, or cumulative) is needed to answer it and which SAS technique is best. It is also important to be aware of missing values in the data and to understand how SAS handles them in each technique.CONTACT INFORMATIONTatiana HomonoffResearch AnalystMDRC16 East 34th Street, 19th FloorNew York, NY 10016Phone: (212) 340-8629Fax: (212) 684-0832Tatiana.Homonoff@SAS and all other SAS Institute Inc. product or service names are registered trademarks or trademarks of SAS Institute Inc. in the USA and other countries. ® indicates USA registration. Other brand and product names are trademarks of their respective companies.APPENDIXWhile there are only three types of revenue in this data set, suppose there were 50. Creating the profit variable would appear to require a lot of typing, but SAS has a few shortcuts.NUMERIC VARIABLE LISTSThe three revenue variables all have the same naming convention, “Rev”<number>, and can be referenced as a numeric list (e.g., REV1-REV3). SAS produces unexpected results, however, when combining numeric lists with the SUM function.profit = SUM(rev1-rev3, costs) ;The resulting data set, FINANCIALS2, looks as follows:location date rev1 rev2 rev3 costs profitBoston 12/15/2006 500 150 300 -200 0Boston 12/22/2006 300 500 200 -200 -100Boston 12/29/2006 100 200 50 -200 -150Boston 1/6/2007 100 100 150 -200 -250New York 12/15/2006 . 600 400 -400 -400New York 12/22/2006 700 600 250 -400 50New York 12/29/2006 200 300 100 -400 -300New York 1/6/2007 50 100 50 -400 -400Rather than reading “REV1- REV3” as a numeric list, SAS interprets it as subtraction of REV3 fromREV1. This is not the desired result. If the numeric list is preceded with OF, however, SAS produces the desired result.profit = SUM(OF rev1-rev3, costs) ;Note that if there were more than one variable list in the set of arguments, each list would need to be preceded with its own OF.PREFIX LISTSA prefix list can be used to shorten the code even further. Specify the variable prefix followed by a semicolon (e.g., REV:). All variables that start with a prefix can be referenced by prefix:. Used without an OF, SAS generates an error. With an OF, SAS produces the desired result.profit = SUM(OF rev: , costs) ;POSITIONAL VARIABLE LISTSIn this data set, the three revenue variables have the same naming convention, which allowed the use of the numeric and prefix lists. If that were not the case, but the summation argument variables were still adjacent to one another in the data set, a positional list could be used. Specify the first variable to use, two dashes, and the last variable to use (e.g. REV1--COSTS).Again, without the use of an OF, SAS produces unexpected results: it treats the double dash as double subtraction, i.e. addition, of REV1 and COSTS, rather than a positional list. SAS evaluates the expression in parentheses first. Since it assumes that the positional list is actually an arithmetic operator, the result of the inner expression is a single argument. If either of the variables in the inner expression is missing, the result of the inner expression is missing. Therefore, since the only argument to the SUM function is missing, the result of the whole expression is missing.profit = SUM(rev1--costs) ;The resulting data set, FINANCIALS2, looks as follows:location date rev1 rev2 rev3 costs profitBoston 12/15/2006 500 150 300 -200 300Boston 12/22/2006 300 500 200 -200 100Boston 12/29/2006 100 200 50 -200 -100Boston 1/6/2007 100 100 150 -200 -100New York 12/15/2006 . 600 400 -400 .New York 12/22/2006 700 600 250 -400 300New York 12/29/2006 200 300 100 -400 -200New York 1/6/2007 50 100 50 -400 -350Use OF to produce the desired results.profit = SUM(OF rev1--costs) ;WHERE CAN THESE TECHNIQUES BE USED?The examples above use the addition operator and the SUM function in assignment statements to create variables in a DATA step. They can also be used to subset data in an IF or WHERE statement in a DATA step or in a WHERE statement in a PROC step. However, while the IF statement supports the variable lists shortcuts described above, the WHERE statement does not.。
sas求和语句
sas求和语句
嘿,朋友!你知道 SAS 求和语句吗?这玩意儿可神奇啦!
比如说,你有一堆数据,就像散落在地上的珍珠,而 SAS 求和语句就是那根能把它们串起来的线。
想象一下,你是个商店老板,每天都
有各种商品的销售记录。
如果没有 SAS 求和语句,你怎么能快速知道
一段时间内某种商品的总销售额呢?
再比如,你在做一个关于学生成绩的统计。
每个学生都有不同科目
的分数,这时候SAS 求和语句就能帮你轻松算出全班某一科目的总分,是不是很厉害?
那 SAS 求和语句到底咋用呢?其实很简单,就像你做一顿美味的饭菜,先准备好食材,这里的“食材”就是你的数据,然后按照特定的“菜谱”,也就是语法规则来操作。
比如说,你可以用 PROC SUM 这个步骤,然后指定你要计算总和
的变量,这不就像你明确了要炒的是青菜还是肉一样嘛!
怎么样,是不是觉得 SAS 求和语句还挺有意思的?我觉得啊,它就是数据分析里的一把利剑,能帮我们在数据的海洋中快速找到想要的
结果!。
SAS软件和统计应用教程(1)PPT课件

-
2
SAS软件与统计应用教程
2.1.1 统计学的基本概念
STAT
1. 总体与样本
总体(population):总体是指所研究对象的全体组成 的集合。
样 本 (sample) : 样 本 是 指 从 总 体 中 抽 取 的 部 分 对 象 (个体)组成的集合。样本中包含个体的个数称为样本 容量。容量为n的样本常用n个随机变量X1,X2,…,Xn 表示,其观测值(样本数据)则表示为x1,...,xn,为 简单起见,有时不加区别。
SAS软件与统计应用教程
STAT
第二章 SAS的描述统计功能
2.1 描述性统计的基本概念 2.2 在SAS中计算统计量 2.3 统计图形
-
1
SAS软件与统计应用教程
STAT
2.1 描述性统计的基本概念
2.1.1 统计学的基本概念 2.1.2 表示数据位置的统计量 2.1.3 表示数据分散程度的统计量 2.1.4 表示数据分布形状的统计量 2.1.5 其它统计量
SAS软件与统计应用教程
2.1.3 表示数据分散程度的统计量
STAT
1. 极差(Range)与半极差(Interquartile range)
极差就是数据中的最大值和最小值之间的差:
极差 = max{xi} – min{xi} 上、下四分位数之差Q3 – Q1称为四分位极差或半极 差,它描述了中间半数观测值的散布情况。
SAS软件与统计应用教程
STAT
2. 峰度(kurtosis)
峰度描述数据向分布尾端散布的趋势。峰度的计算公
式为: K
n (n 1 )
n(x i x )43 (n 1 )2
(n 1 )n ( 2 )n ( 3 )i 1 s (n 2 )n ( 3 )
sas aggregate函数用法
在SAS软件中,AGGREGATE函数是一个非常有用的函数,它可以帮助用户对数据进行聚合分析和计算。
该函数主要用于数据集中的数据统计,比如求和、平均值、最大值、最小值等。
在本文中,我将介绍AGGREGATE函数的基本用法,并且深入探讨其在数据分析中的应用和意义。
让我们来了解AGGREGATE函数的基本语法和用法。
AGGREGATE函数通常包括以下几个参数:FUNC、BY、OUTPUT和DATA。
其中,FUNC参数用于指定要进行的统计运算,比如求和(SUM)、平均值(MEAN)、最大值(MAX)和最小值(MIN)等;BY参数用于指定进行聚合的变量;OUTPUT参数用于指定结果输出的数据集;DATA参数用于指定输入的数据集。
下面我以一个实际的案例来帮助你更好地理解AGGREGATE函数的用法。
假设我们有一个销售数据集,其中包括产品ID、销售数量和销售金额等字段。
我们想要对销售数据进行统计分析,比如计算每个产品的总销售数量和总销售金额。
这时,我们就可以使用AGGREGATE函数来实现这一目的。
我们需要指定FUNC参数为SUM,表示要进行求和运算;BY参数为产品ID,表示要按产品进行分组计算;OUTPUT参数指定输出的数据集为新的数据集;DATA参数指定输入的数据集为原始的销售数据集。
通过这样的设定,我们就可以得到一个新的数据集,其中包括产品ID、总销售数量和总销售金额等字段,这样就实现了对销售数据的聚合统计分析。
除了求和运算外,AGGREGATE函数还支持多种其他统计运算,比如平均值、最大值、最小值等。
这样,用户可以根据实际需求进行灵活的数据分析和统计计算。
总结回顾一下,AGGREGATE函数是SAS软件中一个非常实用的函数,它可以帮助用户对数据进行聚合分析和统计计算。
通过设定不同的参数,用户可以实现对数据的多种统计运算,比如求和、平均值、最大值和最小值等。
在实际应用中,AGGREGATE函数可以帮助用户快速、准确地进行数据分析,从而为决策提供有力的支持。
很全的sas基础知识(一)
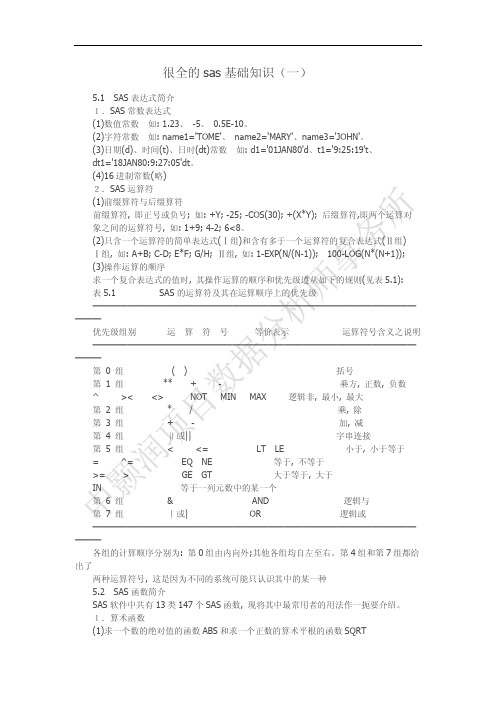
很全的sas基础知识(一)5.1SAS表达式简介1.SAS常数表达式(1)数值常数如: 1.23、-5、0.5E-10。
(2)字符常数如: name1='TOME'、name2='MARY'、name3='JOHN'。
(3)日期(d)、时间(t)、日时(dt)常数如: d1='01JAN80'd、t1='9:25:19't、dt1='18JAN80:9:27:05'dt。
(4)16进制常数(略)2.SAS运算符(1)前缀算符与后缀算符前缀算符, 即正号或负号; 如: +Y; -25; -COS(30); +(X*Y); 后缀算符,即两个运算对象之间的运算符号, 如: 1+9; 4-2; 6<8。
(2)只含一个运算符的简单表达式(Ⅰ组)和含有多于一个运算符的复合表达式(Ⅱ组)Ⅰ组, 如: A+B; C-D; E*F; G/H; Ⅱ组, 如: 1-EXP(N/(N-1));100-LOG(N*(N+1));(3)操作运算的顺序求一个复合表达式的值时, 其操作运算的顺序和优先级遵从如下的规则(见表5.1): 表5.1SAS的运算符及其在运算顺序上的优先级━━━━━━━━━━━━━━━━━━━━━━━━━━━━━━━━━━━━━━━━优先级组别运算符号等价表示运算符号含义之说明━━━━━━━━━━━━━━━━━━━━━━━━━━━━━━━━━━━━━━━━第0 组()括号第 1 组**+-乘方, 正数, 负数^><<>NOT MIN MAX逻辑非, 最小, 最大第 2 组*/乘, 除第 3 组+-加, 减第 4 组‖或||字串连接第 5 组<<=LT LE小于, 小于等于=^=EQ NE等于, 不等于>=>GE GT大于等于, 大于IN等于一列元数中的某一个第 6 组&AND逻辑与第7 组|或|OR逻辑或━━━━━━━━━━━━━━━━━━━━━━━━━━━━━━━━━━━━━━━━各组的计算顺序分别为: 第0组由内向外;其他各组均自左至右。
sas总分范围
SAS总分范围1. 任务背景SAS(Statistical Analysis System)是一种统计分析系统,广泛应用于数据分析、数据挖掘、预测分析等领域。
在SAS中,总分范围是指在某个指标下所有观测值的最小值和最大值之间的范围。
本文将详细介绍SAS总分范围的计算方法和应用场景。
2. 计算方法SAS总分范围的计算方法通常包括以下几个步骤:步骤一:数据准备首先,需要准备一组数据集,其中包含了待分析的指标数据。
步骤二:计算最小值和最大值使用SAS的统计分析函数,可以很方便地计算出指标数据的最小值和最大值。
例如,可以使用PROC UNIVARIATE过程中的VAR语句来指定待分析的变量,然后使用OUTPUT OUT=语句将最小值和最大值保存到一个新的数据集中。
PROC UNIVARIATE DATA=dataset;VAR variable;OUTPUT OUT=summary MIN=min_value MAX=max_value;RUN;步骤三:计算总分范围最后,可以通过计算最大值减去最小值,得到指标数据的总分范围。
DATA range;SET summary;range = max_value - min_value;RUN;3. 应用场景SAS总分范围的计算在数据分析中有着广泛的应用场景,以下是几个常见的例子:例子一:财务管理在财务管理中,可以使用SAS总分范围来评估不同投资组合的风险。
通过计算不同投资组合的总分范围,可以比较它们的波动性和稳定性,从而帮助投资者做出明智的投资决策。
例子二:市场调研在市场调研中,可以使用SAS总分范围来评估产品或服务的满意度。
通过对消费者的调查数据进行分析,计算出满意度指标的总分范围,可以帮助企业了解产品或服务在市场上的表现,并采取相应的改进措施。
例子三:医学研究在医学研究中,可以使用SAS总分范围来评估某种治疗方法的效果。
通过对患者的观测数据进行分析,计算出某个指标的总分范围,可以帮助医生和研究人员判断该治疗方法的疗效,进而做出合理的临床决策。
sas总分范围
sas总分范围
(最新版)
目录
1.SAS 总分的含义
2.SAS 总分的计算方法
3.SAS 总分的范围
4.SAS 总分的应用领域
正文
1.SAS 总分的含义
SAS(Statistical Analysis System)总分是指在统计分析过程中,对样本数据进行统计分析后得出的一个综合性得分。
SAS 总分通常用于衡量样本数据的集中趋势、离散程度以及分布形态,从而为数据分析人员提供有关数据特性的重要信息。
2.SAS 总分的计算方法
SAS 总分的计算方法主要包括描述性统计分析、t 检验、方差分析、回归分析等多种方法。
这些方法分别适用于不同类型的数据集和分析需求。
计算 SAS 总分时,需要根据数据类型、数据量、数据分布等特点选择适
当的统计方法,并对数据进行相应的处理。
3.SAS 总分的范围
SAS 总分的范围通常在 -1 到 1 之间。
其中,-1 到 0 之间表示数据集的离散程度较低,0 到 1 之间表示数据集的离散程度较高。
此外,SAS 总分越接近 0,表示数据集的分布越接近正态分布;而 SAS 总分越接近 1 或 -1,表示数据集的分布越偏离正态分布。
4.SAS 总分的应用领域
SAS 总分作为一种重要的数据分析工具,广泛应用于各个领域,如自然科学、社会科学、医学研究等。
通过计算 SAS 总分,可以更好地了解数据的特性,为后续的数据分析和决策提供有力支持。
- 1、下载文档前请自行甄别文档内容的完整性,平台不提供额外的编辑、内容补充、找答案等附加服务。
- 2、"仅部分预览"的文档,不可在线预览部分如存在完整性等问题,可反馈申请退款(可完整预览的文档不适用该条件!)。
- 3、如文档侵犯您的权益,请联系客服反馈,我们会尽快为您处理(人工客服工作时间:9:00-18:30)。
SAS中计算总和或者计算总数的方法在SAS中,计算数据总和或者计算数据总数有多种方法。
下面将介绍一些常用的方法:
1. 使用PROC MEANS:PROC MEANS是用于计算数据统计指标的过程。
对于计算数据总和,我们可以使用SUM选项。
例如,以下代码将计算变量"var"的总和和总数:
```
proc means data=dataset sum n;
var var;
run;
```
其中,"dataset"是数据集名称,"var"是变量名称。
SUM选项用于计算总和,N选项用于计算总数。
2. 使用PROC SQL:PROC SQL是一种在SAS中进行SQL查询的过程。
通过使用SUM函数和COUNT函数,我们可以计算总和和总数。
例如,以下代码将计算变量"var"的总和和总数:
```
proc sql;
select sum(var) as total_sum, count(var) as total_count
from dataset;
quit;
```
其中,"dataset"是数据集名称。
SUM函数用于计算总和,COUNT函数用于计算总数。
3.使用DATA步:可以使用DATA步编写SAS代码来计算数据总和和总数。
以下是一个示例代码:
```
data dataset_summary;
set dataset;
sum_var + var;
count_var + 1;
run;
proc print data=dataset_summary;
run;
```
在这个例子中,我们通过DATA步将数据集中的每个观测值的"var"变量加到"sum_var"变量中,并将每个观测值计数加到"count_var"变量中。
然后使用PROC PRINT将这些变量的结果输出。
4. 使用SUMMARY步:SUMMARY步是用于创建摘要报告的过程。
通过设置类别变量和SUM选项,我们可以计算数据总和和总数。
例如,以下代码将计算变量"var"的总和和总数:
```
proc summary data=dataset nway;
var var;
output out=dataset_summary sum=sum_var count=count_var;
run;
proc print data=dataset_summary;
run;
```
其中,"dataset"是数据集名称。
SUM选项用于计算总和,COUNT选项用于计算总数。
上述是几种常见的在SAS中计算数据总和或者计算数据总数的方法。
根据不同的需求和数据结构,选择适合的方法进行计算即可。