安捷伦N9020A
MXA-N9020A编程纪要

安捷伦MXA N-9020A信号分析仪编程权利声明:本文系雷声天下个人学习使用,愿与广大网友分享,仅可用于教育、研究用途,如用于商业用途,一经发现,必然追究当事人责任!1 网上资料整理(以下内容选自/products/instrument/demos.html?file=/products/demos/shipping/instrument/acquireIQSignal.html)1.1 介绍本文展示了如何从安捷伦X-系列信号分析仪中通过TCP/IP接口获取数据。
本文实验使用了N9020A,MXA信号分析仪。
1.2 需求运行本文的实例需要安捷伦N9020A信号分析仪。
1.3定义测量参数在进行测量之前需要定义一些参数,根据你所测量的信号,你需要定义如下参数。
% Specify the IP address of the signal analyzer 设置信号分析仪IP地址addressMXA = '10.123.123.123';% Specify the IP address of the signal analyzer 设置信号分析仪IP地址addressMXA = '10.123.123.123';% Center frequency of the modulated waveform (Hz) 调制信号的中心频率centerFrequency = 2.14e9;% Bandwidth of the signal (Hz) 信号带宽bandwidth = 25e6;% Measurement time (s) 测量时间measureTime = 8e-3;% Mechanical attenuation in the signal analyzer(dB) 信号分析仪机械衰减mechAttenuation = 0;% Start frequency for Spectrum Analyzer view 信号分析仪开始频谱startFrequency = 2.11e9;% Stop frequency for Spectrum Analyzer view 信号分析仪截至频谱stopFrequency = 2.17e9;% Resolution Bandwidth for Spectrum Analyzer view 频谱分析仪视图分辨率带宽resolutionBandwidth = 200e3;% Video Bandwidth for Spectrum Analyzer view 频谱分析仪视频带宽videoBandwidth = 300;1.4 与仪器链接在连接到仪器之前应当完成以下工作a 通过链接网线,建立起仪器和电脑之间的物理连接b 调整输入缓存的大小以确保仪器的回传数据可以被保存下来c 建立最大时间参数,以保证数据传送有一个时间限制d 链接到仪器上%%=====================================================================================%%% establish a TCP/IP object with the IP address and the interface number 建立一个TCP/IP对象参数包括了前述IP地址和相应的端口设置,如本地的5025 signalAnalyzerObject=tcpip(addressMXA, 5025);% set the size of the Buffer 设定数据缓存的大小set(signalAnalyzerObject,'InputBufferSize',30e6);% set the timeout parameter 设定数据传输最大延时set(signalAnalyzerObject,'Timeout',20);% open the instrument object 打开仪器设备对象,正式建立连接fopen(signalAnalyzerObject);%%=====================================================================================%%1.5 查询仪器识别信息重启设备使得设备明确当前处在SCPI命令模式下。
实验指导书1-屏蔽部件的屏蔽效能测试实验指导书

屏蔽部件的屏蔽效能测试实验指导书一、实验目的理解屏蔽的分类,加强对屏蔽效能概念理解,掌握屏蔽效能测试原理及方法。
二、实验原理屏蔽效能是同一地点无屏蔽存在时的电磁场强度与加屏蔽体后的电磁场强度之比。
(一)屏蔽效能计算方法后前P PSE lg 10=()12SE A A dB =-其中:SE 为屏蔽效能,P 前和A 1为自由空间校准接收功率值,P 后和A 2为屏蔽后接收到的接收功率值。
测量原理图如图1所示。
图1屏蔽效能测试原理图 (二)屏效测试使用天线测试频段 频率范围 标准测试天线 低频段100Hz~30MHz环形天线三、实验仪器1.电磁屏蔽室(含屏效测试窗口)2信号源SP1642B,信号源MG3694A;3.测试天线组:KSTM-1013环形天线,KSTM-2213对称振子天线,KSTH-0508微波喇叭天线(各一对);4. 安捷伦N9020A微波频谱分析仪;5.测试电缆1#、2#、3#及附件;6.被试屏蔽材料样件。
四、实验内容及步骤实验内容:(一)磁场屏效测试(1)测试频点:250 kHz 、1MHz、30MHz(4)加屏蔽体后的测试。
(二)电场屏效测试(1)测试频点:300MHz、1GHz 。
(3)自由空间测试。
(4)加屏蔽体后的测试。
(三)平面波屏效测试(1)测试频点:4GHz、6GHz 。
(4)加屏蔽体后的测试。
测试具体步骤(以磁场频效测试为例):1.按原理图连接测试系统,经检查系统连接正常后,将信号发生器的电源插头插入220V电源,按下“电源”开关,将信号源预热30分钟;2.自由空间测试,将信号源输出频率依次调为实验内容中的测试频点,输出功率为+20dBm;在每个频率点下,在频谱仪中读出接收到的相应频率点处的功率电平幅度dBm值记为A1;3.加屏蔽体后的测试,保持信号源输出功率不变,通过频谱仪读出有屏蔽时接收到的相应频率点处的功率电平dBm值记为A2;注:应保证受试屏蔽样件与屏蔽室测试窗口安装法兰的电连续,尤其注意安装螺栓的均匀紧固,减小安装孔缝对测试结果的影响。
安捷伦科技噪声系数测试仪选择指南

查找更多信息 /find/nf 2
噪声系数的测量技术
两种主要的噪声系数测量 方法为:
● Y 因子
● 冷噪声源法
要找到有关这些方法的更多信 息,请参见应用指南 57-1,射 频和微波噪声系数测量基础, 文献编号: 5952-8255E。
为了选择适当的仪表满足您测量噪声系数的要求,有必要首先了解一些测 试噪声系数的基本原理以及与之相关的测量结果的不确定性。噪声系数测量的 不确定性不仅取决于测试设备,同时也是被测器件 (DUT) 的某些特征,例如 S 参数和噪声参数的函数。
交互作用 S 参数 抖动
导致测试结果不确定性的因素
使用Y因子方法,主要的误差来源是噪声源与DUT之间的失配,以及DUT 产生的噪声与测试系统之间的相互作用。如果在测试环境中增加了 ATE 网络 (在噪声源与 DUT 之间增加了一个电网络 — 主要是开关和测试电缆) 则会导 致更大的误差。使用 PNA-X 的基于源校准的冷噪声源方法,最大的误差来源 是噪声源的 ENR 的不确定性,在校准的过程中,它会影响 PNA-X 的内部噪声 接收机的测量结果。
查找更多信息 /find/nf 3
测量结果的不确定性
有几个关键因素会影响到整个噪声系数测量结果的不确定性。选择噪声系 数测试方案时,非常重要的一点是要选择一种能把影响整个噪声系数不确定性 诸因素中最主要因素的影响降低到最小的方法。
这些可以影响噪声系数测量结果不确定性的因素,有一部分可在仪表的技 术指标中找到,例如仪表本身测试结果的不确定性、超噪声比 (ENR) 的不确定 性和抖动等。而其它因素则取决于测试系统与 DUT 之间的相互作用。例如,由 于系统源匹配的不完善 (偏离理想的 50 欧姆),就会有两种误差来源。第一个 为失配误差,这会导致测试系统与 DUT 之间的能量传送不理想。第二个误差 源则来自于DUT内部产生的噪声与从DUT一侧看到的源匹配 (Γs) 之间的相互 作用。下图比较了 Y 因子方法与冷噪声源方法 (PNA-X 所用的方法) 之间噪声 系数测量结果的不确定性。在这个例子中放大器的噪声系数为 3 dB,增益为 15 dB,输入和输出匹配为 10 dB,其噪声参数也是比较适中的 (Fmin = 2.8 dB、 Γopt = 0.27 + j0 和 Rn= 37.4)。对于 Y 因子方法,在计算噪声系数测试结果的 不确定性时考虑了两种不同的情况: 一种情况是噪声源与DUT直接连接; 另一 种情况是在噪声源和 DUT 之间有一个电网络 — 用它来仿真自动测试系统 (ATE) 中所用到的各种开关和测试电缆,以便把它们带来的损耗在测试结果中 校准掉。在这个以 PNA-X 为例的示意中包也括了 ATE 网络。
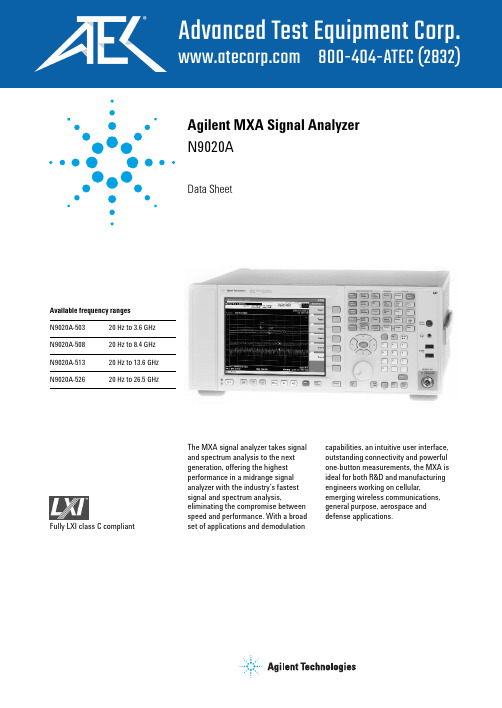
N9020A Signal Analyzer Data Sheet
Accelerate to market
Every device demands decisions that require tradeoffs in your goals—customer specs, throughput, yield. With a highly flexible signal analyzer, you can manage and minimize those tradeoffs. Keysight Technologies Inc.’s mid-performance MXA is the ultimate accelerator as your products move from design to the marketplace. It has the flexibility to quickly adapt to your evolving test requirements—today and tomorrow. Maximize your flexibility, and accelerate to market, with the Keysight MXA signal analyzer.
Frequency range Option 503 Option 508 Option 513 Option 526 Band 0 1 2 3 4 Frequency reference Accuracy Aging rate DC coupled 10 Hz to 3.6 GHz 10 Hz to 8.4 GHz 10 Hz to 13.6 GHz 10 Hz to 26.5 GHz LO multiple (N) 1 1 2 2 4 10 Hz to 3.6 GHz 3.5 to 8.4 GHz 8.3 to 13.6 GHz 13.5 to 17.1 GHz 17 to 26.5 GHz ± [(time since last adjustment x aging rate) + temperature stability + calibration accuracy] 1 Option PFR Standard ± 1 x 10⁻⁷ / year ± 1 x 10⁻⁶ / year –7 ± 1.5 x 10 / 2 years Option PFR Standard ± 1.5 x 10⁻⁸ ± 2 x 10⁻⁶ –8 ± 5 x 10 ± 2 x 10⁻⁶ Option PFR Standard ± 4 x 10⁻⁸ ± 1.4 x 10⁻⁶ –7 –8 = ± (1 x 1 x 10 + 5 x 10 + 4 x 10⁻⁸) = ± 1.9 x 10⁻⁷ ≤ (0.25 Hz x N) p-p in 20 ms, nominal ≤ (10 Hz x N) p-p in 20 ms, nominal See band table above for N (LO multiple) AC coupled 10 MHz to 3.6 GHz 10 MHz to 8.4 GHz 10 MHz to 13.6 GHz 10 MHz to 26.5 GHz
安捷伦N9020A频谱仪操作说明
一.电平测量操作步骤1.打开频谱仪;2.点击按键矩阵左侧的模式选择“Mode”键,液晶屏右侧出现一列模式选项;3.点击液晶屏右侧与“Spectrum Analyzer”对应按键,进入频谱测量模式;4.点击按键矩阵中左下角的“Meas”按键(即测量项选择键),液晶屏的右侧出现一列测试选项;5.点击“Channel Power”对应的右侧按键,即进入电平测量界面;6.点击按键矩阵上的“Meas Setup”键,液晶屏右侧出现一列电平检测设置项;7.点击“Integ BW”对应的右侧按键(即代表测量带宽),在数字键盘上输入所测频点的带宽,此时液晶屏上出现一列单位,点击所需单位对应的右侧按键(例如所测频点的带宽为8MHz,在数字键盘上点击8,再点击液晶屏上MHz对应的右侧按键);8.点击按键矩阵的“FREQ Channel”键,液晶屏右侧出现一列频率设置选项;9.点击“Center FREQ”,在数字键盘中键入所测频点的中心频率,此时液晶屏上出现一列单位,点击所需单位对应的右侧按键;10.液晶屏左下角显示所测频点的电平,显示格式为“*dBm/8MHz”。
代表8MHz内的功率;11.若功率值没有达到预期,可以尝试点击按键矩阵上“AMPTD”键,再点击“Attenuation”,最后按校准按钮即可校准电平测量值。
二.寄生输出抑制比(带外抑制)测量操作步骤1.打开频谱仪;2.点击按键矩阵左侧的模式选择“Mode”键,液晶屏右侧出现一列模式选项;3.点击液晶屏右侧与“Spectrum Analyzer”对应按键,进入频谱测量模式;4.点击按键矩阵中左下角的“Meas”按键(即测量项选择键),液晶屏的右侧出现一列测试选项;5.点击“Swept SA”对应的右侧按键,即进入频谱测量界面;6.点击“FREQ Channel”键,液晶屏右侧出现一列频率设置选项;7.点击“Start FREQ”右侧对应的按键,并通过数字键盘输入45,此时液晶屏右侧出现一列单位,从上到下依次为“GHz”,“MHz”和“Hz”,点击“MHz”对应的右侧按键;8.点击“Start FREQ”右侧对应的按键,并通过数字键盘输入1,此时液晶屏右侧出现一列单位,从上到下依次为“GHz”,“MHz”和“Hz”,点击“GHz”对应的右侧按键。
N9020A经济型信号分析仪产品简介
Keysight N9020A MXAX 系列信号分析仪10 Hz~3.6、8.4、13.6 或26.5 GHz技术资料目录定义与条件 (3)频率和时间技术指标 (4)幅度精度与范围技术指标 (6)动态范围技术指标 (8)PowerSuite 测量技术指标 (12)一般技术指标 (13)输入和输出 (14)IQ 分析仪 (16)IQ 分析仪-选件B40 (17)IQ 分析仪-选件B85/B1A/B1X (18)实时频谱分析仪(RTSA) (19)相关文献 (19)本技术资料是 MXA 信号分析仪的技术指标和条件摘要。
如欲获取完整的技术指标指南,请访问: /find/mxa_specifications 加速上市每个器件都需要您在客户技术指标、吞吐量和产率等目标之间做出权衡。
借助高度灵活的信号分析仪,您可以管理并最大程度地保证所有目标。
是德科技中档MXA 是您的终极加速器,可帮助您加快产品从设计到上市的速度。
它还具有出色的灵活性,可以迅速适应用户不断变化的测试要求―包括当前的要求和未来的要求。
借助是德科技MXA 信号分析仪,您可以最大限度地提升灵活性并缩短产品上市时间。
定义与条件技术指标是指产品保证中所包括的参数性能,除非特别注明,这些技术指标只在0°C 到55°C1的完整温度范围内有效。
95% 表示环境温度在20 至30°C 内时,预计有95% 的把握在95% 的情况下能够达到性能容限范围(~ 2σ)。
除了仪器样品的统计观测数据之外,这些值还包括外部校准参考的不确定度影响。
我们不保证仪器性能可以达到这些参数值。
如果生产仪器的统计观测特性出现重大变化,有时候会对这些值进行更新。
典型值是指不在产品保修范围内的其它产品性能信息。
当性能超出技术指标时,80% 的样本在20~30°C 的温度范围内可表现出95% 的置信度。
典型性能不包括测量不确定度。
标称值是指预计的性能,或表示在产品应用中有用但未包含在产品保修范围内的产品性能。
N9020A MXA X-Series 信号分析器配置指南说明书
N9020A MXA X-Series Signal Analyzer Confi guration GuideThis MXA confi guration guide will help you determine whichperformance options, measurement applications, accessories, and services to include with your new MXA or to add as upgrades to anexisting MXA.M902N902X-Ser1981This step-by-step process will help you configure your MXA. Capabilities that are listed as standard come with the instrument at no additional charge. Tailor the performance to meet your requirements.For detailed specifications, refer to the MXA signal analyzer specification guide (N9020-90113). For a summary of specifications, refer to the MXA signal analyzer data sheet (5989-4942EN).21. N9020A-B25 is standard for all MXA's ordered after May 1, 2011.34567Portable confi guration includes pivoting carrying handle and protectivecorner rubber guards (front protective cover comes standard) – N9020A-PRC MXA bench top confi gurationFor more information on accessories go to: /fi nd/accessories89Instrument UpgradesUpgrade your existing MXA/find/mxa_upgrades10Instrument Upgrades11cdma2000® is a registered certifi cation mark of the T elecommunications Industry Association. Used under license. Bluetooth and the Bluetooth logos are trademarks owned by Bluetooth SIG, Inc., U.S.A. and licensed to Agilent T echnologies, Inc. WiMAX™ is a trademark of the WiMAX Forum ®. Windows ® and MS Windows are U.S. registered trademarks of Microsoft ® Corporation.Agilent Email Updates/find/emailupdates Get the latest information on the products and applications you select.LAN eXtensions for Instruments puts the power of Ethernet and the Web inside your test systems. Agilent is a founding member of the LXI consortium.Agilent Channel Partnersw w w /find/channelpartners Get the best of both worlds: Agilent’s measurement expertise and product breadth, combined with channel partner convenience./find/mxaRelated LiteratureAgilent MXA Signal Analyzers Brochure 5989-5047EN Data Sheet5989-4942ENX-Series Measurement 5989-8019ENApplications, BrochureFor more information on Agilent Tech-nologies’ products, applications or services, please contact your local Agilent office. The complete list is available at:/find/contactus Americas Canada (877) 894 4414 Brazil (11) 4197 3600Mexico 01800 5064 800 United States (800) 829 4444Asia Pacific Australia 1 800 629 485China 800 810 0189Hong Kong 800 938 693India 1 800 112 929Japan 0120 (421) 345Korea 080 769 0800Malaysia 1 800 888 848Singapore 180****8100Taiwan 0800 047 866Other AP Countries (65) 375 8100 Europe & Middle East Belgium 32 (0) 2 404 93 40 Denmark 45 45 80 12 15Finland 358 (0) 10 855 2100France 0825 010 700**0.125 €/minuteGermany 49 (0) 7031 464 6333 Ireland 1890 924 204Israel 972-3-9288-504/544Italy39 02 92 60 8484Netherlands 31 (0) 20 547 2111Spain 34 (91) 631 3300Sweden0200-88 22 55United Kingdom 44 (0) 118 927 6201For other unlisted countries:/find/contactusRevised: January 6, 2012Product specifications and descriptions in this document subject to change without notice.© Agilent Technologies, Inc. 2012Published in USA,January 24, 20125989-4943ENAgilent Advantage Services is committed to your success throughout your equip-ment’s lifetime. To keep you competitive, we continually invest in tools andprocesses that speed up calibration and repair and reduce your cost of ownership. You can also use Infoline Web Services to manage equipment and services more effectively. By sharing our measurement and service expertise, we help you create the products that change our world./quality/find/advantageservices。
Agilent MXA信号分析器N9020A数据手册说明书
Agilent MXA Signal Analyzer N9020AData SheetThe MXA signal analyzer takes signal and spectrum analysis to the next generation, offering the highest performance in a midrange signal analyzer with the industry’s fastest signal and spectrum analysis,eliminating the compromise between speed and performance. With a broad set of applications and demodulationcapabilities, an intuitive user interface,outstanding connectivity and powerful one-button measurements, the MXA is ideal for both R&D and manufacturing engineers working on cellular,emerging wireless communications,general purpose, aerospace and defense applications.Available frequency ranges N9020A-503 20 Hz to 3.6 GHz N9020A-50820 Hz to 8.4 GHz N9020A-513 20 Hz to 13.6 GHz N9020A-52620 Hz to 26.5 GHzFully LXI class C compliant2Definitions and ConditionsSpecifications describe the performance of parameters covered by the product warranty and apply over 5 to 50 °C unless otherwise noted. 95th percentile values indicate the breadth of the population (≈2σ) of performance tolerances expected to be metin 95 percent of the cases witha 95 percent confidence, for any ambient temperature in the range of 20 to 30 °C. In addition to the statistical observations of a sample of instruments, these values include the effects ofthe uncertainties of external calibration references. These values are not warranted. These values are updated occasionally if a significant change in the statistically observed behaviorof production instruments is observed. Typical describes additional product performance information that is not covered by the product warranty.It is performance beyond specifications that 80 percentof the units exhibit with a95 percent confidence level over the temperature range 20 to30°C. Typical performance does not include measurement uncertainty. Nominal values indicate expected performance, or describe product performance that is useful in the application of the product, but is not covered by the product warranty.The analyzer will meet itsspecifications when:•The analyzer is within itscalibration cycle.•Under auto couple control,except that Auto Sweep TimeRules = Accy.•For signal frequencies<20MHz, DC coupling applied.•The analyzer has been storedat an ambient temperaturewithin the allowed operatingrange for at least two hoursbefore being turned on, if ithad previously been storedat a temperature range insidethe allowed storage rangebut outside the allowedoperating range.•The analyzer has been turnedon at least 30 minutes withAuto Align set to normal, orif Auto Align is set to off orpartial, alignments must havebeen run recently enough toprevent an Alert message. Ifthe Alert condition is changedfrom Time and Temperature toone of the disabled durationchoices, the analyzer may failto meet specifications withoutinforming the user.This MXA signal analyzer datasheet is a summary of thecomplete specifications andconditions, which are availablein the MXA Signal AnalyzerSpecification Guide. The MXASignal Analyzer SpecificationGuide can be obtained on the webat: /find/mxa.Then follow this selectionprocess:•Select Technical Support underKey Library Information•Select Manuals and Guides•Download specifications guide3Frequency and Time Specifications456Amplitude Accuracy and Range Specifications78Dynamic Range Specifications10Figure 1. Nominal dynamic range – Band 0, for second and third order distortion, 20 Hz to 3.6 GHz Figure 2. Nominal dynamic range – Bands 1 to 4, second and third order distortion, 3.6 GHz to 26.5 GHzSecond harmonic distortion (SHI)Mixer level Distortion SHI10 MHz to 1.8 GHz–15 dBm–60 dBc+45 dBm1.8 to 7.0 GHz–15 dBm–80 dBc+65 dBm7.0 to 11.0 GHz–15 dBm–70 dBc+55 dBm11.0 to 13.25 GHz–15 dBm–65 dBc+50 dBm Preamp on (Option P03, P08, P13, P26)Preamp level Distortion SHI10 MHz to 1.8 GHz–45 dBm–75 dBc nominal+30 dBm nominal1.8 to 13.25 GHz–50 dBm–60 dBc nominal+10 dBmThird-order intermodulation distortion (TOI) (two –30 dBm tones at input mixer with tone separation > 15 kHz, 20 to 30 °C )Distortion TOI Typical10 to 100 MHz –84 dBc+12 dBm +17 dBm100 to 400 MHz –88 dBc+14 dBm +18 dBm400 MHz to 1.7 GHz –90 dBc+15 dBm +19 dBm1.7 to 3.6 GHz –92 dBc+16 dBm+19 dBm3.6 to 8.4 GHz –90 dBc+15 dBm+18 dBm8.4 to 13.6 GHz –90 dBc+15 dBm+18 dBm13.6 to 26.5 GHz –80 dBc+10 dBm+14 dBm Preamp on (Option P03, P08, P13, P26)10 MHz to 3.6 GHz20 dB lower than non-preamp mode, nominal(two –45 dBm tones at preamp input) 3.6 to 26.5 GHz35 dB lower than non-preamp mode, nominal, for offset <10 MHz3.6 to 26.5 GHz–14 dB, nominal, for offset >20 MHzPhase noise3Noise sidebands Offset Specification Typical(20 to 30 °C, CF = 1 GHz)100 Hz –80 dBc/Hz –86 dBc/Hz1 kHz –100 dBc/Hz nominal10 kHz –103 dBc/Hz –106 dBc/Hz100 kHz –115 dBc/Hz –117 dBc/Hz1 MHz –134 dBc/Hz –136 dBc/Hz10 MHz –147 dBc/Hz nominal 3For nominal values, refer to Figure 3.Figure 3. Nominal phase noise at different center frequencies (with Option PFR)Power Suite Measurement SpecificationsPower Suite Measurement Specifications (continued)General SpecificationsGeneral Specifications (continued)Input and OutputsInput and Outputs (continued)MXA Signal Analyzer Ordering InformationFor further information, refer to MXA Signal Analyzer Configuration Guide (5989-4943EN)Related LiteratureAgilent Technologies’ Test and Measurement Support, Services, and AssistanceAgilent Technologies aims to maximize the value you receive, while minimizing your risk and problems. We strive to ensure that you get the test and measurement capabilities you paid for and obtain the support you need. Our extensive support resources and services can help you choose the right Agilent products for your applications and apply them successfully.Every instrument and system we sell has a global warranty. Two concepts underlie Agilent’s overall support policy: “Our Promise” and “Your Advantage.”Our PromiseOur Promise means your Agilent test and measurement equipment will meet its advertised performance and functionality. When you are choosing new equipment, we will help you with product information, including realistic performance specifications and practical recommendations from experienced test engineers. When you receive your new Agilent equipment, we can help verify that it works properly and help with initial product operation.Your AdvantageYour Advantage means that Agilent offers a wide range of additional expert test and measurement services, which you can purchase according to your unique technical and business needs. Solve problems efficiently and gain a competitive edge by contracting with us for calibration, extra-cost upgrades, out-of-warranty repairs, and on-site education and training, as well as design, system integration, project management, and other professional engineering services. Experienced Agilent engineers and technicians worldwide can help you maximize your productivity, optimize the return on investment of your Agilent instruments and systems, and obtain dependable measurement accuracy for the life of those products.For more information on Agilent Technologies’products, applications or services, please contact your local Agilent office. The complete list is available at:/find/contactus Phone or Fax United States:(tel) 800 829 4444(fax) 800 829 4433Canada:(tel) 877 894 4414(fax) 800 746 4866China:(tel) 800 810 0189(fax) 800 820 2816Europe:(tel) 31 20 547 2111Japan:(tel) (81) 426 56 7832(fax) (81) 426 56 7840Korea:(tel) (080) 769 0800(fax) (080) 769 0900Latin America:(tel) (305) 269 7500Taiwan:(tel) 0800 047 866(fax) 0800 286 331Other Asia Pacific Countries:(tel) (65) 6375 8100(fax) (65) 6755 0042Email:*****************Contacts revised: 05/27/05Product specifications and descriptions in thisdocument subject to change without notice.© Agilent Technologies, Inc. 2006Printed in USA, August 31, 20065989-4942EN Agilent Email Updates/find/emailupdates Get the latest information on the products and applications you /find/mxa/find/agilentdirectQuickly choose and use your test equipment solutions with confidence.Agilent Open /find/open Agilent Open simplifies the process of connecting and programming test systems to help engineers design, validate and manufacture electronic products. Agilent offers open connectivity for a broad range of system-ready instruments, open industry software,PC-standard I/O and global support, which are combined to more easily integrate test system development.。
安捷伦频谱仪所有型号指南
安捷伦频谱和信号分析仪选型指南引言安捷伦科技公司拥有全面的频谱分析仪和信号分析仪产品线,频率范围覆盖直流至 325G Hz,可对失真、杂散、相位噪声和无线通信信号的频率、幅度和调制进行精确测量。
这些仪器和 89600B 矢量信号分析(VSA)软件(一种灵活的调制分析软件或测量应用软件)结合使用后,可进一步扩展仪器功能,对广泛的标准数字信号和通用数字信号和格式进行解调。
购买信号分析仪器是一项重要投资。
购买的仪器不仅要满足当前的工作需求,而且要适应未来的要求。
鉴于每个项目和用户都有不同的需求,选择能够满足所有需求的最佳仪器可能会十分复杂且耗时,而时间就是金钱。
安捷伦作为全球领先的测试测量公司,可提供广泛的分析仪和应用软件,满足各个层次的预算需求。
本选型指南将帮助您轻松找到最适合您自身需求的频谱分析仪或信号分析仪。
产品定义频谱分析仪和信号分析仪传统意义上的频谱分析仪是指可提供幅度/频率显示、具备调谐扫描功能的超外差接收机。
当今分析仪具有调谐扫描功能和 FFT 体系结构。
尽管“频谱分析仪”和“信号分析仪”两个术语现在常常互换使用,但对于当今可进行全面频域、时域和调制域信号分析的分析仪来说,“信号分析仪”一词更为准确。
台式分析仪和手持式分析仪台式频谱/信号分析仪可提供优异的射频技术指标和测量应用软件。
而手持式频谱分析仪更被那些由于频谱空间日益拥挤、射频技术不断演进而需要花费大量时间在外场完成工作的射频工程师或技术人员所青睐。
为了解决他们所面临的难题,手持式频谱分析仪需要具备坚固、精确、快速且简单易用等特性。
测量应用软件和测量软件安捷伦提供了基于 PC 和基于仪器的应用软件,以满足从研发、故障诊断到一键完成制造测量的测试需求,这些软件适用于广泛的通信标准和调制类型。
EMI 和 EMC 解决方案电磁干扰(EMI)是由设备的辐射或传导发射造成的。
EMI 分析仪和接收机能够准确定位干扰源的频率和位置,从而减少或消除干扰信号。
Agilent N9020A使用说明书
Functional TestsAgilent TechnologiesN9020A MXA Signal AnalyzerManufacturing Part Number: N9020-90086Supersedes: N9020-90054Printed in USAAugust 2008© Copyright 2006 - 2008 Agilent Technologies, Inc.NoticeThe information contained in this document is subject to change without notice.Agilent Technologies makes no warranty of any kind with regard to this material, including but not limited to, the implied warranties of merchantability and fitness for a particular purpose. Agilent Technologies shall not be liable for errors contained herein or for incidental or consequential damages in connection with the furnishing, performance, or use of this material.Where to Find the Latest InformationDocumentation is updated periodically. For the latest information about Agilent MXA signal analyzer, including software updates and application information, please visit the following Internet URLs:/find/mxa1.Functional TestsFunctional Test Versus Performance Verification . . . . . . . . . . . . . . . . . . . . . . . . . . . . . . . . . 6 Contents of this Document . . . . . . . . . . . . . . . . . . . . . . . . . . . . . . . . . . . . . . . . . . . . . . . . . . . 7 Before Performing a Functional Test . . . . . . . . . . . . . . . . . . . . . . . . . . . . . . . . . . . . . . . . . . . 8 Test Equipment . . . . . . . . . . . . . . . . . . . . . . . . . . . . . . . . . . . . . . . . . . . . . . . . . . . . . . . . . . . . 9 2.Displayed Average Noise Level (DANL)Procedure . . . . . . . . . . . . . . . . . . . . . . . . . . . . . . . . . . . . . . . . . . . . . . . . . . . . . . . . . . . . . . . 14 3.Frequency Readout AccuracyProcedure . . . . . . . . . . . . . . . . . . . . . . . . . . . . . . . . . . . . . . . . . . . . . . . . . . . . . . . . . . . . . . . 18 4.Second Harmonic Distortion (SHD)Test Limits . . . . . . . . . . . . . . . . . . . . . . . . . . . . . . . . . . . . . . . . . . . . . . . . . . . . . . . . . . . . . . 20 Procedure . . . . . . . . . . . . . . . . . . . . . . . . . . . . . . . . . . . . . . . . . . . . . . . . . . . . . . . . . . . . . . . 22 5.Amplitude Accuracy at 50 MHzProcedure . . . . . . . . . . . . . . . . . . . . . . . . . . . . . . . . . . . . . . . . . . . . . . . . . . . . . . . . . . . . . . . 25 Testing Preamp Option (P03, P08, P13, P26) . . . . . . . . . . . . . . . . . . . . . . . . . . . . . . . . . . . . 27 Procedure . . . . . . . . . . . . . . . . . . . . . . . . . . . . . . . . . . . . . . . . . . . . . . . . . . . . . . . . . . . . . 27 6.Frequency Response (Flatness)Procedure . . . . . . . . . . . . . . . . . . . . . . . . . . . . . . . . . . . . . . . . . . . . . . . . . . . . . . . . . . . . . . . 31 7.Frequency Response (Flatness), Preamp OnProcedure . . . . . . . . . . . . . . . . . . . . . . . . . . . . . . . . . . . . . . . . . . . . . . . . . . . . . . . . . . . . . . . 35 8.Scale FidelityProcedure . . . . . . . . . . . . . . . . . . . . . . . . . . . . . . . . . . . . . . . . . . . . . . . . . . . . . . . . . . . . . . . 39 9.BBIQ Input Frequency Response (Option BBA only)Procedure . . . . . . . . . . . . . . . . . . . . . . . . . . . . . . . . . . . . . . . . . . . . . . . . . . . . . . . . . . . . . . . 431Functional TestsFunctional tests are tests of various instrument parameters that give a high degree of confidence that the analyzer is operating correctly. They are recommended as a check of analyzer operation for incoming inspection or after a repair. Measurement uncertainty analysis is not available for functional tests, and the analyzer is checked against limits that are wider than the published specifications. The functional tests are designed to test an analyzer operating within the temperature range defined by the analyzer specifications using a minimum set of test equipment. If a test does not pass, performance verification tests must be run to determine whether a problem exists.Functional TestsFunctional Test Versus Performance VerificationFunctional Test Versus Performance VerificationFunctional tests use a minimum set of test equipment to check a much smaller range of parameters (and a limited number of data points for each parameter) than do performance verification tests. Functional tests use limits that are wider than the published specifications; measurement uncertainty analysis is not available for functional tests. NOTE If a functional test does not pass, you must run performance verification tests to determine whether a problem exists.Performance verification tests span a wide range of instrument parameters and provide the highest level of confidence that the instrument conforms to published specifications. These tests can be time consuming and require extensive test equipment.Functional TestsContents of this DocumentContents of this DocumentThis chapter includes the following:•“Before Performing a Functional Test” on page8 (what to do first).•“Test Equipment” on page9 (a list of the equipment required for all of the tests). Subsequent chapters describe the following Functional Tests:•“Displayed Average Noise Level (DANL)” on page13•“Frequency Readout Accuracy” on page17•“Second Harmonic Distortion (SHD)” on page19•“Amplitude Accuracy at 50 MHz” on page23•“Amplitude Accuracy at 50 MHz” on page23•“Frequency Response (Flatness)” on page29•“Frequency Response (Flatness), Preamp On” on page33•“Scale Fidelity” on page37•“BBIQ Input Frequency Response (Option BBA only)” on page41Each functional test includes:•Test limits (pass/fail criteria)• A description of the test•The equipment required for the test• A figure showing how to connect the equipment•Step-by-step instructions•One or more tables in which to record the measurement resultsFunctional TestsBefore Performing a Functional TestBefore Performing a Functional Test1.Ensure that you have the proper test equipment.2.Switch on the unit under test (UUT) and let it warm up (in accordance with warm-uprequirements in the instrument specifications).3.Allow sufficient warm-up time for the required test equipment (refer to individualinstrument documentation for warm-up specifications).4.Ensure that the analyzer’s frequency reference is set to Internal:a.Press the Input/Output, More, Freq Ref In keys.b.If the Freq Ref In softkey does not show Internal, press the Freq Ref In softkey andselect Internal.5.Following instrument warm-up, perform the auto align routine:Press System, Alignments, Align Now, All.NOTE Functional test accuracy depends on the precision of the test equipment used.Ensure that all of the test equipment is calibrated before running a functionaltest.Functional TestsTest EquipmentT EST E QUIPMENTThe table below summarizes the test equipment needed to perform all of the functional tests. Alternate equipment model numbers are given in case the recommended equipment is not available. If neither the recommended nor the alternative test equipment are available, substitute equipment that meets or exceeds the critical specifications listed.AnalyzerOption Item Critical Specifications RecommendedAgilent ModelAlternateAgilentModelAdaptersAll 3.5 mm(f) to 3.5mm(f)(connector saver forsource)Frequency: 10 MHz to 26.5 GHzVSWR: < 1.1:183059B1250-1749All BNC(f)toSMA(m)Frequency: 40 MHz1250-1200All Type N(f) to Type N(f)Frequency: 10 MHz to 18 GHzVSWR: < 1.05:11250-14721250-0777All Type N(m) to 3.5mm(m)Frequency: 10 MHz to 18 GHzVSWR: < 1.1:11250-1743All Type N(m) to 3.5mm(f)Frequency: 10 MHz to 18 GHzVSWR: < 1.1:11250-1744All Type N(f) to 3.5 mm(f)Frequency: 10 MHz to 18 GHzVSWR: < 1.1:11250-1745All Type N(m) to BNC(f)Frequency: 10 MHz to 1 GHzVSWR: < 1.05:11250-1476AttenuatorsAll 10 dB Step Attenuator Frequency: 50 MHzRange: 0 to 70 dB8495A8496AAll 10 dB FixedAttenuator (2 required)Frequency: 50 MHzVSWR: < 1.2:18493C Option0108493AOption 010or8493BOption 010Pxx 30 dB FixedAttenuatorAccuracy: < 0.05 dB @ 50 MHz11708AFunctional TestsTest EquipmentCablesAll 3.5 mm (1 meter)Frequency: 10 MHz to 26.5 GHzVSWR: < 1.4:1Loss: < 2.0 dB11500E8120-4921All Cable, BNC (3required)120 cm (48 in.) BNC cable10503ABBA Cable, BNC120 cm (48 in.) BNC cableFlatness (250kHz to 40MHz)<0.5dB10503ABBA Cable,BNC BNC male23 cm (9 in) max10502ASignal SourceAll SynthesizedSweeper Frequency:10MHz to 26.5GHzHarmonic level:< − 40dBcAmplitude range: 10 to − 20dBmFrequency Accuracy: 0.02%PSG a83630B,83640B,83650BBBA SignalGenerator Frequency:250kHz to 40MHzAmplitude: ~–10 dBmFlatness: < ±0.75 dBE4438C33250APower MeterAll PowerMeter Power Reference Accuracy: ±1.2%Compatible with power sensorE4418B E4419BAll PowerSensor Frequency Range:50MHz to3.66GHzAmplitude Range: −70 to –10dBm 8481D8487D8485DP03Low Power Sensor Frequency Range: 50 MHz to3.6GHzAmplitude Range: –70 to –10dBm 8481D8485D8487DPxx other than P03Low Power Sensor Frequency Range: 50 MHz to26.5GHzAmplitude Range: –70 to –10dBm8485D8487DAnalyzerOption Item Critical Specifications RecommendedAgilent ModelAlternateAgilentModelChapter 111Functional TestsTest EquipmentOscilloscopeAll Agilent Infiniium Oscilloscope Cutoff Frequency : 50MHz Rejection at 65MHz : > 40 dBRejection at 75MHz : > 60 dBRejection at 80 MHz : > 60 dBFrequency: 10 MHz to 26.5 GHz54800BMiscellaneous EquipmentAll Filter, 50 MHz Low Pass Cutoff Frequency : 50MHz Rejection at 65MHz : > 40 dBRejection at 75MHz : > 60 dBRejection at 80 MHz : > 60 dBFrequency: 10 MHz to 26.5 GHz0955-0306526 Power Splitter, 3.5 mm Nominal Insertion Loss : 6 dB Tracking Between Ports :<0.25dB11667B503, 508, 513Power Splitter Nominal Insertion Loss : 6 dB Tracking Between Ports : < 0.25dB11667A 11667B All Termination, 50ΩType N (m) Connector Frequency : 30Hz to 26.5GHz 909AOption 012BBA Termination, 50ΩBNC male Frequency : 250 kHz to 40 MHz11593Aa.PSG model numbers: E8244A, E8254A, E8247C Option 520, E8247C Option H31 or 540, E8257D Option 520, E8257D Option 550, E8257D Option 567, E8267DOption 544.Analyzer Option Item Critical Specifications RecommendedAgilent Model Alternate AgilentModelFunctional TestsTest Equipment12Chapter 1132Displayed Average Noise Level (DANL)Test Limits (with 0 dB input attenuation)See Table 2-1 for values.The Displayed Average Noise Level (DANL) of the signal analyzer is measured across a 10 kHz frequency span at several center frequencies. The analyzer input is terminated into a 50Ω load. A test is performed to assure the measurement is not performed in the presence of a residual response. The measurement is then averaged, and the result is normalized to a 1 Hz bandwidth.Figure 2-1.DANL Test Setup Item Critical Specifications(for this test)RecommendedAgilent ModelTermination, 50Ω Type-N(m)Frequency : DC to 18 GHz 909A Option 012Displayed Average Noise Level (DANL)ProcedureProcedure1.Configure the equipment as shown in Figure 2-1.2.Press Mode, Spectrum Analyzer, Mode Preset on the analyzer.3. Set up the signal analyzer by pressing:FREQ Channel, Center Freq, 10, MHzInput/Output, RF Input, RF Coupling, select DCSPAN X Scale, Span, 10, kHzAMPTD Y Scale, –70, dBmAMPTD Y Scale, Attenuation, Mech Atten, 0, dBBW, Res BW, 1, kHzBW, Video BW, 100, HzMeas Setup, Average/Hold, Number, 20, EnterTrace/Detector, Trace AverageSingle4.Press Restart, then wait for Average/Hold to display 20/20.5.Press View/Display, Display, then press Display Line, On.6.Rotate the knob and set the display line at the average amplitude of the displayed noisefloor by visual inspection.7.Confirm that the measurement is performed on the analyzer noise floor and not on aresidual response within the displayed 10 kHz span.NOTE Ignore the residual response if one appears when taking the measurement. 8.Enter the value of the display line as the Measured Average Noise Level at 10 MHzcolumn in Table2-1.9.Normalize the measured value to a 1 Hz BW by adding –30 dB to the measured value. NOTE The –30 dB value is added because the formula used to calculate the value of the noise power in a 1 Hz BW when measured with a 1 kHz BW is:Normalized Noise = 10 Log (BW 2/BW 1) where BW 2 is the 1 kHz BW wemeasure and BW 1 is 1 Hz BW to which we want to normalize.Therefore, 10 Log (1000) = 30 dB, so the noise floor will be 30 dB lower in a1 Hz BW.10.Enter the normalized value of the displayed average noise level in Table2-1.11.The value of the normalized displayed average noise should be less than thespecification value.12.Change the analyzer center frequency to the next value listed in Table2-1. Press:14Chapter 2Displayed Average Noise Level (DANL)ProcedureFREQ Channel, Center Freq, [Table 2-1 Value], GHz13.Repeat step7 through step12 to fill in the remainder of Table2-1 for your analyzerfrequency range.Table2-1Displayed Average Noise Level (DANL) ResultsCenter Frequency Measured Average NoiseLevel (dBm)Normalized Average NoiseLevel/(1 Hz BW) (dBm)Test Limits(dBm)10 MHz–1502 GHz–1506 GHz–14813 GHz–14720 GHz–14226.5 GHz–135Chapter 215Displayed Average Noise Level (DANL)Procedure16Chapter 217Frequency Readout Accuracy3Frequency Readout AccuracyTest LimitsFrequency Readout Accuracy is equivalent to the following equation:See results table for actual values.The frequency readout accuracy is measured in several spans and center frequencies that allow both internal analyzer synthesizer modes and prefilter bandwidths to be tested. Frequency reference error is eliminated by using the same frequency standard for the analyzer and signal source.Figure 3-1Frequency Readout Accuracy Test Setup Item Critical Specification (for this test)RecommendedAgilent ModelAdapter, Type-N(m), to 3.5mm(f)Frequency : 10 MHz to 1.51 GHz VSWR : < 1.1:11250-1744Adapter, 3.5 mm(f) to 3.5 mm(f)Frequency : 10 MHz to 1.51 GHzVSWR : < 1.1:183059B Cable, 3.5 mm, 1 meter Frequency : 10 MHz to 1.51 GHz VSWR : < 1.4:111500E Cable, BNC, 120 cmFrequency : 10 MHz 10503A Synthesized SweeperFrequency : 10 MHz to 1.51 GHz PSG0.25%span 5%RBW 2 Hz 0.5horizontal resolution ×++×+×()±Frequency Readout AccuracyProcedureProcedure1.Configure the equipment as shown in Figure 3-1. Confirm the analyzer’s built-in autoalignment has been performed within the past 24 hours.2.On the synthesized sweeper, press PRESET, then set the controls as follows:FREQUENCY, 1505, MHzPOWER LEVEL, –10, dBm3.Set up the signal analyzer by pressing:Mode, Spectrum AnalyzerMode PresetInput/Output, More, Freq Ref In, ExternalFREQ Channel, Center Freq, 1505, MHzSPAN X Scale, Span, 2990, MHzTrace/Detector, More, Detector, SampleSingle4.Press Restart.Press Peak Search on the analyzer. If the instrument is functioning correctly, the marker reading in the active function block will be between the values listed in Table3-1.Record the marker value in the Marker Frequency Readout column in Table3-1.5.On the signal analyzer, change the span and center frequency as listed in Table3-1.6.Change the synthesized sweeper frequency to match the center frequency of the analyzer.7.Repeat step4 through step6 until the Marker Frequency Readout column of Table3-1is complete.Table3-1Frequency Readout Accuracy ResultsSpan (MHz)CenterFrequency(MHz)MinimumMarker FrequencyReadoutMaximum299015051495.9MHz1514.1MHz127.215051504.56MHz1505.44MHz54.115051504.8122MHz1505.1878MHz7.9515051504.97240MHz1505.0276MHz0.10615051504.999630MHz1505.000370MHz1.98517.59517.58316MHz517.59684MHz1.98832.50832.49316MHz832.50684MHz18Chapter 34Second Harmonic Distortion (SHD)1920Chapter 4 Second Harmonic Distortion (SHD)Test Limits Test Limits This test checks the second harmonic distortion of the signal analyzer by tuning to twice the input frequency and examining the level of the distortion product. A low pass filter is inserted between the source and the signal analyzer to prevent the source second harmonic from artificially raising the second harmonic product displayed on the analyzer.The power level at the input mixer is 20 dB higher than specified to allow the distortion product to be seen. For example, the instrument specification may state that with a –15dBm signal at the input mixer, the distortion product should be suppressed by >–60dBc.The equivalent Second Harmonic Intercept (SHI) is 45dBm (–15dBm +60dBc). This test is performed with –10 dBm at the mixer and verifies the distortion product is suppressed by –55 dBc. This ensures the SHI is also 45 dBm (–10dBm +55dBc).Applied FrequencyMixer Level Distortion 40 MHz –10 dBm < –55 dBc ItemCritical Specifications (for this test)Recommended Agilent Model Adapter, Type-N(m) toBNC(f)Frequency: 10 MHz to 80MHz VSWR: < 1.05:11250-1476Adapter, BNC(f) toSMA(m)Frequency: 40 to 80 MHz 1250-1200Adapter,3.5 mm(f) to 3.5 mm(f)Frequency: 10 MHz to 80MHz VSWR: < 1.1:183059B Cable, BNC 120 cm (2required)Frequency: 10 to 40 MHz 10503A Filter, 50 MHz LowPassCutoff Frequency : 50 MHz Rejection at 65 MHz : > 40 dB Rejection at 75 MHz : > 60 dB 0955-0306Synthesized Sweeper Frequency : 50 MHzSpectral Purity : Better than –30 dBc PSGSecond Harmonic Distortion (SHD)Test Limits Second Harmonic Distortion Test SetupFigure4-1.Chapter 421Second Harmonic Distortion (SHD)ProcedureProcedure1.Configure the equipment as shown in Figure 4-1..2.Press Mode, Spectrum Analyzer, Mode Preset on the signal analyzer and Preset thesynthesized sweeper.3.Set up the synthesized sweeper by pressing:Frequency, 40, MHzAmplitude, –10, dBm4.Set up the signal analyzer by pressing:Input/Output, More, Freq Ref In, ExternalFREQ Channel, Center Freq, 40, MHzSPAN X Scale, Span, 1, MHz5.On the analyzer, press Peak Search.6.Adjust the synthesized sweeper amplitude for a signal analyzer display of –10 dBm ±0.1dB.7.On the analyzer, activate the marker delta function by pressing the Marker and Deltakeys.8.On the signal analyzer, press:FREQ Channel, Center Freq, 80, MHzMeas Setup, Average/Hold Number, 20, EnterTrace/Detector, Trace AverageSingle9.Press Peak Search. Enter the displayed value under the Measured Second HarmonicDistortion (dBc) heading in Table4-1.Table4-1Second Harmonic Distortion ResultsApplied Frequency (MHz)Measured Second Harmonic Distortion(dBc)Mixer Level(dBm)Specification(dBc)40–10–5522Chapter 45Amplitude Accuracy at 50 MHzTest LimitsAmplitude Accuracy should remain within 1.13dB of the measured source value across the range of source levels and changes in resolution bandwidth. The Preamp (option P03, P08, P13, P26) should remain within ±1.3 dB of measured values.A synthesized sweeper is used as the signal source for the test. The source amplitude is varied using the signal source amplitude control. The attenuation and resolution bandwidth are varied on the signal analyzer. The source amplitude is measured by the power meter and signal analyzer at each setting, and the values compared. The difference between each pair of measurements indicates the amplitude accuracy.Item Critical Specifications Recommended Agilent ModelAdapter Type-N(m), to 3.5 mm(m)1250-1743Adapter 3.5 mm(f) to 3.5 mm(f)83059BAttenuator, 30 dB Accuracy: < 0.5 dB at 50 MHz11708ACable 3.5 mm, 1 meter11500ECable BNC, 120 cm10503APower Meter Compatible with power sensor E4418BPower Sensor Amplitude Range: −25 dBm to 10 dBm8485APower Splitter 3.5 mm (f) connectors6 dB loss11667BSynthesizedSweeperTypical Temperature Stability: 0.01 dBc/°C PSG2324Chapter 5 Amplitude Accuracy at 50 MHz50 Figure 5-1.Amplitude Accuracy Test SetupAmplitude Accuracy at 50 MHzProcedureProcedure1.Zero and calibrate the power meter.2.Configure equipment as shown in Figure 5-1., with the power splitter connected directlyto the signal analyzer input through the adapter.CAUTION To minimize stress on the test equipment connections, support the power sensor.3.If the auto alignment for the analyzer has not been performed within the past 24 hours,press System, Alignments, Align Now, All to perform the auto alignment routine.4.Press Mode, Spectrum Analyzer, Mode Preset on the analyzer.5.Set up the synthesized sweeper by pressing:CW, 50, MHzPower Level, -4, dBmRF (On)6.Set up the signal analyzer by pressing:Input/Output, More, Freq Ref In, ExternalFREQ Channel, Center Freq, 50, MHzSPAN X Scale, 2, MHzAMPTD Y Scale, Attenuation, Mech Atten, 10, dBInput/Output, RF Input, RF Coupling, select DCSweep/Control, Sweep Setup, Swp Time Rules, SA - AccuracyMeas Setup, Average/Hold Number, 20, EnterTrace/Detector, Trace AverageSingle7.Perform the following steps for each row listed in Table5-1.:a.Set the synthesized sweeper amplitude to the value listed in the Nominal SourceAmplitude column in Table5-1.b.Set the Mech Atten as indicated in the Attenuation column in Table5-1.c.Set the Span as listed in the Span column of Table5-1.d.Record the source amplitude, as measured by the power meter, in the Power MeterAmplitude column of Table5-1.e.On the signal analyzer, press Restart.f.Wait for the signal analyzer to finish averaging.g.Press Peak Search.h.Record the signal amplitude, as measured by the analyzer in the MeasuredAmplitude column of Table5-1.Chapter 52526Chapter 5Amplitude Accuracy at 50 MHz Procedure50 i.Calculate the signal amplitude accuracy error using the following equation, and record the results under the Amplitude Accuracy Error column:Amplitude Accuracy Error = Meas_amp − Power_meter Table 5-1.Amplitude Accuracy Results Nominal Source Amplitude (dBm)Attenuation (dB)Span (MHz)Measured Amplitude Meas_amp (dBm)Power Meter Amplitude Power_meter (dBm)Amplitude Accuracy Error (dB)Test Limit (dB)−4102±1.13dB −9101±1.13dB −14100.5±1.13dB −4200.1±1.13dB −14200.1±1.13dB−4300.1±1.13dB−14300.1±1.13dBAmplitude Accuracy at 50 MHzTesting Preamp Option (P03, P08, P13, P26)Testing Preamp Option (P03, P08, P13, P26)Instruments containing Options P03, P08, P13, P26 must have the preamp function turned on and tested.Procedure1.On the analyzer, press AMPTD Y Scale, More, Internal Preamp, Low Band.2.Connect the equipment as shown in Figure 5-1. on page 24, using a 30dB Pad betweenthe adaptor and the signal analyzer input.3.Set the synthesized sweeper amplitude to the value listed in the Nominal SourceAmplitude column in Table5-2.4.Set the signal analyzer input attenuation to 0 dB.5.Set the Span as listed in Table5-2.6.Record the source amplitude, as measured by the power meter, in the Power MeterAmplitude column of Table5-2.7.On the signal analyzer, press Restart.8.Wait for the analyzer to finish averaging.9.Press Peak Search.10.Record the signal amplitude as measured by the analyzer in the measured amplitudecolumn of Table5-2.11.Calculate the signal amplitude accuracy using the following equation:Amplitude Accuracy Error = Meas_amp + 30 dB − Power_meter12.Record the results under the Amplitude Accuracy Error column of Table5-2.Table5-2.Amplitude Accuracy Results (Option P03, P08, P13, P26)Nominal Source Amplitude (dBm)Low-bandPreampRes BW(kHz)Span(kHz)MeasuredAmplitudeMeas_amp(dBm)Power MeterAmplitudePower_meter(dBm)AmplitudeAccuracyError(dB)TestLimit(dB)−13ON1106±1.30dBChapter 527Amplitude Accuracy at 50 MHzTesting Preamp Option (P03, P08, P13, P26)528Chapter 5296Frequency Response (Flatness)Test LimitsThe frequency response test measures the signal analyzer’s amplitude error as a function of the tuned frequency. Measurements are made ranging from 50 MHz to the maximum frequency range of your analyzer. The signal source amplitude is measured with a power meter to eliminate error due to source flatness. The measured value is normalized to 50 MHz.Frequency Range Limit Relative to 50 MHz20 Hz to 3.6 GHz ±1.5 dB> 3.6 GHz to 8.4 GHz ±2.5 dB> 8.4 GHz to 13.6 GHz ±3.0 dB> 13.6 GHz to 26.5 GHz ±3.5 dB Item Critical Specifications (for this test)RecommendedAgilent ModelAdapter, Type N(m) to 3.5 mm(m)Frequency : 10 MHz to 18 GHz VSWR : < 1.1:11250-1743Adapter, 3.5 mm(f) to 3.5 mm(f)Frequency: 10 MHz to 26.5 GHz VSWR : < 1.1:183059BCable, 3.5 mm, 1 meter Frequency : 10 MHz to 26.5 GHz VSWR : < 1.4:111500ECables, BNC 120 cm Frequency : 10 MHz 10503APower Meter Compatible with power sensor E4418BPower Sensor Frequency Range: 50 MHz to 26.5 GHz 8485APower Splitter Frequency Range : 50 MHz to 26.5 GHz Tracking between ports : < 0.25 dB11667BSynthesized Sweeper Frequency Rang e: 50 MHz to 26 GHz PSGFrequency Response (Flatness)Figure6-1Frequency Response Test Setup30Chapter 6Frequency Response (Flatness)ProcedureProcedure1.Zero and calibrate the power meter and power sensor as described in the power meteroperation manual.2.Configure the equipment as shown in Figure 6-1.NOTE Connect the power splitter to the signal analyzer input using the appropriate adapter. Do not use a cable.3.Assure the signal analyzer’s built-in auto alignment has been performed within the last24 hours.4.Press Mode, Spectrum Analyzer, Mode Preset on the signal analyzer, and press Preset onthe synthesized sweeper.5.Set up the synthesized sweeper by pressing:CW, 50, MHzPower level, –4, dBm6.Set up the signal analyzer by pressing:Input/Output, More, Freq Ref In, ExternalFREQ Channel, Center Freq, 50, MHzSPAN X Scale, Span, 50, kHzAMPTD Y Scale, Ref Level, 0, dBm7.Adjust the synthesized sweeper output power for a power meter reading of –10 dBm±0.1 dB.8.On the signal analyzer, press Single.9.Press the Peak Search key on the signal analyzer to position the marker on the peak ofthe signal.10.Refer to Table 6-1, “Frequency Response (Flatness) Results.” Enter the amplitude of thesignal displayed on the signal analyzer into the Meas Amp column of Table6-1.11.Enter the power meter reading into the Power Meter column of Table6-1.12.Tune the synthesized sweeper and signal analyzer to the next frequency listed inTable6-1.13.Enter the power sensor calibration factor into the power meter.14.For frequencies 3.6 GHz and above, press AMPTD Y Scale, then Presel Center to centerthe preselector filter for an optimum amplitude measurement.15.Repeat step7 through step14 and complete the remainder of Table6-1 for thefrequency range of your analyzer.pute the measurement error (Meas Error= Meas Amp− Power Meter).Chapter 631。
Agilent-N9020A使用说明书
功能测试安捷伦科技N9020A MXA 操作手册1功能测试功能测试是对各种仪器参数的测试,这些参数对分析仪是否正常工作具有高度的信心。
建议在进货检验或修理后检查分析仪的运行情况。
测量不确定度分析不适用于功能测试,分析仪应根据比公布规范更宽的限值进行检查。
功能测试旨在使用最小的测试设备,测试分析仪在分析仪规范规定的温度范围内运行的分析仪。
如果测试未通过,则必须运行性能验证测试以确定是否存在问题。
功能测试与性能验证功能测试使用最少的测试设备来检查比性能验证测试小得多的参数范围(以及每个参数的有限数据点)。
功能测试使用比公布规范更宽的限值;测量不确定度分析不适用于功能测试。
注意如果功能测试未通过,则必须运行性能验证测试以确定是否存在问题。
性能验证测试涵盖了广泛的仪器参数,并提供了仪器符合公布规范的最高置信水平。
这些测试可能很耗时,需要大量的测试设备。
本文件内容本章包括以下内容:•“在进行功能测试之前”,(首先要做什么)。
•“测试设备”(所有测试所需的设备清单)。
随后的章节描述了以下功能测试:•“显示平均噪声级(DANL)”•“频率读数精度”•“二次谐波失真(SHD)•“50 MHz振幅精度”•“50 MHz振幅精度”•“频率响应(平坦度)”•“频率响应(平坦度)前置放大器开启”•“刻度保真度”•“BBIQ输入频率响应(仅BBA选项),每个功能测试包括:•测试限值(合格/不合格标准)•测试说明•测试所需的设备•显示如何连接设备的图•逐步说明•记录测量结果的一个或多个表格在执行功能测试之前1.确保你有合适的测试设备。
2.打开被测单元(UUT)并使其预热(根据仪器规范中的预热要求)。
3.为所需的测试设备留出足够的预热时间(有关预热规范,请参阅单独的仪表文档)。
4.确保分析仪的频率参考设置为内部:a、按,键。
输入/输出更多频率参考输入b、如果软键不显示,请按软键并选择。
内部频率参考内部频率参考5.在仪器预热后,执行自动校准程序:按。
仪器使用规范

测试仪器使用规范一、基本要求1、仪器在使用之前和使用之后必须登记,未经容许不得私自拿取仪器或配件。
2、通电前,检查仪器电源电压是否为220V输入,检查电源线有无磨损、断裂和裸露导线,以免引起触电事故,禁止使用2PIN电源线,避免烧坏仪器。
3、使用仪器时,若发现不能正常工作,应及时向设备管理人员报告,以便追究责任人及维修。
4、使用仪器时,如遇到操作困难,应向测试管理人员或熟悉该仪器操作者求助,不得擅自摸索,以免损坏仪器设备。
5、仪器使用过程中出现严重异常反应时需要立即切断电源,列如:内部有烟雾、火花、异味等。
6、禁止将水杯及其他液体放在仪器附近,避免溅入。
7、禁止将仪器叠堆起来,违者罚款。
8、禁止女性同事移动大、中型仪器,如:大中型示波器、网络分析仪、N9020、频谱仪等,避免失力造成损坏。
9、仪器使用后应立即关机,整理相关仪器配件,及时归还。
二、泰克示波器使用规范1、避免在直射阳光下使用,在强光下使用时,要用遮光罩。
2、示波器的机壳必须接地,待测设备地与示波器地之间使用夹线相连。
3、使用人员必须带静电环操作,违者罚款。
4、使用过程中光点不能长时间停留在一点,若长时间不用,要关闭通道,以免损伤荧光屏。
5、拔插示波器探头时,要先关闭通道,再取下探头,禁止通道打开的情况下直接拔插探头。
6、禁止不同型号示波器探头混用,如要混用,必须上报硬件测试主管或经理,确认是否可行。
7、测试过程中要保护好示波器探头,测试中断期间,应将探头放置于示波器顶部,禁止放于杂乱的桌面,禁止探头处于悬空状态。
8、大、中型示波器使用过程中,使用人不得远离,若要离开,必须完全关闭示波器。
9、大、中型示波器尽量使用鼠标、键盘操作,若要触屏操作,必须轻点、轻压。
10、大、中型示波器使用完毕,必须在左下角开始菜单中关闭示波器,禁止直接按关机键关机。
11、示波器使用完毕后,应立刻关机,将探头取下,放回探头包内。
三、网络分析仪使用规范1、仪器使用前必须接地。
安捷伦N9020A频谱仪操作说明

安捷伦N9020A频谱仪操作说明概述安捷伦N9020A是一种高性能的频谱仪,广泛应用于无线通信、雷达、无线电干扰分析等领域。
本文将介绍安捷伦N9020A频谱仪的操作方法,包括设备的启动、参数设置、测量结果的分析等内容。
启动与连接1.将安捷伦N9020A频谱仪与电源连接,并确保电源正常供电。
2.打开频谱仪的电源开关,等待设备启动完毕。
3.使用USB线将频谱仪与计算机连接。
软件安装与配置1.在计算机上安装安捷伦N9020A频谱仪的控制软件。
该软件包括仪表控制、信号发生器控制、数据分析等功能。
2.打开控制软件,并进行设备的连接配置,选择正确的仪表型号和通信接口。
参数设置1.打开控制软件的“参数设置”界面。
2.在界面上选择要测量的频率范围、带宽、功率等参数。
3.根据需要,可以设置触发方式、数据采集模式等其他参数。
测量操作1.点击控制软件的“开始测量”按钮,开始进行频谱分析。
2.频谱仪将会采集到指定频率范围内的信号,并将其显示在软件界面上。
3.可以通过放大、缩小、平移等操作来查看不同频率范围内的信号。
4.频谱仪还提供了多种测量方式,包括功率测量、频谱测量、调制分析等功能。
可以根据需要选择不同的测量方式。
数据分析与导出1.控制软件提供了丰富的数据分析工具,可以对测量结果进行统计、趋势分析等操作。
2.可以将测量结果导出为图片、报告等形式。
导出的数据可以用于后续的数据处理和分析。
故障排除在使用安捷伦N9020A频谱仪过程中,可能会遇到一些故障情况。
以下是一些常见问题的排除方法:1.无法连接到频谱仪:检查USB线是否连接正确,重新连接设备。
2.频谱显示异常:检查参数设置是否正确,重新进行测量。
3.频谱仪无法启动:检查电源供电是否正常,重新启动设备。
结论通过本文,我们了解了安捷伦N9020A频谱仪的操作方法。
从启动设备到进行参数设置,再到进行测量操作和数据分析,我们可以很方便地进行频谱分析工作。
在使用频谱仪过程中遇到故障时,及时进行排除可以提高工作效率。
安捷伦N9020A频谱仪操作说明

一.电平测量操作步骤1.打开频谱仪;2.点击按键矩阵左侧的模式选择“Mode”键,液晶屏右侧出现一列模式选项;3.点击液晶屏右侧与“Spectrum Analyzer”对应按键,进入频谱测量模式;4.点击按键矩阵中左下角的“Meas”按键(即测量项选择键),液晶屏的右侧出现一列测试选项;5.点击“Channel Power”对应的右侧按键,即进入电平测量界面;6.点击按键矩阵上的“Meas Setup”键,液晶屏右侧出现一列电平检测设置项;7.点击“Integ BW”对应的右侧按键(即代表测量带宽),在数字键盘上输入所测频点的带宽,此时液晶屏上出现一列单位,点击所需单位对应的右侧按键(例如所测频点的带宽为8MHz,在数字键盘上点击8,再点击液晶屏上MHz对应的右侧按键);8.点击按键矩阵的“FREQ Channel”键,液晶屏右侧出现一列频率设置选项;9.点击“Center FREQ”,在数字键盘中键入所测频点的中心频率,此时液晶屏上出现一列单位,点击所需单位对应的右侧按键;10.液晶屏左下角显示所测频点的电平,显示格式为“*dBm/8MHz”。
代表8MHz内的功率;11.若功率值没有达到预期,可以尝试点击按键矩阵上“AMPTD”键,再点击“Attenuation”,最后按校准按钮即可校准电平测量值。
二.寄生输出抑制比(带外抑制)测量操作步骤1.打开频谱仪;2.点击按键矩阵左侧的模式选择“Mode”键,液晶屏右侧出现一列模式选项;3.点击液晶屏右侧与“Spectrum Analyzer”对应按键,进入频谱测量模式;4.点击按键矩阵中左下角的“Meas”按键(即测量项选择键),液晶屏的右侧出现一列测试选项;5.点击“Swept SA”对应的右侧按键,即进入频谱测量界面;6.点击“FREQ Channel”键,液晶屏右侧出现一列频率设置选项;7.点击“Start FREQ”右侧对应的按键,并通过数字键盘输入45,此时液晶屏右侧出现一列单位,从上到下依次为“GHz”,“MHz”和“Hz”,点击“MHz”对应的右侧按键;8.点击“Start FREQ”右侧对应的按键,并通过数字键盘输入1,此时液晶屏右侧出现一列单位,从上到下依次为“GHz”,“MHz”和“Hz”,点击“GHz”对应的右侧按键。
Agilent-N9020A使用说明书
Agilent-N9020A使用说明书功能测试XXXN9020A MXA操作手册1功能测试功能测试是对各种仪器参数的测试,这些参数对分析仪是否正常工作具有高度的信心。
建议在进货检验或修理后检查分析仪的运行情况。
测量不确定度分析不适用于功能测试,分析仪应根据比公布规范更宽的限值进行检查。
功能测试旨在使用最小的测试设备,测试分析仪在分析仪规范规定的温度范围内运行的分析仪。
如果测试未通过,则必须运行性能验证测试以确定是否存在问题。
功能测试与性能验证功能测试使用最少的测试设备来检查比性能验证测试小得多的参数范围(以及每个参数的有限数据点)。
功能测试使用比公布规范更宽的限值;测量不确定度分析不适用于功能测试。
注意如果功能测试未通过,则必须运行性能验证测试以确定是否存在问题。
性能验证测试涵盖了广泛的仪器参数,并提供了仪器符合公布规范的最高置信水平。
这些测试可能很耗时,需要大量的测试设备。
本文件内容本章包括以下内容:•“在举行功能测试之前”,(第一要做甚么)。
•“测试设备”(所有测试所需的设备清单)。
随后的章节描述了以下功能测试:•“显示平均噪声级(DANL)”•“频次读数精度”•“二次谐波失真(SHD)•“50 MHz振幅精度”•“50 MHz振幅精度”•“频次相应(平展度)”•“频次相应(平展度)前置放大器开启”•“刻度保真度”•“BBIQ输入频次相应(仅BBA选项),每个功能测试包括:•测试限值(合格/分歧格尺度)•测试说明•测试所需的设备•显示如何连接设备的图•逐步说明•记录测量结果的一个或多个表格在执行功能测试之前1.确保你有合适的测试装备。
2.打开被测单元(UUT)并使其预热(根据仪器规范中的预热要求)。
3.为所需的测试设备留出足够的预热时间(有关预热规范,请参阅单独的仪表文档)。
4.确保分析仪的频率参考设置为内部:a、按,键。
输入/输出更多频率参考输入b、如果软键不显示,请按软键并选择。
内部频率参考内部频率参考5.在仪器预热后,执行自动校准程序:按。
如何使用N5182A+N9020A进行C2K手动测试

如何使用N5182A + N9020A进展Cdma20001*手动测试一、Cdma20001*技术概要1二、使用N7601 Signal Studio编辑测试模式信号1三、N5182A常用操作2四、使用N9020A 选件N9072A进展C2K直放站测试2五、N9020A频谱仪常用操作2一、Cdma20001*、EVDO技术概要二、使用N7601B Signal Studio编辑测试模式信号概述:N7601B Signal Studio软件可以按照CDMA中国电信直放站设备规定义模式信号编辑,C2K以及EVDO上下行码道、数据速率等参数。
针对该信号进展CCDF预览,而且采用Clipping参数进展削峰处理满足特定CCDF 要求。
中国电信直放站测试规中定义测试模式要求选择C2K或EVDO前反向以及多载波选择配置对*一载波下的信号进展信道配置,如C2K信号中的码道数量选择在信号编辑生成之后,可以通过CCDF功能观察信号的峰均比大小。
针对EVDO信号测试信号,如Rel.A信号的编辑,通常使用添加载波实现在EVDO Rel.A下,选择MAC + Traffic模式根据电信规要求,配置MAC以及Data Rate为3.072Mbps。
另外,可以将配置好的参数进展保持配置文件,并在使用是进展调用;还可以保存波形文件,通过U盘拷贝到N5182A信号源中进展使用。
以下过程是如何使用PC连接N5182A,将信号导入到M*G中:A、使用穿插网线连接PC与N5182A,修改PC以及N5182A的IP地址,并能够在PC端Ping通N5182A;B、用安捷伦IO管理工具,添加已连接的N5182A信号源;C、按照Signal Studio提示步骤添加已连接信号源;翻开安捷伦IO库,右键选择〞Agilent Connection E*pert〞翻开IO管理工具,并在管理工具中根据连接方式进展添加。
N5182A可以支持GPIB,LAN以及USB进展IO连接,以下以LAN为例。
- 1、下载文档前请自行甄别文档内容的完整性,平台不提供额外的编辑、内容补充、找答案等附加服务。
- 2、"仅部分预览"的文档,不可在线预览部分如存在完整性等问题,可反馈申请退款(可完整预览的文档不适用该条件!)。
- 3、如文档侵犯您的权益,请联系客服反馈,我们会尽快为您处理(人工客服工作时间:9:00-18:30)。
安捷伦N9020A操作说明:
一、频段监测
1、连接天线至仪器“RF INPUT”;
2、打开仪表电源开关键;
3、点击“FREQ Channel”键进入频率设置界面
4选择“Start Freq”键设置起始频率、选择“Stop Freq”键设置终止频率
5、点击AMPTD键进入振幅设置界面
6、按“Attenuation”键,转动拨轮设置衰减(衰减设置为0dBm)
7、按“Ref Level”键,转动拨轮设置参考电平
8、设置分辨率带宽,点“BW”键进入带宽设置界面
9、选择“Res BW”设置分辨率带宽(30KHz)
10、选择“Video BW”设置视频带宽(100KHz)
11、进行示迹设置点“TRACE\Detector”进入示迹设置界面
12、选择“Max Hold”对该示迹进行最大化保持
13、点“Marker”键进入标记设置界面
14、点击“peak search”按键,使光标出现在监测频段内
15、利用滚轮将“Marker”标记在需要测量的信号上记录场强,利用Marker读取信号参数
二、信号分析
1、点击“FREQ Channel”键进入频率设置界面
2、点击“CENTER FREQ ”输入所要分析信号的频率
3、点击”SPAN”设置设置频率跨度,设置为500KHz
4、点击“BW”键设置分辨率带宽RBW,设置为30KHz.,RBW 设置为100KHz
5、进行示迹设置,点“TRACE\Detector”进入示迹设置界面
6、选择“Max Hold”对该示迹进行最大化保持
7、点击“peak search”按键,进行标记(读取准确频率,以便用接收机进行解调)
8、点“Save”键进入存储界面选择“Screen Image”对频谱分析仪所显示频谱图进行保存
9、设备关机时直接按电源键关机,待设备完全关机后在断掉外接电源。
