A MODEL-ORIENTED ROAD DETECTION APPROACH USING FUZZY SVM
Outlier Detection A Survey
Outlier Detection:A SurveyVARUN CHANDOLAUniversity of MinnesotaARINDAM BANERJEEUniversity of MinnesotaandVIPIN KUMARUniversity of MinnesotaOutlier detection has been a very important concept in the realm of data analysis.Recently,several application domains have realized the direct mapping between outliers in data and real world anomalies,that are of great interest to an analyst.Outlier detection has been researched within various application domains and knowledge disciplines.This survey provides a comprehensive overview of existing outlier detection techniques by classifying them along different dimensions. Categories and Subject Descriptors:H.2.8[Database Management]:Database Applications—Data MiningGeneral Terms:AlgorithmsAdditional Key Words and Phrases:Outlier Detection,Anomaly Detection1.INTRODUCTIONOutlier detection refers to the problem offinding patterns in data that do not conform to expected normal behavior.These anomalous patterns are often re-ferred to as outliers,anomalies,discordant observations,exceptions,faults,defects, aberrations,noise,errors,damage,surprise,novelty,peculiarities or contaminants in different application domains.Outlier detection has been a widely researched problem andfinds immense use in a wide variety of application domains such as credit card,insurance,tax fraud detection,intrusion detection for cyber security, fault detection in safety critical systems,military surveillance for enemy activities and many other areas.The importance of outlier detection is due to the fact that outliers in data trans-late to significant(and often critical)information in a wide variety of application domains.For example,an anomalous traffic pattern in a computer network could mean that a hacked computer is sending out sensitive data to an unauthorized destination.In public health data,outlier detection techniques are widely used to detect anomalous patterns in patient medical records which could be symptoms of a new disease.Similarly,outliers in credit card transaction data could indicate credit card theft or misuse.Outliers can also translate to critical entities such as in military surveillance,where the presence of an unusual region in a satellite image of enemy area could indicate enemy troop movement.Or anomalous readings from a space craft would signify a fault in some component of the craft.Outlier detection has been found to be directly applicable in a large number of domains.This has resulted in a huge and highly diverse literature of outlier detec-2·Chandola,Banerjee and Kumartion techniques.A lot of these techniques have been developed to solve focussed problems pertaining to a particular application domain,while others have been de-veloped in a more generic fashion.This survey aims at providing a structured and comprehensive overview of the research done in thefield of outlier detection.We have identified the key characteristics of any outlier detection technique,and used these as dimensions to classify existing techniques into different categories.This survey aims at providing a better understanding of the different directions in which research has been done and also helps in identifying the potential areas for future research.1.1What are outliers?Outliers,as defined earlier,are patterns in data that do not conform to a well defined notion of normal behavior,or conform to a well defined notion of outlying behavior,though it is typically easier to define the normal behavior.This survey discusses techniques whichfind such outliers in data.Fig.1.A simple example of outliers in a2-dimensional data setFigure1illustrates outliers in a simple2-dimensional data set.The data has two normal regions,N1and N2.O1and O2are two outlying instances while O3is an outlying region.As mentioned earlier,the outlier instances are the ones that do not lie within the normal regions.Outliers exist in almost every real data set.Some of the prominent causes for outliers are listed below•Malicious activity–such as insurance or credit card or telecom fraud,a cyber intrusion,a terrorist activity•Instrumentation error–such as defects in components of machines or wear and tear•Change in the environment–such as a climate change,a new buying pattern among consumers,mutation in genes•Human error–such as an automobile accident or a data reporting errorOutlier Detection:A Survey·3 Outliers might be induced in the data for a variety of reasons,as discussed above, but all of the reasons have a common characteristic that they are interesting to the analyst.The“interestingness”or real life relevance of outliers is a key feature of outlier detection and distinguishes it from noise removal[Teng et al.1990]or noise accommodation[Rousseeuw and Leroy1987],which deal with unwanted noise in the data.Noise in data does not have a real significance by itself,but acts as a hindrance to data analysis.Noise removal is driven by the need to remove the unwanted objects before any data analysis is performed on the data.Noise accommodation refers to immunizing a statistical model estimation against outlying observations. Another related topic to outlier detection is novelty detection[Markou and Singh 2003a;2003b;Saunders and Gero2000]which aims at detecting unseen(emergent, novel)patterns in the data.The distinction between novel patterns and outliers is that the novel patterns are typically incorporated with the normal model after getting detected.It should be noted that the solutions for these related problems are often used for outlier detection and vice-versa,and hence are discussed in this review as well.1.2ChallengesA key challenge in outlier detection is that it involves exploring the unseen space. As mentioned earlier,at an abstract level,an outlier can be defined as a pattern that does not conform to expected normal behavior.A straightforward approach will be to define a region representing normal behavior and declare any observation in the data which does not belong to this normal region as an outlier.But several factors make this apparently simple approach very challenging.•Defining a normal region which encompasses every possible normal behavior is very difficult.•Often times normal behavior keeps evolving and an existing notion of normal behavior might not be sufficiently representative in the future.•The boundary between normal and outlying behavior is often fuzzy.Thus an outlying observation which lies close to the boundary can be actually normal and vice versa.•The exact notion of an outlier is different for different application domains.Every application domain imposes a set of requirements and constraints giving rise to a specific problem formulation for outlier detection.•Availability of labeled data for training/validation is often a major issue while developing an outlier detection technique.•In several cases in which outliers are the result of malicious actions,the mali-cious adversaries adapt themselves to make the outlying observations appear like normal,thereby making the task of defining normal behavior more diffi-cult.•Often the data contains noise which is similar to the actual outliers and hence is difficult to distinguish and remove.In the presence of above listed challenges,a generalized formulation of the outlier detection problem based on the abstract definition of outliers is not easy to solve. In fact,most of the existing outlier detection techniques simplify the problem by4·Chandola,Banerjee and Kumarfocussing on a specific formulation.The formulation is induced by various factors such as the nature of data,nature of outliers to be detected,representation of the normal,etc.In several cases,these factors are governed by the application domain in which the technique is to be applied.Thus,there are numerous different formulations of the outlier detection problem which have been explored in diverse disciplines such as statistics ,machine learning ,data mining ,information theory ,spectral decomposition .Application DomainsKnowledge DisciplinesInput Requirements and constraintsfor inputs and outputsConcepts from one or more dis-ciplinesFig.2.A general design of an outlier detection techniqueAs illustrated in Figure 2,any outlier detection technique has following major ingredients —1.Nature of data,nature of outliers,and other constraints and assumptions thatcollectively constitute the problem formulation .2.Application domain in which the technique is applied.Some of the techniquesare developed in a more generic fashion but are still feasible in one or more domains while others directly target a particular application domain.3.The concept and ideas used from one or more knowledge disciplines .1.3Our ContributionsThe contributions of this survey are listed below1.We have identified the key dimensions associated with the problem of outlierdetection.2.We provide a multi-level taxonomy to categorize any outlier detection tech-niques along the various dimensions.3.We present a comprehensive overview of the current outlier detection literatureusing the classification framework.4.We distinguish between instance based outliers in data and more complex out-liers that occur in sequential or spatial data sets.We present separate discus-sions on techniques that deal with such complex outliers.The classification of outlier detection techniques based on the applied knowledge discipline provides an idea of the research done by different communities and alsoOutlier Detection:A Survey·5highlights the unexplored research avenues for the outlier detection problem.One of the dimensions along which we have classified outlier detection techniques is the application domain in which they are used.Such classification allows anyone looking for a solution in a particular application domain to easily explore the existing research in that area.1.4OrganizationThis survey is organized into three major sections which discuss the above three ingredients of an outlier detection technique.In Section2we identify the various aspects that constitute an exact formulation of the problem.This section brings forward the richness and complexity of the problem domain.In Section3we de-scribe the different application domains where outlier detection has been applied. We identify the unique characteristics of each domain and the different techniques which have been used for outlier detection in these domains.In Section4,we cate-gorize different outlier detection techniques based on the knowledge discipline they have been adopted from.1.5Related WorkAs mentioned earlier,outlier detection techniques can be classified along several dimensions.The most extensive effort in this direction has been done by Hodge and Austin[2004].But they have only focused on outlier detection techniques de-veloped in machine learning and statistical domains.Most of the other reviews on outlier detection techniques have chosen to focus on a particular sub-area of the existing research.A short review of outlier detection algorithms using data min-ing techniques was presented by Petrovskiy[2003].Markou and Singh presented an extensive review of novelty detection techniques using neural networks[Markou and Singh2003a]and statistical approaches[Markou and Singh2003b].A review of selected outlier detection techniques,used for network intrusion detection,was presented by Lazarevic et al.[2003].Outlier detection techniques developed specifi-cally for system call intrusion detection have been reviewed by Forrest et al.[1999], and later by Snyder[2001]and Dasgupta and Nino[2000].A substantial amount of research on outlier detection has been done in statistics and has been reviewed in several books[Rousseeuw and Leroy1987;Barnett and Lewis1994]as well as other reviews[Beckman and Cook1983;Hawkins1980].Tang et al.[2006]provide a unification of several distance based outlier detection techniques.These related efforts have either provided a coarser classification of research done in this area or have focussed on a subset of the gamut of existing techniques.To the extent of our knowledge,our survey is thefirst attempt to provide a structured and a comprehensive overview of outlier detection techniques.1.6TerminologyOutlier detection and related concepts have been referred to as different entities in different areas.For the sake of better understandability,we will follow a uniform terminology in this survey.An outlier detection problem refers to the task offinding anomalous patterns in given data according to a particular definition of anomalous behavior.An outlier will refer to these anomalous patterns in the data.An outlier detection technique is a specific solution to an outlier detection problem.A normal6·Chandola,Banerjee and Kumarpattern refers to a pattern in the data which is not an outlier.The output of an outlier detection technique could be labeled patterns(outlier or normal).Some of the outlier detection techniques also assign a score to a pattern based on the degree to which the pattern is considered an outlier.Such a score is referred to as outlier score.2.DIFFERENT ASPECTS OF AN OUTLIER DETECTION PROBLEMThis section identifies and discusses the different aspects of outlier detection.As mentioned earlier,a specific formulation of the problem is determined by several different factors such as the input data,the availability(or unavailability)of other resources as well as the constraints and requirements induced by the application domain.This section brings forth the richness in the problem domain and motivates the need for so many diverse techniques.2.1Input DataA key component of any outlier detection technique is the input data in which it has to detect the outliers.Input is generally treated as a collection of data ob-jects or data instances(also referred to as record,point,vector,pattern,event, case,sample,observation,or entity)[Tan et al.2005a].Each data instance can be described using a set of attributes(also referred to as variable,characteristic, feature,field,or dimension).The data instances can be of different types such as binary,categorical or continuous.Each data instance might consist of only one attribute(univariate)or multiple attributes(multivariate).In the case of multi-variate data instances,all attributes might be of same type or might be a mixture of different data types.One important observation here is that the features used by any outlier detection technique do not necessarily refer to the observable features in the given data set. Several techniques use preprocessing schemes like feature extraction[Addison et al. 1999],or construct more complex features from the observed features[Ertoz et al. 2004],and work with a set of features which are most likely to discriminate between the normal and outlying behaviors in the data.A key challenge for any outlier detection technique is to identify a best set of features which can allow the algorithm to give the best results in terms of accuracy as well as computational efficiency. Input data can also be categorized based on the structure present among the data instances.Most of the existing outlier detection algorithms deal with data in which no structure is assumed among the data instances.We refer to such data as point data.Typical algorithms dealing with such data sets are found in network intrusion detection domain[Ertoz et al.2004]or in medical records outlier detection domain[Laurikkala et al.2000].Data can also have a spatial,sequential or both type of structures.For sequential data,the data instances have an ordering defined such that every data instance occurs sequentially in the entire data set.Time-series data is the most popular example for this case and has been extensively analyzed with respect to outlier detection in statistics[Abraham and Chuang1989;Abraham and Box1979].Recently,biological data domains such as genome sequences and protein sequences[Eisen et al.1998;Teng2003]have been explored for outlier detection.For spatial data,the data instances have a well defined spatial structure such that the location of a data instance with respect to others is significant and isOutlier Detection:A Survey·7typically well-defined.Spatial data is popular in traffic analysis domain[Shekhar et al.2001]and ecological and census studies[Kou et al.2006].Often,the data instances might also have a temporal(sequential)component giving rise to another category of spatio-temporal data,which is widely prevalent in climate data analysis [Blender et al.1997].Later in this section we will discuss the situations where the structure in data becomes relevant for outlier detection.2.2Type of SupervisionBesides the input data(or observations),an outlier detection algorithm might also have some additional information at its disposal.A labeled training data set is one such information which has been used extensively(primarily by outlier detection techniques based on concepts from machine learning[Mitchell1997]and statistical learning theory[Vapnik1995]).A training data set is required by techniques which involve building an explicit predictive model.The labels associated with a data instance denote if that instance is normal or outlier1.Based on the extent to which these labels are utilized,outlier detection techniques can be divided into three categories2.2.1Supervised outlier detection techniques.Such techniques assume the avail-ability of a training data set which has labeled instances for normal as well as outlier class.Typical approach in such case is to build predictive models for both normal and outlier classes.Any unseen data instance is compared against the two models to determine which class it belongs to.Supervised outlier detection techniques have an explicit notion of the normal and outlier behavior and hence accurate models can be built.One drawback here is that accurately labeled training data might be prohibitively expensive to beling is often done manually by a human expert and hence requires a lot of effort to obtain the labeled training data set. Certain techniques inject artificial outliers in a normal data set to obtain a fully labeled training data set and then apply supervised outlier detection techniques to detect outliers in test data[Abe et al.2006].2.2.2Semi-Supervised outlier detection techniques.Such techniques assume the availability of labeled instances for only one class.it is often difficult to collect labels for other class.For example,in space craft fault detection,an outlier scenario would signify an accident,which is not easy to model.The typical approach of such techniques is to model only the available class and decare any test instance which does notfit this model to belong to the other class.Techniques that assume availability of only the outlier instances for training are not very popular.The primary reason for their limited popularity is that it is difficult to obtain a training data set which covers every possible outlying behavior that can occur in the data.The behaviors which do not exist in the training data will be harder to detect as outliers.Dasgupta et al[2000;2002]have used only outlier instances for training.Similar semi-supervised techniques have also been applied for system call intrusion detection[Forrest et al.1996].On the other hand,techniques which model only the normal instances during training are more popular.Normal instances are relatively easy to obtain.More-1Also referred to as normal and outlier classes8·Chandola,Banerjee and Kumarover,normal behavior is typically well-defined and hence it is easier to construct representative models for normal behavior from the training data.This setting is very similar to as novelty detection[Markou and Singh2003a;2003b]and is extensively used in damage and fault detection.2.2.3Unsupervised outlier detection techniques.The third category of tech-niques do not make any assumption about the availability of labeled training data. Thus these techniques are most widely applicable.The techniques in this cate-gory make other assumptions about the data.For example,parametric statistical techniques,assume a parametric distribution of one or both classes of instances. Similarly,several techniques make the basic assumption that normal instances are far more frequent than outliers.Thus a frequently occurring pattern is typically con-sidered normal while a rare occurrence is an outlier.The unsupervised techniques typically suffer from higher false alarm rate,because often times the underlying assumptions do not hold true.Availability of labels govern the above choice of operating modes for any tech-nique.Typically,semi-supervised detection and unsupervised modes have been adopted more.Generally speaking,techniques which assume availability of outlier instances in training are not very popular.One of the reasons is that getting a labeled set of outlying data instances which cover all possible type of outlying be-havior is difficult.Moreover,the outlying behavior is often dynamic in nature(for e.g-new types of outliers might arise,for which there is no labeled training data). In certain cases,such as air traffic safety,outlying instances would translate to airline accidents and hence will be very rare.Hence in such domains unsupervised or semi-supervised techniques with normal labels for training are preferred.2.3Type of OutlierAn important input to an outlier detection technique is the definition of the desired outlier which needs to be detected by the technique.Outliers can be classified into three categories based on its composition and its relation to rest of the data.2.3.1Type I Outliers.In a given set of data instances,an individual outlying instance is termed as a Type I outlier.This is the simplest type of outliers and is the focus of majority of existing outlier detection schemes.A data instance is an outlier due to its attribute values which are inconsistent with values taken by normal instances.Techniques that detect Type I outliers analyze the relation of an individual instance with respect to rest of the data instances(either in the training data or in the test data).For example,in credit card fraud detection,each data instance typically repre-sents a credit card transaction.For the sake of simplicity,let us assume that the data is defined using only two features–time of the day and amount spent.Figure 3shows a sample plot of the2-dimensional data instances.The curved surface rep-resents the normal region for the data instances.The three transactions,o1,o2and o3lie outside the boundary of the normal regions and hence are Type I outliers. Similar example of this type can be found in medical records data[Laurikkala et al.2000]where each data record corresponds to a patient.A single outlying record will be a Type I outlier and would be interesting as it would indicate some problem with a patient’s health.Outlier Detection:A Survey·9Time of the dayFig.3.Type I outliers o1,o2and o3in a2-dimensional credit card transaction data set.The normal transactions are for this data are typically during the day,between11:00AM and6:00 PM and range between$10to$100.Outliers o1and o2are fraudulent transactions which are outliers because they occur at an abnormal time and the amount is abnormally large.Outlier o3 has unusually high amount spent,even though the time of transaction is normal.2.3.2Type II Outliers.These outliers are caused due to the occurrence of an individual data instance in a specific context in the given data.Like Type I outliers, these outliers are also individual data instances.The difference is that a Type II outlier might not be an outlier in a different context.Thus Type II outliers are defined with respect to a context.The notion of a context is induced by the structure in the data set and has to be specified as a part of the problem formulation.A context defines the neighborhood of a particular data instance.Type II outliers satisfy two properties1.The underlying data has a spatial/sequential nature:each data instance isdefined using two sets of attributes,viz.contextual attributes and behavioral attributes.The contextual attributes define the position of an instance and are used to determine the context(or neighborhood)for that instance.For example,in spatial data sets,the longitude and latitude of a location are the contextual attributes.Or in a time-series data,time is a contextual attribute which determines the position of an instance on the entire sequence.The behavioral attributes define the non-contextual characteristics of an instance.For example,in a spatial data set describing the average rainfall of the entire world,the amount of rainfall at any location is a behavioral attribute.2.The outlying behavior is determined using the values for the behavioral at-tributes within a specific context.A data instance might be a Type II outlier in a given context,but an identical data instance(in terms of behavioral at-tributes)could be considered normal in a different context.Type II outliers have been most popularly explored in time-series data[Weigend et al.1995;Salvador and Chan2003]and spatial data[Kou et al.2006;Shekhar et al.2001].Figure4shows one such example for a temperature time series which shows the monthly temperature of an area over last few years.A temperature of 35F might be normal during the winter(at time t1)at that place,but the same value during summer(at time t2)would be an outlier.Similar example can be found in credit card fraud detection domain.Let us extend the data described for Type I outliers by adding another attribute–store name,where the purchase was10·Chandola,Banerjee and KumarTimeFig.4.Type II outlier t2in a temperature time series.Note that the temperature at time t1is same as that at time t2but occurs in a different context and hence is not considered as an outlier. made.The individual might be spending around$10at a gas station while she might be usually spending around$100at a jewelery store.A new transaction of $100at the gas station will be considered as a Type II outlier,since it does not conform to the normal behavior of the individual in the context of gas station(even though the same amount spent in the jewelery store will be considered normal).2.3.3Type III Outliers.These outliers occur because a subset of data in-stances are outlying with respect to the entire data set.The individual data instances in a Type III outlier are not outliers by themselves,but their occur-rence together as a substructure is anomalous.Type III outliers are meaningful only when the data has spatial or sequential nature.These outliers are either anomalous subgraphs or subsequences occurring in the data.Figure5illustrates an example which shows a human electrocardiogram output[Keogh et al.2002]. Note that the extendedflat line denotes an outlier because the same low value exists for an abnormally long time.Fig.5.Type III outlier in an human electrocardiogram output.Note that the low value in the flatline also occurs in normal regions of the sequence.We revisit the credit card fraud detection example for an illustration of Type III outliers.Let us assume that an individual normally makes purchases at a gas station,followed by a nearby grocery store and then at a nearby convenience store.A new sequence of credit card transactions which involve purchase at a gas station, followed by three more similar purchases at the same gas station that day,would indicate a potential card theft.This sequence of transactions is a Type III outlier. It should be observed that the individual transactions at the gas station would not be considered as a Type I outlier.Type III outlier detection problem has been widely explored for sequential data such as operating system call data and genome sequences.For system call data, a particular sequence of operating system calls is treated as an outlier.Similarly, outlier detection techniques dealing with images detect regions in the image which are anomalous(Type III outliers).。
低频活动漂浮潜水船声探测系统(LFATS)说明书

LOW-FREQUENCY ACTIVE TOWED SONAR (LFATS)LFATS is a full-feature, long-range,low-frequency variable depth sonarDeveloped for active sonar operation against modern dieselelectric submarines, LFATS has demonstrated consistent detection performance in shallow and deep water. LFATS also provides a passive mode and includes a full set of passive tools and features.COMPACT SIZELFATS is a small, lightweight, air-transportable, ruggedized system designed specifically for easy installation on small vessels. CONFIGURABLELFATS can operate in a stand-alone configuration or be easily integrated into the ship’s combat system.TACTICAL BISTATIC AND MULTISTATIC CAPABILITYA robust infrastructure permits interoperability with the HELRAS helicopter dipping sonar and all key sonobuoys.HIGHLY MANEUVERABLEOwn-ship noise reduction processing algorithms, coupled with compact twin line receivers, enable short-scope towing for efficient maneuvering, fast deployment and unencumbered operation in shallow water.COMPACT WINCH AND HANDLING SYSTEMAn ultrastable structure assures safe, reliable operation in heavy seas and permits manual or console-controlled deployment, retrieval and depth-keeping. FULL 360° COVERAGEA dual parallel array configuration and advanced signal processing achieve instantaneous, unambiguous left/right target discrimination.SPACE-SAVING TRANSMITTERTOW-BODY CONFIGURATIONInnovative technology achievesomnidirectional, large aperture acousticperformance in a compact, sleek tow-body assembly.REVERBERATION SUPRESSIONThe unique transmitter design enablesforward, aft, port and starboarddirectional transmission. This capabilitydiverts energy concentration away fromshorelines and landmasses, minimizingreverb and optimizing target detection.SONAR PERFORMANCE PREDICTIONA key ingredient to mission planning,LFATS computes and displays systemdetection capability based on modeled ormeasured environmental data.Key Features>Wide-area search>Target detection, localization andclassification>T racking and attack>Embedded trainingSonar Processing>Active processing: State-of-the-art signal processing offers acomprehensive range of single- andmulti-pulse, FM and CW processingfor detection and tracking. Targetdetection, localization andclassification>P assive processing: LFATS featuresfull 100-to-2,000 Hz continuouswideband coverage. Broadband,DEMON and narrowband analyzers,torpedo alert and extendedtracking functions constitute asuite of passive tools to track andanalyze targets.>Playback mode: Playback isseamlessly integrated intopassive and active operation,enabling postanalysis of pre-recorded mission data and is a keycomponent to operator training.>Built-in test: Power-up, continuousbackground and operator-initiatedtest modes combine to boostsystem availability and accelerateoperational readiness.UNIQUE EXTENSION/RETRACTIONMECHANISM TRANSFORMS COMPACTTOW-BODY CONFIGURATION TO ALARGE-APERTURE MULTIDIRECTIONALTRANSMITTERDISPLAYS AND OPERATOR INTERFACES>State-of-the-art workstation-based operator machineinterface: Trackball, point-and-click control, pull-down menu function and parameter selection allows easy access to key information. >Displays: A strategic balance of multifunction displays,built on a modern OpenGL framework, offer flexible search, classification and geographic formats. Ground-stabilized, high-resolution color monitors capture details in the real-time processed sonar data. > B uilt-in operator aids: To simplify operation, LFATS provides recommended mode/parameter settings, automated range-of-day estimation and data history recall. >COTS hardware: LFATS incorporates a modular, expandable open architecture to accommodate future technology.L3Harrissellsht_LFATS© 2022 L3Harris Technologies, Inc. | 09/2022NON-EXPORT CONTROLLED - These item(s)/data have been reviewed in accordance with the InternationalTraffic in Arms Regulations (ITAR), 22 CFR part 120.33, and the Export Administration Regulations (EAR), 15 CFR 734(3)(b)(3), and may be released without export restrictions.L3Harris Technologies is an agile global aerospace and defense technology innovator, delivering end-to-endsolutions that meet customers’ mission-critical needs. The company provides advanced defense and commercial technologies across air, land, sea, space and cyber domains.t 818 367 0111 | f 818 364 2491 *******************WINCH AND HANDLINGSYSTEMSHIP ELECTRONICSTOWED SUBSYSTEMSONAR OPERATORCONSOLETRANSMIT POWERAMPLIFIER 1025 W. NASA Boulevard Melbourne, FL 32919SPECIFICATIONSOperating Modes Active, passive, test, playback, multi-staticSource Level 219 dB Omnidirectional, 222 dB Sector Steered Projector Elements 16 in 4 stavesTransmission Omnidirectional or by sector Operating Depth 15-to-300 m Survival Speed 30 knotsSize Winch & Handling Subsystem:180 in. x 138 in. x 84 in.(4.5 m x 3.5 m x 2.2 m)Sonar Operator Console:60 in. x 26 in. x 68 in.(1.52 m x 0.66 m x 1.73 m)Transmit Power Amplifier:42 in. x 28 in. x 68 in.(1.07 m x 0.71 m x 1.73 m)Weight Winch & Handling: 3,954 kg (8,717 lb.)Towed Subsystem: 678 kg (1,495 lb.)Ship Electronics: 928 kg (2,045 lb.)Platforms Frigates, corvettes, small patrol boats Receive ArrayConfiguration: Twin-lineNumber of channels: 48 per lineLength: 26.5 m (86.9 ft.)Array directivity: >18 dB @ 1,380 HzLFATS PROCESSINGActiveActive Band 1,200-to-1,00 HzProcessing CW, FM, wavetrain, multi-pulse matched filtering Pulse Lengths Range-dependent, .039 to 10 sec. max.FM Bandwidth 50, 100 and 300 HzTracking 20 auto and operator-initiated Displays PPI, bearing range, Doppler range, FM A-scan, geographic overlayRange Scale5, 10, 20, 40, and 80 kyd PassivePassive Band Continuous 100-to-2,000 HzProcessing Broadband, narrowband, ALI, DEMON and tracking Displays BTR, BFI, NALI, DEMON and LOFAR Tracking 20 auto and operator-initiatedCommonOwn-ship noise reduction, doppler nullification, directional audio。
detection limit探测极限
detection limit探测极限"Detection Limit: Unmasking the Boundaries of Scientific Exploration"Introduction:In the vast realm of scientific investigation, one often encounters the term "detection limit." This intriguing concept refers to the lowest level of concentration, measurement, or phenomenon that can be reliably identified by an instrument or method. Detection limits play a crucial role in a variety of scientific disciplines, including chemistry, biology, environmental sciences, and physics. In this article, we will delve into the underlying principles of detection limits and explore the step-by-step process of their determination.1. Defining the Detection Limit:The detection limit, also known as the limit of detection (LOD), is the smallest quantity of the analyte or phenomenon that can be distinguished from the background noise or non-specific signal. It marks the threshold below which reliable measurements become challenging. Detection limits are often reported with a specified confidence level, ensuring scientifically rigorous outcomes.2. Significance of Detection Limits:Accurate determination of detection limits is paramount in various scientific applications. From environmental monitoring to pharmaceutical research, detection limits allow scientists to differentiate between trace amounts of substances, quantitatively analyze analytes, and set boundaries for safety regulations. These limits aid in tracking pollution levels, identifying disease markers, ensuring product quality, and much more.3. Factors Affecting Detection Limits:Several key factors directly impact the determination and improvement of detection limits. These factors include instrument specifications, background noise levels, analyte concentration, sample matrix, detection technique, and data analysis methods. Understanding these factors and their interactions is vital for optimizing detection limits.4. Methodology for Determining Detection Limits:The process of determining detection limits involves a systematic approach to quantify the lowest detectable concentration or value. Here is a step-by-step exploration of this methodology:a. Selecting the Analyte and Background Matrix:The first step is to identify the analyte of interest and the medium in which it is present. Different analytes and matrices impose varying challenges and may require specific approaches for successful detection.b. Instrument Calibration:Calibrating the instrument or method to be used is essential before determining the detection limit. This includes obtaining a range of known standards with concentrations both above and below the expected detection limit. By analyzing these calibration standards, a calibration curve can be constructed.c. Determining the Signal-to-Noise Ratio:The signal-to-noise ratio (S/N) is calculated by comparing the measured signal from the analyte to the background noise level. A higher S/N ratio indicates a more favorable signal strength relative to noise, hence lowering the detection limit.d. Performing Replicate Measurements:To ensure robustness and reliability, multiple replicatemeasurements at different analyte concentrations or values should be performed. This allows for statistical analysis, enhancing the accuracy of the detection limit determination.e. Statistical Analysis:Using statistical tools, such as regression analysis or hypothesis testing, the obtained measurements and their uncertainties are analyzed. These statistical calculations aid in establishing rigorous detection limits with appropriate confidence levels.5. Improving Detection Limits:Once the detection limit is determined, researchers strive to lower it to enhance the efficiency and sensitivity of their methods. Strategies for improving detection limits include optimizing sample preparation techniques, reducing background noise, enhancing signal amplification, employing advanced instruments, and utilizing cutting-edge data analysis techniques.Conclusion:Detection limits are essential boundaries that enable scientists to explore the minute details of their subjects of interest. Byunderstanding the underlying principles and employing astep-by-step methodology for their determination, researchers continue to unravel the mysteries of the natural world and contribute to scientific progress. The pursuit of lower detection limits challenges scientists to refine their techniques, pushing the boundaries of scientific exploration further with each breakthrough.。
激光雷达英语专业术语
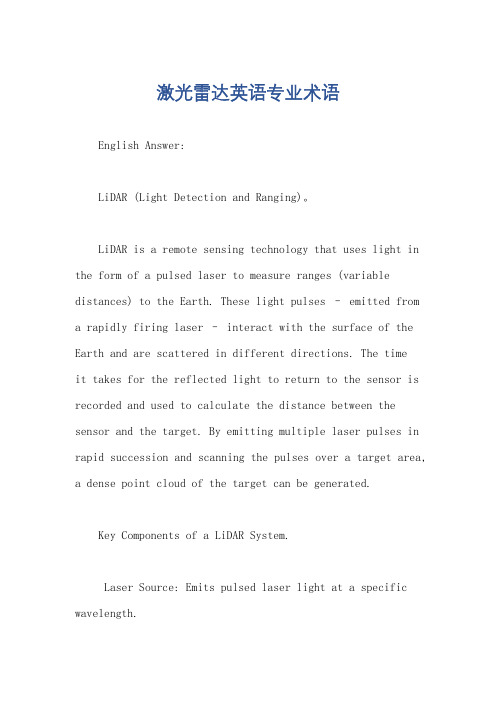
激光雷达英语专业术语English Answer:LiDAR (Light Detection and Ranging)。
LiDAR is a remote sensing technology that uses light in the form of a pulsed laser to measure ranges (variable distances) to the Earth. These light pulses – emitted from a rapidly firing laser – interact with the surface of the Earth and are scattered in different directions. The timeit takes for the reflected light to return to the sensor is recorded and used to calculate the distance between the sensor and the target. By emitting multiple laser pulses in rapid succession and scanning the pulses over a target area, a dense point cloud of the target can be generated.Key Components of a LiDAR System.Laser Source: Emits pulsed laser light at a specific wavelength.Scanner: Directs the laser pulses towards the target area.Detector: Receives the reflected laser pulses and measures the time-of-flight (TOF).Processing Unit: Computes the distances from the TOF measurements and generates a point cloud.Applications of LiDAR.LiDAR technology has numerous applications in various fields, including:Mapping and Surveying: Generating detailed terrain models, topographic maps, and bathymetric charts.Forestry: Estimating tree height, canopy cover, and biomass.Transportation: Autonomous vehicle navigation, roadmapping, and traffic monitoring.Archaeology: Discovering and mapping buried structures and artifacts.Architecture: Building facade analysis, precision measurements, and 3D modeling.Types of LiDAR Systems.LiDAR systems can be classified into several types based on:Platform: Ground-based, airborne, or spaceborne.Pulse Type: Single-pulse or multi-pulse.Wavelength: Near-infrared, mid-infrared, or ultraviolet.Scan Pattern: Linear, raster, or spherical.Advantages of LiDAR.High point density, enabling detailed representations of objects and surfaces.Accuracy in measuring distances and elevations.Ability to penetrate vegetation and dense materials.Real-time data collection and processing.Limitations of LiDAR.Susceptibility to atmospheric interference, such as fog and dust.Limited range under certain conditions, such as dense vegetation.High cost of acquisition and deployment.中文回答:激光雷达。
模拟ai英文面试题目及答案
模拟ai英文面试题目及答案模拟AI英文面试题目及答案1. 题目: What is the difference between a neural network anda deep learning model?答案: A neural network is a set of algorithms modeled loosely after the human brain that are designed to recognize patterns. A deep learning model is a neural network with multiple layers, allowing it to learn more complex patterns and features from data.2. 题目: Explain the concept of 'overfitting' in machine learning.答案: Overfitting occurs when a machine learning model learns the training data too well, including its noise and outliers, resulting in poor generalization to new, unseen data.3. 题目: What is the role of a 'bias' in an AI model?答案: Bias in an AI model refers to the systematic errors introduced by the model during the learning process. It can be due to the choice of model, the training data, or the algorithm's assumptions, and it can lead to unfair or inaccurate predictions.4. 题目: Describe the importance of data preprocessing in AI.答案: Data preprocessing is crucial in AI as it involves cleaning, transforming, and reducing the data to a suitableformat for the model to learn effectively. Proper preprocessing can significantly improve the performance of AI models by ensuring that the input data is relevant, accurate, and free from noise.5. 题目: How does reinforcement learning differ from supervised learning?答案: Reinforcement learning is a type of machine learning where an agent learns to make decisions by performing actions in an environment to maximize a reward signal. It differs from supervised learning, where the model learns from labeled data to predict outcomes based on input features.6. 题目: What is the purpose of a 'convolutional neural network' (CNN)?答案: A convolutional neural network (CNN) is a type of deep learning model that is particularly effective for processing data with a grid-like topology, such as images. CNNs use convolutional layers to automatically and adaptively learn spatial hierarchies of features from input images.7. 题目: Explain the concept of 'feature extraction' in AI.答案: Feature extraction in AI is the process of identifying and extracting relevant pieces of information from the raw data. It is a crucial step in many machine learning algorithms, as it helps to reduce the dimensionality of the data and to focus on the most informative aspects that can be used to make predictions or classifications.8. 题目: What is the significance of 'gradient descent' in training AI models?答案: Gradient descent is an optimization algorithm used to minimize a function by iteratively moving in the direction of steepest descent as defined by the negative of the gradient. In the context of AI, it is used to minimize the loss function of a model, thus refining the model's parameters to improve its accuracy.9. 题目: How does 'transfer learning' work in AI?答案: Transfer learning is a technique where a pre-trained model is used as the starting point for learning a new task. It leverages the knowledge gained from one problem to improve performance on a different but related problem, reducing the need for large amounts of labeled data and computational resources.10. 题目: What is the role of 'regularization' in preventing overfitting?答案: Regularization is a technique used to prevent overfitting by adding a penalty term to the loss function, which discourages overly complex models. It helps to control the model's capacity, forcing it to generalize better to new data by not fitting too closely to the training data.。
Unit 4 Text A Drone Trends to Watch in 2018

Drone-Enabled Big Data
Several companies are already using drones for data collection and analysis in such areas.
Drone-Enabled Big Data
With copious amounts of data to power unmanned aerial vehicles, “smart drones” will become more adept at navigating hazards on their own and communicating amongst themselves to negotiate safe flight paths, alter routes automatically in real-time according to current conditions, and even abort missions altogether if the data shows too much risk.
Flyability公司开发了Elios,这是一种检测无人机,旨在探索室内 和密闭空间,以指导从桥梁到矿山等任何地方的安全改进。
Drone-Enabled Big Data
Data collected by drones will also help the drone industry itself. 无人机收集的数据也将有助于无人机行业本身。
New Capabilities
Drones will have improved camera technology, upgraded Global Navigation Satellite System (GNSS), ultra-fast charging, and longer-lasting batteries.
2017年考研英语阅读材料之谷歌无人驾驶汽车
2017年考研英语阅读材料之谷歌无人驾驶汽车第一篇:2017年考研英语阅读材料之谷歌无人驾驶汽车凯程考研,为学员服务,为学生引路!2017年考研英语阅读材料之谷歌无人驾驶汽车MOUNTAIN VIEW, Calif.— Google, a leader in effortsto create driverless cars, has run into an odd safety conundrum: humans.加利福尼亚州山景城——作为无人驾驶汽车研发领域的领头羊,谷歌(Google)遇到了一个奇怪的安全难题:人类。
Last month, as one of Google’s self-driving cars approached a crosswalk, it did what it wassupposed to do when it slowed to allow a pedestrian to cross, prompting its “safety driver” toapply the brakes.The pedestrian was fine, but not so much Google’s car, which was hit frombehind by a human-driven sedan.上月,当谷歌的一辆自动驾驶汽车来到人行横道前时,它像设想的那样放慢速度让一名行人先行,促使“安全驾驶员”启动刹车。
那个行人没事,但谷歌那辆车却没那么幸运。
它被后面的一辆由人驾驶的轿车追尾了。
Google’s fleet of autonomo us test cars is programmed to follow the letter of the law.But it canbe tough to get around if you are a stickler for the rules.One Google car, in a test in 2009,couldn’t get through a four-way stop because its sensors kept waiting for other(human)drivers to stop completely and let it go.The human drivers kept inching forward, looking for theadvantage —paralyzing Google’s robot.按照设计,谷歌的自动测试车会严格遵守法律条文。
基于双向嵌套级联残差的交通标志检测方法

现代电子技术Modern Electronics Technique2024年3月1日第47卷第5期Mar. 2024Vol. 47 No. 50 引 言汽车智能化是汽车产业一直在追寻的目标,而自动驾驶是汽车智能化不可或缺的一环。
要实现自动驾驶,必须为汽车加上一双眼睛和配套的处理系统,这套处理系统需要像人一样识别交通标志。
交通标志检测的实现方案主要有两大类:一类是基于计算机图形学的方案,比如依据颜色直方图、尺度不变特征变换特征、方向基于双向嵌套级联残差的交通标志检测方法江金懋, 钟国韵(东华理工大学 信息工程学院, 江西 南昌 330013)摘 要: 交通标志检测是自动驾驶领域的一个重要课题,其对于检测系统的实时性和精度都有非常高的要求。
目标检测领域中的YOLOv3算法是业界公认在精度和速度上都处于前列的一种算法。
文中以YOLOv3检测算法作为基础网络,提出一种双向嵌套级联残差单元(bid⁃NCR ),替换掉原网络中顺序堆叠的标准残差块。
双向嵌套级联残差单元的两条残差边采用相同的结构,都是一次卷积操作加上一次级联残差处理,两条边上级联的标准残差块的数量可以调节,从而形成不同的深度差。
然后将两条边的结果逐像素相加,最后再做一次卷积操作。
相较于标准残差块,双向嵌套级联残差单元拥有更强的特征提取能力和特征融合能力。
文中还提出跨区域压缩模块(CRC ),它是对2倍率下采样卷积操作的替代,旨在融合跨区域的通道数据,进一步加强主干网络输入特征图所包含的信息。
实验结果表明:提出的模型在CCTSDB 数据集上mAP (0.5)、mAP (0.5∶0.95)分别达到96.86%、68.66%,FPS 达到66.09帧。
相比于YOLOv3算法,3个指标分别提升1.23%、10.35%、127.90%。
关键词: 交通标志检测; 双向嵌套级联残差单元; 跨区域压缩模块; YOLOv3; 长沙理工大学中国交通标志检测数据集; 特征提取; 特征融合中图分类号: TN911.73⁃34; TP391 文献标识码: A 文章编号: 1004⁃373X (2024)05⁃0176⁃06Traffic sign detection method based on bi⁃directional nested cascading residualsJIANG Jinmao, ZHONG Guoyun(School of Information Engineering, East China University of Technology, Nanchang 330013, China)Abstract : Traffic sign detection is an important topic in the field of autonomous driving, which has very high requirements for real ⁃time performance and accuracy of the detection system. The YOLOv3 algorithm in the field of target detection is recognized as one of the leading algorithms in terms of accuracy and speed. In this paper, by taking YOLOv3 detection algorithm as the base network, a bi⁃directional nested cascaded residual (bid⁃NCR) unit is proposed to replace the standard residual blocks sequentially stacked in the original network. The two residual edges of the bid⁃NCR unit is of the same structure, both of which are one convolutional operation plus one cascaded residual processing, and the number of cascaded standard residual blocks on the two edges can be adjusted to form different depth differences. The results of the two edges are then added pixel by pixel, and another convolutional operation is performed, finally. In comparison with the standard residual blocks, the bid ⁃NCR unit has stronger feature extraction capability and feature fusion capability. The cross ⁃region compression (CRC) module, which is an alternative to the 2⁃fold downsampling convolutional operation, is proposed. It aims to fuse the channel data across regions to further enhance the information contained in the input feature map of the backbone network. The experimental results show thatthe model proposed in this paper achieves mAP(0.5) and mAP(0.5∶0.95) of 96.86% and 68.66%, respectively, and FPS of 66.09 frames on the dataset CCTSDB. In comparison with YOLOv3 algorithm, the three indicators are improved by 1.23%, 10.35% and 127.90%, respectively.Keywords : traffic sign detection; bid⁃NCR unit; CRC module; YOLOv3; CSUST Chinese traffic sign detection benchmark(CCTSDB); feature extraction; feature fusionDOI :10.16652/j.issn.1004⁃373x.2024.05.031引用格式:江金懋,钟国韵.基于双向嵌套级联残差的交通标志检测方法[J].现代电子技术,2024,47(5):176⁃181.收稿日期:2023⁃09⁃13 修回日期:2023⁃10⁃11176第5期梯度直方图特征[1]等,以上方法最大的问题在于这些人工提取的特征高度依赖于特定的场景,泛化能力很差;另一类是基于深度学习的方案,比如文献[2]提出的基于多尺度卷积神经网络的方案,设计了一个多尺度空洞卷积池化金字塔模块用于采样。
英语学术论文范文【可编辑版】

英语学术论文范文英语学术论文范文英语学术论文范文:1. TitleStrategies of Oral English Teahing in Senior ShoolsThesis StatementThe urrent soial bakgrounds hih make Oral English bee an important part in the English learning proess are urgent. Teahers in senior shools alas enounter man problems in their Oral English teahing. This stud disusses the major auses, and gives some reative solutions to them.3. Purposes and Signifiane of StudIn reent ears it has been argued on both linguisti and pshologial grounds that Oral English should be the prinipal objetive in English teahing. Most textbooks plae emphasis more on Oral English in that the embod a methodolog that is largel oral. The urrent problems that appear in Oral English teahing in senior shools are the greatest obstales hih prevent students from learning English ell. With the globalization of soial life and eonom, the proess of opening up to the outside bees quikl, to a ertain extent, the requirements for the ultivation of Oral English are instant.This stud ill help senior teahers and learners analze the potential problems and speifi methods to deal ith.4. Situation of StudCorder vies his opinions that the seond language aquisition provides to the researher evidene of ho languageis learned or aquired, hat strategies or proedures the learners are emploing in his disover of the language.Segaloitz and Gatbouton take their vie as that language learning partiularl the oral petene has begun to fous on the teahing strategies.Goffman points out that oral talking is often organized into to-part exhanges, this organizing prinipal follos from the ver fundamental requirements of oral speeh as a muniation sstem. The Teahing Sllabus stipulates that Band One requires senior shool students to retell main ideas based on the general meaning of the passages, and an do some introdution about famil, friends, or lass b using simple sentenes and expressions. Band To desribes that students an anser questions and disuss aording to the text effiientl. It also requires students to do dail talk about soiet, ulture and siene hih related to the text in the textbooks.The High Shool English Standards stipulates that Band Six requires senior shool students to do dail onversations and express on opinions on the given topis. Students an desribepersonal experienes and express oneself appropriatel on some speifi oasions. Band Eight stresses that students an make a3-minute speeh based on simple topis b preparation in a short time, and do some simple translations in dail life.Theories about ho e teah oral English reflet our vie of the nature of language. A deeper understanding of the effets of muniative needs on non-native speaker disourse should make us more understanding of our students diffiulties inpratising their Oral English. It is generall aepted that English plas an important part in the basi eduation ourses, and even in the advaned eduation. In the past, English teahing laid great emphasis on the grammatial strutures instead of Oral English teahing. This leads to some serious problems that most learners in China have studied English for more ten ears, et the annot muniate ith native English speakers naturall. The probabl lak the language environment, and most of them have no opportunities to pratie their English orall in lass. Furthermore, teahers, some of hom annot have ver good oral English, in some bakard and remote areas of China, are not qualified. These ertainl leave students the diret impat on the motivation of English learning.5. Diffiult of StudIt is a little bit hard for senior students to spend some time everda to pratie their Oral English beause of the heav pressure of the entrane examination to ollege. Meanhile, in vie of the test-oriented sstem in China, teahers often emphasize a lot on preparing lesson plans for their students. Moreover, the solutions that offered in this stud annot be put into pratie easil. Colleting the materials andinformation is another diffiult thing for m limited time energ.6. Outline1. IntrodutionTheoretial Frameork1 Foreign Language Methodologies2 The Requirements of the High Shool English Standards3 Theories of the seond language aquisition4 Motivations for Senior Students English Learning3. The Causes of the Problems3.1 Students Fators in Their Oral English Learning3.1.1 Lak of Language Environment3.1.2 Fe Opportunities to Contat ith English3.1.3 Lak of Confidene and Creativit1.4 The Impat of Pshologial Obstales3.2 Teahers Fators in Their Oral English Teahing 3.1 Less profiien in teahers oral English3.2 Poor Teahing Theories and Strategies3.3 The Traditional Teahing Modes3.3 Administrators Problems3.3.1 Large Class3.3.2 The Current English Test Sstem4. Solutions4.1 The solutions to Students Problems4.1.1 Cultivation of Language Environment4.1.2 Creation of More Chanes to Pratie Oral English 4.1.1 Reitation Method4.2 Step-b-step Method4.1.3 Finding the fixed partners to pratie4.1.3 Fostering Self-onfidene and Creativit4.2 The Solutions to Teahers Problems4.1 Professionalism for Teahers Oral English4.2 Attempt of Ne Teahing Theories and Strategies 4.1 Model-based Method4.2 Theme-based Method4.3 Question Anser Method4.4 Interative Approah4.5 Group Ativities4.6 Role pla7 Disussion and Debate4.8 The Art of Correting Mistakes4.3 The Solutions to Governments Eduation Poli4.3.1 Small Class4.3.2 The Reform of English Test Sstem5. ConlusionBibliograph Rihards, J. J. The Context of Language Teahing. Beijing:Foreign Language and Researh Press, 201X Robins, R. H. General Linguistis. Beijing:Foreign Language and Researh Press, 201X 成云.心理学. 成都:四川大学出版社, 201X 胡春洞.英语教学法. 北京:高等教育出版社,90 刘家坊. 教育学. 成都:四川大学出版社,201X中国教育部. 全日制普通高级中学英语教学大纲. 北京:人民教育出版社, 201X 钟启泉. 外语教育展望. 上海:华东师范大学出版社, 2001以上这篇英语学术论文范文为您介绍到这里,希望它对您有帮助。
A Survey on Remotely Operated Quadrotor Aerial

International Journal of Computer Applications (0975 – 8887)Volume 11– No.10, December 2010 A Survey on Remotely Operated Quadrotor AerialVehicle using the Camera PerspectiveDebadatta Sahoo Dept. of EEE Dr. M.G.R. UniversityAmit KumarDept.of EEEDr. M.G.R. UniversityK. SujathaAssistant ProfessorDept. of EEEDr M.G.R UniversityABSTRACTThis survey paper presents a mission-centric approach to controlling the optical axis of a video camera mounted on a camera manipulator and fixed to a quad rotor remotely operated vehicle. A four-DOF quad rotor, UAV model will be combined with a two-DOF camera kinematic model to create a single system to provide a full six DOF actuation of the camera view. This survey work proposed exploits that all signals are described in camera frame. The closed-loop controller is designed based on a Lyapunov-type analysis so that the tracking result is shown to produce Globally Uniformly Ultimately Bounded (GUUB). Computer simulation results are provided to demonstrate the suggested controller. [1]KeywordsUsing MATLAB, dc brushless motor, remote control, manual control ,visual camera.1. INTRODUCTIONThe typical scenario for using the quad rotor helicopter (or any aerial vehicle) as a video camera platform is based on mounting the camera on a positioned that is controlled independently from the vehicle. When the navigation or surveillance tasks become complicated, two people may be required to achieve the camera targeting objective: a pilot to navigate the UAV and a camera operator. An important underlying action on the part of the camera operator that makes this scenario feasible is that the camera operator must compensate for the motions of the UAV that disturb the camera targeting; uncompensated camera platform motion on the camera axis might be loss of targeting, but a scenario where the camera positioned is used to compensate for the platform motion can maintain the camera view. The potential shortcomings of this typical operational scenario can be summarized as: i) multiple skilled technicians are typically required, ii) the camera operator must compensate for the actions of the pilot, and iii) it is not intuitive for a camera operator to split the camera targeting tasks between actions of the camera positioned controlled by the operator and commands to the pilot. The problem of providing an intuitive interface with which an operator can move a camera positioned to make a video camera follow a target image appears in many places. The difficulty of moving a system that follows a subject with a video camera was recently addressed in. A die rent perspective to this same basic camera targeting problem was presented where the camera platform, a quad rotor UAV, and the camera positioning unit are considered to be a single robotic unit. The work in builds on to show the design of a velocity controller for the combined quad rotor-camera system that works from operator commands generated in the camera field-of-view to move both elements. The paper is organized as follows. In Section 3, a kinematic and dynamic model of the quad-rotor is presented. The kinematics for a three-link camera positioned are developed; however, only two links are used in any position scenario. The case of this positioned used in a 2-link, Tilt-Roll configuration to look forward is carried through the control design and simulation [2].2. LITERATURE REVIEW2.1 Quadrotor modelA. Under actuated Quad rotor Aerial Vehicle Model. The elements of the quad-rotor unmanned aerial vehicle model are shown in Figure 2. The quad rotor body fixed frame, F, is chosen to coincide with the center of gravity which implies that it has a diagonal inertia matrix. The kinematic and a dynamic model of a quad rotor are expressed as follows [1, 2]=(ө) (1)(ө) (2)(3)(4)In this model (t) = R3 denotes the linearthe earth-fixed inertial frame, I, expressed in the body-fixed frame, F, and =R3. denotes the angular velocity the quadrotor body-fixed frame F with respect to the inertial frame, I, expressed in the body-fixed frame, F. Equations (1) - (3) represent the kinematics of the quad rotor. The in (1), is the velocity of the quad rotor and in (2) represents, the angular velocity transformed by the matrix(ө)The position and angle,,,a re assumed to bethat angular velocity of the quad rotor is calculated directly in lieu of modeling the angular dynamics; that is, is considered as the system input. The dynamics of the translational velocity is shown in (4) and contains the gravitational term, G(E3 R3, where g R, denotes gravitational acceleration, E3 = [0, 0, 1]T. denotes the unit vector in the coordinates of the inertial frame, m R1 is the known mass of the quad-rotor,N1R3. represents a R2*3 . is a general form of the skew-symmetric matrix [6]. TheInternational Journal of Computer Applications (0975 – 8887)Volume 11– No.10, December 2010quad rotor has inherently six degrees-of-freedom; however, the quad rotor has only four control inputs: one translational Figure 1. Quad rotor with a Pan-Tilt-Roll CameraPositionedforce along the z-axis and three angular velocities. The vector (t)R3refers to the quad rotor translational forces but in reality represents the single translational force which is created by summing the forces generated by the four rotors and is expressed asB1 U1where B1 = I3 is a configuration matrix (actuator dynamics are beyond the scope of this design) and u1(t) R1Figure2. Movement of quad rotorA quad rotor has four motors located at the front, rear, left, and right ends of a cross frame. The quad rotor is controlled by changing the speed of rotation of each motor. The front and rear rotors rotate in a counter-clockwise direction while the left and right rotors rotate in a clockwise direction to balance the torque created by the spinning rotors. The relative speed of the left and right rotors is varied to control the roll rate of the UAV. Increasing the speed of the left motor by the same amount that the speed of the right motor is decreased will keep the total thrust provided by the four rotors approximately the same. In addition, the total torque created by these two rotors will remain constant. Similarly, the pitch rate is controlled by varying the relative speed of the front and rear rotors. The yaw rate is controlled by varying the relative speed of the clockwise (right and left) and counter-clockwise (front and rear) rotors. The collective thrust is controlled by varying the speed of all the rotors simultaneously.[1-3],[4] 2.2. Camera Positioned KinematicsAs stated, the quad-rotor can thrust in the z-direction, but it cannot thrust in the x- or y-directions. Since the quad rotor helicopter is under actuated in two of its translational velocities, a two actuator camera is added to achieve six degrees of freedom (DOF) control in the camera frame. A tilt-roll camera is added to the front of the helicopter as seen in. With the new camera frame, there are now three rotations and three translations, a total of six DOF, to actuate. To control any of the DOF, either the camera must move, the UAV must move, or both.2.2.1. Tilt-Roll Camera on Front of UAVThe rotation matrix between UAV frame and Camera frame seen in upper Fig 1 is:sinөtcosөr sinө t sinөr cosөtsinөr cosөr 0- cosөt cosөr cosө t sinөr -sinөtSince only two of the angles vary, the Jacobian can be redefined asJ C(front) =and finallyj c(front)өc,өc= өt өr twhich facilitates the calculation of the angles of the camera.[02]2.2.2. Visual sensorTypically, the visual sensor consists of a camera and image processing block. In the simulation the object was defined as 3x1 vectors of coordinates related to earth for each points by 'polyhedral' command in MATLAB. To characterize the object four feature points were selected, being defined as the camera was modelled by using the positions and orientations of the camera and the object (xc , xo). The image processing block is modelled in the details of imaging geometry and perspective projection can be found in many computer vision texts [6]. To develop the visual sensor model, first the frames are defined. The helicopter frame is Rh, the camera frame is Rc and the object frame is Ro as shown in Figure 3.Figure3. The axes of the camera object andhelicopter 2.3. Control of quadrotorThe helicopter controllers have four input commands as U1, U2, U3, and U4. U1 represents the translation around the z axis. U2 represents the rotation around the y axis (roll angle). U3 represents the rotation around the x axis (pitch angle). Finally, U4 represents the rotation around the z axis (yaw angle). In this study, Proportional-Derivative (PD) controllers are designed to control the helicopter [6]. This is because that the control algorithm can be obtained from the helicopter model and this algorithm makes the system exponentially stable asFigure 4. Control system of quadrotor2.3.1. Altitude ControlFor the altitude control of the helicopter Equation 1 is used U1 = (1) where, z* is the reference linear velocity value around the z axis which is the third component of helicopter reference velocity vector vh*.2.3.2. Translation ControlIt is necessary to control the pitch and roll angles for controlling the translations around the x and y axis. Therefore, for translation around x axis, reference pitch angle and angular rate of pitch angle (ө.*, ө*)are demanded. In the same way, for translation around y axis, reference roll angle (φ*,φ. *) and angular rate of roll angle are demanded. While the angular rates are determined from vh* vector (4th and 5th components), the angles are determined by using Eq (2).φ*= arcsin[kd y(y. *-y.)]φ*= arcsin[kd x(x.-x*)]U2=kpφ(φ*- φ)-kd φ φ (2)U3=kpө(ө*- ө)-kd ө ө (3)2.3.3. Yaw ControlDesired input signal for the yaw control of the helicopter is presented in equation 3U4 = kdφ(*-.) (4)Figure 5. Linear and angular velocities of thehelicopter2.4.Design Procedure for quadrotorA custom designed experimental test stand shown in Figure 6 was used to perform secure experiments. The test stand allows the helicopter to perform yaw motions freely, allows up to 2 meters of altitude, as well as up to ±20° roll and pitch motion. The experiment system consists of a model quad rotor helicopter, a test stand, a pan/tit/zoom camera, a catadioptric camera to be used in the future researches, and an IMU sensor. A Core2Quad 2.40 GHz processor desktop computer with 3 GBs RAM on Windows XP that has a dual frame-grabber has been used. Algorithms were developed using Matrix Imaging Library 8.0 on C++ [20]. A Sony pan/tilt/zoom camera is directed to a stationary ground target. Captured images are processed with a feature extraction routine to determine the black blob features on the scene. Black blobs of various sizes were selected for simplicity and real-time performance. In order to show the effectiveness of the proposed algorithms an experiment of yaw motion under visual-servo control has been performed. The helicopter starts at 70 degree yaw angle and the goal is to reach 110 degree yaw angle under visual servo control. The Euler angles of the helicopter during the experiment are presented in Figure. The helicopter reaches the desired yaw values as the roll and pitch angles are kept at zero degrees during the motion.Figure 6. The Euler angles of the helicopter duringthe experiment.The linear and angular velocities during the experiment are presented in Figure 6. The desired angular velocity which is related with the yaw motion approaches zero line as helicopter approaches the desired yaw angle.Figure7. Results of the yaw control experiment. 3. PROPOSED TECHNIQUEThe proposed techniques in our UAV are listed below .It has four rotor and using four propeller. It will be more stable. It has one vision camera. It can give the proper image up to 100m fit (approximate). It can attain a height up to 100 fit (approximate). It has brushless dc motor of capacity 3000 rpm, which will be very light in weight. Our project showcases important control capabilities which allow for autonomous balancing of a system which is otherwise dynamically unstable. A quad-rotor poses a more challenging control problem than a single-rotor or dual-rotor inline helicopter because the controls demands include accounting for subtle variations which exist between the motors and cause each motor to provide a slightly different level of lift. In order for the quad-rotor craft to be stable, the four motors must all provide the same amount of lift, and it is the task of the control system to account for variations between motors by adjusting the power supplied to each one. We deemed the control of a quad-rotor craft as a valuable challenge to pursue. The benefits of such a craft warrant the design challenges, as a quad-rotor craft is more efficient and nimble than a single-rotor craft. Unlike a single-rotor craft, which uses a second, smaller vertical propeller to change direction, the quad-rotor craft’s directional motion is generated by the same four motors that are providing lift. Also, the quad-rotor can change direction without having to reorient itself –there is no distinction between front and back of the craft. In the quad-rotor, every rotor plays a roll in direction and balance of the vehicle as well as lift, unlike the more traditional single rotor helicopter designs in which each rotor has a specific task - lift or directional control - but never both. We have use the structural component, mentioned in table 1 below.International Journal of Computer Applications (0975 – 8887)Volume 11– No.10, December 20103.1. Brushless DC MotorThe motors are cobalt, brushed, DC motors rated for 12 V, 15 amps. The DC, brushed motor configuration was desired for ease of control (ability to control via PWM). The cobalt motors use strong rare earth magnets and provide the best power to weight ratio of the hobby motors available for model aircraft. We were limited to these hobby motors by our design budget. As a result, the rest of our structural design revolves around the selection of these motors and the allowable weight of the craft based on the lift provided by these motors (approximately 350g of lift from each motor) as shown in Figure 8.Figure 8. brushless dc motor and battery3.2. PropellersThe propellers are 10” from tip to tip. Two are of the tractor style, for clockwise rotation, and the other two are of the pusher style, for counter clockwise rotation. For our design, a propeller with a shallow angle of attack was necessary as it provided the vertical lift for stable hovering. The propellers we used were steeper than the ideal design because of limited availability of propellers that are produced in both the tractor and pusher styles.3.3. GearboxesThe gearboxes have a 2.5:1 gear ratio. They reduce the speed of the prop compared to the speed of the motor, allowing the motors to exert more torque on the propellers while drawing much less current than in a direct drive configuration.3.4. ArmsThe arms of our quad-rotor design needed to be light and strong enough to withstand the 10 stress and strain caused by the weight of the motors and the central hub at their opposite ends. Carbon fibre was deemed the best choice because of its weight to strength ratio. The thickness of the tube was chosen to be the smallest possible to lower its weight. The length of each arm (10”) was chosen based on the pro pellers. The propellers used are 10” long each so we had to allow enough room for them to spin without encountering turbulence from one another. Since such a phenomenon would be quite complex to analyze, we simply distanced the motors far enough apart to avoid the possibility of turbulence interference among rotors.3.5. BatteryThe battery was selected on the basis of power requirements for the selected motor/gearbox combination. We opted for a battery of the lithium polymer variety, despite the fact that itwas considerably more expensive than other batteries providing the same power, because this battery provided the best power-to-weight ratio. Our battery choice was a 1450mah 12.0V 12C Li-polymer battery. (Note: Because we did not have enough time to integrate the circuitry of the controls system on-board, and thus performed only tethered flight, we did not ultimately purchase the battery.) as shown in Figure 9.Figure 9. Lithium polymer variety3.6. Central HubThe central hub carries all of the electronics, sensors, and battery. It sits lower than the four motors in order to bring the centre of gravity downwards for increased stability. We manufactured it using a rapid prototyping machine considering our design for the hub, the rapid prototyping machine was ideal because of its ability to produce relatively complex details, for example the angled holes which allow for the central hub to sit lower than the surrounding motors. The thermoplastic polymer used in rapid prototyping has good strength to weight ratio.3.7. Motor MountsThe motor mounts connect the motors to the carbon fiber arms. Because of their complex details, they were manufactured using the rapid prototyping machine and therefore made of thermoplastic polymer.3.8. Block diagram of controlling quadrotorThe following schematic depicts our controls system. The diagram represents how the control system interacts with the physical system for controlled quad-rotorflight.The control of the system involves four independent PID loops. A PID loop is need for pitch control, roll control, yaw control, and height control. As each of the PID controls calculates how the platform has to change, the results are summed up for each of the motors resulting in the correction needed for integrated control of the Quad Rotor as shown Figure 10.Figure 10. Block diagram Control system schematicInternational Journal of Computer Applications (0975 – 8887)Volume 11– No.10, December 20104. CONCLUSIONThis survey paper suggests a novel fly-the-camera approach to designing a nonlinear controller for an under actuated quad rotor aerial vehicle that compliments the quad rotor motion with two additional camera axes to produce a fully actuated camera targeting platform. The approach fuses the often separate tasks of vehicle navigation and camera targeting into a single task where the pilot sees and flies the system as through riding on the camera optical axis. The controller was shown to provide position and angle tracking in the form of Globally Uniform Ultimately Bounded (GUUB) result. Visual information has been used solely for the control of the vehicle with the feature estimation, image based control, and helicopter controller blocks. Various simulations in MATLAB and experiments performed on a model helicopter show that the approach is successful. As a future work, we plan to experimentally validate the simulation results with stationary and non-stationary objects in the control loop with more advanced motions.5. ACKNOWLEDGEMENTSThe authors gratefully acknowledge the authorities of Dr. M.G.R. Educational and Research Institute, Chennai, India, for the facilities provided to carry out this research work. Many lives & destinies are destroyed due to the lack of proper guidance, directions & opportunities. It is in this respect we feel that we are in much better condition today due to continuous process of motivation & focus provided by my parents & teachers in general. The process of completion of this project was a tedious job & requires care & support at all stages. We would like to highlight the role played by the individuals towards this.We are internally grateful to honorable Mrs. K.Sujatha for providing us the opportunity & infrastructure to complete the project as a partial fulfillment of B.Tech degree. We are very thankful to L.Ramesh, Head of Department of EEE, for his kind support & faith in us. 6. REFRENCES[1] Nicolas Guenard, Tarek Hamel,and Robert Mahony,“APractical Visual Servo Control for an Unmanned Aerial Vehicle” transaction on robotics,vol-24,no-2,april200833. Member,IEEE.[2] Andrew E. Neff, DongBin Lee, Vilas K. Chitrakaran,Darren M. Dawson and Timothy C. Burg “Velocity Control for a Quad-Rotor UAV Fly-By-Camera Interface” Clemson University.[3] Dong Bin Lee1, Vilas Chitrakaran2, Timothy Burg1,Darren Dawson1, and Bin Xian “ Control of a Remotely Operated Quad rotor Aerial Vehicle and Camera Unit Using a Fly-The-Camera Perspective” Proceedings of the 46th IEEE Conference on Decision and Control New Orleans, LA, USA, Dec. 12-14, 2007.[4] Clinton Allison Mark Schulz “ Build a Micro Air Vehicle(MAV) Analysis and design of an on-board electronic system for a Quad Rotor Micro Aerial Vehicle.”ENGG4801 Thesis Project.[5] Erding Altuk, James P. Ostrowski, Camillo J. Taylor“Quad rotor Control Using Dual Camera Visual Feedback” GRASP Lab. University of Pennsylvania, Philadelphia,PA 19104, USA.September 14-19, 2003.[6]. Zehra Ceren, Erdinç Altu“Vision-based Servo Control ofa Quad rotor Air Vehicle”, IEEE, 2006.[7]. Engr. M. Yasir Amir 1, Dr. Valiuddin Abbass 2“Modeling of Quadrotor Helicopter Dynamics” April 9-11, 2008 in KINTEX,[8]. James F. Roberts, Timothy S. Stirling, Jean-ChristopheZufferey and Dario Floreano Ecole Polytechnique Fédérale de Lausanne(EPFL),Lausanne,1015, Switzerland.“Quadrotor Using[9]. Thae Su Aye, Pan Thu Tun, Zaw Min Naing, and YinMon Myint. “Development of Unmanned Aerial Vehicle Manual Control System”. World Academy of Science, Engineering and Technology 42, 2008。
21世纪初辐射防护的几个基本问题

21世纪初辐射防护的几个基本问题中国工程院院士 潘自强(中国核工业集团公司科学技术委员会,北京100822)摘 要:辐射防护已有近百年的历史。
20世纪下半叶随着核能和核技术应用的发展,辐射防护得到了较大的发展。
但仍然有许多基本问题有待进一步研究。
作为辐射防护基础的线性无阈理论受到挑战。
从辐射防护观点出发,基于当前的科学水平,应该认为选择线性无阈模式是合理的。
但从科学上说辐射剂量效应模式尚有待进一步研究。
辐射环境影响是辐射防护面临的一个新问题。
其生物学终点、参考生物和剂量评价模式等都有待深入研究。
利益相关者的参与是解决放射性废物管理和核安全困境的重要途径,其参与方式和时机等值得进一步研究。
关键词:辐射 防护Some Basic Issues of Radiation Protection at theBeginning of the21st CenturyMember of The CAE PAN Ziqiang(Science and Technology C ommission,C NNC,Beijing100822)Abstract:T he science of radiation Protection began about one hundred y ears ago.T he develop m ent o f radiation p rotection develop s in line w ith the develop ment o f N uclear E nergy and the app lication o f Nuclear and radiation technogy in the middle o f20th century.But not a f ew of basic issues need to be f urther resear ched.A ser ious challenge to the linear no threshold model of radiation p rotection has app eared.Fr om Radiation Protection Point o f View,It is r easonable to select the linear nonthr eshold model on the basis o f current science level.H ow ever,w e should emphasize the need f or f ur ther w ork on the dose r esponse model.Protecting the environment f rom the ef f ects of ioniz ing r adiation is an other new issue o f radiation p rotection.The issues,such as biological end p oints,ref erence f auna and f lora;and dose assessment model,all need to be better understood.Stakeholder s involvement is in cr easingly becoming an impor tant app roach to solve the dif f iculty of r adioactive w aste management and Nuclear saf ety.The study on imp lication and content of stakeholder s involvement must be em p hasiz es.Key words:r adiation,radiation p rotection辐射防护已有近百年的历史,但仍然是一门年青的科学。
智能汽车的英语作文及翻译

English Composition:In the dawn of the 21st century, the concept of smart cars has emerged as a revolutionary advancement in the automotive industry. These vehicles, equipped with advanced technologies, are designed to enhance safety, efficiency, and the overall driving experience. The integration of artificial intelligence, sensors, and connectivity allows smart cars to perform tasks that were once the sole domain of human drivers.The primary features of smart cars include autonomous driving capabilities, which enable the vehicle to navigate without human intervention. This is achieved through a combination of cameras, radar, and lidar sensors that constantly monitor the cars surroundings, allowing it to make informed decisions on the road. Additionally, smart cars are equipped with advanced driverassistance systems ADAS that can detect potential hazards and take preventive measures, such as automatic braking or lane correction.Another significant aspect of smart cars is their connectivity. These vehicles can communicate with other cars, traffic infrastructure, and even pedestrians through vehicletoeverything V2X technology. This communication allows for realtime traffic updates, collision avoidance, and improved traffic flow management. Moreover, smart cars can be connected to the internet, providing access to a wealth of information and services, such as navigation, weather updates, and even remote diagnostics.The environmental impact of smart cars is also noteworthy. Many smart cars are electric or hybrid, reducing their carbon footprint and contributing to a cleaner environment. Furthermore, their efficiency in navigation and energy consumption can lead to a significant reduction in fuel usage and emissions.However, the adoption of smart cars is not without challenges. Issues such as data security, privacy concerns, and the ethical implications of autonomous decisionmaking need to be addressed. Additionally, the high cost of these vehicles and the need for extensive infrastructure development pose barriers to widespread adoption.In conclusion, smart cars represent the future of transportation, offering a safer, more efficient, and environmentally friendly mode of travel. As technology continues to advance, it is expected that smart cars will become more affordable and accessible, leading to a transformative change in the way we navigate our world.Translation:在21世纪初,智能汽车的概念作为汽车工业的革命性进步而出现。
Unmanned Ground Vehicle Navigation Using Aerial Ladar Data
1 Unmanned Ground Vehicle Navigation Using AerialLadar DataNicolas Vandapel,Raghavendra Rao Donamukkala and Martial HebertCarnegie Mellon University5000Forbes avenuePittsburgh,PA15213,USAvandapel@Abstract—In this paper,we investigate the use of overhead high-resolution three-dimensional(3-D)data for enhancing the performances of an Unmanned Ground Vehicle(UGV)in vege-tated terrains.Data were collected using an airborne laser and provided prior to the robot mission.Through extensive and exhaustivefield testing,we demonstrate the significance of such data in two areas:robot localization and global path planning. Absolute localization is achieved by registering3-D local ground ladar data with the global3-D aerial data.The same data is used to compute traversability maps that are used by the path planner.Vegetation isfiltered both in the ground data and in the aerial data in order to recover the load bearing surface.Index Terms—Unmanned Ground Vehicle,terrain registration, localization,path planning,vegetationfiltering,overhead data, autonomous navigationI.I NTRODUCTIONAutonomous mobility for Unmanned Ground Vehicles (UGV)in unstructured environment over long distances is still a daunting challenge in many application including space and agriculture.We consider here terrain traversal:safe driving from an origin location to a destination location specified in some coordinates system.We do not consider terrain mapping or exploration where the robot has to build a map of a given area or has to look for some specific area of interest.A robot using on-board sensors only is very unlikely to select an optimal path to traverse a given terrain,facing dead-ends or missing less dangerous areas,out of reach of its sensors.The use of a priori overhead data help to cope with such a problem by providing information to perform global path planning.The robot,using its on-board high resolution sensors,is then left with the detection and avoidance of local obstacles which have eluded the lower resolution aerial sensor.In addition, local information captured by the UGV can be registered with information in the aerial data,providing a way to position absolutely the vehicle.This scenario is relevant for desertic, polar or planetary navigation.In less harsh climates,vegetation will introduce a new set of challenges.Indeed vegetated areas are made of unstable elements,sensitive to seasons,difficult to sense and to model with a goodfidelity.Vegetation can obscure hazards such as trenches or rocks,it prevents also the detection of the terrain surface,which is used in all terrain-based localization or to compute a traversability measure of the terrain for path planning.In this paper,we investigate the use of overhead high-resolution three-dimensional(3-D)data for enhancing the performances of an UGV in vegetated terrains.Data were col-lected using an airborne laser and provided prior to the robot mission.Through extensive and exhaustivefield testing,we demonstrate the significance of such data in two areas:robot localization and global path planning.Absolute localization is achieved by registering3-D local ground laser data with the global3-D aerial data.The same data is used to compute traversability maps that are used by the path planner.Our approach differs from the one presented in[1],[2] where air-ground vehicle collaboration is demonstrated.An unmanned autonomous helicopter([3])maps at high resolution the terrain ahead of the ground vehicle path.This overhead perspective allows the detection of negative obstacles and down-slopes,terrain features otherwise extremely difficult to perceive from a ground level point of view.This article aims at1)providing a complete and synthetic view of the work we published already in several articles,see [4],[5],[6],2)enhancing thefindings with additional results, and3)introducing new results.The article is divided into six sections.Section II presents in details thefield tests conducted in2001-2002,the sensors used and the data collected.Section III focuses on terrain surface recovery.Section IV and V presents two applications of the use of aerial lidar data:3-D terrain registration for robot localization and traversability map computation for path planning.Finally,in Section VI we conclude our work.II.F IELD EXPERIMENTATIONIn this section we present the initial terrains and sensors we used to validate our approach during thefirst phase of the program.Then we present successively the scenario of the field experiments we conducted during the second phase,the different terrains in which we operated,andfinally the sensors we used.A.Phase-I:initial evaluationDuring the initial phase of our research program,we tested our terrain registration method and traversability map com-putation using data from various ground and aerial mapping systems,in several environment setting.The most noticeable2 experiments were conducted using the high resolution Zoller-Fr¨o hlich(Z+F)LARA21400laser[7]and the CMU au-tonomous helicopter[3].Two test sites were primarily used:the MARS site and the coal mine site.The MARS sitewas engineered in order to include repetitive and symmet-ric structures and it was in addition instrumented and geo-surveyed in order to allow a performance assessment of theregistration method.Additional tests were performed in anopen coal mine containing larger scale terrain features,overten meters in height.With this data we performed controlledtests,investigating the influence of the terrain surface reso-lution,the method’s parameters,the rotation and translationconstraints to perform(Air-Ground,Air-Air,Ground-Ground)terrain registration.Details can be found in[4].The rest of thissection deals with thefield experiments we conducted duringthe phase-II,in2002.B.Phase-II:field experimentsThe main set of data used for this article was collected on four different sites characteristic of very different types of terrain.Each test site was divided into courses having its own set of characteristic terrain features,natural and occasionally man-made obstacles.The tests were performed during the second phase of the project:in February,in a wooded areas with large concentrations of tree canopies;in March in a desertic rocky area with scattered bushes,trees and cacti, sculpted with gullies and ledges;in August in an area located at more than3,000meters in altitude this alpine terrain contains large slope terrains,cluttered by rocks and covered by pines trees;and in November,in a mostlyflat terrain, covered by tall grass and woods,traversed by water streams and containing man-made obstacles.Eachfield test will be referenced respectively as Wood test,Desert test,Alpine test and Meadow test.Eachfield test was instrumented and geo-surveyed.Several antennas were installed in order to relay the robot status and navigation data to the base camp.After each course test the terrain was scouted and various pieces of information were collected such as DGPS position of salient terrain features or trees,measurement of vegetation height and so forth.Access to such data makes definitively the test performed exhaustive and intensiveTable I contains,for eachfield experiment,the number of courses,of runs,of waypoints and the total distance traversed.TABLE IF IELD EXPERIMENTS STATISTICSDesert test51647 3.2 Meadow testWood test Meadow test2.9×2.4 2.4×2.9 Nbr.points(millions)38.232)Software architecture:The software architecture is made of three components for aerial data processing,UGV control and terrain-based localization.Aerial data was processed off-board the ground vehicle on a laptop running Linux.The paths planned were feed to the robot prior to the mission.The ground vehicle computer architecture is the NIST4D-RCS[9]architecture,implemented on power PC boards running VxWorks.The localization software was implemented on alaptop running linux and installed on-board of the robot. Ground ladar data was read from a Neutral Message Language (NML)buffer and processed on the laptop.III.T ERRAIN SURFACE RECOVERYBoth our applications,terrain registration and path planning, require the recovery of the terrain surface.In this section weaddress the problem of removing the vegetation to uncover the terrain surface.A.VegetationfilteringWe implemented two methods tofilter the vegetation.Thefirst one takes advantage of the aerial lidar capability to detect multiple echoes returned per laser pulse emitted.The ground ladar does not have this capability,so a secondfiltering methodhad to be implemented.1)State of the art:Filtering lidar data has been mainlystudied in the remote sensing community with three objectives: producing surface terrain models[10](in urban or natural environment),studying forest biomass[11],and inventoringforest resources[12].Tofilter lidar data authors used linear prediction[10],mathematical morphology(grey opening)[13],dual rankfilter[14],texture[15],and adaptive windowfilter-ing[16].All these methods are sensitive to the terrain slope. In the computer vision community Mumford[17]pioneeredthe work for ground range images.Macedo[18]and Castano [19]focused on obstacle detection among grass for outdoor ground robot caze in[20],proposes to detectvegetation by looking at the permeability of the scene to laser range measurement.Another method([21])is to look at thelocal point distribution in space and uses a Bayes classifier to produce the probability of belonging to3classes-vegetation, solid surface and linear structure.2)Methods implemented:a)Multi-echoes basedfiltering:The lidar scans frommultipleflights are gathered and the terrain is divided into1m ×1m cells.Each point falling within a given cell is classified as ground or vegetation by k-mean clustering on the elevation.Laser pulses with multiple echoes(first and last)are used to seed the two clusters(vegetation and ground respectively). Single echo pulses are assigned initially to the ground cluster. After convergence,if the difference between the mean value of the two clusters is less than a threshold,both clusters are merged into the ground cluster.The clustering is performed in groups of5x5cells centered at every cell in the grid.As we sweep the space,each point is classified25times and a majority vote defines the cluster to which the point is assigned.b)Cone basedfiltering:We had to implement a new method forfiltering the vegetation from ground data.Our approach is inspired by[22]and is based on a simple fact: the volume below a ground point will be free of any lidar return.For each lidar point,we estimate the density of data points falling into a cone oriented downward and centered at the point of interest,as shown in Figure2.Fig.2.Cone basedfiltering.Point:point to be clustered as ground or vegetation.θopening of the cone.ρminimum elevation before taking into account points.While the robot traverses a part of the terrain,ladar frames are registered using the Inertial Navigation System(INS).The INS is sensitive to shocks(e.g.,a wheel hitting a rock),which causes misalignment of consecutive scans.In order to deal with slightly misaligned frames,we introduce a blind area defined by the parameterρ(typically15cm).The opening of the cone(typically10-20o)depends on the expected maximum slope in the terrain and the distribution of the points.Figure 3illustrates an example of points distribution for a tree as seen by an aerial and a ground sensor.In the latter case,the trunk will occlude the terrain surface on top of which the ladar can perceive the tree canopy.If the cone opening is too narrow,the vegetation point will be misclassified.This case also illustrates the fact that by nearly taking the minimum elevation in each cell of a“gridded”terrain,we cannot recover the groundsurface.top viewGround caseFig.3.Points distribution in a tree for an aerial lidar sensor(left)and a ground ladar sensor(right).3)Example:Figure4shows an example of terrain surface recovery in ground ladar data using the cone basedfiltering method.This approach has been used to produce the re-sults presented section IV.Our current implementationfilters 67,000points spread over100m×100m,in25s on a Pentium III,1.2GHz.4(a)(b)Fig.4.Example of ground ladar datafiltering.(a)Top view of aflat terrainwith a cliff containing3m high trees and smaller bushes.(b)Side view ofthe same scene.In grey,the load bearing surface and in color the vegetation.Figure5shows a comparison of the two methods imple-mented for load bearing surface recovering using aerial lidardata.The performance of the cone-based method over the k-mean method is clearlyvisible.(a)Cone ground(b)Conevegetation(c)k-mean ground(d)k-mean vegetationFig.5.Meadow parison of the cone based(a)-(b)and k-mean(c)-(d)method for terrain surface recovery.Data is shown as top views of3-D points cloud with the elevation color-coded.The scene is200×200m2in size.B.Performance evaluationThefidelity of the terrain surface recovered depends on twomain factors:the raw3-D data collected by the lidar and thevegetationfiltering technique.We assess both here.1)Lidar data quality:The lidar absolute error was esti-mated using ground features recognizable in the lidar dataand for which we collected DGPS points.We choose three ofthem:the center of theflat root of an isolated building,a largeflat concrete bed and the center of a crater.The results of thefirst case are presented in Table III.TABLE IIILIDAR ABSOLUTE ERROR,ROOF DATA SETEasting3,437,988.763,437,989.010.25Elevation5Fig.7.Vegetationfiltering error.The red crosses are used for the points classified as vegetation,and the blue dots are used for ground points.IV.A IR-G ROUND TERRAIN REGISTRATIONA.OverviewIn the previous section,we presented a method to recover the load bearing surface of terrains with a vegetal cover,a preliminary step to perform terrain-based robot localization. Our approach is to align ground laser data with aerial laser data in order tofind the position and the attitude of the ground mobile robot.By establishing3-D feature points cor-respondence between the two terrain maps and by extracting a geometrically consistent set of correspondences,a3-D rigid transformation can be estimated,see Figure8.In this section,we compare our approach to other Air-Ground terrain registration methods for robot localization.We present the surface matching engine used,and we then focus on the extensions that are needed for practical Air-Ground registration,including the incorporation of positional con-straints and strategies for saliency points selection.We present the system architecture and data structures used in practical operation of the registration system with full-scale maps.We finally present results obtained duringfield experiments.B.Air-Ground terrain registration for robot localization Ground localization can be achieved in mountainous terrain by using the horizon skyline acquired by a panoramic camera and a topographic map.Several authors followed this idea, their approach differ by the nature of the feature extracted from the skyline.Talluri([23])proposes to compute for each position in the map the height of the skyline and to compare it with it counterpart in the topographic map.Sutherland([24]) extracts elevation peak as features and focuses on the selection of the best set to be used to minimized the localization error by triangulation.Stein([25])proposes a two steps approach:first,he reconstructs the skyline for some position in the map as a linear piecewise function and index them in order to map them efficiently with the skyline extracted from a camera, second,a verification is performed by matching the skyline. Cozman([26])follows the same path but in a probabilistic framework.Such method cannot be applied to our problem because they rely on too specific skyline typically found only in mountainous area.In addition their reported accuracy, hundred of meter,is too poor.Yacoob([27],[28])proposes to acquire random range measurements from a static position and to match them in a digital elevation map.The orientation and altitude of the vehicle is supposed known.This approach was envisioned in the context of a planetary terrain.Single range measurements do not provide enough information to disambiguate between returns from vegetation and the terrain surface.This approach cannot not be pursued.Li([29])proposes to localize a planetary rover through bundle adjustment of descent images from the lander and rover stereo-images.Our primary ground sensor is a ladar and we have access to higher density and resolution aerial data.C.Registration by matching local signaturesWe present here the approach to3-D surface matching we decided to follow.Given two3-D surfaces,the basic approach is to compute signatures at selected points on both surfaces, that are invariant by changes in pose.Correspondences are established between points with similar signatures.After clus-tering andfiltering of the correspondences,the registration transformation that aligns the two surfaces is computed from the correspondences.The key to this class of approaches is the design of signatures that are invariant and that can be computed efficiently.We chose to use as the signatures introduced by Andrew Johnson in[30]–the“spin-images”–and used since then in a number of registration and recognition applications.A spin-image is a local and compact representation of a3-D surface that is invariant by rotation and translation.This representation enables simple and efficient computation of the similarity of two surfaces patch by comparing the signatures computed at selected points on the patches.Interpolation between the input data points[31]is used to make the representation independent of the surface mesh resolution.The signatures are computed at selected data points–the basis points–at which surface normal and tangent plane are computed.For each point in the vicinity of a basis point,two coordinates can be defined:αthe distance to the normal and βthe distance to the tangent plane.The spin-image surface signature is a2-D histogram inαandβcomputed over a support region centered at the basis point.Parameters include the height and width of the support region,and the number of cells used for constructing the histogram.Proper selection of these parameters is crucial for ensuring good performance of the matching algorithm.We will return to that point in the experiments section.D.Improvements1)Using a priori positional information:In its most gen-eral form,the matching algorithm attempts tofind correspon-dences by comparing signatures directly,without restrictions on the amount of motion between the two data sets.Although this is appropriate for some unconstrained surface matching problems,additional constraints can be used in the terrain matching scenario.Specifically,constraints on the orientation and position of the robot from the navigation sensors can be used to limit the search for correspondences.6Terrain RegistrationA priori position & UncertaintyVehiclePositon & attitudeLow resolution surface mesh Local terrain characterizationAerial lidar data Local terrain characterizationHigh resolution surface mesh Registration resultsGround laser data Ground data processing, on−board, on−lineFig.8.Overview of the terrain-based localization method.The top section is concerned with the off-line processing of the aerial ladar data.The bottom section deals with on-line ground ladar data processing and comparison with a priori data.Positional constraints are used as follows.To generate a correspondence between two oriented points we check the relative orientation of the normals,see Figure 9-(a).If the difference in heading (projection in the horizontal plane)and in elevation (projection in the vertical plane)are below limit angles spin-images are compared and a correspondence is eventually produced.The a priori position of the robot and a distance threshold is used to constraint in translation the search of potential correspondences,see Figure 9-(b).For each oriented point in the scene mesh (the ground data),only oriented points in the model mesh (the aerial data)which satisfy the translation constraints are considered to produce eventually a correspondence.2)Point selection strategy:In realistic registration applica-tions,the terrain data may contain millions of data points.In such situations,it is not practical to use all the data points as candidate basis points for matching.In previous registration systems [30],[31],a fraction of the mesh vertices,chosen randomly,was used to build the correspondences.Although it reduces the number of basis points to a manageable level,there are several practical problems with direct uniform sampling.First,a substantial percentage of the points may be non-informative for registration –as an extreme example,consider those points for which the terrain is flat inside the support region –and uniform sampling would not reduce that percent-age.Second,a more subtle problem is that a high density of basis points is acceptable on the reference aerial map,because the signatures are computed off-line,but a lower density is preferable in the ground data since it is processed on-line.In [32],Johnson proposed a method for point selection based on the surface signatures.In that approach,the signa-Verticale = V(a)id_pt_1id_pt_2id_pt_n ooooo bin_mapYSurface mesh, global map (model)position uncertaintylocal projection celland mesh pointlist id pt(b)ing a priori positional information:(a)in orientation and (b)in position.tures and the position of each oriented point is concatenated to produce a vector.This high dimensional space is reduced using PCA and clusters are extracted to isolate unique land-marks.Although very effective,this approach has two major drawbacks for our application.First,the algorithm is computa-tionally expensive because the signatures must be computed at all the input data points prior to point selection and because of the cost of performing compression and clustering in signature space.Second,this approach was used for registering multiple7terrain maps taken from similar aerial viewpoints.As a result, the input data sets would exhibit similar occlusion geometry. In our case,ground and aerial data may have radically different configurations of occluded areas,which needs to be taken into account explicitly in the point selection.Also,that approach did not take into account the need for asymmetric sampling mentioned above–high density of points on the reference map and low density on the on-line terrain map from the ground robot.We developed a different point selection strategy in which the basis points from the input data set are progressively filtered out by using a series of simple tests,most of which do not require the computation of the signatures.Eventually,a fraction of points uniformly sampled from the remaining set is retained.Thefinal sampling implements the asymmetric point selection strategy with a high density of points in the model (the aerial data)and a low density in the scene(the ground data).Details of the various criteria used for point selection are described below.a)Flat areas:Points inflat area or area of constant slope do carry any information for registration.In such regions the signatures will have high mutual similarity.As a result,the registration procedure will create a large number of correspon-dences that are hard tofilter out.To discard such areas we compute local statistics of the surface normals in the support area of the basis points.Even though the surface normals are noisy,smoothing the mesh and using a region based criteria allow us tofilter correctly the points.This method does not require the computation of signatures.b)Range shadows:Self-occlusions in the ground data in the support region centered at a given basis point may corrupt the signature computed at that point.Because of the extremely different sensor geometry used for acquiring the aerial data –viewing direction nearly orthogonal to the terrain surface –and the ground data–viewing direction at low grazing angle,terrain occlusions have a radically different effect on the signatures computed from the aerial and ground data sets, even at the same point and with the same support region,see Figure10-(a)-(b).It is therefore imperative that the occlusion geometry be explicitly taken into account so that basis points at which the signatures are moderately corrupted by occlusions can be selected.We developed a method to reject oriented points too close from map borders or from occluded areas.Figure10illustrates our method.To detect the occlusion situations,we compare the surface of the spin-image support area,the circle,with the surface really intersected,the surface inside the circle.We compute the area ratio between both surface patches.Wefilter oriented points if this ratio is below a threshold.This approach eliminates those signatures which contain a large occlusion that would not appear in the aerial data.This method does not require the computation of the spin-images.c)Information Content:To retain a basis point as a feature for matching,we also require a minimum level of information content,defined as the number of lines occupied in the signature.Figure11presents one rejected signature and one retainedsignature.(a)Top view(b)Signature(c)Top view(d)SignatureFig.10.Range shadowfiltering.Mesh and signature for the samephysicalpoint using the ground andthe aerialdata.(a/b)Ground data.(c/d)Aerial data.The circle represents the swept area by the spin-image.(a)Scene(b)Signature(c)Scene(d)Signaturermation content in signature.(a)/(c)Oriented points.In red the current point with the signature displayed on the right.In Green the points with high level of information content.In grey the surface mesh.(a/b)Retained signature.(c/d)Rejected signature.E.Operational systemIn practical applications,we deal with maps of several kilometers on the side with millions of data points.In such cases,even after point selection,it is simply not practical to store and index into the entire reference data set.In practice, the reference map is divided into sub-maps that are large enough to include a typical scan from the ground sensor, but small enough tofit in memory.In the system described below,we use300m×300m as the default patch size.For each patch,the list of selected points and the corresponding signatures are generated and stored.At run-time,the robot’s dead reckoning system provides a position estimate that is used to retrieve the appropriate 300m×300m patch.The dead reckoning system is also used to provide positional constraints derived from the uncertainty model.8TABLE IVDesert test,LEDGE6/7GROUND DATA STATISTICSFrames37K100KDistance traversedSignaturesTiming(ms)Build correspondences465correspondences createdV otes451correspondences left Correlation188correspondences left Geometric consistency52correspondences left Creates matches one createdCluster matchesMatch verificationBest matchIn addition to the storage issue,there is an indexing issue in which the signatures at points that are within the limits imposed by the positional constraints are efficiently retrieved from the set of points.Even within a300m×300m patch, efficient retrieval is a concern.In the current implementation, a data structure is added to the basic grid for efficient retrieval of basis points that are within translational tolerance of a query point,and whose surface normals is within angular tolerance of the normal at that query point.F.ResultsIn[4]we presented an metric evaluation of the registration performances of the method proposed.In this section we present registration results(Air-Ground and Ground-Ground) obtained during thefield experiments.1)Air-Ground registration:We showed three sets of Air-Ground registration from the Desert test and one from the Meadow test.Figure12shows two examples of terrain regis-tration along a small hill.The robot drove along the hill on aflat terrain with sparse dry vegetation.Figure12-(a)shows the hill and Figures12-(b)/(c)show the registration results. Ground data information(number of ladar frames integrated, distance traversed,number of3-D points,and number of signatures used for registration)are presented in Table IV. The registration method parameters used are:•Spin-image parameters:0-3×±2m in size,and20×20 pixels in resolution.•Area of interest:±20m in position,20o in heading,and 20o in orientation to the vertical.The second set of results are obtained from the wash area during the Desert test.The wash area is a riverbed like terrain made of the lowerflat terrain bordered on each side by higher ground.Vegetation is denser than in the ledge area with the presence of large trees and numerous bushes as it can be seen in Figure13-(a)/(b).The registration results are shown in Figure13-(c)/(d).Table VI and Table V provide timing information and details on the registration process.Finally the third set of results come from the Meadow test. The terrain is made of two parallel piles of soil,two metersTABLE VIDesert test,W ASH9REGISTRATION STATISTICSStep Notes1263.1527.051.7435.6238.980.050.010.01Ground Aerial51* Distance traversedSignatures before/afterfiltering。
Survey of vision-based robot control
for the visual servoing of a dynamic system [48, 30]. The first control scheme is called “direct visual servoing” since the vision-based controller directly compute the input of the dynamic systems (see Figure 1) [33, 47]. The visual servoing is carried out at a very fast (at least 100 Hz, with a rate of 10 ms). The second
Reference − Vision−based Control Dynamic System Camera
Figure 1: Direct visual servoing system control scheme can be called, contrary to the first one, “indirect visual servoing” since the vision-based control compute a reference control law which is sent to the low-level controller of the dynamic system (see Figure 2). Most of the visual servoing proposed in the literature follows an indirect control scheme which is called “dynamic look-and-move” [30]. In this case the servoing of the inner loop (generally the rate is 10 ms) must be faster than the visual servoing (generally the rate is 50 ms) [8]. For simplicity, in this paper we consider examples of
Obstacle Detection Robot Safety

简短作文素材英文回答:In the realm of human endeavor, the pursuit of knowledge and understanding stands as a testament to our innate curiosity and desire for enlightenment. From the earliest civilizations, humankind has been driven to unravel the mysteries of the world around us, seeking answers to questions both profound and mundane.This insatiable thirst for knowledge has led to the establishment of formal education systems, where individuals are systematically instructed in various disciplines, ranging from science and mathematics to history and literature. Through the acquisition of knowledge, we gain the ability to comprehend the world, make informed decisions, and contribute to the progress of society.However, the pursuit of knowledge is not confined tothe traditional halls of academia. In the modern era, access to information has become democratized, with the rise of digital technologies and the internet. Individuals can now acquire knowledge from a myriad of sources, including online courses, open educational resources, and social media platforms.The ease of access to knowledge has undoubtedly empowered individuals and enabled them to pursue their educational goals. Yet, it has also posed challenges. With the proliferation of information, comes the need to critically evaluate sources and distinguish factual knowledge from false or misleading claims.Moreover, the pursuit of knowledge should not be limited to the accumulation of facts and theories. True knowledge encompasses not only the acquisition of information but also its application in practical situations. It involves the development of critical thinking skills, problem-solving abilities, and the capacity to innovate and adapt to changing circumstances.In summary, the pursuit of knowledge is an essential aspect of human existence, empowering individuals to comprehend the world and make meaningful contributions to society. While access to knowledge has become more accessible, it is crucial to approach the pursuit of knowledge with critical thinking and a commitment to lifelong learning.中文回答:在人类探索的领域中,对知识和理解的追求证明了我们与生俱来的好奇心和对启蒙的渴望。
基于北斗导航的地质勘探小车
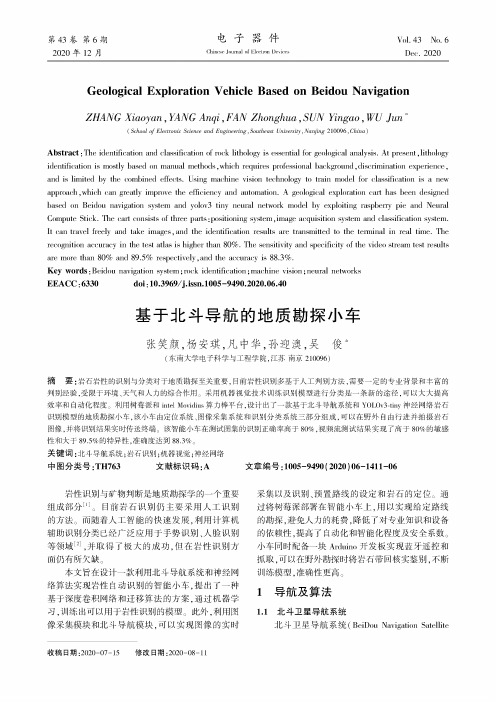
第43卷第6期电子器件Vol.43No.6 2020年12月Chinese Journal of ElccLron Devices Dec.2020Geological Exploration Vehicle Based on Beidou NavigationZHANG Xiaoyan,YANG Anqi,FAN Zhonghua,SUN Yingao,WU Jun卒(School of Electronic Science and Engineering,Southeast University,Nanjing210096,China)Abstract:The identification and classification of rock lithology is essential for geological analysis.At present,lithology identification is mostly based on manual methods/which requires professional background,discrimination experience, and is limited by the combined ing machine vision technology to train model for classification is a new approach/which can greatly improve the efficiency and automation.A geological exploration cart has been designed based on Beidou navigation system and yolov3tiny neural network model by exploiting raspberry pie and Neural Compute Stick.The cart consists of three parts:positioning system,image acquisition system and classification system. It can travel freely and take images,and the identification results are transmitted to the terminal in real time.The recognition accuracy in the test atlas is higher than80%.The sensitivity and specificity of the video stream test results are more than80%and89.5%respectively,and the accuracy is88.3%.Key words:Beidou navigation system;rock identification;machine vision;neural networksEEACC:6330doi:10・3969/j・issn・1005-9490・2020・06・40基于北斗导航的地质勘探小车张笑颜,杨安琪,凡中华,孙迎澳,吴俊*(东南大学电子科学与工程学院,江苏南京210096)摘要:岩石岩性的识别与分类对于地质勘探至关重要,目前岩性识别多基于人工判别方法,需要一定的专业背景和丰富的判别经验,受限于环境、天气和人力的综合作用。
Obstacle Detection Robot Safety

Obstacle Detection Robot SafetyIn today's world, technology plays a significant role in ensuring safety and security in various aspects of our lives. One such area where technology has made a significant impact is in the development of obstacle detection robots. These robots are designed to navigate through challenging terrains and environments, identifying and avoiding obstacles in their path. While these robots are incredibly beneficial, there are also concerns regarding their safety, particularly when they are operating in close proximity to humans. In this response, we will explore the various requirements and considerations for ensuring the safety of obstacle detection robots.First and foremost, it is essential to consider the design and engineering of obstacle detection robots. These robots must be equipped with advanced sensors and detection systems that enable them to identify and react to obstacles in real-time. This includes the use of technologies such as LiDAR, radar, and computer vision to provide the robot with a comprehensive understanding of its surroundings. Additionally, the robot's navigation and control systems must be highly sophisticated to ensure that it can maneuver around obstacles effectively. By investing in the development of robust and reliable detection and navigation systems, we can significantly mitigate the risks associated with obstacle detection robots operating in shared spaces with humans.Furthermore, the implementation of safety protocols and standards is crucial for ensuring the safe operation of obstacle detection robots. This includes the establishment of clear guidelines for the deployment and use of these robots in various settings, such as industrial facilities, warehouses, and public spaces. Additionally, it is essential to conduct thorough risk assessments and safety evaluations to identify potential hazards and develop appropriate mitigation strategies. By adhering to stringent safety protocols and standards, we can minimize the likelihood of accidents or incidents involving obstacle detection robots and ensure the well-being of individuals in their vicinity.In addition to the technical and operational aspects of safety, it is also essential to consider the human factor in the deployment of obstacle detection robots. This includes providing comprehensive training and education for individuals who will be workingalongside these robots, ensuring that they understand how to interact with and coexist safely with the technology. Moreover, clear communication and signage should be implemented to alert individuals to the presence of obstacle detection robots in their environment, allowing them to take necessary precautions. By fostering a culture of awareness and understanding, we can promote a safe and harmonious relationship between humans and obstacle detection robots.Another critical consideration for ensuring the safety of obstacle detection robots is the ongoing monitoring and maintenance of these systems. Regular inspections, testing, and maintenance procedures should be established to identify and address any potential issues or malfunctions promptly. Additionally, the collection and analysis of data related to the performance and safety of obstacle detection robots can provide valuable insights for continuous improvement. By prioritizing the proactive maintenance and monitoring of these robots, we can minimize the likelihood of unforeseen safety concerns arising and ensure their reliable and safe operation.Moreover, it is essential to engage with relevant stakeholders, including regulatory bodies, industry experts, and the general public, to foster a collaborative approach to ensuring the safety of obstacle detection robots. This includes seeking input and feedback from various stakeholders to inform the development of safety standards and best practices. Additionally, transparent communication about the capabilities and limitations of obstacle detection robots is crucial for managing expectations and addressing any concerns or misconceptions. By engaging in open and constructive dialogue, we can work towards establishing a collective commitment to safety and security in the deployment of obstacle detection robots.In conclusion, the safety of obstacle detection robots is a multifaceted and complex issue that requires careful consideration of technical, operational, human, and collaborative aspects. By prioritizing the design and engineering of robust detection and navigation systems, implementing stringent safety protocols and standards, considering the human factor, monitoring and maintaining these systems, and engaging with relevant stakeholders, we can create a safe and secure environment for the deployment of obstacle detectionrobots. Ultimately, by addressing these requirements and considerations, we can harness the full potential of obstacle detection robots while ensuring the well-being and safety of individuals in their vicinity.。
Obstacle Detection and Tracking Robot Safety

Obstacle Detection and Tracking Robot Safety Obstacle detection and tracking are essential components of robot safety, especially in environments where humans and robots interact closely. The ability of a robot to detect obstacles and track them in real-time is crucial for preventing accidents and ensuring the safety of both humans and the robot itself. In this response, we will explore the importance of obstacle detection and tracking in robot safety from various perspectives, including the technological, ethical, and social implications.From a technological perspective, obstacle detection and tracking are challenging tasks that require advanced sensors and algorithms. Robots need to be equipped with sensors such as cameras, LiDAR, radar, and ultrasonic sensors to detect obstacles in their environment. These sensors provide the robot with the necessary information to perceive and understand its surroundings, allowing it to make informed decisions about how to navigate safely. Additionally, the robot must be able to track moving obstacles in real-time, which requires sophisticated algorithms to predict the future positions of the obstacles and plan its own movements accordingly.Furthermore, the accuracy and reliability of obstacle detection and tracking systems are critical for robot safety. Any errors or malfunctions in these systems could lead to potentially dangerous situations, especially in environments where robots are working alongside humans. Therefore, the development and testing of these systems must be rigorous to ensure that they perform effectively in real-world scenarios. This includes testing the systems in various environmental conditions and scenarios to account for potential challenges such as poor lighting, weather conditions, or dynamic obstacles.Ethically, the safety of humans should be the top priority when designing and implementing obstacle detection and tracking systems in robots. Robots are increasingly being used in collaborative settings with humans, such as in manufacturing facilities, warehouses, and healthcare settings. In these environments, it is crucial that robots can reliably detect and track obstacles to prevent collisions and accidents. Failure to do so could result in harm to human workers, which is unacceptable from an ethical standpoint.Therefore, the development of robot safety systems must prioritize the protection of human life and well-being.Moreover, the deployment of robots with robust obstacle detection and tracking capabilities can have significant social implications. For instance, in the healthcare industry, robots are being used to assist with patient care and medication delivery. In these settings, the ability of robots to navigate crowded and dynamic environments while avoiding obstacles is essential for ensuring the safety of patients and staff. By implementing reliable obstacle detection and tracking systems, robots can contribute to a safer and more efficient healthcare environment, ultimately improving the quality of care provided to patients.Additionally, the public perception of robots and their safety capabilities can be influenced by the effectiveness of their obstacle detection and tracking systems. If robots are perceived as being unsafe or prone to causing accidents, it could hinder their acceptance and adoption in various industries. On the other hand, if robots are seen as reliable and safe to work alongside, it could lead to greater integration of robots into workplaces and other settings. Therefore, the development of advanced obstacle detection and tracking technologies is not only crucial for the safety of humans and robots but also for shaping public attitudes towards robotics.In conclusion, obstacle detection and tracking are vital components of robot safety, with implications that span technological, ethical, and social considerations. The development of advanced sensors and algorithms for obstacle detection and tracking is essential for ensuring the safety of humans and robots in collaborative environments. Additionally, the ethical implications of robot safety cannot be overlooked, as the protection of human life should be the foremost priority. Lastly, the social implications of robot safety technologies can influence public perception and acceptance of robots in various industries. Therefore, the continued advancement of obstacle detection and tracking systems is crucial for the safe and effective integration of robots into our daily lives.。
基于状态机模型的构件健壮性测试

ISSN 1000-9825, CODEN RUXUEW E-mail: jos@Journal of Software, Vol.21, No.5, May 2010, pp.930−941 doi: 10.3724/SP.J.1001.2010.03544 Tel/Fax: +86-10-62562563© by Institute of Software, the Chinese Academy of Sciences. All rights reserved.∗基于状态机模型的构件健壮性测试雷斌1,2, 王林章1,2, 卜磊1,2, 李宣东1,2+1(南京大学计算机软件新技术国家重点实验室,江苏南京 210093)2(南京大学计算机科学与技术系,江苏南京 210093)Robustness Testing for Components Based on State Machine ModelLEI Bin1,2, WANG Lin-Zhang1,2, BU Lei1,2, LI Xuan-Dong1,2+1(State Key Laboratory for Novel Software Technology, Nanjing University, Nanjing 210093, China)2(Department of Computer Science and Technology, Nanjing University, Nanjing 210093, China)+ Corresponding author: E-mail: lxd@ Lei B, Wang LZ, Bu L, Li XD. Robustness testing for components based on state machine model. Journal ofSoftware, 2010,21(5):930−941. /1000-9825/3544.htmAbstract: This paper defines robustness based on a formal semantics of component system, and proposes a testingframework to detect robustness problems. The approach is implemented in a tool named RoTesCo (robustnesstesting for components). It traverses the state machine of the component under testing to generate paths, whichcover all the transitions. Firstly, the call sequences following the paths drive the component to different states.Secondly, it feeds method calls with invalid parameters or inopportune calls to the component. The test oracle isautomated by distinguishing different types of exceptions. RoTesCo is evaluated on a benchmark of real-worldcomponents from widely-used open source projects and it has produced encouraging results.Key words: software testing; component; robustness; state machine; invalid input摘要: 基于形式化的构件语义定义了健壮性,并提出一种基于状态机的构件健壮性测试方法.基于该方法实现了原型工具RoTesCo.首先遍历状态机生成一组覆盖所有转换的路径,基于这些路径的测试用例驱动构件发生状态转换;然后用无效输入和不当调用在构件的不同状态来测试其健壮性.通过区分测试中捕获异常的类别,自动报告健壮性错误.以通用的开源项目构件组成评测平台,实验数据显示,RoTesCo的测试效率比已有的算法表现得更优越.关键词: 软件测试;构件;健壮性;状态机;无效输入中图法分类号: TP311文献标识码: A基于构件(component)的软件开发用已有构件直接构建软件系统,以提高复用率,缩短软件开发周期.商业构件体系结构包括EJB(enterprise JavaBeans)[1]和COM(component object model)[2]等.构件开发给测试带来了新的挑战.构件封装特定功能,并通过接口(interface)提供服务.构件通过形如pre⇒post的契约(contract)来定义服务.∗Supported by the National Natural Science Foundation of China under Grant Nos.90818022, 60603036, 60721002 (国家自然科学基金); the National High-Tech Research and Development Plan of China under Grant No.2007AA010302 (国家高技术研究发展计划(863)); the Jiangsu Provincial Natural Science Foundation of China under Grant No.BK2007139 (江苏省自然科学基金)Received 2008-08-26; Accepted 2008-11-28雷斌等:基于状态机模型的构件健壮性测试931即,如果服务在前置条件pre为真时被调用,构件保证执行正常终止,并有终止时后置条件post为真[3].通常,构件不绑定特定的调用代码,因此在复用构件时,很难避免无效输入(invalid inputs),即违反前置条件的输入.脆弱的构件可能会因之失效;当构件能够有效处理无效输入时,我们称其为健壮(robust)的构件.以计算器中的除法功能为例:Method: divide (x: int, y: int): float Contract: y≠0⇒return=x/y.该契约定义,当y≠0时,方法divide返回结果x/y.功能性测试人员用满足契约的测试用例检查返回值是否符合预期,但他们往往不检查y=0时该构件的行为.忽略除零问题可能导致运行时刻抛出“浮点异常”,这种小错误在关键性任务系统却可能成为致命缺陷.健壮性测试者则用如{MAX_INT,−1,0,1}等特殊值检验构件是否能够有效处理.当然,设计者可以把Contract精化为Contract′:(y≠0⇒return=x/y)∧(y=0⇒return=0).这时,功能性测试覆盖了部分健壮性测试用例.但无效输入可能是全输入域的一个相当复杂的子集.而契约设计者应致力于描述构件的功能,要求他们考虑所有的输入情况并不现实.因此,专门的健壮性测试可以弥补功能性测试的不足,提高构件的可靠性.健壮性工具如Ballista[4]和Jcrasher[5]用预设的无效输入对应用程序接口(application programming interface,简称API)进行测试.设计者分别用UNIX Shell程序和Java类作了实例分析,并检测出相应的健壮性缺陷.它们的测试目标是API,并没有考虑软件所处的状态.Ballista提供不同的参数组合,重复测试一个方法;JCrasher初始化一个对象,调用某方法,在下一次调用之前恢复对象到初始值.然而,构件通常具有多个状态,某些软件缺陷只在特定状态下或者经过一定的状态转换后才会被激发.因此,要把这些工具直接应用到构件系统的健壮性测试则很难.我们针对构件的健壮性,尝试引入状态信息,以提高健壮性测试的效率.另一方面,学术界提出了许多基于有穷状态机(finite state machine,简称FSM)的测试方法,定义了多种覆盖准则和算法为单元测试和集成测试服务[6−9],但它们只针对功能性需求进行测试.我们将二者结合,提出一个基于状态机的构件健壮性测试框架,先用有效输入序列驱动构件到达不同状态,然后用无效的输入值或不当调用检验其健壮性.本文有如下贡献:• 基于构件语义模型定义了健壮性,该定义制导测试用例生成以及测试结果的分析.• 在健壮性测试中引入状态机模型,获得了比不考虑状态的健壮性测试算法更高的效率.本文第1节定义构件及其健壮性.第2节给出基于状态机的构件健壮性测试框架.第3节是原型工具和实例分析.第4节比较相关工作.最后作总结.1 构件及其健壮性1.1 构件构件是个抽象概念.在实现层次它可以是EJB[1]中的一个JavaBean类,也可以是面向服务架构中用WSDL 描述的一个服务[10].但下述观点是对构件的共识[11]:它可以被复用;并提供显式的功能规约.语义上,构件是一个包含提供接口(provided interfaces)和需求接口(required interfaces)的软件单元.本文测试框架的形式化基础是构件演算[3,12].定义1~定义6来自于构件演算.定义1(接口). 一个接口I是对一组域变量和一组方法的声明,I=(FDec,MDec),其中:• FDec是一组变量,每个变量形如x:T,x为变量名,T为类型;• MDec是一组方法型构(signature),形如m(x in, y out)声明了一种方法m,及其输入参数列表x和输出参数列表y,输入输出参数中每个参数为p:T,p为参数名,T为类型.如某环形缓冲(circular buffer)构件,其接口CB_IF包含如下定义:FDec={size:Integer};MDec={write(buf:char[],off:int,len:int):int;read(buf:char[],off:int,len:int);clear()},其中,size是一个整型变量;方法write有3个参数,off:int为整型,末尾的int表示返回值的类型.定义2(构件). 一个构件C是一个多元组,C=(I,Init,MDec,MCode,PriMDec,PriMCode,InMDec),其中:• I是一个接口,列出构件提供的方法列表;Init是初始化命令;• MCode将MDec中的公共方法映射为卫式命令(guarded command),PriMCode将PriMDec中的私有方法932 Journal of Software 软件学报 V ol.21, No.5, May 2010映射为卫式命令;• InMDec 是一组该构件依赖的服务.构件系统中服务的行为我们用设计(design)来描述.可以将设计与对象系统中的公共方法相对应.定义3(设计). 一个设计为D =(α,P ),其中:α为一组状态变量;P 为断言ok ∧p (x )⇒ok ′∧R ,写作p A R ,表示如果某 服务在满足前置条件p (x )时被调用,则调用会终止,而且终止时满足后置条件R .ok 和ok ′分别表示程序的正常启动和终止.基于前置条件,我们给出健壮性测试第1种测试用例,即当p 不真时,测试构件是否出错.我们用反应式设计(reactive design)来定义反应式程序的语义,引入状态变量布尔值wait .wait ′为真,代表一个程序处在挂起状态;否则,可以被调用.wait 和wait ′分别表示调用前和调用后程序是否挂起.定义4(反应式设计). 设计D 是反应式设计,当且仅当它是函数H 的不动点(fix point),即H (P )=P 时,有:H (P )=df (true A wait ′∧v =v ′) wait P ,其中,P b Q =df ((b ∧P )∨(¬b ∧Q )).定义5(卫式设计). 对卫式条件g 和设计D =(α,P ),我们用卫式设计g &D 来描述构件的反应式行为(α,P g (true A wait ′∧v ′=v )),即当卫式条件g 不真时,程序保持在挂起状态;否则,提供D 所定义的服务.卫式设计保证了环境调用方法和执行方法的同步,只在g 为真与wait 非真同时满足时才发生.基于卫式设计,我们给出健壮性测试第2种测试用例,即当g 不真时,测试构件是否出错.定义6(契约). 一个契约Ctr 是一个四元组Ctr =(I ,Init ,Spec ,Prot ),其中: • I 是一个接口,Init 是其初始条件;• Spec 用卫式设计(guarded design)描述其中每一种方法; • Prot 是接口使用者应遵循的交互协议.本文中,我们使用状态机(state machine)系统地描述构件的卫式设计.对处于某状态s 的构件来说,只有从s 出发的转换所代表的服务可用.对某契约Ctr ,可以定义它的状态机SM :定义7(状态机). 一个状态机SM =(S ,S 0,Σ,Guard ,Tran ),其中:• S 是一个状态的有穷集,S 0∈S 是初始状态,Guard 是卫式条件的有穷集合; • Σ是输入符号的有穷集,在构件的语境下代表构件接口的公共方法,即Σ⊆Ctr .I .MDec ;• Tran ⊂S ×Σ×Guard ×S 是状态转换的集合.图1是前文中环形缓冲例子的接口的状态机,其中:len 是方法read 和write 的参数;available 和capacity 为状态变量,分别表示构件有多少字符可读和有多少空间可写.Fig.1 State machine of the circular buffer component图1 环形缓冲的状态机write [len <capacity ]write [len <size ]InitEFMread [len <available ]ClearClearwrite [len==size ]read [len ==available ]write [len ==capacity ]read [len <available ]雷斌 等:基于状态机模型的构件健壮性测试 9331.2 健壮性在理想的构件系统中,调用方代码应满足前置条件并处理契约定义的错误.但因为构件的使用方和提供方之间的信息不对称,构件复用存在很大的不确定性.如果设计时没有考虑无效输入,构件有可能会失效.IEEE 将健壮性定义为:在无效输入或压力环境下,系统或者构件能正常工作的程度[13].本文的工作专注于无效输入.首先从构件契约角度定义恰当的调用.定义8(调用恰当). 对状态机SM 及其当前状态s ,s ∈SM .S ,一个方法m 调用恰当,当且仅当∃s ′∈SM .S , g ∈SM .Guard , g ∧((s ,g ,m ,s ′)∈SM .Tran ),即至少有1个s 的出边为g &m ,且g 为真.否则,m 为不当调用.可能导致健壮性错误的方法调用有:Iv 1:无效输入,是指方法调用带有违反前置条件的参数;Iv 2:不当调用(inopportune),是指方法调用在状态机模型上没有对应的状态转换.定义9(理想的构件). 构件C 为理想的,是指对任意方法m ∈C .MDec 及其相对应的接口设计g &(p A R ),m 实现的卫式命令g m →c m 满足();()()g pre post g pre v v wait g wait ∧⇒⎧⎫⎪⎪′′∧¬⇒=∧¬⎨⎬⎪⎪′¬⇒⎩⎭,即Iv 1不改变状态,Iv 2挂起构件.理想构件是构件开发的目标,但对于测试而言,这个标准过高.另外,构件状态变量不一定能够全部被测试脚本观察到.我们适度放宽标准,定义比较容易测试的属性,即健壮构件.定义10(健壮的构件). 构件C 为健壮的,是指对任意方法m ∈C .MDec 及其相对应的接口设计g &(p A R ),m 实现的卫式命令g m →c m 满足()()g pre ok g wait ok ′∧¬⇒⎧⎫⎨⎬′′¬⇒∨⎩⎭,即Iv 1和Iv 2可能改变系统的其他状态变量,但Iv 1使得构件正常终止,Iv 2或挂起构件或正常终止.两者都不会使构件返回错误信息.ok ′与wait ′都是形式化框架下的状态变量,其中,ok ′表示服务正常停止,wait ′表示服务被挂起.虽然停机和死锁问题都不可判定,但在具体测试平台(如Java),观察到的现象却可以确定ok ′与wait ′非真.文献[14]定义了状态 变量crash ,及健壮性构件接口的卫式设计为(α,((true A post ) pre ¬crash ) g ¬crash ),即Iv 1和Iv 2都无法使构件 crash 变量为真,但是crash 本身的语义需要测试人员根据具体平台自定义.相比之下,本文清晰地界定了无效输入和不当调用发生时健壮的组件应满足的属性,并为定义构件失效、实现测试结果的自动分析提供了依据.基于Java 异常处理,可以定义构件健壮性失效如下:定义11(构件健壮性失效). 在Java 平台上的构件系统发生健壮性失效,当且仅当如下异常被检获: (1) 未处理的异常(unhandled exception),抛出后将向栈逐级传递,直到有一层截取(catch)这个异常(如图2所示),构件及调用方都被挂起.某调用方在使用构件C ,调用方法m 1时,抛出异常e ,而After 中没有catch 语句匹配e ,便逐级往栈底传递,直到被其中一层的catch 语句截取.最底层Java 虚拟机将截取所有异常.如果不考虑finally 关键字,代码Before ;C .m 1();After 的执行语义与Before ;C .m 1()相同.如果C 的生命域在异常处理层之上,C 将被从栈中清除.即使在异常处理之后仍然可见,也无法保证C 的状态变量是否仍满足不变式(invariant),因此都有理由认为构件进入失效状态.在测试过程中应该发现这种情况,并通过调试予以消除,否则将为复用该构件的系统留下隐患.(2) 表示构件已经失效的程序员自定义的异常.通过定义和抛出显式的异常,程序员可以对构件失效状态进行防御式编程(defensive programming),将自定义的构件失效信息传递给调用方.因此,只要发现构件发生健壮性失效,其服务没有停机,而且没有死锁,就可以推断该构件不满足健壮性定义.本文根据这个结论,提出构件健壮性测试框架,检测健壮性失效.Before ;C .m 1();AfterUpper layer (V)Fig.2 Exception propagation图2 异常传递934 Journal of Software 软件学报 V ol.21, No.5, May 20102 测试框架图3显示了框架的工作流,其中,圆角节点为测试行为,方角节点为测试的输入和输出的工件(artifacts).右上方被测构件包含契约模型与实现;预设输入池需要测试人员手工设置,本文实现的原型工具提供了一个默认设置.本节给出测试框架的细节:首先,基于转换覆盖分析被测构件的状态机上的路径;根据路径生成有效输入序列以驱动构件到达不同的状态;无效输入调用或不当调用被添加到每个测试用例的最后,形成健壮性测试用例;对截获的异常进行分类,并报告健壮性问题.Fig.3 Activity diagram of the testing process图3 测试流程的活动图2.1 路径分析(path analysis )每种健壮性错误都有相应的触发条件,如JVM 只在如下情况抛出异常ClassCastException :形如(B )a ;的映射语句将对象a 显式转换为B 的实例,而a 实际上并不是B 的对象.如图4所示,构件C 有如下方法:init 赋一个新值到状态变量a ;evolve 把状态变量state 赋为真值;cast 返回a 的引用.图4右栏是一组测试构件C 的调用序列.分析显示,仅当出现下列子串时才会抛异常:第1个evolve 调用后面紧跟cast ,如子串4和子串6.无状态的API 测试并不能发现该错误,因为从初始状态调用任何单一的方法都不会触发这个缺陷.Fig.4 An example of robustness defect图4 健壮性缺陷示例因此,我们用满足一定覆盖度的测试用例集(test suite)来遍历不同的状态和转换,以提高发现健壮性错误的可能性.常见的覆盖准则包含全节点(all-nodes)、全转换(all-transitions)[15]、MC/DC(modified condition/decision coverage)[16]等.基于复杂度和覆盖能力的折衷,我们选择全转换覆盖,它保证了所有节点以及转换都被至少遍历1次.与其他覆盖准则如MC/DC 相比,全转换准则的分析算法复杂度较低.图5是基于广度优先的路径分析算法.算法的输出是一组路径,每条路径形如1122[][][]01...n n m g m g m g n Init S S S ρ=⎯⎯→⎯⎯⎯→⎯⎯⎯→⎯⎯⎯→,m x 是接口中的一个方法,g x 是状态转换之上的卫式条件.class B extends A … class C { A a =null ;boolean state =false ;void init (){if (!state ) a =new A ();else a =new B (); }public void evolve (){state =true;} public B cast (){if (!state ) return null ; else return (B )a ; }}Call Sequences:√ 1. cast ; √ 2. init ; √ 3. init ; cast ; × 4. evolve ; cast ; √ 5. evolve ; init ; cast ;× 6. init ; evolve ; cast ;×: Raise exception √: Pass the testPaths Contract (statemachine)Path analysisTestcase generation Test run & report generationComponent under testPaths Preset inputs Test report雷斌 等:基于状态机模型的构件健壮性测试 935Fig.5 Traverse algorithm for paths of all-transitions coverage图5 全转换准则(all-transitions)路径生成算法2.2 生成健壮性测试用例(robustness test case generation )以上述路径为基础生成健壮性测试用例,试图触发构件的失效.每个测试用例由如下调用序列组成:(1) 有效方法调用的一个有穷序列,驱动构件从初始状态Init 开始一系列状态转换; (2) 一个无效输入调用或不当调用,为第1.2节定义的Iv 1或Iv 2.本文实现了Java 构件的测试用例生成,为转换路径上的每个调用生成实际参数.我们用Octopus [17]的Java 元模型构造生成这些对象的代码片段.每个方法调用对应一个OJOperation 对象,而参数对应OJParameter 对象.它们可以直接翻译为JUnit 测试脚本.对有效方法调用的参数表,我们通过递归的方式来生成.给定参数表中的类型T ,调用函数generate (T ):(1) 如果T 是简单类型(primitive),返回T 的一个随机值;(2) 如果T 为复杂类型,有构造函数T (T 1,T 2,…,T n ),则返回T (generate (T 1),generate (T 2),…,generate (T n )). 在调用T 的构造函数的语句之前,插入generate (T x )所返回的语句.当类型T 具有多个构造函数时,随机选择一个.递归调用当遇到简单类型时停止.同时,为了提高代码生成的效率,我们限定递归深度小于深度值depth ,根据经验调整为5.当达到这个深度时,返回空引用(null).当某参数由方法调用的前置条件所限制时,随机生成器也相应调整随机区间.本文中,我们用OCL(objectconstraint language)来描述这些约束(约束有可能非常复杂.我们实现了较简单的OCL 约束的求解以解决实际问题,忽略过于复杂的约束),抽取UML 模型中的OCL 约束,获得满足约束的随机值.比如在文章开始部分的divide 例子中,规约为y ≠0,则随机生成一个在[MIN_INT ,0)和(0,MAX_INT ]区间的值.无效输入调用或不当调用在最后,测试构件的健壮程度.无效输入(Iv 1)与有效输入生成类似,区别在于用无效值替换一个参数.无效值包含违反前置条件的和根据经验常出现在失效测试用例中的参数:(1) 简单类型,为每个类型手工建立一个数据池.比如,String 类型为{null ,空串,超长串},整型为{MIN_INT ,−1,0,1,MAX_INT }等.以整形为例,通常选取极端值{MIN_INT ,0,MAX_INT }以及具有代表性的{1,−1}. (2) 受到OCL 约束的参数,在约束域外随机取值.比如,整型参数带有约束[0,MAX_INT ],取随机的负整数. (3) 复杂类型.取空引用(null)以及在第1次递归调用generate (T )时,使用空引用或者无效值作参数. 不当调用(Iv 2),对状态机SM 、某状态s 以及s 的出边集合out ,有:(1) 不在s 的任意一条出边上的方法集合,即{true &m |(m ∈SM .Σ)∧(∀g ∈SM .Guard ,g &m ∉out )}.(2) 在s 某出边上的方法,但所有卫式条件都不真.即{(¬∨(Φ(m )))&m |∃g ∈SM .Guard ,g &m ∈out },其中,Φ(m )={g |g &m ∈out },∨(Φ(m ))是所有调用m 的出边的卫式条件的析取(disjunction).2.3 执行和测试结果分析(execution and test analysis )测试生成的结果为JUnit 脚本,可以直接编译执行.下图是为CircularBuffer 构件生成的一个测试用例.其中,Input : State machine SM =(S ,S 0,Σ,Guard ,Tran ).Output : PathList , the set of generated path, each is a sequence of states and transitions.Intermediate data : vq , queue to store the current states, in whichvisited nodes are not stored again. BeginVq .add(S 0);While (vq is not empty){ //visit all nodesVertex sv =vq .head ;For (Transition t : sv ’s outgoing edges) { updateTransition (t );vq .add (t .target );}}//add remaining transitionsfor (SM ’s transitions: Transition t )If (t .from is reachable and t is not covered by PathList ){Select a random path p , p ’s last node is t .from ; new Path p ′=p .append (t .from ).append (t ); PathList .add (p ); } endFunction updateTransition (Transition t ){ If (t .from ==S 0)new Path p from init; else {Select a random path p , p ’s last node is t .from ; new Path p ′=p .append (t .from ).append (t ); }PathList .add (p ); }936 Journal of Software 软件学报 V ol.21, No.5, May 2010方法名中的1和2分别代表路径和测试用例的编号.第4行是有效调用,第6行提供了一个字符数组,而第7行为write (char [],int ,int )方法的第2个参数传入了整型的预设值−1,以测试构件处理无效参数的能力.Fig.6 An example of test script图6 测试脚本示例对执行的结果,基于定义11自动区分不同的异常,判断某测试用例是否触发健壮性缺陷.Java 中,Throwable 是所有异常(exception)和错误(error)的父类.异常的类层次如图7所示,可分为以下几类:(1) ng.Error:通常由虚拟机抛出,表示出现严重错误,不由程序员抛出或处理.(2) 未检异常(unchecked exceptions):RunTimeException 的子类,程序可以直接抛出未检异常,无须在函数声明中列出.未检异常可能表示程序契约被破坏.如String .substring (int begin , int end )中,当参数begin 为负值时,抛出ArrayIndexOutOfBoundsException.构件实现中的Bug 也可能抛出未检异常.文献[5]对未检异常作了更详细的分类,但本文基于类层次的测试用例生成,可以避免文献[5]中第2组异常情况的出现.因此,我们只要观察到未检异常,都认为构件出现失效.(3) 检验异常(checked exception):程序定义的非RunTimeException 的子类,反映运行结果或转移控制流.Fig.7 Class hierarchy of Java exceptions图7 Java 异常的类结构构件健壮性测试的基准基于对异常的分析.当测试工具获取到下述异常现象时,报出健壮性错误,表示该构件已经失效.其调用栈可以用来进行调试.相应测试用例可重现软件失效.(1) 未检异常:可能是构件内部的缺陷,也可能是未对传入参数作足够的检查.但两种情况都表明构件处理无效输入的能力有待改进.(2) 失效标志异常:检验异常还可以用来在调用方和构件之间传递执行信息.比如,POP3客户端构件可能会返回异常,表明网络连接错误.在对已有构件反向工程时,将它们与表示构件失效的异常相区别.我们在测试框架中提供扩展点,使测试人员可以设定特别的异常.1. @Test2. public void test _CircularBuffer_1_2() throws BufferException {3. /* Init →Empty */ 4. CircularBuffer CircularBuffer _2=new CircularBuffer (6); 5. /* Primitive preset: 1*/ 6. char [] char _array _1={‘J ’,‘t ’,‘H ’,‘g ’,‘k ’,‘f ’,‘b ’};7. CircularBuffer _2.write (char_array _1,−1,3); 8. } IlleglArgument-exceptionNullPointer-exception NullPointer-exceptionRuntime-exceptionException ErrorThrowable………雷斌 等:基于状态机模型的构件健壮性测试 9373 工具实现和实例分析3.1 工具概述和实验设计为了检验测试框架,我们实现了原型工具RoTesCo.它包含下面几个功能模块:路径分析(path analyzer),遍历状态机并生成一组路径;测试生成(test case generator),基于路径生成可执行的健壮性测试用例;异常分析模块(exception analyzer),区分测试结果,生成测试报告.图8是测试用例生成模块的软件产品类图.构件的核心是接口定义,描述构件提供的服务.Fig.8 Class diagram of the robustness testing tool图8 健壮性测试工具生成的类图RoTesCo 的实现基于一组软件库:模型分析模块接受基于EMF [18]标准的UML 文件,可以来源于rCOS 建模工具[3]、MagicDraw 或其他支持UML2标准的工具;OCL 分析模块基于Dresden [19]的类库进行扩充;利用Java 反射机制[20]对构件接口进行分析;并使用Octopus [17]的Java 元模型生成JUnit 测试用例.如表1,我们选取了一组开源软件的构件进行测试,见表1.其中,CircularBuffer 来自Kaffe Java 虚拟机[21];从Apache 通用库中选取了4个容器构件;从GNU ClassPath 项目中选择3个输入、输出流构件;最后是GNU 网络库中IMAP 和POP3协议客户端构件.除IMAP 和POP3的文档中包含非形式化的状态机之外,其他构件都通过阅读文档及代码注释,进行手工逆向工程获取状态机模型.Table 1 Benchmark 表1 实验平台Component Source States Transitions Methods LOC PathsCircularBuffer Kaffe 4 10 3~10 83 10 ArrayStack Apache Commons 3 9 8~10 71 9 BinaryHeap Apache Commons 4 19 7~19 188 19 FastArrayList Apache Commons 5 33 10~85 792 33 FastHashMap Apache Commons 5 21 7~47 422 19 BufferedInputStream GNU Classpath 4 16 8~10 122 14 BufferedWriter GNU Classpath 4 10 5~7 81 10 StringBufferInputStream GNU Classpath 3 7 5~6 47 7 IMAPConnection GNU inetlib 5 31 44~67 3 208 31 POP3Connection GNU inetlib 4 13 14~18 528 143.2 环形缓存(circular buffer )实例首先以环形缓冲构件(简称CB)为例说明测试效果.该构件提供一个缓存,用户可以写入(write)、读出(read)字符或者清空(clear).除Init 状态外,状态机还包含3个状态.该缓存的实现基于两个指针(整型数)in ,out 和一个字符数组.使用者只需提供写入、读出的参数,具体实现对用户透明.构件定义了如下检验异常:• BufferBrokenException,表示构件已经损坏;1…*1…* 1…*1…*11111111StateMachineMethodCallComponentRobTestCaseInterface PathValidCallInvalidCallImplementation938 Journal of Software软件学报 V ol.21, No.5, May 2010• BufferOverflowException,在调用方试图写入超过缓存容量的字符时抛出;• BufferUnderflowException,在试图读出超过实际存储的字符数时抛出.RoTesCo生成了10条路径以覆盖所有的转换,并生成每个状态上的无效输入.路径和无效方法调用组合生成了114个测试用例.运行后,发现了两种类型的程序失效:自定义的BufferBrokenException及未检异常NullPointerException和ArrayIndexOutOfBoundsException.经过调试我们发现,构件设计者乐观地假定传入的参数很理想.比如,从CircularBuffer.java的100行抛出NullPointerException的语句System.arraycopy(buffer,out,buf, off,maxreadlen)被调用前并没有对参数合理性的检查.BufferBrokenException揭示了构件的一个隐藏缺陷.调用栈帮助定位到第58行,返回缓存中实际存储的字符数available:当两个指针顺序颠倒,即in比out小时,返回一个大于缓存最大容量size的值.基于该方法的调用可能会覆盖掉已有数据,调用方不会得到错误信息.3.3 实验结果及评价为了与已有方法进行比较,我们实现了基于状态机的功能性测试算法(stat-based functional,简称SF)以及纯随机的健壮性测试算法(fuzzy testing,简称Fuz)[5].SF的测试用例是健壮性测试用例的第1部分,即有效调用序列.当路径足够长时,SF能够发现CB中指针倒置的错误.但因为只关注功能性问题,不能发现因为无效参数调用激发的错误.Fuz对无状态的对象用随机和预设的无效输入值进行测试.它测试CB发现了NullPointerException,但另一错误未被激发,因为所有的测试都基于无状态的空缓冲区.我们分别用这3种方法测试表1中的10个构件,结果见表2.一共4大列数据,包括所有测试用例、产生失效的测试用例、未检异常数和失效标志异常数.每列中分别有3小列分别为RoTesCo,SF和Fuz方法的实验结果,用R,S和F来标注,表示这项数据在RoTesCo,SF和Fuz方法中的值.如构件CB的第2列114,10和8分别表示3种算法生成的测试用例数为114,10和8个.第4大列和第5大列分别是测试脚本捕获的未见异常和检验异常的数目.其中,列A来标注所有(all)方法截取的异常数的总和.3种算法所检获CB构件的所有未检异常的数目为4.Table 2 Experimental results表2实验结果All test cases Failed test cases Unchecked exceptions Checked exceptions ComponentR S F R S F R S F A R S F A1121 42CircularBuffer 11410810738 42 692ArrayStack 4822922 50 100 119BinaryHeap 3301421004FastArrayList 1893381702581000000FastHashMap 352000876 04 1 0 2 2 3 0 0 314BufferedInputStream 1504152 5BufferedWriter 751146404 5StringBufferInputStream 49 7 628 04 2 0 2 3 0 0 0 0008 31 219021416 2 0 4 4 69 4 2 69 IMAPConnection 1POP3Connection 152 13 18104680 0 00 21 2 4 21 图9和图10更直观地显示了3种不同方法在健壮性测试平台上的表现.嵌菱形线、嵌三角形线和嵌圆形线分别代表RoTesCo,SF和Fuz的数据.横轴为被测构件,纵轴为某方法所测得失效占总失效数的比例,比例越高,说明检测能力越强.最高为1,即已发现失效都被覆盖;最差为0,即其他方法检测到失效,该方法未发现.表2的数据存在3种方法均未测出失效的情况,在图中,我们以中值1/2来代替无意义的0/0,表示对该方法的能力不予置评.从检验健壮性角度来看,RoTesCo在激发健壮性缺陷、抛出未检和检验异常的能力明显优于SF和Fuz.SF方法因为侧重于功能性测试,对健壮性的检验能力最弱.Fuz方法处于两者之间.在有些情况下,如图9中的构件BufferedInputStream和IMAPConnection,Fuz检验到最多的问题.但与RoTesCo相比,Fuz很不稳定.综合而言, RoTesCo能够高效且稳定地检验构件健壮性.前文对测试数据作统计分析,但并未对构件的健壮程度作定量分析.第 1.2节的定义中只区分构件健壮与。
机器人路径规划(包括行人检测及动态避障总结)(长期更新)

机器⼈路径规划(包括⾏⼈检测及动态避障总结)(长期更新)本篇给予实际项⽬,作⼀个总结归纳部分参考⾃ 1.wiki主要⽤到的包:leg_detector输⼊:takes s as input and uses a machine-learning-trained classifier to detect groups of laser readings as possible legs输出: publish s for the individual legs, and it can also attempt to pair the legs together and publish their average as an estimate of where the center of one person is as a. 订阅话题:scan ()The laser scan to detect from.注意:在unseeded模式下,即只有⼀个激光传感器模式下,⽆其他检测源可以修正leg_detector检测到⼈腿的对与错,因此可能存在⼤量误检,但适⽤场景⼴people_tracker_filter ()PositionMeasurements to use as the seeds (see above)在seeded模式下,有其他传感器源,可提⾼⾏⼈检测准确性。
⼀般来说,可加⼊摄像头,提供的message为发布话题:leg_tracker_measurements ()Estimates of where legs arepeople_tracker_measurements ()Estimates of where people arevisualization_marker ()Markers where legs and people are订阅话题:people_tracker_measurements ()Positions of people发布话题:/people ()Positions and velocities of people/visualization_marker ()Markers2. sending two types of sensor streams, sensor_msgs/LaserScan messages and sensor_msgs/PointCloud messages over ROS3.构造函数ObstacleLayer() { costmap_ = NULL;}// this is the unsigned char* member of parent class Costmap2D.这⾥指明了costmap_指针保存了Obstacle这⼀层的地图数据对于ObstacleLater,⾸先分析其需要实现的Layer层的⽅法:virtual void onInitialize();virtual void updateBounds(double robot_x, double robot_y, double robot_yaw, double* min_x, double* min_y,double* max_x, double* max_y);virtual void updateCosts(costmap_2d::Costmap2D& master_grid, int min_i, int min_j, int max_i, int max_j);virtual void activate();virtual void deactivate();virtual void reset();函数onInitialize();:⾸先获取参数设定的值,然后新建observation buffer:// create an observation bufferobservation_buffers_.push_back(boost::shared_ptr < ObservationBuffer>(new ObservationBuffer(topic, observation_keep_time, expected_update_rate, min_obstacle_height,max_obstacle_height, obstacle_range, raytrace_range, *tf_, global_frame_,sensor_frame, transform_tolerance))); // check if we'll add this buffer to our marking observation buffersif (marking)marking_buffers_.push_back(observation_buffers_.back());// check if we'll also add this buffer to our clearing observation buffersif (clearing)clearing_buffers_.push_back(observation_buffers_.back());然后分别对不同的sensor类型如LaserScan PointCloud PointCloud2,注册不同的回调函数。