概率论毕业论文外文翻译
概率论与数理统计英文版总结
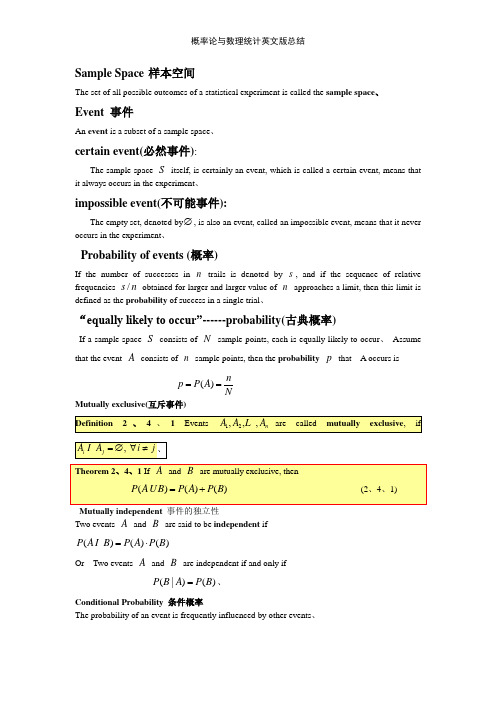
Sample Space样本空间The set of all possible outcomes of a statistical experiment is called the sample space、Event 事件An event is a subset of a sample space、certain event(必然事件):The sample space S itself, is certainly an event, which is called a certain event, means that it always occurs in the experiment、impossible event(不可能事件):The empty set, denoted by∅, is also an event, called an impossible event, means that it never occurs in the experiment、Probability of events (概率)If the number of successes in n trails is denoted by s, and if the sequence of relative frequencies /s n obtained for larger and larger value of n approaches a limit, then this limit is defined as the probability of success in a single trial、“equally likely to occur”------probability(古典概率)If a sample space S consists of N sample points, each is equally likely to occur、Assumethat the event A consists of n sample points, then the probability p that A occurs is()np P AN==Mutually exclusive(互斥事件)Mutually independent 事件的独立性Two events A and B are said to be independent if()()()P A B P A P B=⋅IOr Two events A and B are independent if and only if(|)()P B A P B=、Conditional Probability 条件概率The probability of an event is frequently influenced by other events、If 12k ,,,A A A L are events, then12k 121312121()()(|)(|)(|)k k P A A A P A P A A P A A A P A A A A -=⋅⋅I I L I L I I L I If the events 12k ,,,A A A L are independent, then for any subset 12{,,,}{1,2,,}m i i i k ⊂L L ,1212()()()()m mP A A A P A P A P A i i i i i i =I I L L (全概率公式 total probability)()(|)()i i P B A P B A P A =IUsing the theorem of total probability, we have1()(|)(|)()(|)i i i k j jj P B P A B P B A P B P A B ==∑ 1,2,,i k =L1、 random variable definition2、 Distribution functionNote The distribution function ()F X is defined on real numbers, not on sample space 、3、 PropertiesThe distribution function ()F x of a random variable X has the following properties:3、2 Discrete Random Variables 离散型随机变量geometric distribution (几何分布)Binomial distribution(二项分布)poisson distribution(泊松分布)Expectation (mean) 数学期望2.Variance 方差standard deviation (标准差)probability density function概率密度函数5、 Mean(均值)6、 variance 方差、4、2 Uniform Distribution 均匀分布The uniform distribution, with the parameters a a nd b , has probability density function1 for ,()0 elsewhere,a xb f x b a ⎧<<⎪=-⎨⎪⎩4、5 Exponential Distribution 指数分布4、3 Normal Distribution 正态分布1、Definition4、4 Normal Approximation to the Binomial Distribution(二项分布)4、7 Chebyshev’s Theorem(切比雪夫定理)Joint probability distribution(联合分布)In the study of probability, given at least two random variables X, Y, 、、、, that are defined on a probability space, the joint probability distribution for X, Y, 、、、is a probability distribution that gives the probability that each of X, Y, 、、、falls in any particular range or discrete set of values specified for that variable、5.2C onditional distribution 条件分布Consistent with the definition of conditional probability of events when A is the event X=x and B is the event Y=y, the conditional probability distribution of X given Y=y is defined as(,)(|)()X Y p x y p x y p y = for all x provided ()0Y p y ≠、 5.3 S tatistical independent 随机变量的独立性interdependence of X and Y we want to examine 、number of random phenomenon 、 And the average of large number of random variables are also steadiness 、 These results are the law of large numbers 、population (总体)sample (样本、子样)中位数It is customary to write )(X E as X μ and )(X D as 2X σ、Here, ()E X μ= is called the expectation of the mean 、均值的期望 n X σσ= is called the standard error of the mean 、 均值的标准差 7、1 Point Estimate 点估计Unbiased estimator(无偏估计量)minimum variance unbiased estimator(最小方差无偏估计量)3、Method of Moments 矩估计的方法confidence interval----- 置信区间lower confidence limits-----置信下限upper confidence limits----- 置信上限degree of confidence----置信度2.极大似然函数likelihood function显著性水平Two Types of Errors。
概率论及数理统计中英辞汇对照
absolute value 绝对值acceptable region 同意域additivity 可加性adjusted 调整的alternative hypothesis 对立假设analysis of covariance 协方差分析analysis of variance 方差分析arithmetic mean 算术平均值association 相关性assumption 假设assumption checking 假设查验availability 有效度average 均值Bbalanced 平稳的band 带宽bar chart 条形图beta-distribution 贝塔散布between groups 组间的bias 偏倚binomial distribution 二项散布binomial test 二项查验Ccalculate 计算case 个案category 类别center of gravity 重心central tendency 中心趋势chi-square distribution 卡方散布chi-square test 卡方查验classify 分类cluster analysis 聚类分析coefficient 系数coefficient of correlation 相关系数collinearity 共线性column 列compare 比较comparison 对照components 组成,分量compound 复合的confidence interval 置信区间consistency 一致性constant 常数continuous variable 持续变量control charts 操纵图correlation 相关covariance 协方差covariance matrix 协方差矩阵critical point 临界点critical value 临界值crosstab 列联表cubic 三次的,立方的cubic term 三次项cumulative distribution function 累加散布函数curve estimation 曲线估量Ddata 数据default 默许的definition 概念deleted residual 剔除残差density function 密度函数dependent variable 因变量description 描述design of experiment 实验设计deviations 不同df.(degree of freedom) 自由度diagnostic 诊断dimension 维discrete variable 离散变量discriminant function 判别函数discriminatory analysis 判别分析distance 距离distribution 散布D-optimal design D-优化设计Eeaqual 相等effects of interaction 交互效应[Last edit by happyjyl]efficiency 有效性eigenvalue 特点值equal size 等含量equation 方程error 误差estimate 估量estimation of parameters 参数估量estimations 估量量evaluate 衡量exact value 精准值expectation 期望expected value 期望值exponential 指数的exponential distributon 指数散布extreme value 极值Ffactor 因素,因子factor analysis 因子分析factor score 因子得分factorial designs 析因设计factorial experiment 析因实验fit 拟合fitted line 拟合线fitted value 拟合值fixed model 固定模型fixed variable 固定变量fractional factorial design 部份析因设计frequency 频数F-test F查验full factorial design 完全析因设计function 函数Ggamma distribution 伽玛散布geometric mean 几何均值group 组Hharmomic mean 调和均值heterogeneity 不齐性histogram 直方图homogeneity 齐性homogeneity of variance 方差齐性hypothesis 假设hypothesis test 假设查验Iindependence 独立independent variable 自变量independent-samples 独立样本index 指数index of correlation 相关指数interaction 交互作用interclass correlation 组内相关interval estimate 区间估量intraclass correlation 组间相关inverse 倒数的iterate 迭代Kkernal 核Kolmogorov-Smirnov test柯尔莫哥洛夫-斯米诺夫查验kurtosis 峰度Llarge sample problem 大样本问题layer 层least-significant difference 最小显著差数least-square estimation 最小二乘估量least-square method 最小二乘法level 水平level of significance 显著性水平leverage value 中心化杠杆值life 寿命life test 寿命实验likelihood function 似然函数likelihood ratio test 似然比查验linear 线性的linear estimator 线性估量linear model 线性模型linear regression 线性回归linear relation 线性关系linear term 线性项logarithmic 对数的logarithms 对数logistic 逻辑的lost function 损失函数Mmain effect 主效应matrix 矩阵maximum 最大值maximum likelihood estimation 极大似然估量mean squared deviation(MSD) 均方差mean sum of square 均方和measure 衡量media 中位数M-estimator M估量minimum 最小值missing values 缺失值mixed model 混合模型mode 众数model 模型Monte Carle method 蒙特卡罗法moving average 移动平均值multicollinearity 多元共线性multiple comparison 多重比较multiple correlation 多重相关multiple correlation coefficient 复相关系数multiple correlation coefficient 多元相关系数multiple regression analysis 多元回归分析multiple regression equation 多元回归方程multiple response 多响应multivariate analysis 多元分析Nnegative relationship 负相关nonadditively 不可加性nonlinear 非线性nonlinear regression 非线性回归noparametric tests 非参数查验normal distribution 正态散布null hypothesis 零假设number of cases 个案数Oone-sample 单样本one-tailed test 单侧查验one-way ANOVA 单向方差分析one-way classification 单向分类optimal 优化的optimum allocation 最优配制order 排序order statistics 顺序统计量origin 原点orthogonal 正交的outliers 异样值Ppaired observations 成对观测数据paired-sample 成对样本parameter 参数parameter estimation 参数估量partial correlation 偏相关partial correlation coefficient 偏相关系数partial regression coefficient 偏回归系数percent 百分数percentiles 百分位数pie chart 饼图point estimate 点估量poisson distribution 泊松散布polynomial curve 多项式曲线polynomial regression 多项式回归polynomials 多项式positive relationship 正相关power 幂P-P plot P-P概率图predict 预测predicted value 预测值prediction intervals 预测区间principal component analysis 主成份分析proability 概率probability density function 概率密度函数probit analysis 概率分析proportion 比例Qqadratic 二次的Q-Q plot Q-Q概率图quadratic term 二次项quality control 质量操纵quantitative 数量的,气宇的quartiles 四分位数Rrandom 随机的random number 随机数random number 随机数random sampling 随机取样random seed 随机数种子random variable 随机变量randomization 随机化range 极差rank 秩rank correlation 秩相关rank statistic 秩统计量regression analysis 回归分析regression coefficient 回归系数regression line 回归线reject 拒绝rejection region 拒绝域relationship 关系reliability 靠得住性repeated 重复的report 报告,报表residual 残差residual sum of squares 剩余平方和response 响应risk function 风险函数robustness 稳健性root mean square 标准差row 行run 游程run test 游程查验Ssample 样本sample size 样本容量sample space 样本空间sampling 取样sampling inspection 抽样查验scatter chart 散点图S-curve S形曲线separately 单独地sets 集合sign test 符号查验significance 显著性significance level 显著性水平significance testing 显著性查验significant 显著的,有效的significant digits 有效数字skewed distribution 偏态散布skewness 偏度small sample problem 小样本问题smooth 滑腻sort 排序soruces of variation 方差来源space 空间spread 扩展square 平方standard deviation 标准离差standard error of mean 均值的标准误差standardization 标准化standardize 标准化statistic 统计量statistical quality control 统计质量操纵std. residual 标准残差stepwise regression analysis 慢慢回归stimulus 刺激strong assumption 强假设stud. deleted residual 学生化剔除残差stud. residual 学生化残差subsamples 次级样本sufficient statistic 充分统计量sum 和sum of squares 平方和summary 归纳,综述Ttable 表t-distribution t散布test 查验test criterion 查验判据test for linearity 线性查验test of goodness of fit 拟合优度查验test of homogeneity 齐性查验test of independence 独立性查验test rules 查验法那么test statistics 查验统计量testing function 查验函数time series 时刻序列tolerance limits 允许限total 总共,和transformation 转换treatment 处置trimmed mean 截尾均值true value 真值t-test t查验two-tailed test 双侧查验Uunbalanced 不平稳的unbiased estimation 无偏估量unbiasedness 无偏性uniform distribution 均匀散布Vvalue of estimator 估量值variable 变量variance 方差variance components 方差分量variance ratio 方差比various 不同的vector 向量Wweight 加权,权重weighted average 加权平均值within groups 组内的ZZ score Z分数最优化方式辞汇英汉对照表Aactive constraint 活动约束active set method 活动集法analytic gradient 解析梯度approximate 近似arbitrary 强制性的argument 变量attainment factor 达到因子Bbandwidth 带宽be equivalent to 等价于best-fit 最正确拟合bound 边界Ccoefficient 系数complex-value 复数值component 分量constant 常数constrained 有约束的constraint 约束constraint function 约束函数continuous 持续的converge 收敛cubic polynomial interpolation method三次多项式插值法curve-fitting 曲线拟合Ddata-fitting 数据拟合default 默许的,默许的define 概念diagonal 对角的direct search method 直接搜索法direction of search 搜索方向discontinuous 不持续Eeigenvalue 特点值empty matrix 空矩阵equality 等式exceeded 溢出的Ffeasible 可行的feasible solution 可行解finite-difference 有限差分first-order 一阶GGauss-Newton method 高斯-牛顿法goal attainment problem 目标达到问题gradient 梯度gradient method 梯度法Hhandle 句柄Hessian matrix 海色矩阵Iindependent variables 独立变量inequality 不等式infeasibility 不可行性infeasible 不可行的initial feasible solution 初始可行解initialize 初始化inverse 逆invoke 激活iteration 迭代iteration 迭代JJacobian 雅可比矩阵LLagrange multiplier 拉格朗日乘子large-scale 大型的least square 最小二乘least squares sense 最小二乘意义上的Levenberg-Marquardt method列文伯格-马夸尔特法line search 一维搜索linear 线性的linear equality constraints 线性等式约束linear programming problem 线性计划问题local solution 局部解Mmedium-scale 中型的minimize 最小化mixed quadratic and cubic polynomial interpolation and extrapolation method混合二次、三次多项式内插、外插法multiobjective 多目标的Nnonlinear 非线性的norm 范数Oobjective function 目标函数observed data 测量数据optimization routine 优化进程optimize 优化optimizer 求解器over-determined system 超定系统Pparameter 参数partial derivatives 偏导数polynomial interpolation method 多项式插值法Qquadratic 二次的quadratic interpolation method 二次内插法quadratic programming 二次计划Rreal-value 实数值residuals 残差robust 稳健的robustness 稳健性,鲁棒性Sscalar 标量semi-infinitely problem 半无穷问题Sequential Quadratic Programming method序列二次计划法simplex search method 单纯形法solution 解sparse matrix 稀疏矩阵sparsity pattern 稀疏模式sparsity structure 稀疏结构starting point 初始点step length 步长subspace trust region method 子空间置信域法sum-of-squares 平方和symmetric matrix 对称矩阵Ttermination message 终止信息termination tolerance 终止容限the exit condition 退出条件the method of steepest descent 最速下降法transpose 转置Uunconstrained 无约束的under-determined system 负定系统Vvariable 变量vector 矢量Wweighting matrix 加权矩阵样条辞汇英汉对照表Aapproximation 逼近array 数组a spline in b-form/b-spline b样条a spline of polynomial piece/ppform spline 分段多项式样条Bbivariate spline function 二元样条函数break/breaks 断点Ccoefficient/coefficients 系数cubic interpolation 三次插值/三次内插cubic polynomial 三次多项式cubic smoothing spline 三次滑腻样条cubic spline 三次样条cubic spline interpolation三次样条插值/三次样条内插curve 曲线Ddegree of freedom 自由度dimension 维数Eend conditions 约束条件Iinput argument 输入参数interpolation 插值/内插interval 取值区间Kknot/knots 节点Lleast-squares approximation 最小二乘拟合Mmultiplicity 重次multivariate function 多元函数Ooptional argument 可选参数order 阶次output argument 输出参数Ppoint/points 数据点Rrational spline 有理样条rounding error 舍入误差(相对误差)Sscalar 标量sequence 数列(数组)spline 样条spline approximation 样条逼近/样条拟合spline function 样条函数spline curve 样条曲线spline interpolation 样条插值/样条内插spline surface 样条曲面smoothing spline 滑腻样条T tolerance 许诺精度Uunivariate function 一元函数Vvector 向量Wweight/weights 权重4 偏微分方程数值解辞汇英汉对照表Aabsolute error 绝对误差absolute tolerance 绝对容限adaptive mesh 适应性网格Bboundary condition 边界条件Ccontour plot 等值线图converge 收敛coordinate 坐标系Ddecomposed 分解的decomposed geometry matrix 分解几何矩阵diagonal matrix 对角矩阵Dirichlet boundary conditions Dirichlet边界条件Eeigenvalue 特点值elliptic 椭圆形的error estimate 误差估量exact solution 精准解Ggeneralized Neumann boundary condition推行的Neumann边界条件geometry 几何形状geometry description matrix 几何描述矩阵geometry matrix 几何矩阵graphical user interface(GUI)图形用户界面Hhyperbolic 双曲线的Iinitial mesh 初始网格Jjiggle 微调LLagrange multipliers 拉格朗日乘子Laplace equation 拉普拉斯方程linear interpolation 线性插值loop 循环Mmachine precision 机械精度mixed boundary condition 混合边界条件NNeuman boundary condition Neuman 边界条件node point 节点nonlinear solver 非线性求解器normal vector 法向量PParabolic 抛物线型的partial differential equation 偏微分方程plane strain 平面应变plane stress 平面应力Poisson's equation 泊松方程polygon 多边形positive definite 正定Qquality 质量Rrefined triangular mesh 加密的三角形网格relative tolerance 相对容限relative tolerance 相对容限residual 残差residual norm 残差范数Ssingular 奇异的。
普林斯顿的概率论英文版
普林斯顿的概率论英文版I believe that the English version of the probability theory book by Princeton University Press is a valuable resource for students and researchers in the field of mathematics and statistics. This book provides a comprehensive and rigorous treatment of probability theory, covering key concepts and techniques essential for understanding and analyzing probabilistic phenomena.我相信普林斯顿大学出版社的概率论英文版是数学和统计学领域的学生和研究人员的宝贵资源。
这本书全面而严谨地讨论了概率论的关键概念和技术,涵盖了理解和分析概率现象所必不可少的内容。
The book starts with an introduction to the fundamental principles of probability, such as sample spaces, events, and probability measures. It then moves on to discuss random variables, probability distributions, and mathematical expectation, providing a solid foundation for more advanced topics in probability theory.这本书首先介绍了概率的基本原理,如样本空间、事件和概率测度。
数学与应用数学专业概率论的发展大学毕业论文英文文献翻译及原文
毕业设计(论文)外文文献翻译文献、资料中文题目:概率论的发展文献、资料英文题目:The development of probabilitytheory文献、资料来源:文献、资料发表(出版)日期:院(部):专业:数学与应用数学班级:姓名:学号:指导教师:翻译日期: 2017.02.14毕业论文(设计)英文文献翻译外文文献The development of probability theorySummaryThis paper consist therefore of two parts: The first is concerned with the development of the calyculus of chance before Bernoulli in order to provide a background for the achievement of Ja kob Bernoulli and will emphasize especially the role of Leibniz. The second part deals with the relationship between Leibniz add Bernoulli an d with Bernoulli himself, particularly with the question how it came about that he introduced probability into mathematics.First some preliminary remarks:Ja kob Bernoulli is of special interest to me, because he is the founder of a mathematical theory of probability. That is to say that it is mainly due to him that a concept of probability was introduced into a field of mathematics.TextMathematics could call the calculus of games of chance before Bernoulli. This has another consequence that makes up for a whole programme: The mathematical tools of this calculus should be applied in the whole realm of areas which used a concept of probability. In other words,the Bernoullian probability theory should be applied not only togames of chance and mortality questions but also to fields like jurisprudence, medicine, etc.My paper consists therefore of two parts: The first is concerned with the development of the calculus of chance before Bernoulli in order to provide a background or the achievements of Ja kob Bernoulli and will emphasize especially the role of Leibniz. The second part deals with the relationship between Leibniz and Bernoulli and Bernoulli himself, particularly with the question how it came about that he introduced probability into mathematics.Whenever one asks why something like a calculus of probabilities arose in the 17th century, one already assumes several things: for instance that before the 17th century it did not exist, and that only then and not later did such a calculus emerge. If one examines the quite impressive literature on the history of probability, one finds that it is by no means a foregone conclusion that there was no calculus of probabilities before the 17th century. Even if one disregards numerous references to qualitative and quantitative inquiries in antiquity and among the Arabs and the Jews, which, rather freely interpreted, seem to suggest the application of a kind of probability-concept or the use of statistical methods, it is nevertheless certain that by the end of the 15th century an attempt was being interpreted.People made in some arithmetic works to solve problems of games of chance by computation. But since similar problems form the major part of the early writings on probability in the 17th century, one may be induced to ask why then a calculus of probabilities did not emerge in the late 15th century. One could say many things: For example, that these early game calculations in fact represent one branch of a development which ultimately resulted in a calculus of probabilities. Then why shouldn't one place the origin of the calculus of probabilities before the 17th after all? Quite simply because a suitable concept of probability was missing from the earlier computations. Once the calculus of probabilities had beendeveloped, it became obvious that the older studies of games of chance formed a part of the new discipline.We need not consider the argument that practically all the solutions of problems of games of chance proposed in the 15th and 16th centuries could have been viewed as inexact, and thus at best as approximate, by Fermat in the middle of the 17th century, that is, before the emergence of a calculus of probabilities.The assertion that no concept of probability was applied to games of chance up to the middle of the 17th century can mean either that there existed no concept of probability (or none suitable), or that though such a concept existed it was not applied to games of chance. I consider the latter to be correct, and in this I differ from Hacking, who argues that an appropriate concept of probability was first devised in the 17th century.I should like to mention that Hacking(Mathematician)and I agree ona number of points. For instance, on the significance of the legal tradition and of the practical ("-low") sciences: Hacking makes such factors responsible for the emergence of a new concept of probability, suited to a game calculus, while perceive them as bringing about the transfer and quantification of a pre-existent probability-concept.译文概率论的发展作者;龙腾施耐德摘要本文由两部分构成:首先是提供了一个为有关与发展雅各布 - 前伯努利相关背景,雅各布对数学做出了不可磨灭的贡献。
概率论与数理统计英文版总结
概率论与数理统计英文版总结Probability theory and mathematical statistics are essential branches of mathematics that deal with the study and analysis of uncertain events and data. These two fields are closely related and provide the foundation for making informed decisions and drawing conclusions based on probability and statistical analysis. In this summary, we will explain the key concepts and principles of probability theory and mathematical statistics.Probability theory is concerned with the study of random events and their likelihood of occurrence. It is used toquantify uncertainty and provide a framework for making predictions and decisions in various disciplines, including natural sciences, social sciences, finance, and engineering. The fundamental concept in probability theory is the probability of an event, which is a value between 0 and 1 that represents the likelihood of the event occurring.Probability theory is built upon three main axioms:2. The probability of the entire sample space is always 1.。
概率论英文专业词汇

概率论英文专业词汇概率论与数理统计词汇英汉对照表Aabsolute value 绝对值accept 接受acceptable region 接受域additivity 可加性adjusted 调整的alternative hypothesis 对立假设analysis 分析analysis of covariance 协方差分析analysis of variance 方差分析arithmetic mean 算术平均值association 相关性assumption 假设assumption checking 假设检验availability 有效度average 均值Bbalanced 平衡的band 带宽bar chart 条形图beta-distribution 贝塔分布between groups 组间的bias 偏倚binomial distribution 二项分布binomial test 二项检验Ccalculate 计算case 个案category 类别center of gravity 重心definition 定义deleted residual 剔除残差density function 密度函数dependent variable 因变量description 描述design of experiment 试验设计deviations 差异df.(degree of freedom) 自由度diagnostic 诊断dimension 维discrete variable 离散变量discriminant function 判别函数discriminatory analysis 判别分析distance 距离distribution 分布D-optimal design D-优化设计Eeaqual 相等effects of interaction 交互效应efficiency 有效性eigenvalue 特征值equal size 等含量equation 方程error 误差estimate 估计estimation of parameters 参数估计estimations 估计量evaluate 衡量exact value 精确值expectation 期望expected value 期望值exponential 指数的exponential distributon 指数分布extreme value 极值Ffactor 因素,因子factor analysis 因子分析factor score 因子得分factorial designs 析因设计factorial experiment 析因试验fit 拟合fitted line 拟合线fitted value 拟合值fixed model 固定模型fixed variable 固定变量fractional factorial design 部分析因设计frequency 频数F-test F检验full factorial design 完全析因设计function 函数Ggamma distribution 伽玛分布geometric mean 几何均值group 组Hharmomic mean 调和均值heterogeneity 不齐性histogram 直方图homogeneity 齐性homogeneity of variance 方差齐性hypothesis 假设hypothesis test 假设检验Iindependence 独立independent variable 自变量independent-samples 独立样本index 指数index of correlation 相关指数interaction 交互作用interclass correlation 组内相关interval estimate 区间估计intraclass correlation 组间相关inverse 倒数的iterate 迭代K kernal 核Kolmogorov-Smirnov test柯尔莫哥洛夫-斯米诺夫检验kurtosis 峰度Llarge sample problem 大样本问题layer 层least-significant difference 最小显著差数least-square estimation 最小二乘估计least-square method 最小二乘法level 水平level of significance 显著性水平leverage value 中心化杠杆值life 寿命life test 寿命试验likelihood function 似然函数likelihood ratio test 似然比检验linear 线性的linear estimator 线性估计linear model 线性模型linear regression 线性回归linear relation 线性关系linear term 线性项logarithmic 对数的logarithms 对数logistic 逻辑的lost function 损失函数Mmain effect 主效应matrix 矩阵maximum 最大值maximum likelihood estimation 极大似然估计mean squared deviation(MSD) 均方差mean sum of square 均方和measure 衡量media 中位数M-estimator M估计minimum 最小值missing values 缺失值mixed model 混合模型mode 众数model 模型Monte Carle method蒙特卡罗法moving average 移动平均值multicollinearity 多元共线性multiple comparison 多重比较multiple correlation 多重相关multiple correlation coefficient 复相关系数multiple correlation coefficient 多元相关系数multiple regression analysis 多元回归分析multiple regression equation 多元回归方程multiple response 多响应multivariate analysis 多元分析Nnegative relationship 负相关nonadditively 不可加性nonlinear 非线性nonlinear regression 非线性回归noparametric tests 非参数检验normal distribution 正态分布null hypothesis 零假设number of cases 个案数Oone-sample 单样本one-tailed test 单侧检验one-way ANOV A 单向方差分析one-way classification 单向分类optimal 优化的optimum allocation 最优配制order 排序order statistics 次序统计量origin 原点orthogonal 正交的outliers 异常值Ppaired observations 成对观测数据paired-sample 成对样本parameter 参数parameter estimation 参数估计partial correlation 偏相关partial correlation coefficient 偏相关系数partial regression coefficient 偏回归系数percent 百分数percentiles 百分位数pie chart 饼图point estimate 点估计poisson distribution 泊松分布polynomial curve 多项式曲线polynomial regression 多项式回归polynomials 多项式positive relationship 正相关power 幂P-P plot P-P概率图predict 预测predicted value 预测值prediction intervals 预测区间principal component analysis 主成分分析proability 概率probability density function 概率密度函数probit analysis 概率分析proportion 比例Qqadratic 二次的Q-Q plot Q-Q概率图quadratic term 二次项quality control 质量控制quantitative 数量的,度量的quartiles 四分位数Rrandom 随机的random number 随机数random number 随机数random sampling 随机取样random seed 随机数种子random variable 随机变量randomization 随机化range 极差rank 秩rank correlation 秩相关rank statistic 秩统计量regression analysis 回归分析regression coefficient 回归系数regression line 回归线reject 拒绝rejection region 拒绝域relationship 关系reliability 可靠性repeated 重复的report 报告,报表residual 残差residual sum of squares 剩余平方和response 响应risk function 风险函数robustness 稳健性root mean square 标准差row 行run 游程run test 游程检验Ssample 样本sample size 样本容量sample space 样本空间sampling 取样sampling inspection 抽样检验scatter chart 散点图S-curve S形曲线separately 单独地sets 集合sign test 符号检验significance 显著性significance level 显著性水平significance testing 显著性检验significant 显著的,有效的significant digits 有效数字skewed distribution 偏态分布skewness 偏度small sample problem 小样本问题smooth 平滑sort 排序soruces of variation 方差来源space 空间spread 扩展square 平方standard deviation 标准离差standard error of mean 均值的标准误差standardization 标准化standardize 标准化statistic 统计量statistical quality control 统计质量控制std. residual 标准残差stepwise regression analysis 逐步回归stimulus 刺激strong assumption 强假设stud. deleted residual 学生化剔除残差stud. residual 学生化残差subsamples 次级样本sufficient statistic 充分统计量sum 和sum of squares 平方和summary 概括,综述Ttable 表t-distribution t分布test 检验test criterion 检验判据test for linearity 线性检验test of goodness of fit 拟合优度检验test of homogeneity 齐性检验test of independence 独立性检验test rules 检验法则test statistics 检验统计量testing function 检验函数time series 时间序列tolerance limits 容许限total 总共,和transformation 转换treatment 处理trimmed mean 截尾均值true value 真值t-test t检验two-tailed test 双侧检验Uunbalanced 不平衡的unbiased estimation 无偏估计unbiasedness 无偏性uniform distribution 均匀分布Vvalue of estimator 估计值variable 变量variance 方差variance components 方差分量variance ratio 方差比various 不同的vector 向量Wweight 加权,权重weighted average 加权平均值within groups 组内的ZZ score Z分数。
概率论与数理统计英文文献
Introduction to probability theory andmathematical statisticsThe theory of probability and the mathematical statistic are carries on deductive and the induction science to the stochastic phenomenon statistical rule, from the quantity side research stochastic phenomenon statistical regular foundation mathematics discipline, the theory of probability and the mathematical statistic may divide into the theory of probability and the mathematical statistic two branches. The probability uses for the possible size quantity which portrays the random event to occur. Theory of probability main content including classical generally computation, random variable distribution and characteristic numeral and limit theorem and so on. The mathematical statistic is one of mathematics Zhonglian department actually most directly most widespread branches, it introduced an estimate (rectangular method estimate, enormousestimate), the parameter supposition examination, the non-parameter supposition examination, the variance analysis and the multiple regression analysis, the fail-safe analysis and so on the elementary knowledge and the principle, enable the student to have a profound understanding tostatistics principle function. Through this curriculum study, enables the student comprehensively to understand, to grasp the theory of probability and the mathematical statistic thought and the method, grasps basic and the commonly used analysis and the computational method, and can studies in the solution economy and the management practice question using the theory of probability and the mathematical statistic viewpoint and the method.Random phenomenonFrom random phenomenon, in the nature and real life, some things are interrelated and continuous development. In the relationship between each other and developing, according to whether there is a causal relationship, very different can be divided into two categories: one is deterministic phenomenon. This kind of phenomenon is under certain conditions, will lead to certain results. For example, under normal atmospheric pressure, water heated to 100 degrees Celsius, is bound to a boil. This link is belong to the inevitability between things. Usually in natural science is interdisciplinary studies and know the inevitability, seeking this kind of inevitable phenomenon.Another kind is the phenomenon of uncertainty. This kind of phenomenon is under certain conditions, the resultis uncertain. The same workers on the same machine tools, for example, processing a number of the same kind of parts, they are the size of the there will always be a little difference. As another example, under the same conditions, artificial accelerating germination test of wheat varieties, each tree seed germination is also different, there is strength and sooner or later, respectively, and so on. Why in the same situation, will appear this kind of uncertain results? This is because, we say "same conditions" refers to some of the main conditions, in addition to these main conditions, there are many minor conditions and the accidental factor is people can't in advance one by one to grasp. Because of this, in this kind of phenomenon, we can't use the inevitability of cause and effect, the results of individual phenomenon in advance to make sure of the answer. The relationship between things is belong to accidental, this phenomenon is called accidental phenomenon, or a random phenomenon.In nature, in the production, life, random phenomenon is very common, that is to say, there is a lot of random phenomenon. Issue such as: sports lottery of the winning Numbers, the same production line production, the life of the bulb, etc., is a random phenomenon. So we say: randomphenomenon is: under the same conditions, many times the same test or survey the same phenomenon, the results are not identical, and unable to accurately predict the results of the next. Random phenomena in the uncertainties of the results, it is because of some minor, caused by the accidental factors.Random phenomenon on the surface, seems to be messy, there is no regular phenomenon. But practice has proved that if the same kind of a large number of repeated random phenomenon, its overall present certain regularity. A large number of similar random phenomena of this kind of regularity, as we observed increase in the number of the number of times and more obvious. Flip a coin, for example, each throw is difficult to judge on that side, but if repeated many times of toss the coin, it will be more and more clearly find them up is approximately the same number.We call this presented by a large number of similar random phenomena of collective regularity, is called the statistical regularity. Probability theory and mathematical statistics is the study of a large number of similar random phenomena statistical regularity of the mathematical disciplines.The emergence and development of probability theoryProbability theory was created in the 17th century, it is by the development of insurance business, but from the gambler's request, is that mathematicians thought the source of problem in probability theory.As early as in 1654, there was a gambler may tired to the mathematician PASCAL proposes a question troubling him for a long time: "meet two gamblers betting on a number of bureau, who will win the first m innings wins, all bets will be who. But when one of them wins a (a < m), the other won b (b < m) bureau, gambling aborted. Q: how should bets points method is only reasonable?" Who in 1642 invented the world's first mechanical addition of computer.Three years later, in 1657, the Dutch famous astronomy, physics, and a mathematician huygens is trying to solve this problem, the results into a book concerning the calculation of a game of chance, this is the earliest probability theory works.In recent decades, with the vigorous development of science and technology, the application of probability theory to the national economy, industrial and agricultural production and interdisciplinary field. Many of applied mathematics, such as information theory, game theory, queuing theory, cybernetics, etc., are based on the theory of probability.Probability theory and mathematical statistics is a branch of mathematics, random they similar disciplines are closely linked. But should point out that the theory of probability and mathematical statistics, statistical methods are each have their own contain different content.Probability theory, is based on a large number of similar random phenomena statistical regularity, the possibility that a result of random phenomenon to make an objective and scientific judgment, the possibility of its occurrence for this size to make quantitative description; Compare the size of these possibilities, study the contact between them, thus forming a set of mathematical theories and methods.Mathematical statistics - is the application of probability theory to study the phenomenon of large number of random regularity; To through the scientific arrangement of a number of experiments, the statistical method given strict theoretical proof; And determining various methods applied conditions and reliability of the method, the formula, the conclusion and limitations. We can from a set of samples to decide whether can with quite large probability to ensure that a judgment is correct, and can control the probability of error.- is a statistical method provides methods are used in avariety of specific issues, it does not pay attention to the method according to the theory, mathematical reasoning.Should point out that the probability and statistics on the research method has its particularity, and other mathematical subject of the main differences are:First, because the random phenomena statistical regularity is a collective rule, must to present in a large number of similar random phenomena, therefore, observation, experiment, research is the cornerstone of the subject research methods of probability and statistics. But, as a branch of mathematics, it still has the definition of this discipline, axioms, theorems, the definitions and axioms, theorems are derived from the random rule of nature, but these definitions and axioms, theorems is certain, there is no randomness.Second, in the study of probability statistics, using the "by part concluded all" methods of statistical inference. This is because it the object of the research - the range of random phenomenon is very big, at the time of experiment, observation, not all may be unnecessary. But by this part of the data obtained from some conclusions, concluded that the reliability of the conclusion to all the scope.Third, the randomness of the random phenomenon, refers to the experiment, investigation before speaking. After the real results for each test, it can only get the results of the uncertainty of a certain result. When we study this phenomenon, it should be noted before the test can find itself inherent law of this phenomenon.The content of the theory of probabilityProbability theory as a branch of mathematics, it studies the content general include the probability of random events, the regularity of statistical independence and deeper administrative levels.Probability is a quantitative index of the possibility of random events. In independent random events, if an event frequency in all events, in a larger range of stable around a fixed constant. You can think the probability of the incident to the constant. For any event probability value must be between 0 and 1.There is a certain type of random events, it has two characteristics: first, only a finite number of possible results; Second, the results the possibility of the same. Have the characteristics of the two random phenomenon called"classical subscheme".In the objective world, there are a large number of random phenomena, the result of a random phenomenon poses a random event. If the variable is used to describe each random phenomenon as a result, is known as random variables.Random variable has a finite and the infinite, and according to the variable values is usually divided into discrete random variables and the discrete random variable. List all possible values can be according to certain order, such a random variable is called a discrete random variable; If possible values with an interval, unable to make the order list, the random variable is called a discrete random variable.The content of the mathematical statisticsIncluding sampling, optimum line problem of mathematical statistics, hypothesis testing, analysis of variance, correlation analysis, etc. Sampling inspection is to pair through sample investigation, to infer the overall situation. Exactly how much sampling, this is a very important problem, therefore, is produced in the sampling inspection "small sample theory", this is in the case of the sample is small, the analysis judgment theory.Also called curve fitting and optimal line problem. Some problems need to be according to the experience data to find a theoretical distribution curve, so that the whole problem get understanding. But according to what principles and theoretical curve? How to compare out of several different curve in the same issue? Selecting good curve, is how to determine their error? ...... Is belong to the scope of the optimum line issues of mathematical statistics.Hypothesis testing is only at the time of inspection products with mathematical statistical method, first make a hypothesis, according to the result of sampling in reliable to a certain extent, to judge the null hypothesis.Also called deviation analysis, variance analysis is to use the concept of variance to analyze by a handful of experiment can make the judgment.Due to the random phenomenon is abundant in human practical activities, probability and statistics with the development of modern industry and agriculture, modern science and technology and continuous development, which formed many important branch. Such as stochastic process, information theory, experimental design, limit theory, multivariate analysis, etc.译文:概率论和数理统计简介概率论与数理统计是对随机现象的统计规律进行演绎和归纳的科学,从数量侧面研究随机现象的统计规律性的基础数学学科,概率论与数理统计又可分为概率论和数理统计两个分支。
概率论中基本事件概率英文
概率论中基本事件概率英文The Fundamentals of Basic Event Probability in Probability Theory.Probability theory is a branch of mathematics that deals with the analysis of random phenomena. At its core, it aims to assign numerical measures to the likelihood of certain outcomes occurring in experiments or real-world situations. Within this framework, basic events play a pivotal role as they constitute the building blocks of any probabilistic analysis.Definition of Basic Events.Basic events, also known as elementary events, are the simplest and most fundamental outcomes in a probability experiment. They are indivisible units of uncertainty, meaning they cannot be further decomposed into smaller or simpler events. In other words, basic events are those that cannot occur simultaneously with any other event in thesame experiment.For instance, in the context of rolling a six-sided die, the numbers 1, 2, 3, 4, 5, and 6 represent the basic events. Each of these numbers corresponds to a unique outcome that cannot be further subdivided.Characteristics of Basic Events.1. Mutually Exclusive: Basic events are mutually exclusive, meaning they cannot occur simultaneously. In the die-rolling example, it is impossible to roll both a 3 anda 4 at the same time.2. Collectively Exhaustive: The set of all basic events is collectively exhaustive, meaning that at least one of them must occur in any given experiment. In the die-rolling scenario, rolling any number between 1 and 6 is guaranteed.3. Equally Likely: In many probability experiments, basic events are assumed to be equally likely. This assumption simplifies calculations and is often reasonablein situations where there is no apparent bias or preferential treatment of any specific outcome.Probability of Basic Events.The probability of a basic event is defined as the numerical measure of its likelihood of occurrence. In probability theory, the probability of an event E is denoted by P(E) and is typically defined as the ratio of the number of favorable outcomes to the total number of possible outcomes.For basic events, this ratio is particularly simple since each event is considered individually. Let's consider the example of rolling a die again. Since there are six basic events (1, 2, 3, 4, 5, 6), the probability of rolling any specific number, say 3, is given by:P(3) = Number of favorable outcomes (i.e., rolling a 3) / Total number of possible outcomes (i.e., 6)。
费马帕斯卡概率论
费马帕斯卡概率论(中英文实用版)Title: Fermat-Pascal Probability Theory摘要:The Fermat-Pascal probability theory, also known as the binomial probability theory, is a fundamental concept in probability theory.It was independently discovered by Pierre de Fermat and Blaise Pascal in the 17th century.This theory provides a mathematical framework for calculating the probabilities of events involving two mutually exclusive outcomes, such as heads or tails in a coin flip.费马-帕斯卡概率论,亦称为二项概率论,是概率论中的一个基本概念。
它在17世纪由皮埃尔·德·费马和布莱兹·帕斯卡独立发现。
这一理论为计算涉及两个相互排斥结果的事件的概率提供了数学框架,例如硬币抛掷中的正面或反面。
The binomial probability distribution is a specific probability distribution that describes the probability of a certain number of successful outcomes in a fixed number of independent Bernoulli trials, where each trial has the same probability of success.The binomial probability formula is given by:P(X = k) = C(n, k) * p^k * (1-p)^(n-k)其中,P(X = k) is the probability of getting exactly k successful outcomes, C(n, k) is the combination of n items taken k at a time, p is the probability of success in a single trial, and n is the number of trials.二项概率分布是一种特定的概率分布,它描述了在固定数量的独立贝努利试验中,成功结果的特定数量的概率,其中每次试验成功的概率相同。
概率与统计英语

《概率论与数理统计》大体名词中英文对照表英文中文Probability theory 概率论mathematical statistics 数理统计deterministic phenomenon 确信性现象random phenomenon 随机现象sample space 样本空间random occurrence 随机事件fundamental event 大体事件certain event 必然事件impossible event 不可能事件random test 随机实验incompatible events 互不相容事件frequency 频率classical probabilistic model 古典概型geometric probability 几何概率conditional probability 条件概率multiplication theorem 乘法定理Bayes's formula 贝叶斯公式Prior probability 先验概率Posterior probability 后验概率Independent events 彼此独立事件Bernoulli trials 贝努利实验random variable 随机变量probability distribution 概率散布distribution function 散布函数discrete random variable 离散随机变量distribution law 散布律hypergeometric distribution 超几何散布random sampling model 随机抽样模型binomial distribution 二项散布Poisson distribution 泊松散布geometric distribution 几何散布probability density 概率密度continuous random variable 持续随机变量uniformly distribution 均匀散布exponential distribution 指数散布numerical character 数字特点mathematical expectation 数学期望variance 方差moment 矩central moment 中心矩n-dimensional random variable n-维随机变量two-dimensional random variable 二维离散随机变量joint probability distribution 联合概率散布joint distribution law 联合散布律joint distribution function 联合散布函数boundary distribution law 边缘散布律boundary distribution function 边缘散布函数exponential distribution 二维指数散布continuous random variable 二维持续随机变量joint probability density 联合概率密度boundary probability density 边缘概率密度conditional distribution 条件散布conditional distribution law 条件散布律conditional probability density 条件概率密度covariance 协方差dependency coefficient 相关系数normal distribution 正态散布limit theorem 极限定理standard normal distribution 标准正态散布logarithmic normal distribution 对数正态散布covariance matrix 协方差矩阵central limit theorem 中心极限定理Chebyshev's inequality 切比雪夫不等式Bernoulli's law of large numbers 贝努利大数定律statistics 统计量simple random sample 简单随机样本sample distribution function 样本散布函数sample mean 样本均值sample variance 样本方差sample standard deviation 样本标准差sample covariance 样本协方差sample correlation coefficient 样本相关系数order statistics 顺序统计量sample median 样本中位数sample fractiles 样本极差sampling distribution 抽样散布parameter estimation 参数估量estimator 估量量estimate value 估量值unbiased estimator 无偏估量unbiassedness 无偏性biased error 误差mean square error 均方误差relative efficient 相对有效性minimum variance 最小方差asymptotic unbiased estimator 渐近无偏估量量uniformly estimator 一致性估量量moment method of estimation 矩法估量maximum likelihood method of estimation 极大似然估量法likelihood function 似然函数maximum likelihood estimator 极大似然估量值interval estimation 区间估量hypothesis testing 假设查验statistical hypothesis 统计假设simple hypothesis 简单假设composite hypothesis 复合假设rejection region 拒绝域acceptance domain 同意域test statistics 查验统计量linear regression analysis 线性回归分析1 概率论与数理统计辞汇英汉对照表Aabsolute value 绝对值accept 同意acceptable region 同意域additivity 可加性adjusted 调整的alternative hypothesis 对立假设analysis 分析analysis of covariance 协方差分析analysis of variance 方差分析arithmetic mean 算术平均值association 相关性assumption 假设assumption checking 假设查验availability 有效度average 均值Bbalanced 平衡的band 带宽bar chart 条形图beta-distribution 贝塔散布between groups 组间的bias 偏倚binomial distribution 二项散布binomial test 二项查验Ccalculate 计算case 个案category 类别center of gravity 重心central tendency 中心趋势chi-square distribution 卡方散布chi-square test 卡方查验classify 分类cluster analysis 聚类分析coefficient 系数coefficient of correlation 相关系数collinearity 共线性column 列compare 比较comparison 对照components 组成,分量compound 复合的confidence interval 置信区间consistency 一致性constant 常数continuous variable 持续变量control charts 操纵图correlation 相关covariance 协方差covariance matrix 协方差矩阵critical point 临界点critical value 临界值crosstab 列联表cubic 三次的,立方的cubic term 三次项cumulative distribution function 累加散布函数curve estimation 曲线估量Ddata 数据default 默许的definition 概念deleted residual 剔除残差density function 密度函数dependent variable 因变量description 描述design of experiment 实验设计deviations 不同df.(degree of freedom) 自由度diagnostic 诊断dimension 维discrete variable 离散变量discriminant function 判别函数discriminatory analysis 判别分析distance 距离distribution 散布D-optimal design D-优化设计Eeaqual 相等effects of interaction 交互效应efficiency 有效性eigenvalue 特点值equal size 等含量equation 方程error 误差estimate 估量estimation of parameters 参数估量estimations 估量量evaluate 衡量exact value 精准值expectation 期望expected value 期望值exponential 指数的exponential distributon 指数散布extreme value 极值Ffactor 因素,因子factor analysis 因子分析factor score 因子得分factorial designs 析因设计factorial experiment 析因实验fit 拟合fitted line 拟合线fitted value 拟合值fixed model 固定模型fixed variable 固定变量fractional factorial design 部份析因设计frequency 频数F-test F查验full factorial design 完全析因设计function 函数Ggamma distribution 伽玛分布geometric mean 几何均值group 组Hharmomic mean 调和均值heterogeneity 不齐性histogram 直方图homogeneity 齐性homogeneity of variance 方差齐性hypothesis 假设hypothesis test 假设查验Iindependence 独立independent variable 自变量independent-samples 独立样本index 指数index of correlation 相关指数interaction 交互作用interclass correlation 组内相关interval estimate 区间估量intraclass correlation 组间相关inverse 倒数的iterate 迭代Kkernal 核Kolmogorov-Smirnov test柯尔莫哥洛夫-斯米诺夫查验kurtosis 峰度Llarge sample problem 大样本问题layer 层least-significant difference 最小显著差数least-square estimation 最小二乘估量least-square method 最小二乘法level 水平level of significance 显著性水平leverage value 中心化杠杆值life 寿命life test 寿命实验likelihood function 似然函数likelihood ratio test 似然比查验linear 线性的linear estimator 线性估量linear model 线性模型linear regression 线性回归linear relation 线性关系linear term 线性项logarithmic 对数的logarithms 对数logistic 逻辑的lost function 损失函数Mmain effect 主效应matrix 矩阵maximum 最大值maximum likelihood estimation 极大似然估量mean squared deviation(MSD) 均方差mean sum of square 均方和measure 衡量media 中位数M-estimator M估量minimum 最小值missing values 缺失值mixed model 混合模型mode 众数model 模型Monte Carle method 蒙特卡罗法moving average 移动平均值multicollinearity 多元共线性multiple comparison 多重比较multiple correlation 多重相关multiple correlation coefficient 复相关系数multiple correlation coefficient 多元相关系数multiple regression analysis 多元回归分析multiple regression equation 多元回归方程multiple response 多响应multivariate analysis 多元分析Nnegative relationship 负相关nonadditively 不可加性nonlinear 非线性nonlinear regression 非线性回归noparametric tests 非参数查验normal distribution 正态散布null hypothesis 零假设number of cases 个案数Oone-sample 单样本one-tailed test 单侧查验one-way ANOVA 单向方差分析one-way classification 单向分类optimal 优化的optimum allocation 最优配制order 排序order statistics 顺序统计量origin 原点orthogonal 正交的outliers 异样值Ppaired observations 成对观测数据paired-sample 成对样本parameter 参数parameter estimation 参数估量partial correlation 偏相关partial correlation coefficient 偏相关系数partial regression coefficient 偏回归系数percent 百分数percentiles 百分位数pie chart 饼图point estimate 点估量poisson distribution 泊松散布polynomial curve 多项式曲线polynomial regression 多项式回归polynomials 多项式positive relationship 正相关power 幂P-P plot P-P概率图predict 预测predicted value 预测值prediction intervals 预测区间principal component analysis 主成份分析proability 概率probability density function 概率密度函数probit analysis 概率分析proportion 比例Qqadratic 二次的Q-Q plot Q-Q概率图quadratic term 二次项quality control 质量操纵quantitative 数量的,气宇的quartiles 四分位数Rrandom 随机的random number 随机数random number 随机数random sampling 随机取样random seed 随机数种子random variable 随机变量randomization 随机化range 极差rank 秩rank correlation 秩相关rank statistic 秩统计量regression analysis 回归分析regression coefficient 回归系数regression line 回归线reject 拒绝rejection region 拒绝域relationship 关系reliability 靠得住性repeated 重复的report 报告,报表residual 残差residual sum of squares 剩余平方和response 响应risk function 风险函数robustness 稳健性root mean square 标准差row 行run 游程run test 游程查验Ssample 样本sample size 样本容量sample space 样本空间sampling 取样sampling inspection 抽样查验scatter chart 散点图S-curve S形曲线separately 单独地sets 集合sign test 符号查验significance 显著性significance level 显著性水平significance testing 显著性查验significant 显著的,有效的significant digits 有效数字skewed distribution 偏态散布skewness 偏度small sample problem 小样本问题smooth 滑腻sort 排序soruces of variation 方差来源space 空间spread 扩展square 平方standard deviation 标准离差standard error of mean 均值的标准误差standardization 标准化standardize 标准化statistic 统计量statistical quality control 统计质量操纵std. residual 标准残差stepwise regression analysis 慢慢回归stimulus 刺激strong assumption 强假设stud. deleted residual 学生化剔除残差stud. residual 学生化残差subsamples 次级样本sufficient statistic 充分统计量sum 和sum of squares 平方和summary 归纳,综述Ttable 表t-distribution t散布test 查验test criterion 查验判据test for linearity 线性查验test of goodness of fit 拟合优度查验test of homogeneity 齐性查验test of independence 独立性查验test rules 查验法那么test statistics 查验统计量testing function 查验函数time series 时刻序列tolerance limits 允许限total 总共,和transformation 转换treatment 处置trimmed mean 截尾均值true value 真值t-test t查验two-tailed test 双侧查验Uunbalanced 不平衡的unbiased estimation 无偏估量unbiasedness 无偏性uniform distribution 均匀散布Vvalue of estimator 估计值variable 变量variance 方差variance components 方差分量variance ratio 方差比various 不同的vector 向量Wweight 加权,权重weighted average 加权平均值within groups 组内的ZZ score Z分数。
有关概率论的外文文献

文档下载亿万文档免费下载毕业论文外语考试资格考试IT计算机高等教育教学研究经管营销总结/汇报工作范文高中教育初中教育小学教育当前位置:文档下载 > 所有分类 > 人文社科 > 教育学/心理学 > 有关概率论的外文文献免费下载此文档有关概率论的外文文献SAS Statistical Analysis Software And Logistic RegressionI. Overview:SAS is called the Statistics Analysis System, the first from the University of North Carolina's two post-graduate preparation of biostatistics, and in 1976 the Institute of SAS software is established e, the formal SAS software launched. SAS is a large-scale decision support for integrated information systems, but the software system functions limited to the first statistical analysis, since the statistical analysis is still an important part of its core functionality. the current SAS version is 9.0 version, the size is about 1G. After years of development, SAS has been around more than 120 countries and regions, nearly 30,000 institutions that have a direct users over three million people, across the financial, medical and health, production, transport, communications, government and education and scientific research. In Britain and the United States and other countries, skilled using SAS for statistical analysis isthe conditions for many companies and research institutions selection. In data processing and statistical analysis, SAS system known as the international standard software systems, and in 96 ~ 97 years hasbeen selected as the first choice for the establishment of a database product. SAS is called the Big Mac statistical software sector. The other example of this is as follows: in a harsh strict world-famous U.S. FDA drug approval process, the statistical analysis of the drug test results is carried out SAS and other software will be voided! Even a simple and standard deviation are void! This shows theauthority of the SAS.SAS is a combination of SAS software system, which is a combination of multiple functionalmodules, the basic part of BASE SAS module. BASE SAS module is the core of the SAS system,which assume the main task of data management and user management environment for the conduct of the user of language processing, call the other SAS modules and products. In other words, SAS systems, we start the BASE SAS module, which in addition has its own data management, programming andcomputing descriptive statistics, the SAS system or the central dispatching room. It can stand alone, but also with other products or modules together form a complete system. Each module can be installed and updated through the installation process very easy. SAS system has a flexible interface and powerful extension of the functional modules in the basis of BASE SAS, you can add the followingdifferent modules and a variety of new features: SAS / STAT (statistical analysis module), SAS / GRAPH (graphics module) , SAS / QC (quality control module), SAS / ETS (Econometric and time series analysis module), SAS / OR (operations research module), SAS / IML (interactive matrix programming language module), SAS / FSP ( fast data-processing module of the interactive menu system), SAS / AF (interactive full-screen application system software modules) and so on. SAS has a intelligent drawing system, it not only painted a variety of charts, but also draw the map. SAS provides a wide range of statistical process, each process contains a great deal of any option. Users can set a series of data processing to realize more complex statistical analysis. In addition, SAS also offers a variety of probability analysis function, quantile function, the sample statistics functions and random number generator function, so that users can request easily special statistics.2. operationSAS was developed from the mainframe system, the core operation is the process-driven, after many years of development, SAS has now become a complete set of computer language, and its user interface is also fully embodied the characteristics: It uses MDI (Multiple Document interface), the user input program in the PGM window, the results of the analysis in the form of text output in the OUTPUT window. using the program, users can complete all the work, including statistical analysis, forecasting, modeling and simulation, sampling and so on. However, this makes the beginners to learn SASlanguage, entry is more difficult. The Windows SAS version accord to different user groups to develop a number of graphical user interface, graphical user interface of these different characteristics, use very convenient. However, due to limit, and not to promote the focus of SAS, so the vast majority of people do not understand.3.the basic operation and basic concepts of SAS3.1 Dataset (dataset) and the databaseStatistics are for the operation of the data, files which is filled with SAS data is named dataset. in the capacity as the data sets,data sets also included in different library (for the time being itunderstood as a database). SAS in the library is divided into two types of permanent and temporary. As the name suggests, the existence of a permanent library in the data set is permanent (as long as youdo not delete it), temporary library in the data sets from the SASyou automatically be deleted. As for the concept of SAS in the database, the simplest to understand is a directory, a directory of stored data sets.第1页下一页文档免费下载:有关概率论的外文文献(下载1-4页,共4页)我要评论TOP相关主题∙有关单片机的外文文献∙有关旅游的外文文献∙有关jsp的外文文献∙下载外文文献的网站∙关于单片机的外文文献∙关于plc的外文文献∙论文的外文文献怎么找∙查找外文文献的网站相关文档概率论与数理统计英文文献概率论与数理统计英文文献_数学_自然科学_专业资料。
(完整版)概率论与数理统计英文版总结,推荐文档
x
F (x) P( X x) f (t)dt , (4.1.1)
The empty set, denoted by , is also an event, called an impossible event, means that it never
occurs in the experiment.
Probability of events (概率)
If the number of successes in n trails is denoted by s , and if the sequence of relative frequencies s / n obtained for larger and larger value of n approaches a limit, then this limit is defined as the
certain event(必然事件):
The sample space S itself, is certainly an event, which is called a certain event, means that it
always occurs in the experiment.
impossible event(不可能事件):
X12 3 4 …k …
P p q1p q2p q3p
qk-1 …
p
Binomial distribution(二项分布)
概率论与数理统计中的英文单词和短语

two-dimensional discrete random variable
二维连续型随机变量
two-dimensional continuous random variable
联合概率密度
joint probability variable
n维随机变量
n-dimensional random variable
概率分布律
law of probability distribution
一维概率分布
one-dimension probability distribution
概率分布
probability distribution
两点分布
two-point distribution
伯努利分布
Bernoulli distribution
统计量
statistic
总体
population
个体
individual
样本
sample
容量
capacity
统计分析
statistical analysis
统计分布
statistical distribution
统计总体
statistical ensemble
随机抽样
stochastic sampling / random sampling
pairwise independent
两两独立事件
pairwise independent events
第二章
Chapter 2Random Variables and Distributions
随机变量
random variables
概率论英文词汇

概率论英文词汇1. Probability 概率2. Random Experiment 随机试验3. Sample Space 样本空间4. Event 事件5. Independent 独立的6. Conditional 条件7. Random Variable 随机变量8. Distribution 分布9. Expected Value 期望值10. Variance 方差11. Standard Deviation 标准差12. Covariance 协方差13. Correlation 相关性14. Independence 独立性15. Borel's Lemma 波莱尔引理16. Counting Rule 计数规则17. Conditional Probability 条件概率18. Bayes' Theorem 贝叶斯定理19. Markov Chain 马尔可夫链20. Markov Chain Monte Carlo 马尔可夫链蒙特卡罗方法21. Stochastic Process 随机过程22. Brownian Motion 布朗运动23. Poisson Process 泊松过程24. Geometric Brownian Motion 几何布朗运动25. Wiener Process 维纳过程26. Poisson Point Process 泊松点过程27. Gaussian Process 高斯过程28. Martingale 马丁格尔过程29. Expectation-Maximization Algorithm 期望最大化算法30. Maximum Likelihood Estimation 最大似然估计法31. Bayesian Inference 贝叶斯推理32. Markov Chain Monte Carlo (MCMC) 方法马尔可夫链蒙特卡罗方法33. Central Limit Theorem 中心极限定理34. Law of Large Numbers 大数定律35. Law of the Iterated Logarithm 迭代对数律。
毕业论文外文翻译范例
外文原文(一)Savigny and his Anglo-American Disciple s*M. H. HoeflichFriedrich Carl von Savigny, nobleman, law reformer, champion of the revived German professoriate, and founder of the Historical School of jurisprudence, not only helped to revolutionize the study of law and legal institutions in Germany and in other civil law countries, but also exercised a profound influence on many of the most creative jurists and legal scholars in England and the United States. Nevertheless, tracing the influence of an individual is always a difficult task. It is especially difficult as regards Savigny and the approach to law and legal sources propounded by the Historical School. This difficulty arises, in part, because Savigny was not alone in adopting this approach. Hugo, for instance, espoused quite similar ideas in Germany; George Long echoed many of these concepts in England during the 1850s, and, of course, Sir Henry Sumner Maine also espoused many of these same concepts central to historical jurisprudence in England in the 1860s and 1870s. Thus, when one looks at the doctrinal writings of British and American jurists and legal scholars in the period before 1875, it is often impossible to say with any certainty that a particular idea which sounds very much the sort of thing that might, indeed, have been derived from Savigny's works, was, in fact, so derived. It is possible, nevertheless, to trace much of the influence of Savigny and his legal writings in the United States and in Great Britain during this period with some certainty because so great was his fame and so great was the respect accorded to his published work that explicit references to him and to his work abound in the doctrinal writing of this period, as well as in actual law cases in the courts. Thus, Max Gutzwiller, in his classic study Der einfluss Savignys auf die Entwicklung des International privatrechts, was able to show how Savigny's ideas on conflict of laws influenced such English and American scholars as Story, Phillimore, Burge, and Dicey. Similarly, Andreas Schwarz, in his "Einflusse Deutscher Zivilistik im Auslande," briefly sketched Savigny's influence upon John Austin, Frederick Pollock, and James Bryce. In this article I wish to examine Savigny's influence over a broader spectrum and to draw a picture of his general fame and reputation both in Britain and in the United States as the leading Romanist, legal historian, and German legal academic of his day. The picture of this Anglo-American respect accorded to Savigny and the historical school of jurisprudence which emerges from these sources is fascinating. It sheds light not only upon Savigny’s trans-channel, trans-Atlantic fame, but also upon the extraordinarily*M.H.Hoeflich, Savigny and his Anglo-American Disciples, American Journal of Comparative Law, vol.37, No.1, 1989.cosmopolitan outlook of many of the leading American and English jurists of the time. Of course, when one sets out to trace the influence of a particular individual and his work, it is necessary to demonstrate, if possible, precisely how knowledge of the man and his work was transmitted. In the case of Savigny and his work on Roman law and ideas of historical jurisprudence, there were three principal modes of transmission. First, there was the direct influence he exercised through his contacts with American lawyers and scholars. Second, there was the influence he exercised through his books. Third, there was the influence he exerted indirectly through intermediate scholars and their works. Let us examine each mode separately.I.INFLUENCE OF THE TRANSLATED WORKSWhile American and British interest in German legal scholarship was high in the antebellum period, the number of American and English jurists who could read German fluently was relatively low. Even those who borrowed from the Germans, for instance, Joseph Story, most often had to depend upon translations. It is thus quite important that Savigny’s works were amongst the most frequently translated into English, both in the United States and in Great Britain. His most influential early work, the Vom Beruf unserer Zeitfur Rechtsgeschichte und Gestzgebung, was translated into English by Abraham Hayward and published in London in 1831. Two years earlier the first volume of his History of Roman Law in the Middle Ages was translated by Cathcart and published in Edinburgh. In 1830, as well, a French translation was published at Paris. Sir Erskine Perry's translation of Savigny's Treatise on Possession was published in London in 1848. This was followed by Archibald Brown's epitome of the treatise on possession in 1872 and Rattigan's translation of the second volume of the System as Jural Relations or the Law of Persons in 1884. Guthrie published a translation of the seventh volume of the System as Private International Law at Edinburgh in 1869. Indeed, two English translations were even published in the far flung corners of the British Raj. A translation of the first volume of the System was published by William Holloway at Madras in 1867 and the volume on possession was translated by Kelleher and published at Calcutta in 1888. Thus, the determined English-speaking scholar had ample access to Savigny's works throughout the nineteenth century.Equally important for the dissemination of Savigny's ideas were those books and articles published in English that explained and analyzed his works. A number of these must have played an important role in this process. One of the earliest of these is John Reddie's Historical Notices of the Roman law and of the Progress of its Study in Germany, published at Edinburgh in 1826. Reddie was a noted Scots jurist and held the Gottingen J.U.D. The book, significantly, is dedicated to Gustav Hugo. It is of that genre known as an external history of Roman law-not so much a history of substantive Roman legal doctrine but rather a historyof Roman legal institutions and of the study of Roman law from antiquity through the nineteenth century. It is very much a polemic for the study of Roman law and for the Historical School. It imparts to the reader the excitement of Savigny and his followers about the study of law historically and it is clear that no reader of the work could possibly be left unmoved. It is, in short, the first work of public relations in English on behalf of Savigny and his ideas.Having mentioned Reddie's promotion of Savigny and the Historical School, it is important to understand the level of excitement with which things Roman and especially Roman law were greeted during this period. Many of the finest American jurists were attracted-to use Peter Stein's term-to Roman and Civil law, but attracted in a way that, at times, seems to have been more enthusiastic than intellectual. Similarly, Roman and Civil law excited much interest in Great Britain, as illustrated by the distinctly Roman influence to be found in the work of John Austin. The attraction of Roman and Civil law can be illustrated and best understood, perhaps, in the context of the publicity and excitement in the English-speaking world surrounding the discovery of the only complete manuscript of the classical Roman jurist Gaius' Institutes in Italy in 1816 by the ancient historian and German consul at Rome, B.G. Niebuhr. Niebuhr, the greatest ancient historian of his time, turned to Savigny for help with the Gaius manuscript (indeed, it was Savigny who recognized the manuscript for what it was) and, almost immediately, the books and journals-not just law journals by any means-were filled with accounts of the discovery, its importance to legal historical studies, and, of course, what it said. For instance, the second volume of the American Jurist contains a long article on the civil law by the scholarly Boston lawyer and classicist, John Pickering. The first quarter of the article is a gushing account of the discovery and first publication of the Gaius manuscript and a paean to Niebuhr and Savigny for their role in this. Similarly, in an article published in the London Law Magazine in 1829 on the civil law, the author contemptuously refers to a certain professor who continued to tell his students that the text of Gaius' Institutes was lost for all time. What could better show his ignorance of all things legal and literary than to be unaware of Niebuhr's great discovery?Another example of this reaction to the discovery of the Gaius palimpsest is to be found in David Irving's Introduction to the Study of the Civil Law. This volume is also more a history of Roman legal scholarship and sources than a study of substantive Roman law. Its pages are filled with references to Savigny's Geschichte and its approach clearly reflects the influence of the Historical School. Indeed, Irving speaks of Savigny's work as "one of the most remarkable productions of the age." He must have been truly impressed with German scholarship and must also have been able to convince the Faculty of Advocates, forwhom he was librarian, of the worth of German scholarship, for in 1820 the Faculty sent him to Gottingen so that he might study their law libraries. Irving devotes several pages of his elementary textbook on Roman law to the praise of the "remarkable" discovery of the Gaius palimpsest. He traces the discovery of the text by Niebuhr and Savigny in language that would have befitted an adventure tale. He elaborates on the various labors required to produce a new edition of the text and was particularly impressed by the use of a then new chemical process to make the under text of the palimpsest visible. He speaks of the reception of the new text as being greeted with "ardor and exultation" strong words for those who spend their lives amidst the "musty tomes" of the Roman law.This excitement over the Verona Gaius is really rather strange. Much of the substance of the Gaius text was already known to legal historians and civil lawyers from its incorporation into Justinian's Institutes and so, from a substantive legal perspective, the find was not crucial. The Gaius did provide new information on Roman procedural rules and it did also provide additional information for those scholars attempting to reconstruct pre-Justinianic Roman law. Nevertheless, these contributions alone seem hardly able to justify the excitement the discovery caused. Instead, I think that the Verona Gaius discovery simply hit a chord in the literary and legal community much the same as did the discovery of the Rosetta Stone or of Schliemann’s Troy. Here was a monument of a great civilization brought newly to light and able to be read for the first time in millenia. And just as the Rosetta Stone helped to establish the modern discipline of Egyptology and Schliemann's discoveries assured the development of classical archaeology as a modern academic discipline, the discovery of the Verona Gaius added to the attraction Roman law held for scholars and for lawyers, even amongst those who were not Romanists by profession. Ancillary to this, the discovery and publication of the Gaius manuscript also added to the fame of the two principals involved in the discovery, Niebuhr and Savigny. What this meant in the English-speaking world is that even those who could not or did not wish to read Savigny's technical works knew of him as one of the discoverers of the Gaius text. This fame itself may well have helped in spreading Savigny's legal and philosophical ideas, for, I would suggest, the Gaius "connection" may well have disposed people to read other of Savigny's writings, unconnected to the Gaius, because they were already familiar with his name.Another example of an English-speaking promoter of Savigny is Luther Stearns Cushing, a noted Boston lawyer who lectured on Roman law at the Harvard Law School in 1848-49 and again in 1851- 1852.Cushing published his lectures at Boston in 1854 under the title An Introduction to the Study of Roman Law. He devoted a full chapter to a description of the historical school and to the controversy betweenSavigny and Thibaut over codification. While Cushing attempted to portray fairly the arguments of both sides, he left no doubt as to his preference for Savigny's approach:The labors of the historical school have established an entirely new and distinct era in the study of the Roman jurisprudence; and though these writers cannot be said to have thrown their predecessors into the shade, it seems to be generally admitted, that almost every branch of the Roman law has received some important modification at their hands, and that a knowledge of their writings, to some extent, at least, is essentially necessary to its acquisition.译文(一)萨维尼和他的英美信徒们*M·H·豪弗里奇弗雷德里奇·卡尔·冯·萨维尼出身贵族,是一位出色的法律改革家,也是一位倡导重建德国教授协会的拥护者,还是历史法学派的创建人之一。
概率统计建模术语(中英文对照)

1.Hypothesis Test 假设检验2.Significance Level 显著性水平3.第一类错误:Type I Error4.第二类错误:Type II Error5.双边检验:two-sided(tailed) test6.单边检验:one-sided(tailed) test7.数学期望:Mathematical Expectation8.方差:Variance9.标准差:standard deviation10.样本均值:sample mean11.样本方差:sample variance12.样本标准差:sample standard deviation13.统计量:statistic14.正态分布:normal distribution15.标准正态分布:standard normal distribution16.零假设(原假设):i.Null hypothesis17.备择假设:i.Alternative hypothesis18.拒绝:reject19.p值:在原假设为真的情况下,观察到所给样本的概率。
20.平方和:sum of squares21.自由度:degree of freedom22.方差分析:analysis of variance(ANOVA)23.均方:mean square24.F统计量:F statistic25.行:row26.列:column27.交互作用:interaction28.多项式:polynomial29.回归分析:regression analysis30.线性回归分析:linear regression analysis31.非线性回归分析:nonlinear RA32.Matlab:商业软件33.Scilab:开源软件 5.1.134.逐步回归:stepwise regressioni.(回归分析中选择变量的方法)ii.。
概率论汉-英

Mutually exclusive events
互相独立
Mutually independent
极大似然估计
Maximum likelihood estimate(MLE)
假设检验
Hypothesis testing
简单随机样本
Simple random sample
矩
Moment
矩法估计
Moment estimation
离散型随机变量
Discrete random variable
连续型随机变量
Continuous random variable
联合分布函数
Joint distribution function
联合密度函数
Joint density function
联合分布律
概率统计数学词汇汉英对照
(按中文拼音字母排序)
概率
probability
点估计量
Point estimator
边缘分布
Marginal distribution
贝里试验
Bernoulli experiment
边缘分布函数
Marginal distribution function
点估计
Point estimation
独立同分布的
Independent identically distributed
独立重复试验
repeated test by independence
多维随机变量
Multidimensional random variable
二维均匀分布
Two dimensional rectangular distribution
(完整word)概率论与数理统计英文版总结,推荐文档

Sample Space样本空间The set of all possible outcomes of a statistical experiment is called the sample space.Event 事件An event is a subset of a sample space.certain event(必然事件):The sample space S itself, is certainly an event, which is called a certain event, means that it always occurs in the experiment.impossible event(不可能事件):The empty set, denoted by∅, is also an event, called an impossible event, means that it never occurs in the experiment.Probability of events (概率)If the number of successes in n trails is denoted by s, and if the sequence of relative frequencies /s n obtained for larger and larger value of n approaches a limit, then this limit is defined as the probability of success in a single trial.“equally likely to occur”------probability(古典概率)If a sample space S consists of N sample points, each is equally likely to occur. Assume that the event A consists of n sample points, then the probability p that A occurs is()np P AN==Mutually exclusive(互斥事件)Two events A and B are said to be independent if()()()P A B P A P B=⋅IOr Two events A and B are independent if and only if(|)()P B A P B=.Conditional Probability 条件概率The probability of an event is frequently influenced by other events.If 12k ,,,A A A L are events, then12k 121312121()()(|)(|)(|)k k P A A A P A P A A P A A A P A A A A -=⋅⋅I I L I L I I L I Ifthe events12k ,,,A A A L areindependent, then for any subset12{,,,}{1,2,,}m i i i k ⊂L L ,1212()()()()m m P A A A P A P A P A i i i i i i =I I L L(全概率公式 total probability)()(|)()i i P B A P B A P A =IUsing the theorem of total probability, we have1()(|)(|)()(|)i i i kjjj P B P A B P B A P B P A B ==∑ 1,2,,i k =L1. random variable definition2. Distribution functionNote The distribution function ()F X is defined on real numbers, not on sample space. 3. PropertiesThe distribution function ()F x of a random variable X has the following properties:3.2 Discrete Random Variables 离散型随机变量geometric distribution (几何分布)Binomial distribution(二项分布)poisson distribution(泊松分布)Expectation (mean) 数学期望2.Variance 方差standard deviation (标准差)probability density function概率密度函数5. Mean (均值)6. variance 方差.4.2 Uniform Distribution 均匀分布The uniform distribution, with the parameters a a nd b , has probability density function1for ,()0 elsewhere,a xb f x b a⎧<<⎪=-⎨⎪⎩4.5 Exponential Distribution 指数分布4.3 Normal Distribution正态分布1. Definition4.4 Normal Approximation to the Binomial Distribution (二项分布)4.7 C hebyshev’s Theorem (切比雪夫定理)Joint probability distribution (联合分布)In the study of probability, given at least two random variables X, Y , ..., that are defined on a probability space, the joint probabilitydistribution for X, Y , ... is a probability distribution that gives the probability that each of X, Y , ... falls in any particular range or discrete set of values specified for that variable. 5.2 C onditional distribution 条件分布Consistent with the definition of conditional probability of events when A is the event X =x and B is the event Y =y , the conditional probability distribution of X given Y =y is defined as(,)(|)()X Y p x y p x y p y =for all x provided ()0Y p y ≠. 5.3 S tatistical independent 随机变量的独立性5.4 Covariance and Correlation 协方差和相关系数We now define two related quantities whose role in characterizing the interdependence of X and Y we want to examine.理We can find the steadily of the frequency of the events in large number of random phenomenon. And the average of large number of random variables are also steadiness. These results are the law of large numbers.population (总体)A population may consist of finitely or infinitely many varieties. sample (样本、子样)中位数Sample Distributions 抽样分布1.sampling distribution of the mean 均值的抽样分布It is customary to write )(X E as X μ and )(X D as 2X σ.Here, ()E X μ= is called the expectation of the mean .均值的期望 n X σσ= is called the standard error of the mean. 均值的标准差7.1 Point Estimate 点估计Unbiased estimator(无偏估计量)minimum variance unbiased estimator (最小方差无偏估计量)3. Method of Moments 矩估计的方法confidence interval----- 置信区间lower confidence limits-----置信下限upper confidence limits----- 置信上限degree of confidence----置信度2.极大似然函数likelihood functionmaximum likelihood estimate(最大似然估计)8.1 Statistical Hypotheses(统计假设)显著性水平Two Types of Errors。
概率论 英文

1. According to the weather prediction, there is a 40% chance of rain in city A and a 30% chance of rain in city B in the September. Assuming that city A ’s weather is independent of that of city B ’s, find the probability that it will rain in at least one of these cities in the September.2. The effect of an antidepressant drug varies from person to person. Suppose that the drug is effective on 80% of women and 65% of men. It is known that 66% of the people who take the drug are women. (a) What is the probability that the drug is effective?(b) Suppose that you are told that the drug is effective. What is the probability that the drug taker is a man?3.The random variable ξ has its probability distribution table(a) Assuming (6)(8)P P ξξ===, find the values of unknown number s and t ; (b) Compute ()E ξ; (c) which is larger,(())P E ξξ> or (())P E ξξ<? why?4.Suppose that the probability density function of a continuous random variable ξ is ()x a bx φ=+,for 01x <<, and ()3/5E ξ=. Find the values of a and b .5. The lifetime (hours) of an electronic device is a random variable ξ with exponential probability density function. If the mean lifetime of the device is E()=1000ξ (hours).(a) what is the exponential probability density function?(b) compute (5002000)P ξ<<.6.Suppose that ξ,θ are two random variables.(a) Prove that ()()()2cov(,)D D D ξθξθξθ+=++;(b) If D()=9ξ,()16D θ= and correlation coefficient for ξ and θ is 0.4ρ=, compute ()D ξθ+.7. If 2~N(,)ξμσ, and -=ξμθσ, prove that ~(0,1)N θ.8.Suppose that ~(0,4)N ξ. Given 0()x Φ is standard normal distribution function and 0(1)0.8413Φ=, 0(1.5)0.93319Φ=.Compute the following probabilities:(1) (1013)P ξ<<; (2)P(>13)ξ; (3)(|10|2)P ξ-<;9.Let X denote the proportion of allotted time that a randomly selected student spends working on a certain aptitude test. Suppose the pdf of X is⎩⎨⎧≤≤+=otherwise x x x f ,010,)1();(θθθ where θ<-1. A random sample of ten students yield data 120.92,0.79,x x ==3456789100.90,0.65,0.86,0.47,0.73,0.97,0.94,0.77x x x x x x x x ========Obtain the maximum likelihood estimator of θ and then compute the estimate for the given data.10. The joint probability table for the discrete random vector (,)ξθis given byFind the correlation coefficient ρfor ξandθ.。
- 1、下载文档前请自行甄别文档内容的完整性,平台不提供额外的编辑、内容补充、找答案等附加服务。
- 2、"仅部分预览"的文档,不可在线预览部分如存在完整性等问题,可反馈申请退款(可完整预览的文档不适用该条件!)。
- 3、如文档侵犯您的权益,请联系客服反馈,我们会尽快为您处理(人工客服工作时间:9:00-18:30)。
Statistical hypothesis testingAdriana Albu,Loredana UngureanuPolitehnica University Timisoara,adrianaa@aut.utt.roPolitehnica University Timisoara,loredanau@aut.utt.roAbstract In this article,we present a Bayesian statistical hypothesis testing inspection, testing theory and the process Mentioned hypothesis testing in the real world and the importance of, and successful test of the Notes.Key words Bayesian hypothesis testing; Bayesian inference;Test of significance IntroductionA statistical hypothesis test is a method of making decisions using data, whether from a controlled experiment or an observational study (not controlled). In statistics, a result is called statistically significant if it is unlikely to have occurred by chance alone, according to a pre-determined threshold probability, the significance level. The phrase "test of significance" was coined by Ronald Fisher: "Critical tests of this kind may be called tests of significance, and when such tests are available we may discover whether a second sample is or is not significantly different from the first."[1]Hypothesis testing is sometimes called confirmatory data analysis, in contrast to exploratory data analysis. In frequency probability,these decisions are almost always made using null-hypothesis tests. These are tests that answer the question Assuming that the null hypothesis is true, what is the probability of observing a value for the test statistic that is at[]least as extreme as the value that was actually observed?) 2 More formally, they represent answers to the question, posed before undertaking an experiment,of what outcomes of the experiment would lead to rejection of the null hypothesis for a pre-specified probability of an incorrect rejection. One use of hypothesis testing is deciding whether experimental results contain enough information to cast doubt on conventional wisdom.Statistical hypothesis testing is a key technique of frequentist statistical inference. The Bayesian approach to hypothesis testing is to base rejection of the hypothesis on the posterior probability.[3][4]Other approaches to reaching a decision based on data are available via decision theory and optimal decisions.The critical region of a hypothesis test is the set of all outcomes which cause the null hypothesis to be rejected in favor of the alternative hypothesis. The critical region is usually denoted by the letter C.One-sample tests are appropriate when a sample is being compared to the population from a hypothesis. The population characteristics are known from theory or are calculated from the population.Two-sample tests are appropriate for comparing two samples, typically experimental and control samples from a scientifically controlled experiment.Paired tests are appropriate for comparing two samples where it is impossible to control important variables. Rather than comparing two sets, members are paired between samples so the difference between the members becomes the sample.Typically the mean of the differences is then compared to zero.Z-tests are appropriate for comparing means under stringent conditions regarding normality and a known standard deviation.T-tests are appropriate for comparing means under relaxed conditions(less is assumed).Tests of proportions are analogous to tests of means (the 50% proportion). Chi-squared tests use the same calculations and the same probability distribution for different applications:Chi-squared tests for variance are used to determine whether a normal population has a specified variance. The null hypothesis is that it does.Chi-squared tests of independence are used for deciding whether two variables are associated or are independent. The variables are categorical rather than numeric. It can be used to decide whether left-handedness is correlated with libertarian politics (or not). The null hypothesis is that the variables are independent.The numbers used in the calculation are the observed and expected frequencies of occurrence (from contingency tables).Chi-squared goodness of fit tests are used to determine the adequacy of curves fit to data. The null hypothesis is that the curve fit is adequate.It is common to determine curve shapes to minimize the mean square error, so it is appropriate that the goodness-of-fit calculation sums the squared errors.F-tests (analysis of variance, ANOVA) are commonly used when deciding whether groupings of data by category are meaningful.If the variance of test scores of the left-handed in a class is much smaller than the variance of the whole class, then it may be useful to study lefties as a group. The null hypothesis is that two variances are the same - so the proposed grouping is not meaningful.The testing processIn the statistical literature, statistical hypothesis testing plays a fundamental role. The usual line of reasoning is as follows:1.There is an initial research hypothesis of which the truth is unknown.2.The first step is to state the relevant null and alternative hypotheses. This isimportant as mis-stating the hypotheses will muddy the rest of the process.Specifically, the null hypothesis allows attaching an attribute: it should be chosen in such a way that it allows us to conclude whether the alternative hypothesis can either be accepted or stays undecided as it was before the test.[9]3. The second step is to consider the statistical assumptions being made about thesample in doing the test;for example,assumptions about the statistical independence or about the form of the distributions of the observations. This isequally important as invalid assumptions will mean that the results of the test are invalid.4. Decide which test is appropriate, and state the relevant test statistic T .5. Derive the distribution of the test statistic under the null hypothesis from theassumptions. In standard cases this will be a well-known result. For example the test statistic may follow a Student's t distribution or a normal distribution.6. Select a significance level (α), a probability threshold below which the nullhypothesis will be rejected. Common values are 5% and 1%.7. The distribution of the test statistic under the null hypothesis partitions the possiblevalues of T into those for which the null-hypothesis is rejected, the so called critical region, and those for which it is not. The probability of the critical region is α.8. Compute from the observations the observed value t obs of the test statistic T .9. Decide to either fail to reject the null hypothesis or reject it in favor of thealternative. The decision rule is to reject the null hypothesis H 0 if the observed value t obs is in the critical region, and to accept or "fail to reject" the hypothesis otherwise.Use and ImportanceStatistics are helpful in analyzing most collections of data. This is equally true of hypothesis testing which can justify conclusions even when no scientific theory exists. Real world applications of hypothesis testing include : Testing whether more men than women suffer from nightmaresEstablishing authorship of documentsEvaluating the effect of the full moon on behaviorDetermining the range at which a bat can detect an insect by echoDeciding whether hospital carpeting results in more infectionsSelecting the best means to stop smokingChecking whether bumper stickers reflect car owner behaviorTesting the claims of handwriting analystsStatistical hypothesis testing plays an important role in the whole of statistics and in statistical inference. For example, Lehmann (1992) in a review of the fundamental paper by Neyman and Pearson (1933) says: "Nevertheless, despite their shortcomings, the new paradigm formulated in the 1933 paper, and the many developments carried out within its framework continue to play a central role in both the theory and practice of statistics and can be expected to do so in the foreseeable future".Significance testing has been the favored statistical tool in some experimental social sciences (over 90% of articles in the Journal of Applied Psychology during the early1990s). Other fields have favored the estimation of parameters. Editors often consider significance as a criterion for the publication of scientific conclusions based on experiments with statistical results.CautionsThe successful hypothesis test is associated with a probability and a type-I error rate. The conclusion might be wrong.[7] [8]The conclusion of the test is only as solid as the sample upon which it is based. The design of the experiment is critical. A number of unexpected effects have been observed including:The Clever Hans effect. A horse appeared to be capable of doing simple arithmetic. The Hawthorne effect. Industrial workers were more productive in better illumination, and most productive in worse.The Placebo effect. Pills with no medically active ingredients were remarkably effective.A statistical analysis of misleading data produces misleading conclusions. The issue of data quality can be more subtle. In forecasting for example, there is no agreement on a measure of forecast accuracy. In the absence of a consensus measurement, no decision based on measurements will be without controversy.The book How to Lie with Statistics is the most popular book on statistics everpublished. It does not much consider hypothesis testing, but its cautions are applicable,including: Many claims are made on the basis of samples too small to convince. If a report does not mention sample size, be doubtful.Hypothesis testing acts as a filter of statistical conclusions; Only those results meeting a probability threshold are publishable. Economics also acts as a publication filter; Only those results favorable to the author and funding source may be submitted for publication. The impact of filtering on publication is termed publication bias. A related problem is that of multiple testing (sometimes linked to data mining), in which a variety of tests for a variety of possible effects are applied to a single data set and only those yielding a significant result are reported.Those making critical decisions based on the results of a hypothesis test are prudent to look at the details rather than the conclusion alone. In the physical sciences most results are fully accepted only when independently confirmed. The general advice concerning statistics is, "Figures never lie, but liars figure" (anonymous).ControversySince significance tests were first popularized many objections have been voiced by prominent and respected statisticians. The volume of criticism and rebuttal has filled books with language seldom used in the scholarly debate of a dry subject. Much of the criticism was published more than 40 years ago. The fires of controversy have burned hottest in the field of experimental psychology. Nickerson surveyed the issues in the year 2000. He included 300 references and reported 20 criticisms and almost as many recommendations, alternatives and supplements. The following section greatly condenses Nickerson's discussion, omitting many issues.Results of the controversyThe controversy has produced several results. The American PsychologicalAssociation has strengthened its statistical reporting requirements after review, medicaljournal publishers have recognized the obligation to publish some results that are notstatistically significant to combat publication bias and a journal (Journal of Articles inSupport of the Null Hypothesis ) has been created to publish such results exclusively. Textbooks have added some cautions and increased coverage of the tools necessary to[28] [10] .estimate the size of the sample required to produce significant results. Major organizations have not abandoned use of significance tests although they have discussed doing so. References[1] R. A. Fisher (1925). Statistical Methods for Research Workers, Edinburgh: Oliver and Boyd, 1925, p.43.[2] Cramer, Duncan; Dennis Howitt (2004). The Sage Dictionary of Statistics.p. 76. ISBN0-7619-4138-X.[3] Schervish,M(1996)Theory of Statistics, p. 218.Springer ISBN 0-387-94546-6[4] Kaye, David H.; Freedman, David A. (2011). "Reference Guide on Statistics". Reference manual on scientific evidence (3rd ed.). Eagan, MN Washington, D.C: West National Academies Press. p. 259. ISBN978-0-309-21421-6.[5] C. S. Peirce (August 1878). "Illustrations of the Logic of Science VI: Deduction, Induction, and Hypothesis".Popular Science Monthly13.[6] Fisher, Sir Ronald A. (1956) [1935]. "Mathematics of a Lady Tasting Tea". In James Roy Newman. The World of Mathematics, volume 3 [Design of Experiments]. Courier Dover Publications. ISBN978-0-486-41151-4.[7] Box, Joan Fisher (1978). R.A. Fisher, The Life of a Scientist. New York: Wiley. p. 134. ISBN0-471-09300-9[8] Lehmann, E.L.; Romano,Joseph P. (2005). Testing Statistical Hypotheses (3E ed.). New York: Springer. ISBN0-387-98864-5.[9] Adèr,J.H. (2008). Chapter 12: Modelling. In H.J. Adèr & G.J. Mellenbergh (Eds.) (with contributions by D.J. Hand), Advising on Research Methods: A consultant's companion (pp. 183–209). Huizen,The Netherlands:Johannes van Kessel Publishing[10] Triola, Mario (2001). Elementary statistics (8 ed.). Boston: Addison-Wesley. p. 388. ISBN 0-201-61477-4.摘要济南大学泉城学院毕业论文外文资料翻译American Journal of Mathematics, 2007,126(5): 2387-2425统计假设检验Adriana Albu,Loredana UngureanuPolitehnica University Timisoara,adrianaa@aut.utt.roPolitehnica University Timisoara,loredanau@aut.utt.ro在这篇文章中,我们给出统计假设检验的贝叶斯检验,介绍了检验理论和其过程。