R语言作Circos图之进阶篇:圈圈套圈圈的法门
【精品推荐】R语言用circlize包绘制circos plot可视化报告(附代码数据)

R语言用circlize包绘制circos plot可视化报告circlize包circlize包在德国癌症中心的华人博士Zuguang Gu开发的,有兴趣的可以去看看他的Github主页。
这个包有两个文档,一个是介绍基本原理的绘制简单圈圈图的,也是本次要介绍的。
另外一份文档专门介绍基因组数据绘制圈圈图Genomic Circos Plot,我自己还没看完,下次再介绍。
根据我的学习发现这个包与ggplot2很相似,也是先创建一个图层,然后不断的添加图形元素(point、line、bar等),这些简单的图形元素都有circos.这个前缀进行绘制,比如要绘制点,则用circos.points()。
具体的下面一一介绍。
用circlize绘制圈圈图绘图第一步是先初始化(circos.initialize),接下来绘制track,再添加基本元素。
需要提一下的是,由于circlize绘制图是不断叠加的,因此如果我们一大段代码下来我们只能看到最终的图形,这里为了演示每端代码的结果,所以每次我都得初始化以及circlize.clear。
绘制第一个track接下来绘制第二个trackcircos.trackHist添加柱状图,由于柱状图相对高级一点,因此circos.trackHist会自动创建一个track,创建第三个track这里又得提一下,当我们绘制多个track时,我们添加基本元素时要指定添加到哪个track(track.index指定)、哪个cell(sector.index指定)里,如果不指定,那么将默认track是我们刚刚实际操作中我们常常会更新数据或者想更新图形,这是可以通过circos.updatePlotRegion函数在特定的track、cell里(先删除再添加)update,下面我们将通过circos.updatePlotRegion函数先删除track接下来绘制第四个track。
RCircos包用户指南说明书

Using the RCircos PackageHongen Zhang,Ph.D.Genetics Branch,Center for Cancer Research,National Cancer Institute,NIHDecember19,2021Contents1Introduction1 2Input Data Format2 3Plot Track Layout3 4Getting Started:Initialize RCircos core componentsfirst44.1Initialize RCircos core components (4)4.2Modifying RCircos core components (8)5Making a Plot with RCircos85.1Initialize Graphic Device (8)5.2Plot Chromosome Ideogram (9)5.3Gene Labels and connectors on RCircos Plot (9)5.4Heatmap,Histogram,Line,Scatter,and Tile Plot (9)5.5Links:A Special Plot (10)6More Information12 7sessionInfo12 1IntroductionThe RCircos package provides a set of graphic functions which implement basic Circos2D track plot[1]for visualizing similarities and differences of genome structure and positional relationships between genomic intervals.The package is implemented with R graphics package that comes with R base installation and aimed to reduce the complexity of usage and increase theflexibility in in-tegrating into other R pipelines of genomic data processing.Currently,following graphic functions are provided:1•Chromosome ideogram plots for human,mouse,and rat•Data plots include:–heatmap–histogram–lines–scatterplot–tiles•Plot items for further decoration include:–connectors–links(lines and ribbons)–text(gene)labelsAfter successful installation of RCircos,one needs to load the library to get started using it:>library(RCircos)2Input Data FormatRCircos takes the input data in the form of a data frame that could be an object returned from read.table()or generated with other pipelines in the current R session.Thefirst three columns of the data frame,except for input to the link plot,must be genomic position information in the order of chromosome names, chromosome start,and chromosome end positions.>data(RCircos.Histogram.Data)>head(RCircos.Histogram.Data)Chromosome chromStart chromEnd Data1chr145000000499999990.0708592chr155000000599999990.3004603chr160000000649999990.1254214chr170000000749999990.1581565chr175000000799999990.1635406chr180000000849999990.342921For gene labels and heatmap plots,the gene/probe names must be provided in the fourth column.For other plots,this column could be optional.>data(RCircos.Heatmap.Data)>head(RCircos.Heatmap.Data)2Chromosome chromStart chromEnd GeneName X786.O A498A549.ATCC ACHN 1chr1934341935552HES46.757817.38773 6.478906.05517 2chr1948846949919ISG157.5629710.49590 5.898937.58095 3chr111388871142089TNFRSF184.69775 4.55593 4.389704.50064 4chr112706571284492DVL17.768867.52194 6.871257.03517 5chr112880701293915MXRA84.49805 4.72032 4.622074.58575 6chr115929381624243SLC35E2B8.731048.102298.365999.04116 BT.549CAKI.118.850627.00307212.084707.814593 4.475254.4772147.653867.697335 5.663894.9349969.241759.89727Different from other plot data,the input data for link line plot has onlypaired genomic position information for each row in the order of chromosomename A,chromStart A,chromEnd A,chromosome name B,chromStart B,and chromEnd B.>data(RCircos.Link.Data)>head(RCircos.Link.Data)Chromosome chromStart chromEnd Chromosome.1chromStart.1chromEnd.11chr182847038285399chr1828575282863892chr18598014385980624chr71231613131231616873chr1118069850118070319chr11180703291180706894chr1167077258167077658chr11697646301697649655chr1171671272171671550chr11797908791797912926chr1174333479174333875chr6101861516101861840 Note:RCircos will convert the input data to RCircos plot data but it doesnot provide functionality for general data processing.If the data frame does nothave genomic position information,you have to add the information to the dataframe before passing it to RCircos functions.Sample datasets are included in thepackage for demo purpose and they could be easily explored with data()method.Starting from version1.1.2,user can append to input data a column of plotcolor names with header of”PlotColor”to control the colors for each data pointexcept of heatmap plot.3Plot Track LayoutRCircos follows the same algorithm of Circos plot and arranges data plots intracks.A track could be placed either inside or outside of chromosome ideogram3and the detailed position for a track could be easily manipulated by changing of the track width and track numbers.Thefigure below shows a human chromosome ideogram plus three empty tracks arranged in both inside and outside of chromosome ideogram.4Getting Started:Initialize RCircos core components first4.1Initialize RCircos core componentsThefirst step of making RCircos plot is to initialize RCircos core components. To setup RCircos core components,user needs load the chromosome ideogram data into current R session.The RCircos package have three build-in datasets for human,mouse,and rat chromosome ideograms which can be loaded with data()command.Ideogram data in textfiles with same format can also be4loaded with read.table()function in R.>data(UCSC.HG19.Human.CytoBandIdeogram);>head(UCSC.HG19.Human.CytoBandIdeogram);Chromosome ChromStart ChromEnd Band Stain1chr102300000p36.33gneg2chr123000005400000p36.32gpos253chr154000007200000p36.31gneg4chr172000009200000p36.23gpos255chr1920000012700000p36.22gneg6chr11270000016200000p36.21gpos50>data(UCSC.Mouse.GRCm38.CytoBandIdeogram);>head(UCSC.Mouse.GRCm38.CytoBandIdeogram);Chromosome ChromStart ChromEnd Band Stain1chr108840440qA1gpos1002chr1884044012278390qA2gneg3chr11227839020136559qA3gpos334chr12013655922101102qA4gneg5chr12210110230941543qA5gpos1006chr13094154343219933qB gneg>data(UCSC.Baylor.3.4.Rat.cytoBandIdeogram);>head(UCSC.Baylor.3.4.Rat.cytoBandIdeogram);Chromosome ChromStart ChromEnd Band Stain1chr1010142096p13gneg2chr11014209624272657p12gvar3chr12427265738517175p11gneg4chr13851717548659271q11gpos5chr14865927169741157q12gneg6chr16974115790025350q21gposAfter the chromosome ideogram data is loaded,RCircos core components can be initialized with function of ponents().This function needs four arguments:cytoinfo the chromosome ideogram data loadedchr.exclude chromosomes should be excluded from ideogram,e.g.,chr.exclude <-c(”chrX”,”chrY”);.If it is set to NULL,no chromosome will be ex-cluded.tracks.inside how many tracks will be plotted inside chromosome ideogram tracks.outside how many data tracks will be plotted outside chromosome ideogram5Following code initialize RCircos core components with all human chromo-some ideogram and10data track space inside of chromosome ideogram.>chr.exclude<-NULL;><-UCSC.HG19.Human.CytoBandIdeogram;>tracks.inside<-10;>tracks.outside<-0;>ponents(,chr.exclude,+tracks.inside,tracks.outside);RCircos use three core components to perform data transformation and data plot:RCircos cytoband data RCircos cytoband data is derived from the input chro-mosome ideogram data.Except of the chromosome name,start and endpositions,band name and stain intensity for each band,chromosome high-light colors,band colors,band length in base pairs and chromosome unitsas well as the relative location on the circular layout are also included.These data are used to calculate the plot location of each genomic data. RCircos plot positions RCircos plot positions are x and y coordinates for a cir-cular line of radius1.0and the total number of points for the circularline are decided by the total number of chromosome units.One chromo-some units is a plot point which covers a defined number of base pairsand total units for chromosome ideogram include units of each band pluschromosome padding area,both of them are defined in the list of plotparameters.RCircos plot parameters RCircos plot parameters are only one core compo-nents open to users.With the get and reset methods,users can modifythe parameters for updating other two core components.Following areRCircos plot parameters and their default values:base.per.unit Number of base pairs a chromosome unit(a plot point)will cover,default:30000chrom.paddings Width of padding between two chromosomes in chromo-some unit,default:300(Note:chrom.paddings is binded to base.per.unit.It will be automatically updated if the base.per.unit is changed,un-less be set to zero).tracks.inside Total number of data tracks inside of chromosome ideogram.Read-only.tracks.outside Total number of data tracks outside of chromosome ideogram.Read-only.radiu.len The radius of a circular line which serves as baseline for calcu-lation of plot items,default:1plot.radius Radius of plot area,default:1.56chr.ideo.pos Radius of chromosome ideogram position,default:1.1 highlight.pos Radius of chromosome ideogram highlights,default:1.25 .po Radius of chromosome name position,default:1.4track.in.start Radius of start position of thefirst track inside of chromo-some idogram,default:1.05track.out.start Radius of start position of thefirst track outside of chro-mosome idogram,default:1.6chrom.width Width of chromosomes of the ideogram,default:0.1 track.padding Width of padding between two plot tracks,default:0.02 track.height Height of data plot track,default:0.1(Note:Parameters above are all relative to the radius.len and will be updated automat-ically if new radiu.len is reset.hist.width Width of histogram column in chromosome unit,default:100 heatmap.width Width of heatmap cells in chromosome unit,default:100 text.size Character size(same as cex in R graphics package)for text plot, default:0.4char.width Width of a charater on RCircos plot,default500(chromosome unit)highlight.width Line type(same as lty in R graphics package)for chro-mosome highlight,default:2point.size Point size(same as cex in R graphics package)for scatter plot, default:1Bezier.point Total number of points for a link(Bezier)line default:1000 yers Maximum number of layers for tile plot,default:5sub.tracks Number of sub tracks in a data track,default:5text.color Color for text plot,default:blackhist.color Color for histgram plot,default:redline.color Color for line plot,default:blackscatter.color Color for scatter plot,default:blacktile.color Color for tile plot,default:blacktrack.background Color of track background,default:wheatgrid.line.color Color for track grids,default:grayheatmap.color Color scales for heatmap plot,default:BlueWhiteRed point.type Point type(same as pch in R graphics package)for scatter plot,default:”.”7The core components are stored in RCircos session and each component is supplied with one Get method for advanced usage.In addition,simply call the function RCircos.List.Parameters()will list all current plot parameters.>rcircos.params<-RCircos.Get.Plot.Parameters();>rcircos.cyto<-RCircos.Get.Plot.Ideogram();>rcircos.position<-RCircos.Get.Plot.Positions();>RCircos.List.Plot.Parameters()4.2Modifying RCircos core componentsAmong the three RCircos core components,RCircos cytoband data and RCir-cos plot positions are calculated based on plot parameter ers can modify RCircos core components by changing plot parameters.Once the plot parameter(s)is changed,call and pass the new parameters to the function of RCircos.Reset.Plot.Parameters(),other two components will be checked for up-date.>rcircos.params<-RCircos.Get.Plot.Parameters();>rcircos.params$base.per.unit<-3000;>RCircos.Reset.Plot.Parameters(rcircos.params);>RCircos.List.Plot.Parameters();5Making a Plot with RCircosPlotting with RCircos is a stepwise process.First,an initialization step is needed.Then,tracks and other aspects of the plot are added sequentially. The result is available after the plot has been entirely constructed.The next subsections walk through the process in detail.5.1Initialize Graphic DeviceRCircos provides a set of graphic plot functions but does not handle graphic devices.To make RCircos plots,a graphic device has to be openedfirst.Cur-rently,RCircos works withfiles supported by R graphics package such as tiff, png,pdf images as well as GUI windows.For example,to make a pdffile with RCircos plot image:>out.file<-"RCircosDemoHumanGenome.pdf";>pdf(file=out.file,height=8,width=8,compress=TRUE);>RCircos.Set.Plot.Area();Note:RCircos.Set.Plot.Area()will setup plot area base on total number of tracks inside and outside of chromosome er can also setup plot area by summit the R plot commands for user defined plot area,for example:8>par(mai=c(0.25,0.25,0.25,0.25));>plot.new();>plot.window(c(-2.5,2.5),c(-2.5,2.5));Note:After everything is done,the graphic device needs to be closed with dev.off().5.2Plot Chromosome IdeogramFor RCircos plot,a commonfirst step is to draw chromosome ideograms and label chromosomes with names and highlights.After the RCircos core compo-nents were initialized and graphic device was open,simply call the function of RCircos.Chromosome.Ideogram.Plot()will add the chromosome ideogram to the current plot.>RCircos.Chromosome.Ideogram.Plot();5.3Gene Labels and connectors on RCircos PlotDue to the resolution issues,only limited number of gene names can be labeled. For best visualization,cex should be no less than0.4when draw gene labels. When cex is set to0.4,width of character will be5000chromosome units when each unit covers3000base pairs.If the gene name list supplied is too long,it will be truncated tofit the chromosome length.Also the long gene name will span more than one track so one or more tracks may be needed to skip for next track. Connectors are used to mark a genomic position with their names or variant status.Currently,RCircos only provide connector plot between genes and their genomic positions.The following code draw connectors on thefirst track inside chromosome ideogram and plot gene names on the next track.>data(bel.Data);>name.col<-4;>side<-"in";>track.num<-1;>RCircos.Gene.Connector.Plot(bel.Data,+track.num,side);>track.num<-2;>.Plot(bel.Data,+name.col,track.num,side);5.4Heatmap,Histogram,Line,Scatter,and Tile Plot Heatmap,histogram,line,scatter,and tile plot with RCircos require that the first three columns of input data are genomic position information in the order of chromosome name,start,and end position.RCircos provides one function for each type of plots and each function will draw one data er can simply9call each function with appropriate arguments such as plot location(which track and which side of chromosome ideogram).No more data processing needed. The code below will draw data tracks of heatmap,scatter,line,histogram, and tile plots.>data(RCircos.Heatmap.Data);>data.col<-6;>track.num<-5;>side<-"in";>RCircos.Heatmap.Plot(RCircos.Heatmap.Data,data.col,+track.num,side);>data(RCircos.Scatter.Data);>data.col<-5;>track.num<-6;>side<-"in";>by.fold<-1;>RCircos.Scatter.Plot(RCircos.Scatter.Data,data.col,+track.num,side,by.fold);>data(RCircos.Line.Data);>data.col<-5;>track.num<-7;>side<-"in";>RCircos.Line.Plot(RCircos.Line.Data,data.col,+track.num,side);>data(RCircos.Histogram.Data);>data.col<-4;>track.num<-8;>side<-"in";>RCircos.Histogram.Plot(RCircos.Histogram.Data,+data.col,track.num,side);>data(RCircos.Tile.Data);>track.num<-9;>side<-"in";>RCircos.Tile.Plot(RCircos.Tile.Data,track.num,side);5.5Links:A Special PlotLinks presents relationship of two genomic positions and it is always the last track inside chromosome ideogram.Different from other data plots,input data for links plot is a data frame with paired genomic positions in the order of chromosome,start,and end position for each one genomic position.RCircos supports two types of link plot:lines and ribbons.Link lines are used for pre-senting relationship of two small genomic regions and ribbons are plotted for10bigger genomic regions.Colors for links between chromosomes or same chromo-somes could be modified by defining by.chromosome=TRUE(or FALSE). Following code draw link lines and ribbons in the center of plot area.>data(RCircos.Link.Data);>track.num<-11;>RCircos.Link.Plot(RCircos.Link.Data,track.num,TRUE);>data(RCircos.Ribbon.Data);>RCircos.Ribbon.Plot(ribbon.data=RCircos.Ribbon.Data,+track.num=11,by.chromosome=FALSE,twist=FALSE);>dev.off();Run all code above will generate an image like below.116More InformationSeveral demo samples are included in the package.Simply run following demosto see how the RCircos works for simple and complex RCircos plot.>library(RCircos);>demo("RCircos.Demo.Human");>demo("RCircos.Demo.Mouse.And.Rat");7sessionInfo>sessionInfo()R version4.1.0(2021-05-18)Platform:x86_64-pc-linux-gnu(64-bit)Running under:CentOS Linux7(Core)Matrix products:defaultBLAS/LAPACK:/usr/local/intel/compilers_and_libraries_2020.2.254/linux/mkl/lib/intel64_lin/l locale:[1]LC_CTYPE=en_US.UTF-8LC_NUMERIC=C[3]LC_TIME=en_US.UTF-8LC_COLLATE=C[5]LC_MONETARY=en_US.UTF-8LC_MESSAGES=en_US.UTF-8[7]LC_PAPER=en_US.UTF-8LC_NAME=C[9]LC_ADDRESS=C LC_TELEPHONE=C[11]LC_MEASUREMENT=en_US.UTF-8LC_IDENTIFICATION=Cattached base packages:[1]stats graphics grDevices utils datasets methods baseother attached packages:[1]RCircos_1.2.2loaded via a namespace(and not attached):[1]compiler_4.1.0tools_4.1.0References[1]Krzywinski,Martin I and Schein,Jacqueline E and Birol,Inanc and Connors,Joseph and Gascoyne,Randy and Horsman,Doug and Jones,Steven J andMarra,Marco A.Circos:An information aesthetic for comparative genomics.Genome Research,2009.12。
r语言圆点对应的标题
r语言圆点对应的标题
在R语言中,可以使用`text()`函数在图形上添加文本,包括圆点对应的标题。
下面是一个示例代码:
```r
创建一个散点图
x <- c(1, 2, 3, 4, 5)
y <- c(2, 3, 1, 5, 4)
plot(x, y, type = "n") type = "n"表示不绘制散点
在每个圆点旁边添加标题
for (i in 1:length(x)) {
text(x[i], y[i], labels = paste("Point", i), pos = 3) pos = 3表示将文本
放在圆点的右侧
}
```
在这个示例中,我们首先使用`plot()`函数创建一个散点图,并使用`type = "n"`参数表示不绘制散点。
然后,我们使用`for`循环遍历每个圆点,并使用
`text()`函数在每个圆点的旁边添加标题。
`labels`参数用于指定每个标题的
内容,这里使用了`paste()`函数将标题字符串与圆点序号合并。
`pos = 3`参数表示将文本放在圆点的右侧。
circso对数据进行可视化

circso对数据进行可视化circos可以用来绘制圈图,能够对染色体上的数据进行可视化,首先需要一个染色体的文件染色体的文件如下,每列之间空格分隔chr - chr1 10227556264 chr1chr - chr2 20192460366 chr2chr - chr3 30192294377 chr3chr - chr4 40170955103 chr4chr - chr5 50189454096 chr5chr - chr6 60181584905 chr6chr - chr7 70171882078 chr7chr - chr8 80146850525 chr8chr - chr9 90133195287 chr9第一列:表名这行数据是染色体的数据第二列: -第三列:染色体的名称,会显示在图上第四列:染色体编号第五列:染色体的起始位置第六列:染色体的终止位置第七列:染色体的颜色在circos中有一些默认的颜色设置,用rgb设置一些默认的颜色名,可以在circos的安装目录的etc/colors.conf 文件中查看,比如chr1 的颜色设置保存在colors.ucsc.conf 中,内容如下chr1 = 153,102,0chr2 = 102,102,0chr3 = 153,153,30chr4 = 204,0,0chr5 = 255,0,0chr6 = 255,0,204chr7 = 255,204,204chr8 = 255,153,0chr9 = 255,204,0chr10 = 255,255,0chr11 = 204,255,0chr12 = 0,255,0chr13 = 53,128,0chr14 = 0,0,204chr15 = 102,153,255chr16 = 153,204,255chr17 = 0,255,255chr18 = 204,255,255chr19 = 153,0,204chr20 = 204,51,255chr21 = 204,153,255chr22 = 102,102,102chr23 = 153,153,153chrX = 153,153,153chr24 = 204,204,204chrY = 204,204,204chrM = 204,204,153chr0 = 204,204,153chrUn = 121,204,61chrNA = 255,255,255我们也可以自定义一些颜色的名称,将其添加到colors.conf 文件中保存即可,比如自定义颜色sample1 = 255,99,71然后就可以使用sample1 作为颜色名了,在circos中还有很多颜色的名字,都是有规律的,比如vvlred : very very light redvlred : very light redlred : light redred : reddred : dark redvdred : very dark redvvdred : very very dark red常用的颜色red, green, blue, yellow 都支持上面的颜色定义, 除此之外,还有其他很多的内置颜色,详细信息可以查看circos安装目录下的/etc/colors.conf 文件查看,里面的注释部分详细说明了颜色的定义方式。
circos可视化手册-lineplot篇
circos可视化手册-lineplot篇
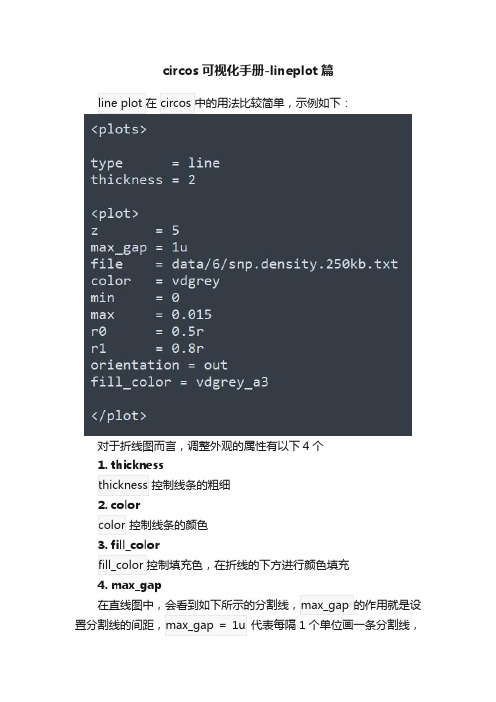
对于折线图而言,调整外观的属性有以下4个
1. thickness
控制线条的粗细
2. color
控制线条的颜色
3. fill_color
4. max_gap
代表每隔1个单位画一条分割线,
其用法和
控制位置的属性在前面的文章中我们已经介绍过了,这里在重复一遍。
代表
代表优先级,数值越大,优先级越高,当两个折线图重叠时,优先级高的会有优先显示。
与
参数设定间隔的用法, 这种用法方便的设置多条轴线,今天的这个例子
个3种填充色,背景色也有3种,另
可以看到其轴线非常少,只有2,3条;最内圈的
用
完整代码如下。
advanced circos用法
advanced circos用法"Circos" 是一种用于可视化和分析环形数据的工具,而"Advanced Circos" 可能指的是Circos 工具的一些增强版本或在Circos 基础上进行的进一步开发。
Circos 主要用于展示基因组、染色体和其他环形数据的关联关系。
以下是 Circos 的一些基本用法和概念,以及可能的 "Advanced Circos" 的用法:1. 安装 Circos:首先,你需要安装 Circos 工具。
你可以从 Circos 官方网站(http://circos.ca/)下载安装包并按照文档中的说明进行安装。
2. 配置文件:Circos 使用一个配置文件(通常是circos.conf)来定义数据和图的样式。
这个文件描述了环形图中的各个元素,如染色体、数据轨道等。
3. 数据文件: Circos 通过输入文件(通常是文本文件)来获取数据。
数据文件的格式需要符合 Circos 的要求,可以包括与染色体、坐标轴、数据点等相关的信息。
4. 运行Circos:使用配置文件和数据文件,你可以运行Circos 生成环形图。
运行命令通常是 circos -conf circos.conf,其中 circos.conf 是你的配置文件。
以下是一些可能的 "Advanced Circos" 的用法:1. 高级定制和主题: "Advanced Circos" 可能提供更高级的定制选项,允许用户更灵活地调整图表的外观和样式,包括颜色、字体、标签等。
2. 交互式功能:一些增强版本可能支持交互式功能,允许用户在图表上交互并查看详细信息。
3. 数据整合: "Advanced Circos" 可能支持更多数据源和数据类型的整合,使用户能够在一个图中集成更多的信息。
4. 插件和扩展:可能存在一些插件或扩展,允许用户添加新的功能或图表类型。
R语言作Circos图之进阶篇:圈圈套圈圈的法门
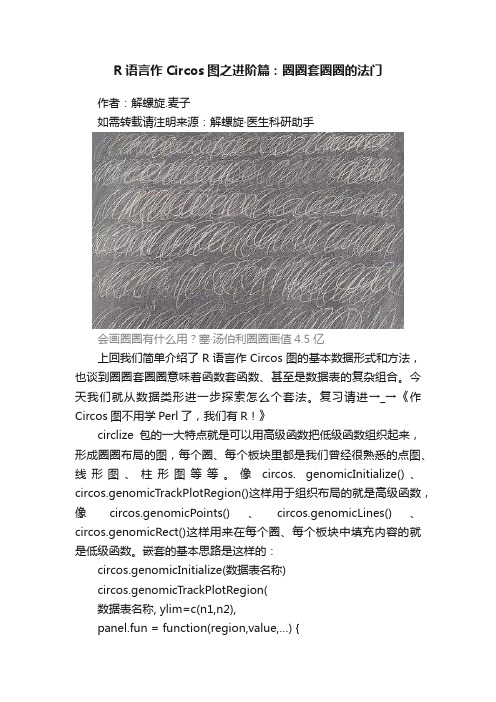
R语言作Circos图之进阶篇:圈圈套圈圈的法门作者:解螺旋.麦子如需转载请注明来源:解螺旋·医生科研助手会画圈圈有什么用?塞·汤伯利圈圈画值4.5亿上回我们简单介绍了R语言作Circos图的基本数据形式和方法,也谈到圈圈套圈圈意味着函数套函数、甚至是数据表的复杂组合。
今天我们就从数据类形进一步探索怎么个套法。
复习请进→_→《作Circos图不用学Perl了,我们有R!》circlize包的一大特点就是可以用高级函数把低级函数组织起来,形成圈圈布局的图,每个圈、每个板块里都是我们曾经很熟悉的点图、线形图、柱形图等等。
像circos. genomicInitialize()、circos.genomicTrackPlotRegion()这样用于组织布局的就是高级函数,像circos.genomicPoints()、circos.genomicLines()、circos.genomicRect()这样用来在每个圈、每个板块中填充内容的就是低级函数。
嵌套的基本思路是这样的:circos.genomicInitialize(数据表名称)circos.genomicTrackPlotRegion(数据表名称, ylim=c(n1,n2),panel.fun = function(region,value,…) {circos.genomicPoints(region, value, pch = 16, cex = 0.5)})circos.clear()其中,最关键的就是circos.genomicTrackPlotRegion和panel.fun,处理好它俩就能升一个境界。
它们在不同的数据组织形式里的具体应用也有所不同,下面我们就按数据的组织形式来扒一扒。
circos.genomicTrackPlotRegion用来生成新的圈;panel.fun=function(region,value,…)则是一个自定义的函数,Region是板块的起始点和终止点,value则是描述Y轴上的值。
RCricos绘制简单圈图

RCricos绘制简单圈图RCricos绘制简单圈图程序1:library(RCircos)#导入内建人类染色体数据data(UCSC.HG38.Human.CytoBandIdeogram) ->ponents(,chr.exclude=NULL,tracks.inside=10, tracks.outside=0 ) #chr.exclude -># ->#tracks.inside ->#tracks.outside ->#设置外部track 个数RCircos.Set.Plot.Area()RCircos.Chromosome.Ideogram.Plot() #绘制染色体表意文字,染色体的默认方法亮点和染色体名称。
程序2:#导入内建人类染色体数据data(UCSC.HG19.Human.CytoBandIdeogram);head(UCSC.HG19.Human.CytoBandIdeogram);chr.exclude -> ->tracks.inside ->tracks.outside ->#导入上面四个基本参数ponents(, chr.exclude,tracks.inside, tracks.outside);#列出所有绘图参数RCircos.List.Parameters()#Following are an example to change RCircos plot parameters:#===================================== ======================params ->params$radius.len ->params$base.per.unit ->RCircos.Reset.Plot.Parameters(params) #参数重置#定义要生成的图像文件,pdf,png,tiff 等,注意:最后要用dev.off()关闭out.file ->pdf(file=out.file, height=8, width=8, compress=TRUE);RCircos.Set.Plot.Area();#Plot Chromosome IdeogramRCircos.Chromosome.Ideogram.Plot();#Gene Labels and connectors on RCircos Plot#RCircos.Gene.Connector.Plot 绘制染色体表意文字和基因名称之间的连接#.Plot 在数据轨道上绘制基因名称data(bel.Data);name.col ->side ->track.num ->RCircos.Gene.Connector.Plot(bel.Data, track.num, side);track.num ->.Plot(bel.Data,name.col,track.num, side);#Heatmap, Histogram, Line, Scatter, and Tile Plot#Heatmap--------------#RCircos.Heatmap.Plot绘制一个数据轨道的热图data(RCircos.Heatmap.Data);data.col ->track.num ->side ->RCircos.Heatmap.Plot(RCircos.Heatmap.Data, data.col, track.num, side);#Scatter--------------#RCircos.Scatter.Plot 一个数据轨迹的扫描图data(RCircos.Scatter.Data);data.col ->track.num ->side ->by.fold ->RCircos.Scatter.Plot(RCircos.Scatter.Data, data.col,track.num, side, by.fold);#Line-----------------#RCircos.Line.Plot绘制线为一个数据轨道data(RCircos.Line.Data);data.col ->track.num ->side ->RCircos.Line.Plot(RCircos.Line.Data, data.col, track.num, side);#Histogram------------#RCircos.Histogram.Plot 绘制一个数据轨迹的直方图data(RCircos.Histogram.Data);data.col ->track.num ->side ->RCircos.Histogram.Plot(RCircos.Histogram.Data, data.col, track.num, side);# Tile-----------------data(RCircos.Tile.Data);track.num ->side ->RCircos.Tile.Plot(RCircos.Tile.Data, track.num, side);#Links-----------------#RCircos.Link.Plot绘制两个或多个基因组位置之间的链接线data(RCircos.Link.Data);track.num ->RCircos.Link.Plot(RCircos.Link.Data, track.num, TRUE);data(RCircos.Ribbon.Data);RCircos.Ribbon.Plot(ribbon.data=RCircos.Ribbon.Data, track.num=11, by.chromosome=FALSE, twist=FALSE);dev.off();##由于R版本不同部分函数有差异。
Circos入门教程

Circos⼊门教程1 Circos简介Circos是⼀个⾮常酷炫的基因组数据可视化软件,能够将基因组数据映射到环形的基因组坐标上,⽤相互嵌套的环道来展⽰基因组数据,还可以通过连接线来呈现基因组区块之间的关系。
Circos的开发者是⼀位加拿⼤的⽣物信息学家Martin Krzywinski,值得⼀提的是,他还是⼀位专业的摄影师。
于是,科学和艺术的交融,催⽣了Circos这款强⼤的可视化软件,果真不懂艺术的码农不是好的⽣物学家。
⾃从Circos诞⽣以后,圈图就成了⽣物信息可视化的明星图形,不时见诸顶尖杂志的⽂章。
尽管有意见认为,圈图表达的信息量太过全⾯,看似⾼端但是并没有太多⽤处,只是⽤来装门⾯⽽已。
但是,不得不承认的是,圈图使得丰富多变的基因组数据的呈现,有了⼀个全景、优雅的解决⽅案。
环形呈现数据的优势在于,它能够在有限的呈现⾯积上,展⽰尽可能多的序列属性和关联信息,以有限容纳⽆限,颇有芥⼦纳须弥的禅意。
因⽽,Circos的实际应⽤,已经延伸到⽣物信息学领域之外,在⾦融、经济、政治、甚⾄考古等领域都有很多基于圈图的可视化结果。
2 Circos的安装2.1 准备⼯作2.2 下载及解压wget http://circos.ca/distribution/circos-0.69-6.tgztar xvfz circos-0.69-6.tgzcd circos-0.69-62.3 测试依赖模块⾸先可以列出来Circos需要哪些依赖模块:cd $PATH/circos-0.69-6/bin #$PATH是解压后circos⽂件夹的上级全路径./list.modules当然,这些依赖模块有些可能已经安装过了,重复安装⽐较浪费时间,所以可以直接运⾏⼀下Circos,看它的报错信息说缺少哪些模块,再⼀个个安装:./circos -v2.4 安装依赖模块Perl模块的安装⽅法不再细讲。
2.5 安装GD模块2.6 测试上⾯这些都安装完毕后,就可以尝试运⾏⼀下Circos:./circos -v如果不出现报错信息,⼀般就没有问题了。
circos教程
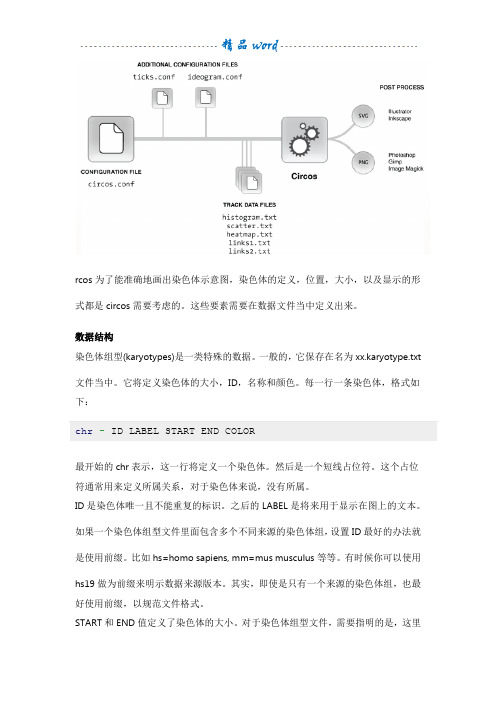
rcos为了能准确地画出染色体示意图,染色体的定义,位置,大小,以及显示的形式都是circos需要考虑的。
这些要素需要在数据文件当中定义出来。
数据结构染色体组型(karyotypes)是一类特殊的数据。
一般的,它保存在名为xx.karyotype.txt 文件当中。
它将定义染色体的大小,ID,名称和颜色。
每一行一条染色体,格式如下:chr- ID LABEL START END COLOR最开始的chr表示,这一行将定义一个染色体。
然后是一个短线占位符。
这个占位符通常用来定义所属关系,对于染色体来说,没有所属。
ID是染色体唯一且不能重复的标识。
之后的LABEL是将来用于显示在图上的文本。
如果一个染色体组型文件里面包含多个不同来源的染色体组,设置ID最好的办法就是使用前缀。
比如hs=homo sapiens, mm=mus musculus等等。
有时候你可以使用hs19做为前缀来明示数据来源版本。
其实,即使是只有一个来源的染色体组,也最好使用前缀,以规范文件格式。
START和END值定义了染色体的大小。
对于染色体组型文件,需要指明的是,这里的START和END应该是染色体本身的大小,而不是你想绘制部分的起止位置。
指定绘制部分将由其它文件来定义。
COLOR是于定义显示的颜色。
如果染色体组不以条纹(cytogenetic bands)图谱覆盖的话,那么就会以这里设置的颜色显示。
对于人类基因组而言,circos预设了与染色体相同的名字做为颜色名,比如chr1, chr2, … chrX, chrY, chrUn.下面就是hg19的例子:chr- hs1 hs1 024******* chr1chr- hs2 hs2 024******* chr2chr- hs3 hs3 0198022430 chr3chr- hs4 hs4 0191154276 chr4chr- hs5 hs5 0180915260 chr5chr- hs6 hs6 0171115067 chr6chr- hs7 hs7 0159138663 chr7chr- hs8 hs8 0146364022 chr8chr- hs9 hs9 0141213431 chr9chr- hs10 hs10 0135534747 chr10chr- hs11 hs11 0135006516 chr11chr- hs12 hs12 0133851895 chr12chr- hs13 hs13 0115169878 chr13chr- hs14 hs14 010******* chr14chr- hs15 hs15 010******* chr15chr- hs16 hs16 090354753 chr16chr- hs17 hs17 081195210 chr17chr- hs18 hs18 078077248 chr18chr- hs19 hs19 059128983 chr19chr- hs20 hs20 063025520 chr20chr- hs21 hs21 048129895 chr21chr- hs22 hs22 051304566 chr22chr- hsx hsx 0155270560 chrxchr- hsy hsy 059373566 chry一般的,我们都会在染色体组型文件当中加上条纹图谱的信息,这样才会让染色体图谱看上去有被染色的效果。
circos教程一简单介绍
circos教程⼀简单介绍最近在学习利⽤circos绘制基因组物理图,遗传图谱marker之间的关系,染⾊体的共线性等。
现在将⾃⼰掌握的东西写出来,算是⼀种另类的锻炼吧。
注意:下⾯所有操作均是在linux下完成软件安装细节:安装circos成功后,运⾏:./bin/circos你会发现,我去怎么还需要这么多perl模块呢,没办法,你只能将circos运⾏所需的所有perl模块全部安装才能正常运⾏。
安装⽅法:1、sudo perl -MCPAN -e shell在cpan提⽰后⾯安装你所需要的perl模块,不会⽤的话可以help举个例⼦:Math::Bezier的安装,从官⽹下载后进⾏解压,进⼊解压后的⽬录,你会看到⼀个README⽂件,打开后,有详细的安装说明!注意:⽹上有很多⼈都说GD、GD::Image及GD::Polyline这些模块安装特别费劲,总是安装失败。
我看了⼀下错误提⽰,说明需要安装libgd,那你就安装⼀个呗。
所有模块安装成功后,运⾏:./bin/circos -modules嗯,不错不错,该有的都有了。
你可以看⼀下帮助页⾯(如果英语可以的话):./bin/circos -h./bin/circos -man我们可以看⼀下以及⽬录结构:bin:circos脚本就在这⼀个⽬录,Circos是⽤perl写的并且是作为⼀个单独的可执⾏程序data:包含⼤量的测试数据⽂件etc:Circos全局配置⽂件在这⾥,⽐如colors.conf和fonts.conf。
这些⽂件是被导⼊到其他配置⽂件example:实例⽂件fonts:circos使⽤TFF,这些字体在etc/fonts.conf中有详细描述lib:代码库tiles:磁贴填充circos主要是⽤来产⽣静态图⽚,这些图⽚的产⽣是通过配置⽂件实现的,⼀个主配置⽂件可以包含多个⼦配置⽂件(⽐如全局的字体和颜⾊配置等)circos⼤体步骤应该如下:1、构造需要展⽰的数据2、将数据解析成circos格式3、构建适⽤于⾃⼰数据的配置⽂件4、运⾏circos,⽣成PNG或SVG格式的图⽚5、修改和编辑图⽚下⾯利⽤⼀个实例结束本次的讲解:配置⽂件来源于安装⽬录中example/etc/circos.conf 运⾏命令:perl ./bin/circos -conf circos.conf⽣成图形:好了,今天就到这⾥……。
从零学测序癌症基因组重测序分析第六讲之circos图的绘制

patterns.conf
colors.conf
配置文件
还有一些设置是也是经常用到,但会根据个人喜好或绘图要求不同而有细微 差别,如ideogram.conf、 ticks.conf等。除此之外,也可以把经常用到的设置 写成配置文件,便于其它配置文件反复导入,提高效率。
image.conf 对image大小、背景颜色、输出目录、输出文件形式以及染色体 在圆周上的起始位置等进行设置。 染色体展示的配置文件,包括是否展示bands,染色体展示位置、 染色体间距离、染色体标签位置等。染色体数据在哪?画哪一 些?后面实例中有说明,这里是简单介绍配置文件的作用。 刻度标签配置文件,可以导入到ideogram.conf中,也可以直接 导入到主配置文件中。
【测序中国-从零学测序】癌症基因组 重测序分析第六讲之circos图的绘制
卜德超 微信/QQ: 530242830 邮箱: budechao@ 中国科学院计算技术研究所 2015-01-07
Circos介绍
• Circos 是一个Perl语言开发的自由可视化软 件,使用GPL协议分发,以绘制输出圈图(原 型 • Circos 是由加拿大的一位生物信息科学家 Martin Krzywinski 所开发,他同时是一位专 业摄影师,最初他主要从事Linux系统管理 等工作风格的图)为最大特色
karyotype = data/karyotype/karyotype.mouse.mm9.txt chromosomes_units = 1000000 chromosomes_display_default = yes <<include mydata/ideogram.conf>> <<include mydata/ticks.conf>> …… <image> <<include etc/image.conf>> colors_fonts_patterns.conf </image> <<include etc/colors_fonts_patterns.conf>> <<include etc/housekeeping.conf>> circos.conf
如何利用circos绘制漂亮的基因组圈图

如何利⽤circos绘制漂亮的基因组圈图数据准备参考上图,绘制需要两项基本内容,其⼀是染⾊体信息⽂件(核型⽂件),主要⽬的是在图⽚上显⽰出染⾊体,并进⾏颜⾊等相关设置;其⼆是标签⽂字⽂件(⽂本text⽂件),主要⽬的是在染⾊体上具体的位置将基因作为label显⽰。
核型⽂件()格式如下所⽰:chr - 1 Chr1 0 30427671 chr1chr - 2 Chr2 0 19698289 chr2chr - 3 Chr3 0 23459830 chr3chr - 4 Chr4 0 18585056 chr4chr - 5 Chr5 0 26975502 chr5⽂件以TAB分隔,前两列可以不变,⽽需要注意第三列到最后⼀列的信息,第三列为染⾊体实际编号,第四列是图⽚上进⾏显⽰的编号,第五列表⽰染⾊体长度的起始,第六列对应染⾊体的终⽌,也就是最终长度,最后⼀列实际上控制的是染⾊体的颜⾊,chr1⾄chr5都对应不同的颜⾊。
text⽂件(text.txt)⽂件格式如下(全部内容共24⾏,此处仅显⽰部分):5 25982254 25986435 AT5G650504 17835217 17838969 AT4G379404 12023824 12028004 AT4G229503 22618259 22620529 AT3G611201 25982294 25986349 AT1G69120⽂件依然以TAB分隔,第⼀列表⽰标签⽂字(基因)出现的染⾊体实际编号,第⼆列第三列表⽰基因位于该染⾊体上的起⽌坐标位置,第四列是该基因的ID即在染⾊体上显⽰的⽂字。
绘图配置进⾏circos绘图,需要依据最终⽬标整理配置⽂件,也就是对图⽚进⾏各种细节设置,以⽬标图⽚为例,配置⽂件(config.txt)如下:chromosomes_units=100000 #染⾊体单位长度chromosomes_reverse=/[12345]/ #是否对匹配到的染⾊体进⾏反转#####针对染⾊体显⽰进⾏设置fill=yes #是否进⾏颜⾊填充label_font=default #染⾊体标签字体label_parallel=yes #字体⽅向易于浏览label_radius=1.1r #标签位置label_size=45 #标签字体⼤⼩radius=0.5r #染⾊体位置show_label=yes #是否显⽰染⾊体标签###针对染⾊体之间空隙⼤⼩进⾏设置default=0.005rstroke_color=dgrey #染⾊体外边框轮廓颜⾊stroke_thickness=2p #轮廓厚度thickness=0.03r #染⾊体厚度karyotype=/share/circos/result/ ##核型⽂件位置#######此处仅显⽰针对标签text进⾏设置type=text #限定plot为⽂本标签color=red #限定⽂字标签颜⾊file=/share/circos/result/text.txt ##text⽂件位置label_font=condensed #⽂字字体类型label_size=30 #⽂字字体⼤⼩label_snuggle=yes #如多个⽂本⽂字距离过近,避免重叠label_snuggle=yes #如多个⽂本⽂字距离过近,避免重叠show_links=yes #显⽰标签和染⾊体之间的连接link_color=black #连接线颜⾊link_dims=0p,20p,50p,2p,2p #连接线细分五部分,各部分长度link_thickness=2p #连接线厚度r0=1r #标签位置,其r0和r1⼤⼩能控制标签在内或在外r1=1r+200prpadding=5p #⽂字边缘⼤⼩#######针对染⾊体刻度开始进⾏设置show_tick_labels=yes #是否显⽰刻度标签show_ticks=yes #是否显⽰刻度color=black #刻度线颜⾊multiplier=1e-6 #刻度标签显⽰值的计算,显⽰刻度的位置对应该值的⼤⼩radius=1r #显⽰位置thickness=2p #刻度线厚度##设置每5u的刻度并进⾏细节设置size=10p #刻度线⼤⼩spacing=5u #每5个单元长度出现⼀个刻度##设置每10u的刻度并进⾏细节设置color=black #刻度线颜⾊format=%d #标签数字格式,%d表⽰整数,%f浮点数label_offset=10p #标签和刻度之间的距离label_size=25p #标签⼤⼩show_label=yes #显⽰标签,标签值需按照multiplier计算size=15pspacing=10u #每10u出现⼀个刻度thickness=4p###其他基础设置include etc/colors.conf>>include etc/brewer.conf>>include etc/fonts.conf>>include etc/image.conf>>include etc/housekeeping.conf>>命令⾏绘图在安装软件之后,运⾏绘图命令,即可获得基础图⽚:/share/work/biosoft/circos/circos-0.69/bin/circos -conf config.txt --outputdir ./ -outputfile test。
[转载]Circos系列教程(四)连线
![[转载]Circos系列教程(四)连线](https://img.taocdn.com/s3/m/ce66e8876aec0975f46527d3240c844769eaa066.png)
[转载]Circos系列教程(四)连线 links原⽂地址:Circos系列教程(四)连线 links作者:王球爸这⼀节的⽬标是画出下⾯的图连线所谓连线,就是连接染⾊体组两个不同位置的线。
这是circos的最主要⽬的及⽤途之⼀。
circos流程图⾸先需要定义数据结构。
这⾥还需要第⼆节的关于染⾊体组型(karyotypes)数据结构的知识。
数据结构LABEL ID START END这⾥的LABEL是连线的名称,因为两点确定⼀条线,所以基本上连线的数据都是同⼀个名称出现两⾏数据,分别记录线两端对应的染⾊体组位置。
ID对应的是karyotypes数据⽂件当中的ID,start和end分别定义起始和终⽌的位置。
下⾯就是具体的例⼦:segdup00001 hs1 46530596segdup00001 hs2 114046768114076456segdup00002 hs1 48676975segdup00002 hs15 100263879100338121数据保存在⽂本⽂件当中就可以了,之后由conf⽂件调⽤。
当然这⼀数据⽂件可以更复杂,⽤于定义每条线的起⽌半径,⾊彩,以及宽度等等。
⽐如segdup00011 hs1 7109676975 thickness=5segdup00011 hs1 388076393885 thickness=5segdup00051 hs1 116091121750 color=bluesegdup00051 hs7 5582831255834013 color=bluesegdup00004 hs1 4869707 radius=0.8rsegdup00004 hsY 5776227657771573设置⽂件与之前⼀致的,我们需要设置好circos的设置⽂件,它需要包括前⼀节介绍的全部:circos.conf, ideogram.conf,和ticks.conf来定义⼀,数据源,⼆如何画染⾊体,三如何画坐标。
Circos:我其实真的没那么难画!

Circos:我其实真的没那么难画!引言大家好,我叫circos。
相信做生信的同学没有几个不认识我的吧,但我相信并不是每一个同学都画过我,对吧?我思考了一下,觉得原因无非有三:1) 完全没听过(好伤心); 2) 听过但不知道是干吗的(略感欣慰); 3) 听过也知道能干吗,但是不知道该怎么画(重点帮扶对象);针对这三个突出的问题,我将逐个击破,让你们彻彻底底地了(chong)解(bai)我。
好了,话不多说我们开始吧。
第一个问题和第二个问题的同学都认真听讲了哈, 我出生于2009年6月18号,当时是以一个资源工具类文章出现在Genome Research杂志上,而我已经多次出现在国际知名杂上,比如Nature, Science,Cell等。
截止到2017年9月,我的引用已经达到了2856次。
我的爸爸(第一作者)叫Martin Krzywinski, 你们可以叫他马丁或老马或更炫酷一点叫”Circos之父”,他是一个加拿大人,涉足生物信息学,数学,物理学最牛的是他还是一个专业摄影师,也正是因为他这些艺术细胞,才赋予了我这样绚丽多彩的表现形式。
下面请看看我的两个个人秀。
那么我到底能干什么呢?我主要用于基因组序列相关数据的可视化,比如甲基化,组蛋白修饰,snp,indel,sv,基因表达等。
不过目前已应用于多个领域,如影视作品中的人物关系分析,物流公司的订单来源和流向分析等等。
所以不是生信专业的同学也可以过来看看的。
铺垫了这么多,开始今天的重点---该如何画circos图?首先你得安装一个circos,不论你是windows系统还是linux系统,还没有安装的同学请自行度娘。
Circos图一圈一圈的看着很复杂,其实circos并没有想象中那么难画,知其然才知其所以然,搞懂了原理,其实真的很简单!大家都见过直角坐标系吧,坐标(x,y)就能在坐标系中找到唯一的一个点与之对应。
想象一下,把x轴两端向中间弯曲成一个圆,这不就是circos吗?是不是有点感觉了。
08.circos可视化手册-scatter plot篇

oritenation表示方向,in表示从r0到r1, out表示从r1到r0
在plot中,可以插入backgrounds, axes, rules3种block
1. backgrounds
用法如下:
backgrounds 定义背景色,每个定义一个区域的背景色,这个区域由y0和y1定义。
在plot中, max和min分别定义了y轴的最大值和最小值,这里的y0和y1对应的就是y轴的值;y0代表起始位置,y1代表终止位置;如果只指定了y0和y1中的一个,需要参考邻近区域和max,min的值作出判断
在上图的第一个background中,只指定了y0 = 0.006,从其他结果background的设置可以推测出,此时的y1 = max;
rules代表规则,由多个rule构成;在每个rule中,conditioon设置规则,var(value) > 0.006 表示 y轴的值大于0.006,当满足这个条件时,执行rule中的其他语句,下面的示例中,调整了value > 0.006的点的外观。
最后看一个实例
这张图中,除了染色体的圆环外,还有3圈圆环,每一个圆环都是一张scatter plot, 而且都设置了背景色和刻度线。
结合整幅图的结构和散点图的用法,理解下面的配置文件就非常简单了
<<include colors_fonts_patterns.conf>>
<<include ideogram.conf>>
<<include ticks.conf>>
<image>
<<include etc/image.conf>>。
circos填加纵坐标的参数

circos填加纵坐标的参数我们来了解一下circos的基本概念和用途。
circos是一种以环形布局的方式展示数据的可视化工具。
它适用于展示多个变量之间的关系,可以用于展示基因组的结构、基因表达、蛋白质互作等复杂数据。
circos图表通常由一系列环状的柱状图组成,每个柱状图代表一个变量,柱状图的高度表示该变量的值。
通过调整柱状图的颜色、宽度和位置等参数,可以更直观地展示不同变量之间的关系。
为了更好地展示数据,我们可以填加纵坐标的参数为标题。
标题可以用来描述柱状图所代表的变量,使读者更容易理解图表的含义。
例如,柱状图代表基因表达水平,那么可以将纵坐标的参数设置为“基因表达水平”,以便读者明确柱状图所表示的内容。
填加纵坐标的参数为标题可以提供更多的信息,帮助读者更好地理解数据。
在circos中填加纵坐标的参数为标题可以通过在配置文件中进行设置实现。
配置文件是circos绘图的重要组成部分,其中包含了绘图所需的各种参数。
在配置文件中,我们可以指定纵坐标的参数,并将其设置为标题。
例如,可以使用如下代码将纵坐标的参数设置为“基因表达水平”:```conf<axes><axis>...<label>position = outsidethickness = 50psize = 30pcolor = blackfont = defaultauto = yesparallel = yesorientation = outformat = %drule_thickness = 2p prefix = ""suffix = ""show_label = yeslabel_size = 30plabel_parallel = yes label_font = default label_color = black label_offset = 5plabel_position = edge label_format = %dlabel_case = uppermin = 0max = 100grow = 0spacing = 0.1uaxis_color = blackaxis_thickness = 2paxis_offset = 0paxis_spacing = 0paxis_rules = 1axis_rule_color = black axis_rule_thickness = 2p axis_rule_offset = 0paxis_rule_spacing = 0p axis_rule_length = 10p axis_rule_thickness = 2p axis_rule_color = black axis_rule_offset = 0paxis_rule_spacing = 0p axis_rule_length = 10p axis_rule_thickness = 2p axis_rule_color = blackaxis_rule_offset = 0paxis_rule_spacing = 0paxis_rule_length = 10p</label></axis></axes>```在上述代码中,我们通过设置label的参数来填加纵坐标的标题。
RCircos包绘制染色体模式图_2020-04-01

RCircos包绘制染色体模式图_2020-04-01 ## 1.设置当前工作目录setwd("./RCircos")## 2.安装和导入R包:RCircos# install.packages("RCircos")library("RCircos")## 3.RCircos包简要信息### 3.1 DESCRIPTION# Package: RCircos# Type: Package# Title: Circos 2D Track Plot# Version: 1.2.1# Date: 2019-03-10# Author: Hongen Zhang#Maintainer:HongenZhang<**********************># Description: A simple and flexible way to generate Circos 2D track plot images for genomic data visualization is implemented in this package. The types of plots include: heatmap, histogram, lines, scatterplot, tiles and plot items for further decorations include connector, link (lines and ribbons), and text (gene) label. All functions require only R graphics package that comes with R base installation.# License: GPL (>= 2)# Depends: R (>= 2.10)# NeedsCompilation: no# Packaged: 2019-03-12 16:32:41 UTC; hzhang# Repository: CRAN# Date/Publication: 2019-03-12 21:06:27 UTC# Built: R 3.6.0; ; 2019-05-28 21:23:44 UTC; windows### 3.2 MAIN FUNCTIONls(package:RCircos)# [1] "RCircos.Adjust.Scatter.Values"# [2] "RCircos.Area.Highlight"# [3] "RCircos.Area.Plot"# [4] "RCircos.Chromosome.Ideogram.Plot"# [5] "RCircos.Clear.Track"# [6] "RCircos.Clear.Zoom.Area"# [7] "RCircos.Customized.Connection.Plot"# [9] "RCircos.Data.Point"# [10] "RCircos.defaultBasePerUnits"# [11] "RCircos.defaultCharWidth"# [12] "RCircos.defaultChromPadding"# [13] "RCircos.defaultCircosUnits"# [14] "RCircos.defaultTextSize"# [15] "RCircos.Draw.Chromosome.Ideogram" # [16] "RCircos.Env"# [17] "RCircos.Gene.Connector.Plot"# [18] ".Plot"# [19] "RCircos.Get.Arrow.Shape"# [20] "RCircos.Get.Chromosome.Order"# [21] "RCircos.Get.Data.Point.Height"# [22] "RCircos.Get.Default.Base.Per.Units"# [23] "RCircos.Get.Default.Char.Width"# [24] "RCircos.Get.Default.Chrom.Padding"# [25] "RCircos.Get.Default.Circos.Units"# [26] "RCircos.Get.Default.Text.Size"# [27] "bel.Locations"# [28] ".Plot.Parameters" # [29] "RCircos.Get.Heatmap.Color.Scale"# [30] "RCircos.Get.Heatmap.Color.Scale.Location" # [31] "RCircos.Get.Heatmap.Data.Colors"# [32] "RCircos.Get.Link.Colors"# [33] "RCircos.Get.Padding.Constant"# [34] "RCircos.Get.Paired.Points.Positions"# [35] "RCircos.Get.Plot.Boundary"# [36] "RCircos.Get.Plot.Colors"# [37] "RCircos.Get.Plot.Ideogram"# [38] "yers"# [39] "RCircos.Get.Plot.Parameters"# [40] "RCircos.Get.Plot.Positions"# [41] "RCircos.Get.Polygon.Height"# [42] "RCircos.Get.Single.Point.Positions"# [43] "RCircos.Get.Start.End.Locations"# [44] "RCircos.Get.Supported.HeatmapColors"# [49] "RCircos.Heatmap.Plot"# [50] "RCircos.heatmapColors"# [51] "RCircos.Highligh.Chromosome.Ideogram" # [52] "RCircos.Histogram.Plot"# [53] "RCircos.Ideogram.Tick.Plot"# [54] "RCircos.Initialize.Plot.Parameters"# [55] "s"# [56] "bel.Zoom.Region"# [57] "RCircos.Line.Plot"# [58] "RCircos.Link.Line"# [59] "RCircos.Link.Plot"# [60] "RCircos.List.Plot.Parameters"# [61] "RCircos.Mark.Zoom.Area"# [62] "ponents" # [63] "RCircos.Multiple.Species.Dataset"# [64] "RCircos.paddingConst"# [65] "RCircos.Parallel.Line.Plot"# [66] "RCircos.Plot.Heatmap.Color.Scale"# [67] "RCircos.Plot.Zoomed.Area"# [68] "RCircos.Plot.Zoomed.Continue.Lines"# [69] "RCircos.Plot.Zoomed.Gene.Connectors" # [70] "RCircos.Plot.Zoomed.Heatmap"# [71] "RCircos.Plot.Zoomed.Histogram"# [72] "RCircos.Plot.Zoomed.Ideogram.Ticks"# [73] "RCircos.Plot.Zoomed.Parallel.Lines"# [74] "RCircos.Plot.Zoomed.Polygons"# [75] "RCircos.Plot.Zoomed.Scatters"# [76] "RCircos.Plot.Zoomed.Tiles"# [77] "RCircos.Plot.Zoomed.Vertical.Lines"# [78] "RCircos.plotTypes"# [79] "RCircos.Point.Plot"# [80] "RCircos.Polygon.Plot"# [81] "bels"# [86] "RCircos.Ribbon.Plot"# [87] "RCircos.Scatter.Plot"# [88] "RCircos.Set.Base.Plot.Positions"# [89] "ponents"# [90] "RCircos.Set.Cytoband.Data"# [91] "RCircos.Set.Plot.Area"# [92] "RCircos.Set.Zoom.Plot.Positions"# [93] "RCircos.Sort.Genomic.Data"# [94] "RCircos.Tile.Plot"# [95] "RCircos.Track.Outline"# [96] ""# [97] "RCircos.Validate.Genomic.Data"# [98] ""# [99] "RCircos.Validate.Plot.Parameters"# [100] "RCircos.Validate.Track.Positions"# [101] "RCircos.Vertical.Line.Plot"# [102] "RCircos.Workflow"# [103] "RCircos.Zoom.Area.Outline"# [104] "RCircos.Zoom.Paired.Plot.Positions"# [105] "RCircos.Zoom.Single.Plot.Positions"# [106] "RCircos.ZoomIn.Chromosome"# [107] "RCircos.ZoomOut.Chromosome"## 4.导入测试数据以及绘制复合染色体模式图(Circos)#@ 导入测试数据data(RCircos.Histogram.Data)head(RCircos.Histogram.Data)# Chromosome chromStart chromEnd Data# 1 chr1 45000000 49999999 0.070859# 2 chr1 55000000 59999999 0.300460# 3 chr1 60000000 64999999 0.125421# 4 chr1 70000000 74999999 0.158156# 5 chr1 75000000 79999999 0.163540# 6 chr1 80000000 84999999 0.342921head(RCircos.Heatmap.Data)# Chromosome chromStart chromEnd GeneName X786.O A498 # 1 chr1 934341 935552 HES4 6.75781 7.38773# 2 chr1 948846 949919 ISG15 7.56297 10.49590# 3 chr1 1138887 1142089 TNFRSF18 4.69775 4.55593# 4 chr1 1270657 1284492 DVL1 7.76886 7.52194# 5 chr1 1288070 1293915 MXRA8 4.49805 4.72032# 6 chr1 1592938 1624243 SLC35E2B 8.73104 8.10229# A549.ATCC ACHN BT.549 CAKI.1# 1 6.47890 6.05517 8.85062 7.00307# 2 5.89893 7.58095 12.08470 7.81459# 3 4.38970 4.50064 4.47525 4.47721# 4 6.87125 7.03517 7.65386 7.69733# 5 4.62207 4.58575 5.66389 4.93499# 6 8.36599 9.04116 9.24175 9.89727data(RCircos.Link.Data)head(RCircos.Link.Data)# Chromosome chromStart chromEnd Chromosome.1 chromStart.1 # 1 chr1 8284703 8285399 chr1 8285752# 2 chr1 85980143 85980624 chr7 123161313# 3 chr1 118069850 118070319 chr1 118070329# 4 chr1 167077258 167077658 chr1 169764630# 5 chr1 171671272 171671550 chr1 179790879# 6 chr1 174333479 174333875 chr6 101861516# chromEnd.1# 1 8286389# 2 123161687# 3 118070689# 4 169764965# 5 179791292# 6 101861840data(UCSC.HG19.Human.CytoBandIdeogram);head(UCSC.HG19.Human.CytoBandIdeogram);# Chromosome ChromStart ChromEnd Band Stain# 1 chr1 0 2300000 p36.33 gneg# 2 chr1 2300000 5400000 p36.32 gpos25# 4 chr1 7200000 9200000 p36.23 gpos25# 5 chr1 9200000 12700000 p36.22 gneg# 6 chr1 12700000 16200000 p36.21 gpos50data(UCSC.Mouse.GRCm38.CytoBandIdeogram);head(UCSC.Mouse.GRCm38.CytoBandIdeogram);# Chromosome ChromStart ChromEnd Band Stain# 1 chr1 0 8840440 qA1 gpos100# 2 chr1 8840440 12278390 qA2 gneg# 3 chr1 12278390 20136559 qA3 gpos33# 4 chr1 20136559 22101102 qA4 gneg# 5 chr1 22101102 30941543 qA5 gpos100# 6 chr1 30941543 43219933 qB gnegdata(UCSC.Baylor.3.4.Rat.cytoBandIdeogram);head(UCSC.Baylor.3.4.Rat.cytoBandIdeogram);# Chromosome ChromStart ChromEnd Band Stain# 1 chr1 0 10142096 p13 gneg# 2 chr1 10142096 24272657 p12 gvar# 3 chr1 24272657 38517175 p11 gneg# 4 chr1 38517175 48659271 q11 gpos# 5 chr1 48659271 69741157 q12 gneg# 6 chr1 69741157 90025350 q21 gposchr.exclude <- NULL; <- UCSC.HG19.Human.CytoBandIdeogram;tracks.inside <- 10;tracks.outside <- 0;ponents(, chr.exclude, tracks.inside, tracks.outside); RCircos.Reset.Plot.Parametersrcircos.params <- RCircos.Get.Plot.Parameters();rcircos.cyto <- RCircos.Get.Plot.Ideogram();rcircos.position <- RCircos.Get.Plot.Positions();RCircos.List.Plot.Parameters()rcircos.params <- RCircos.Get.Plot.Parameters();rcircos.params$base.per.unit <- 3000;RCircos.Reset.Plot.Parameters(rcircos.params);RCircos.List.Plot.Parameters();### 4.1 Initialize Graphic Devicefiles supported by R graphics package such as tiff, png, pdf images as well as GUI windows. For example, to make a pdf file with RCircos plot image:out.file <- "RCircosDemoHumanGenome.pdf";pdf(file=out.file, height=8, width=8, compress=TRUE);RCircos.Set.Plot.Area();#@ RCircos.Set.Plot.Area() will setup plot area base on total number of tracks inside and outside of chromosome ideogram. User can also setup plot area by summit the R plot commands for user defined plot area, for example:par(mai=c(0.25, 0.25, 0.25, 0.25));plot.new();frame()plot.window(c(-2.5,2.5), c(-2.5, 2.5));#@ After everything is done, the graphic device needs to be closed with dev.off()### 4.2 Plot Chromosome Ideogram#@ For RCircos plot, a common first step is to draw chromosome ideograms and label chromosomes with names and highlights. After the RCircos core components were initialized and graphic device was open, simply call the function ofRCircos.Chromosome.Ideogram.Plot() will add the chromosome ideogram to the current plot. RCircos.Chromosome.Ideogram.Plot();### 4.3 Gene Labels and connectors on RCircos Plot#@ Due to the resolution issues, only limited number of gene names can be labeled. For best visualization, cex should be no less than 0.4 when draw gene labels.data(bel.Data);name.col <- 4;side <- "in";track.num <- 1;RCircos.Gene.Connector.Plot(bel.Data, track.num, side);track.num <- 2;.Plot(bel.Data, name.col,track.num, side);### 4.4 Heatmap, Histogram, Line, Scatter, and Tile Plot#@ Heatmap, histogram, line, scatter, and tile plot with RCircos require that the first three columns of input data are genomic position information in the order of chromosome name, start, and end position.data(RCircos.Heatmap.Data);data.col <- 6;track.num <- 5;side <- "in";RCircos.Heatmap.Plot(RCircos.Heatmap.Data, data.col, track.num, side);data(RCircos.Scatter.Data);side <- "in";by.fold <- 1;RCircos.Scatter.Plot(RCircos.Scatter.Data, data.col, track.num, side, by.fold);data(RCircos.Line.Data);data.col <- 5;track.num <- 7;side <- "in";RCircos.Line.Plot(RCircos.Line.Data, data.col, track.num, side);data(RCircos.Histogram.Data);data.col <- 4;track.num <- 8;side <- "in";RCircos.Histogram.Plot(RCircos.Histogram.Data, data.col, track.num, side);data(RCircos.Tile.Data);track.num <- 9;side <- "in";RCircos.Tile.Plot(RCircos.Tile.Data, track.num, side);### 4.5 Links: A Special Plot#@ Links presents relationship of two genomic positions and it is always the last track inside chromosome ideogram. Different from other data plots, input data for links plot is a data frame with paired genomic positions in the order of chromosome, start, and end position for each one genomic position.data(RCircos.Link.Data);track.num <- 11;RCircos.Link.Plot(RCircos.Link.Data, track.num, TRUE);data(RCircos.Ribbon.Data);RCircos.Ribbon.Plot(ribbon.data=RCircos.Ribbon.Data, track.num=11,by.chromosome=FALSE, twist=FALSE);dev.off();### 4.6 More Informationdemo("RCircos.Demo.Human");demo("RCircos.Demo.Mouse.And.Rat");## 5.结束sessionInfo()# R version 3.6.3 (2020-02-29)# Platform: x86_64-w64-mingw32/x64 (64-bit)## Matrix products: default## locale:# [1] LC_COLLATE=Chinese (Simplified)_China.936# [2] LC_CTYPE=Chinese (Simplified)_China.936# [3] LC_MONETARY=Chinese (Simplified)_China.936# [4] LC_NUMERIC=C# [5] LC_TIME=Chinese (Simplified)_China.936## attached base packages:# [1] stats graphics grDevices utils datasets methods # [7] base## other attached packages:# [1] RCircos_1.2.1## loaded via a namespace (and not attached):# [1] compiler_3.6.3 tools_3.6.3 packrat_0.5.0。
turtle.circle()用法

turtle.circle()用法turtle.circle()是turtle模块中一个非常重要的方法,可以用它绘制环形。
turtle.circle(radius, extent, steps=None)circle()方法有3个参数:1. radius:绘制的圆的半径,半径必须是数字。
2. extent:绘制弧形的角度,可以是正数或负数,1度=pi/180。
默认绘制整个圆形360度,如果extent<360度,则会绘制一个扇形或弧形。
3. steps:可选参数,指定每个角的边数,如果未指定,则自动选择一个合适的值。
下面是一些常见的代码示例:1.绘制一个半径为50的圆形:import turtleturtle.begin_fill()turtle.circle(50,240)turtle.end_fill()4.绘制一个正多边形的内切圆:6.绘制一个星形:import turtledef draw_star(x, y, color, radius):turtle.penup()turtle.setposition(x, y)turtle.pendown()turtle.color(color)angle = 120turtle.begin_fill()for side in range(6):turtle.forward(radius)turtle.right(angle)turtle.forward(radius)turtle.right(2 * angle)turtle.end_fill()draw_star(-100, 0, "red", 50)draw_star(100, 0, "blue", 50)其中,draw_star()方法用来绘制一个星形,接收4个参数:x和y为起始位置,radius为半径,color为颜色,需要事先定义好。
- 1、下载文档前请自行甄别文档内容的完整性,平台不提供额外的编辑、内容补充、找答案等附加服务。
- 2、"仅部分预览"的文档,不可在线预览部分如存在完整性等问题,可反馈申请退款(可完整预览的文档不适用该条件!)。
- 3、如文档侵犯您的权益,请联系客服反馈,我们会尽快为您处理(人工客服工作时间:9:00-18:30)。
R语言作Circos图之进阶篇:圈圈套圈圈的法门
R语言作Circos图之进阶篇:圈圈套圈圈的法门原创2017-01-05 医生科研助手解螺旋解螺旋微信号HelixLife 功能介绍解螺旋——医生科研最好的帮手。
无论你是科研零基础,抑或初窥门径,你都可以在解螺旋获得极大的提升,从而面对基金、论文、实验游刃有余。
解螺旋课堂是所有热爱科研技能学习的医生聚集地,解螺旋会员是医生科研全方位的贴心助手,加入我们,体验改变。
上回我们简单介绍了R语言作Circos图的基本数据形式和方法,也谈到圈圈套圈圈意味着函数套函数、甚至是数据表的复杂组合。
今天我们就从数据类形进一步探索怎么个套法。
复习请进→_→《作Circos图不用学Perl了,我们有R!》circlize包的一大特点就是可以用高级函数把低级函数组织起来,形成圈圈布局的图,每个圈、每个板块里都是我们曾经很熟悉的点图、线形图、柱形图等等。
像circos. genomicInitialize()、circos.genomicTrackPlotRegion()这样用于组织布局的就是高级函数,像circos.genomicPoints()、circos.genomicLines()、circos.genomicRect()这样用来在每个圈、每个板块中填充内容的就是低级函数。
嵌套的基本思路是这样的:
circos.genomicInitialize(数据表名称)
circos.genomicTrackPlotRegion(数据表名称,
ylim=c(n1,n2),panel.fun = function(region,value,…) {circos.genomicPoints(region, value, pch = 16, cex = 0.5) })
circos.clear()
其中,最关键的就是circos.genomicTrackPlotRegion和panel.fun,处理好它俩就能升一个境界。
它们在不同的数据组织形式里的具体应用也有所不同,下面我们就按数据的组织形式来扒一扒。
circos.genomicTrackPlotRegion用来生成新的圈;
panel.fun=function(region,value,…)则是一个自定义的函数,Region是板块的起始点和终止点,value则是描述Y轴上的值。
在它后面的{}中便可嵌入各种低级函数。
ylim()括号中的两个数,就是Y轴的范围,方向是从圆心向外,即,假如我们数据的范围是3~57,那么设ylim=c(0,60),则靠近圆心为y轴的0,外层为60,以此安排点的分布。
X 轴默认为顺时针方向。
Circos中,数据的基本形式是由3个列组成的表格,第1列决定一个圈分为哪几个板块,第2列是板块的起点,第3列是止点,这就叫BED格式,只能画一个原始的圈。
我们上回演示的简单数据和原始圈,包括第一个使用
circos.genomicTrackPlotRegion来生成的颜色标识圈:要把数
据搞大,有几种方式,一是增加行,一是增加列,还有一种是把好几个数据框(data frame)组成一个列表(list)。
显然,能让图形变得更复杂更有趣的是后两种。
一、单个数据表
在原来的BED表中加入其他列,以数值形式呈现,比如找到的CNV、SNP数量等等,这样我们作图的素材还是单个数据表。
在R中运行circos.initializeWithIdeogram()会默认调用UCSC 基因库中hg19的cytoband文件,在Excel里观察它的结构是这个样子的:前三列就是基本格式,后面虽然还有两列,但显然不是“数值型”。
生成的原始圈是以它为框架的,后面的染色标识则生成了第一圈,图形长这样:要往里面添加内容,随机生成一个Bed来看看:
bed=generateRandomBed(nc=1),nc是指除了前三列之外的数值型列数。
它的第一列和原始圈那张表的第一列有对应的内容。
后面的value1就是随具体课题而定的数值型变量。
在这样的单一数据框中,上面说的关键函数之一,panele.fun=function(region,value,…)里的region显然就是指start和end两列,value就是指多出来的那些数值型的列了,就是这里的value1。
于是可以嵌个低级函数了,就用散点图演示吧:
circos.genomicTrackPlotRegion(bed, track.height=0.1,ylim =
c(-1,1), panel.fun = function(region, value, ...)
{ circos.genomicPoints(region, value, pch = 16, cex =
0.1,...)})track.height是指圈的高度,以原始圈半径的比例来计算,此处0.1就是半径的10%;Pch和cex是点的样式,在RStudio的Help里可以搜到具体的样式代号。
二、数据列表
如果把一组数据表组成一个列表(list),panel.fun则迭代用于各个数据表。
再随机生成一个list来观察它的结构:bedlist = list(bed01=generateRandomBed(nc=1,nr=200),
bed02=generateRandomBed(nc=1,nr=200))
这里用nc和nr控制一下列和行的数量,不要像上面那样1万多行做出个密恐图。
nc是指除了前三列之外的数值型列数;但nr就比较随缘,最后生成的行数可能并不是我们设的200,对此,circlize包的作者也只是提醒,并没有解释。
就这样吧,反正除了做练习,应该也不大会用到随机生成数据的方法。
就这样,bed01和bed02是互有联系的两个数据框,它们的第1列也有相同的内容。
还可以观察到两个表每行的起止点并不一样,这是因为起止点不是对第1列负责,而是对应后面的数值。
然后再生成点图:
circos.genomicTrackPlotRegion(bedlist,track.height=0.1,ylim = c(-1,1), panel.fun = function(region, value, ...) { i =
getI(...)circos.genomicPoints(region, value,pch = 16, cex =
0.1,col = i, ...)})这段代码里,panel.fun的{}中,比单一数据表那里多了一个i=getI(...),circos.genomicPoints里也相应地多了一个col = i,这俩是什么意思呢?任性的Help是这么说的:所以就是“憋说话,加我”的意思嘛╮(╯▽╰)╭
其实也可以理解为,一个list中有多个数据表,getI可以用来找到当前所用的表格中对应的数值型列。
去掉这个不明觉厉的getI和col = i,生成下图中最里面那圈,图里就少了一组数据了。
如果表里有多个数值列,就可以用numeric.column 来控制想要输出哪一列,像这段代码:
circos.genomicTrackPlotRegion(bedlist,track.height=0.1,ylim = c(-1,1),numeric.column = c(4, 5),panel.fun = function(region, value, ...) { circos.genomicPoints(region, value,pch = 16, cex = 0.1, ...)})
就比上面多了一个numeric.column = c(4, 5),是指第一个表中的第4列和第二个表中的第5列。
也就是说,每生成一个圈,都只能用到各个表中的1个列。
本例的低级函数只用了circos.genomicPoints(),但其他的circos.genomicLines()、circos.genomicRect()都大同小异,大家可以自行探索。
还是多多练习
circos.genomicTrackPlotRegion和panel.fun的用法吧。
阅读精选留言该文章作者已设置需关注
才可以留言写留言该文章作者已设置需关注才可以
留言写留言加载中以上留言由公众号筛选后显示了解留言功能详情微信扫一扫
关注该公众号。
