海豚基因流2
暗纹东方鲀SRAP-PCR体系的建立与优化
ht:/ w .jybc t / w w z x .n p n
程长洪 , 张敏莹 , 刘凯 , 等.暗纹东方鲍 S A —C R PP R体 系的建立与优化 [ ] 浙江农业 学报 ,0 12 ( ) 18 1 8 . J. 2 1 ,3 6 :04— 0 9
1 材料 与方法
1 1 材料 和试剂 .
2 结果 与分析
2 1 正交试 验 结果及 分析 .
本试 验所 用 的暗 纹 东方 纯 样 本 于 2 1 00年 7 月份 采 自长 江 常 熟 江 段 , 存 于 无 水 乙 醇 (一 保 2 ℃) 0 备用 。 Tq酶 、 n 、N P 等 试 剂 均 购 自 a Mg d T s P R产 物 电泳 结 果 如 图 1所 示 。对 P R扩 C C 增 结果 由高到低 依次 打分 , P R产物 电泳 图条 将 C
本 研究 利 用 正 交 设 计 对 暗 纹 东 方 纯 S A — R P
表 1 P R反 应 的 因 素 与水 平 C
Ta l F c o sa d l v l o C e c in b e1 a t r n e es fP R r a t o
P R反应体系进行优化 , C 确立 了较为可靠的反应 体 系并对部分材料进行扩增 , 该体系的建立为今 后 SA R P分子标记在暗纹东方纯遗传多样性分 析、 遗传图谱构建、 种质资源鉴定及亲缘关 系分 析等方面的研究提供了较为可靠的技术指导 。
~
、
引物 0 2I o・L一。利用 3 暗纹 东方鲍样本对该体 系进行验证 , . m l x 0个 结果 表明该体 系稳定 可靠 。
进化生物学概述

Charles Darwin
Charles Darwin
达尔文
(1809-1882)
The Struggle for existence
Observation 1:
Populations sizes would increase exponentially if all individuals born survived. Observation 2: Most populations are stable in size. Observation 3: No two individuals in a population are exactly the same. Observation 4: Much of this variation is heritable
进化生物学
综合进化理论
(Dobzhansky, Mayr, Simpson, Stebbins)
进化 = 遗传变异 + 变异的不均等传递 + 物种形成
突变 重组 基因流
选择
遗传漂变
隔离
进化生物学
进化生物学的基本研究内容
进化 = 遗传变异 + 变异的不均等传递 + 物种形成
突变 重组 基因流
选择
--- what ?
系统发育重建 (Phylogeny)
detect evolution at work, discovering its processes and interpreting its results
--- how ? --- why ? why ?
进化的过程和机制 (Evolution)
进化生物学
瓶颈效应 (bottlenect effect) Nhomakorabea
lesson nine the origin of species
种族中个体可以互相交配,但种间不能。这种繁殖隔 离的一个优势是很精确。
Notice, however, that it can only be applied to organisms that reproduce sexually. Asexual reproducers, including most prokaryotes, many plants, and some animals, must be classified into species on the basis of physical (biochemical or morphological形态学) traits.
Sometimes the differences that produce prezygotic isolation involve mechanical isolation. That is, mating is physically impossible between members of different species because genitals of males and females are structurally incompatible or because molecules on the surfaces of sperm and egg fail to bind. 有时,产生前合子隔离的差异涉及了隔离机制。即, 由于生殖器结构不匹配或精卵分子表面不结合而使不 同种群成员间不能自然结合。
macroevolution:大进化
又称宏观进化,指物种和种以上的高级分类 群在地质时间尺度上的进化模式、进化趋势 和进化速率。
Microevolution:微进化 由突变,遗传漂变,基因流和自然选择导致的 等位基因频率的改变
瓶鼻海豚、中华白海豚和糙齿海豚线粒体16SrRNA基因的序列分析
( .中国水产科学研究 院南海水产研究所 ,广东 广州 50 0 1 130;2 .上海水产大学 ,上海 2 09 ) 0 0 0
摘要 :采用聚合酶链式反应 ( C P R)技 术扩增瓶 鼻海豚 、中华 白海 豚和糙齿海 豚的线粒体 D A 1Sr N N 6 R A基 因,
科相聚 。淡水豚总科为一并系群并处于整个鲸豚类的基部 ,其 中恒河豚科是最早 分化 的一支 。但 在海豚总科 中, 鼠海豚科 的江豚则与一角鲸科 的白鲸聚合一起 ,与形态分类不 同。 关键 词:海豚 ;1 Sr N 6 A;序列 分析 ;分子 系统学 R 中图分类 号:Q 8 75 文献标识码 :A 文章编号 :17 2 2 6 3— 27一 ( 0 7 4 — 0 8— 8 20 )0 0 3 0
2 h n h i i e e U i rt, h n h i 0 00, hn ) .S ag a s r s nv sy S ag a 0 9 C ia F h i e i 2
Ab t a t sr c :Mi c o d a 6 RN e e fa me t wee a l e r m op i s T ri s t n a u ,S u a c i n i a d Se o b e t h n fl 1 S r A g n rg ns r mp i d fo d l h n u s p r e ts o s h n s s n tn r— o i i f o u e d n n i u i gP R c n q e h CR p o u t e e a o t 0 p a d w r i cl e u n e u s q e t .F n l 5 5, 1 n a s s sn C t h i u .T e P r d csw r b u 0 b n e ed r t s q e c d s b e u n l e e 6 e y y i al y, 1 5 9 a d 5 9 b n mbg o sn ce t e s q e c swee o t ie e p cie y atre cu i gt e p i r e u n e .T e a e a e b s o o i 2 p u a iu u u loi e u n e r b an d r s e t l f x ld n h rme q e c s h v rg a e c mp s— d v e s
15专题十五 生物的进化专题检测题组1学生卷

专题十五生物的进化专题检测题组1( )1.(2022届河南名校联盟联考,14)科学家通过对大量恐龙化石进行分析后发现,非鸟恐龙多样性从7 600万年前就已经开始下降。
他们认为,这种下降与较古老物种灭绝速率上升有关,这说明恐龙难以适应变化的环境。
而小行星撞击地球以及全球气候变冷则加剧了恐龙灭绝的过程。
下列有关叙述正确的是A.非鸟恐龙多样性下降的过程中恐龙没有发生进化B.非鸟恐龙的灭绝说明自然选择直接作用的是基因C.非鸟恐龙多样性的下降加速了非鸟恐龙的灭绝D.非鸟恐龙的进化速度太过缓慢导致其最终灭绝( )2.(2022届河南六市重点高中联考,23)到20世纪30年代,关于生物进化过程中遗传和变异的研究,已经从性状水平深入到分子水平,逐渐形成了以自然选择学说为基础的现代生物进化理论,从而极大地丰富和发展了达尔文的自然选择学说。
下列关于现代生物进化理论的叙述,正确的是A.生物进化的单位是种群,而不是个体B.生物进化的实质是种群基因型的改变C.生殖隔离的形成一定经过地理隔离D.可遗传和不可遗传的变异均是生物进化的原材料( )3.(2022届河南名校联盟联考,23)我国是最早养殖和培育金鱼的国家。
金鱼的祖先是野生鲫鱼,经过人们不断的杂交和人工选择等过程,才出现了色彩斑斓、形态各异的金鱼,这极大地丰富了人们的生活。
下列有关说法正确的是A.金鱼培育过程中会发生定向的可遗传变异B.金鱼培育过程中出现了进化,进化的方向是由人工选择决定的C.金鱼和野生鲫鱼在形态上差异极大,因此属于不同物种D.新色彩或新形态的出现不会改变种群的基因库( )4.(2022届河南六市重点高中联考,15)英国科学家格兰特夫妇在达夫尼岛上开展了对两种地雀——强壮地雀和大钩鼻喙地雀的观察。
已知强壮地雀的喙较小,只适合于取食较小的坚果;大钩鼻喙地雀有大的喙,主要取食大坚果。
1976年6月至1978年初,达夫尼岛上发生干旱,强壮地雀种群个体数目由1 200个下降到180个左右,雌雄比例为1∶5,且喙小的类型死亡率高于喙大的类型。
生物学导论biology13综述
Geographic isolation
Different species orGeographic barriers
• Geographic barriers 地理屏障: geographic features that keep the different portions of the species from exchanging genes, for example mountains, rivers, etc.
Three-step process of speciation
• Geographic isolation • Action of selective agents that choose specific genetic combinations as being valuable • Genetic differences becoming so great that reproduction between two groups is impossible
• • • • Habitat preference or ecological isolation Seasonal isolation Behavioral isolation Mechanical or morphological isolation: insects (lock and key)
Darwin-Wallace theory
• In each generation, more giraffes would be born than the food supply could support • In each generation, some giraffes would inherit longer necks and some would inherit shorter necks • All giraffes would compete for the same food sources
海洋生物多样性调查技术考核试卷

14.下列哪些因素可能导致珊瑚礁生态系统的退化?()
A.海水温度上升
B.珊瑚白化
C.污染物排放
D.过度潜水观光
15.以下哪些措施可以减少海洋生物多样性丧失的风险?()
A.实施海洋保护区网络
B.推广可持续的海产品标签
C.加强海洋环境监测
D.增加海洋科研资金
16.下列哪些生物过程对海洋生物多样性的维持至关重要?()
11.下列哪些行为有助于保护海洋生物多样性?()
A.减少塑料使用
B.提倡可持续渔业
C.保护海滩和沿海栖息地
D.增加海洋石油开采
12.以下哪些生物是海洋生物链中的重要组成部分?()
A.磷虾
B.鲸鱼
C.硅藻
D.鳕鱼
13.海洋生物多样性调查中,以下哪些工具或设备用于样本采集?()
A.拖网
B.水下无人机
C.潜水装备
A.拖网捕捞
B.显微镜观察
C.声纳探测
D.卫星遥感
6.以下哪个海域的生物多样性最为丰富?()
A.北冰洋
B.珊瑚海
C.智利海沟
D.黑海
7.下列哪种海洋生物是滤食性动物?()
A.鲸鱼
B.章鱼
C.螃蟹
D.水母
8.在海洋生物多样性的调查中,以下哪个指标可以反映生物群落结构的复杂性?()
A.生物量
B.物种丰富度
海洋生物多样性调查技术考核试卷
考生姓名:答题日期:得分:判卷人:
一、单项选择题(本题共20小题,每小题1分,共20分,在每小题给出的四个选项中,只有一项是符合题目要求的)
1.海洋生物多样性的研究主要依赖于以下哪项技术?()
A.遥感技术
B.基因测序技术
条纹原海豚mtDNA控制区序列变异分析
R sac )D eerh NA扩增仪 和 3 0型全 自动遗 传分 析仪 1
( p ldBoyt le ) 上 进 行 。 A p e i s m n . i s e 序 列 结 果 用 C US L 软 件 ( h mpo t L TA T o sn e
.
(o t le i cnr go o r n或 D l p — o )以其母 系遗 传 、无 重 组 、 o
进 化 速 率 快 等 特 点 ,已成 为 应 用 序 列 比 较 法 研 究 动 物 种 群 遗 传 学 问 题 的 首 选 基 因 ( o ta . R lle 1 . 19 ; 光 等 ,19 ) 我 们 测 定 了 l 95 杨 97 。 3头 条 纹 原 海 豚 的 控 制 区 全 序 列 , 初 步 分 析 中 国 台湾 海 峡 及 其 附 近 水 域 条 纹 原 海 豚 的 序 列 变 异 及 种 群 结 构 ,以期 为 其保 护 和管理 提供 必要 的种群遗 传学 资料 :
维普资讯
动 物学报
4 ( ) 1 1 14,2 0 8 1:3 ~ 3 02
Aca Z oo c n c t o lgia Si ia
条 纹 原 海 豚 mt A 控 制 区序 列 变 异 分 析 DN
杨 光 任 文华 钮 明华 周开亚
测 定 。 测 序 反 应 用 Pi rn s Bg y T r n tr iD e emia o R a y R at n 试 剂 盒 ( pi i ytm Ie ) ed eci o Ap l d Bo s n . e s e 在 P 2 0 ( ekn E n r) 或 P C 2 0 型 ( J E 4 0 P ri h es T 0 M
条 纹 原 海 豚 ( t e aceueab 是 一 种 暖 Se l or l l n l u a) 水性 的小 型鲸类 , 5。 在 0N~4 0s之 问 有 分 布 . 其 在 分 布 区 内 的许 多 水 域 ,均 受 到 渔 业 误 捕 或 直 接 捕 捞 的 影 响 (ef sne a . 9 3 。 但 由 于 缺 乏 该 物 Jf ro t 1 ,19 ) e
暗纹东方魨中BAFF基因相关序列的性质探讨
中图分类号
¥6 . 9 951 9文献标 识码 NhomakorabeaA
文章编 号
0l— 612O) — 41一 5 6l( 8 1 00l ∞ 7 0 0
osuu bcrs
Dsus no l P o et s fteR ltdS e c o& F G m 勋幼 i si n Ue rpri h e e mun et c o eo a e i n
维普资讯
安徽农业科学 。ora o A hi .c.08 3 (0 :0 1 0 3 Junl f nu A Si 0 。6 1)4 1 —4 1 2
责任编辑
陈玉敏
责任校对
马君叶
暗纹 东方触 中 B F A F基 因相 关序 列. 的性质 探讨
we ein codig t esq e csi egn mi irr fTkfg f e .oa e r d sg e ac r n ot e u n e t e o cl ayo a i u mb p s T tlDNA wa xr ce o temucesmpe f l o su d h nh b u i se t t f m sl a lso wi T. bc — a d r h d
wiltesz f 2,3 9。2 lb t h ieo 5 } 4 4 2 p.T es i fa me t t 2 b  ̄ 3e c s o u di eg n mi irr fT.r r h ut rg n h 5 p, . newa n to n t e o el ayo d e wi 4 1 f n h b  ̄ / ms.S q e cswi esz e u n e t t ie h h
海豚的组织转运批文

离子反应离子方程式教学目标知识技能:掌握化学反应的实质,理解离子反应及离子方程式的意义;根据化学反应发生的条件对比掌握离子反应发生的条件和离子方程式的书写方法。
能力培养:通过观察实验现象学会分析、探究化学反应的实质,培养学生的抽象思维能力。
科学思想:通过观察的化学现象及反应事实,使学生了解研究事物从个别到一般的思想方法,体验研究问题,寻找规律的方法。
科学品质:通过实验操作,培养学生动手参与能力,对反应现象的观察激发学生的兴趣;培养学生严谨求实、勇于探索的科学态度。
科学方法:观察、记录实验;对反应事实的处理及科学抽象。
重点、难点离子反应发生的条件和离子方程式的书写方法。
教学过程设计教师活动学生活动设计意图【提问】复分解反应能够发生的条件是什么?并对应举例说明。
【评价】给予肯定。
【指导实验】全班分为三大组,分别做下面的三组实验,并观察记录:一、硝酸银溶液分别跟盐酸、氯化钠、氯化钾的反应;回答:复分解反应是电解质在水溶液中进行的,这类反应必须在生成物中有沉淀、气体、难电离的物质三者之一才能发生。
例:(1)在反应里生成难溶物质。
如CaCO、BaSO4、AgCl、Cu(OH)2等。
BaCl2+H2SO4=BaSO4↑+2HCl(2)在反应里生成气态物质,如CO 2、H2S、Cl2等。
CaCO3+2HCl=CaCl2+H2O+CO↑(3)在反应里生成弱电解质,如:水、弱酸、弱碱等。
NaOH+HCl=NaCl+H2O分组实验,并记录观察到的现象。
一、均有白色沉淀生成;复习复分解反应发生的条件;训练学生实验观察能力,根据提出的问题和实验结果引起学生产生强烈的求知欲望。
续表教师活动学生活动设计意图二、盐酸跟碳酸钠、碳酸钾、碳酸钙的反应;三、硝酸跟碳酸钠、碳酸钾、碳酸钙的反应。
【追问】分别讨论三组实验,参加反应的物质不同,为什么每一组会产生同样的现象?在笔记本上完成其化学方程式。
【讲解】酸、碱、盐都是电解质,在水的作用下能电离(强调离子表示方法)。
物种起源与生物多样性演化

性状分歧(character divergence)是指生物生活在各种环境里,向不同方向变异和发展,形成多种性状的现象。
在研究物种的起源问题中,达尔文首先注意到,在同属异种间常呈现着巨大的差异。也就是说,他们之间表现出性状的多样性。例如毛茛属内,有许多性状不同的种,如轮裂叶毛茛、全叶毛茛、金辐射(adaptiveradiation)进化 适应辐射指的是从一个祖先类群迅速地产生许多新物种,包括两种情况:当某一类群产生了一种进化革新,使得它们能更好地适应环境或开拓新的生活方式,如三叶虫在早寒武纪开始由于获得了硬壳,在短期内就演化出了30个科(Harrington1959)。另一个是鸟类,由于出现了羽毛,并发展了飞翔新功能,在白垩纪得到初步发展并从新生代初开始了适应辐射,占据了整个空中领域。
单位,认为物种是为了方便起见任意地用来表示一
群亲缘关系密切的个体的。这又是他的不足之处。
目前,大多数学者认同:物种是指在一定区域内,具有极其相似的形态特征和生理、生态特性,个体间可以自然交配产生正常后代的自然生物类群。
迈尔(1942)认为,物种是实际上彼此杂交或彼此可能杂交的一批自然种群,它们跟其它这类种群在生殖上是彼此隔离的。 杜布赞斯基(1974)认为,同一物种是享有一个共同基因库能进行杂交的个体的最大的生殖群落。 陈世骧(1979)认为,物种是生物的繁殖单元和进化单元,进化通过物种的传衍演变而进行。
四、 生物进化的规律
(1) 线系渐变与间断平衡进化 (2)适应辐射进化 (3)趋同与平行进化 (4)重演律及异时发生 (5)重复进化 (6)协同进化
生物进化的研究包括有两个级别,小进化和大进化。小进化以现代生物种群和个体为对象,研究其短时间内的进化,即某种群从一代到下一代等位基因(alleles)频率的改变。大进化是长期(几千年至几百万年)的基因变异方式及物种形成的过程。长时间尺度的进化方式不易被搞清,但我们可以查明过去所发生过的事实,从而解释过去发生这些变化的方式。至于小进化和大进化的关系,一些人认为,大进化只是小进化长期变化的积累,而另一些人则认为大进化肯定还涉及了其它机制。
侏罗纪公园基因计划2

侏罗纪公园基因计划2
侏罗纪公园基因计划2是一部备受期待的科幻冒险电影,它延续了上一部电影的故事,继续探讨了基因科技和恐龙复活的伦理道德问题。
本片将带领观众进入一个充满未知和惊险的世界,让人们再次感受到恐龙带来的震撼和惊险刺激。
在侏罗纪公园基因计划2中,科学家们在基因科技领域取得了新的突破,他们成功地复活了更多种类的恐龙,并且将它们引入了一个新建的恐龙主题公园。
这个公园拥有更加先进的设施和技术,游客可以近距离观赏各种恐龙,并且体验到更加刺激的互动项目。
然而,随着故事的发展,一系列意外事件接连发生,使得公园陷入了危机之中。
在这个新的故事中,观众将跟随主人公们一起展开一场扣人心弦的冒险之旅。
他们将面临着来自恐龙的威胁,以及来自人类的欲望和野心。
在这个充满危险和未知的环境中,主人公们需要齐心协力,克服重重困难,才能够生存下来并找到逃离的方法。
侏罗纪公园基因计划2不仅仅是一部充满刺激和惊险的冒险电影,它同时也引发了人们对于基因科技和生命伦理的深刻思考。
在
现实世界中,基因科技的发展给人类带来了巨大的进步,但同时也
带来了诸多伦理和道德问题。
电影通过恐龙复活的故事,提醒人们
要审慎对待科技的发展,不可贪婪和鲁莽地去突破人类的道德底线。
总的来说,侏罗纪公园基因计划2是一部值得期待的电影作品,它将带给观众无尽的惊喜和刺激,同时也引发人们对于科技和生命
伦理的思考。
让我们一起期待这部电影的上映,体验其中带来的震
撼和感动吧!。
海豚产能情况分析报告

海豚产能情况分析报告海豚产能情况分析报告本报告旨在分析当前海豚产能情况以及未来发展潜力,并给出相关建议。
1. 产能分析1.1. 海豚数量:根据最新调查数据,全球海豚总数约为2000至4000只,其中大部分分布在热带和亚热带地区的海域。
1.2. 社会需求:由于海豚具有较高的观赏和娱乐价值,因此海豚表演、海豚主题公园等业态在世界各地需求旺盛。
1.3. 产能瓶颈:由于海豚种群数量有限,海豚捕捞和驯养过程中存在一定的局限性,使得海豚产业的供应能力受限。
2. 市场需求2.1. 市场规模:根据相关市场调研数据,全球海豚产业市场规模约为1000亿美元。
2.2. 消费者需求:海豚表演和驯养活动受到大众的喜爱,成为人们旅游、休闲娱乐的重要选择。
特别是在海滨城市和旅游胜地,海豚产业能够带动相关旅游业务发展。
2.3. 环保意识:海豚保护意识不断增强,消费者更加注重海豚福利与生态环境,对于不合规的海豚驯养场所和活动会持谨慎态度。
3. 发展潜力分析3.1. 科技创新:利用虚拟现实、增强现实和人工智能等新技术,能够打造更加逼真和安全的海豚表演和驯养体验,进一步提升市场竞争力。
3.2. 生态旅游:将海豚表演与生态旅游相结合,提供更加注重海洋生态保护的旅游产品,满足消费者对于可持续发展的需求,同时提高市场吸引力。
3.3. 教育意义:海豚表演和驯养活动可以传播海洋保护和生态平衡的知识,提高公众环保意识,具备较大的社会教育价值。
4. 建议4.1. 加强海豚保护:制定相关法规和规范,提高海豚保护意识,禁止非法捕捞和虐待行为,促进海豚种群的生态恢复。
4.2. 科技创新应用:鼓励企业在海豚表演和驯养活动中应用新技术,提高产品质量和消费者体验。
4.3. 联合保护项目:加强国际合作,共同推动全球海豚保护项目,共同维护海洋生态平衡。
总结:海豚产能受限,但市场需求旺盛,未来发展潜力巨大。
通过加强保护、科技创新和国际合作,可以实现海豚产业的可持续发展,同时满足社会需求和环保要求。
动物世界中的趋同演化

动物世界中的趋同演化在广袤的动物王国中,存在着各种各样的生物,它们以其独特的形态和生活方式而闻名。
然而,令人惊讶的是,在这个多样性的背后,我们也能观察到一种有趣的现象,即趋同演化。
趋同演化是指不同物种在相似的环境条件下,逐渐发展出相似的形态和生理特征的过程。
本文将探讨动物世界中的趋同演化现象,并尝试解释其背后的原因。
趋同演化在动物界中并非罕见。
一个经典的例子是鸟类和昆虫之间的趋同演化。
鸟类和昆虫都需要飞行,因此它们在翅膀的形状和结构上发展出了相似的特征。
这种趋同演化是由于它们共同面临的生态压力所致。
在空中飞行的需求使它们需要具备轻巧、强韧的翅膀,以便在空中快速、灵活地移动。
因此,无论是鸟类的羽翼还是昆虫的翅膀,都具备了类似的结构,以适应相似的环境需求。
除了飞行之外,趋同演化在其他方面也有所体现。
例如,海洋中的哺乳动物,如海豚和鲸鱼,以及鱼类,如鲨鱼和海豚鱼,都具备流线型的身体形态。
这种流线型的身体使它们能够在水中迅速游动,并减少水的阻力。
这种趋同演化是由于它们共同生活在水中,需要快速捕食和逃避掠食者的压力所致。
另一个有趣的例子是陆生哺乳动物和海洋哺乳动物之间的趋同演化。
虽然它们生活在完全不同的环境中,但它们的骨骼结构却显示出明显的相似性。
例如,海豚和鲸鱼的骨骼结构与陆地上的哺乳动物,如狗和猫,非常相似。
这种趋同演化是由于它们都需要快速游动,并具备灵活的身体来适应不同的环境需求。
那么,为什么动物世界中会存在趋同演化现象呢?这可以归因于两个主要的原因:生态位和适应性。
生态位是指一个物种在其所处环境中所扮演的角色。
当不同物种占据相似的生态位时,它们将面临相似的生态压力,从而导致趋同演化的发生。
适应性是指物种对环境变化的适应能力。
当物种面临相似的环境选择压力时,它们会发展出相似的适应性特征,以提高其在该环境中的生存能力。
除了生态位和适应性之外,趋同演化还可能受到其他因素的影响,如基因流、共生关系和遗传漂变。
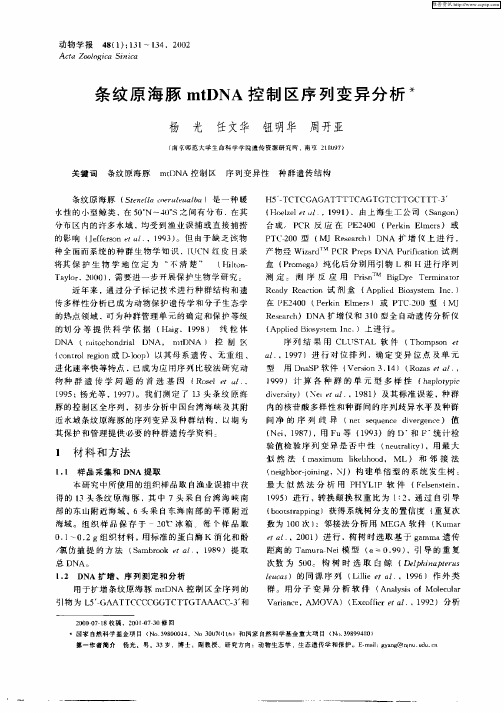
田野调查法采集中华白海豚个体辨识数据
科 学 家 主要 通 过 尾 叶 的 自然 特 征 辨 大 型鲸类 个体 ;通 过背 鳍和背 部的 f{然 持 辨识 大部 分小 型齿鲸个
体 可辨识 特 征根据 不 同物种有 所 差异 ,一 般 f14J/b ̄齿 鲸 可通 过 背鳍 的形状 和背 鳍 后缘 的缺 刻辨识个 体 ( lA); 而部 分体 纹或 色斑 较 为特异 的物 种还可 通过 稳定 的体 色 特 征 辨识 个 体 (图 1B).甚 至进 一 步获得 个体 性别 等其 他十 物学信 息
样 线 法 对 个体 数 据 收 集 效 率 的 影 响
样 线 法 和 个 体 辨 识 法 在 数 据 收 集l不1I研 究侧 重上 大相径 庭 ,具 体 方法 的采 用应 该 考虑实 际问题 的需 求 若 仅从鲸 类种 群动 态研究 的效 率 问题考 虑 , 目前 已有 大赶研 究对 比两者之 间 的差异 。例 如 ,巴两南 部 Lagunal ̄1,j瓶 鼻海 豚 研 究 表 明 . 执 行个体 辨 识法的 仡费 比样线 法要 高 30%,但 最 终数 据 的精 度 比样 线 调查法 高两倍 ;如果从 问题 …发 设 计渊查方案 ,为了在 五年 内检 l叶1 种 群 5%左 右的种 群动 态 变化 ,样 线法 的 整体亿 费 为个体辨 识法 的州 倍 。 此 ,方 法的选 择需 要综 合考 虑研 究 种群 的基线 资料 、科学 问题 、
南 下 辨 识 特 在 不 同 个 体 问 变化速 度有 差异 ,我 们难 以量化 捕 述 此过 程 。fIi根据 笔者 的经验 ,若 『fl华 Fl海豚 存一年 内有两 次 目击 记 录 ,基 奉能 够重 复辨 认 ;但 若超 过 3年没 有 重复辨 识 记 录 ,则 动物 阌 特 变 化 导 致 无法 重复辨识 的概 率 大大增 加 (尤其是青 年个 体 )。例 如霄州 半岛 的中华 白海豚 i周查 [}1, 研 究人 员存执 行样线 调查 过程 同步 收集个 体辨识 照 片 ;但 由于每 次样 线 埘查 之问 时间 间隔过 长 (间 隔 四 年 ), 可能存 在大量 可辨识 特征 发
mboat2基因

mboat2基因mboat2基因是一种与细胞膜的形成和功能调控密切相关的基因。
在细胞生物学研究中,mboat2基因被广泛关注并被认为在细胞膜的生成和功能调节中起着重要作用。
mboat2基因编码一种蛋白质,它被称为膜结合蛋白2(Membrane Bound O-Acyltransferase Domain Containing 2)。
该蛋白质在细胞膜的合成和调节过程中发挥着重要的作用。
细胞膜是细胞的外膜,它不仅起着保护细胞内部结构和维持细胞内外环境平衡的作用,还参与了细胞间的信号传导和物质交换等重要生物学过程。
mboat2基因在细胞膜生成中的作用主要是通过催化酰基转移反应来参与脂类的合成。
脂类是细胞膜的主要组成部分,包括磷脂、甘脂和固醇等。
mboat2蛋白质能够将脂肪酸与其他分子结合起来,形成各种脂类分子,然后将其定位到细胞膜上。
这个过程对于细胞膜的形成和维持至关重要。
除了细胞膜的生成,mboat2基因还参与了细胞膜的功能调节。
细胞膜在细胞生物学中起着非常重要的作用,它不仅仅是细胞的边界,还承担了许多重要的功能,如细胞信号传导、细胞识别和细胞黏附等。
mboat2蛋白质与其他蛋白质相互作用,通过改变细胞膜的组成和结构,调节细胞膜的功能。
这些调节作用能够影响细胞内外信号的传递和细胞的生理活动。
近年来,研究人员对mboat2基因的功能进行了深入研究,并发现了其在人类疾病中的重要作用。
例如,mboat2基因的突变与肥胖症的发生相关联。
研究人员通过对肥胖症患者基因组的分析,发现mboat2基因的突变会导致脂类的合成和细胞膜的功能发生异常,从而增加脂肪的堆积和肥胖的风险。
这一发现为肥胖症的治疗和预防提供了新的思路和靶点。
除了肥胖症,mboat2基因还与其他疾病的发生有关。
例如,研究人员发现mboat2基因的突变与心血管疾病、肿瘤和神经系统疾病等的发生相关。
这些研究结果表明,mboat2基因在人类疾病的发生和发展中起着重要的调控作用,对于深入理解疾病的发生机制和寻找新的治疗方法具有重要意义。
海豚的秘密与悲哀

海豚的秘密与悲哀
卓然
【期刊名称】《海洋世界》
【年(卷),期】2007(000)010
【摘要】迄今还没有哪一种动物能像海豚一样让人类难以琢磨和肃然起敬。
对它们了解的越多,引发的疑问也越大。
从脑重与体重之比看,海豚是仅次于人类的哺乳动物;它们左右半脑轮流入睡的本领,让我们钦羡不已;它们随时适应复杂社会关系的本领,更是充满诡异玄机。
然而,很多的所谓秘密都是短暂的,随着认识的深入,原本扑朔迷离的谜底,却显得异常的简单。
【总页数】8页(P50-57)
【作者】卓然
【作者单位】无
【正文语种】中文
【中图分类】Q959.841
【相关文献】
1.日本科学家发现海豚游泳快的秘密 [J], 方留民
2.短暂甜蜜下永恒的悲哀——基于《甜蜜的悲哀》的音乐观 [J], 徐剑飞
3.瓶鼻海豚、中华白海豚和糙齿海豚线粒体 16S rRNA基因的序列分析 [J], 李莉好;郭奕惠;黄桂菊;江世贵;贾晓平;喻达辉
4.海豚之星:小海豚大能量
——专访苏州海豚之星智能科技有限公司总经理姚海进 [J], 孙昊
5.60秒科学:海豚帮的秘密 [J], Amy Kraft;小狐
因版权原因,仅展示原文概要,查看原文内容请购买。
生物的适应性进化

生物的适应性进化生物的适应性进化是指物种在不断变化的环境条件下,通过基因的传递和选择的作用,逐渐适应新的环境并提高适存能力的过程。
这一进化过程在自然界中广泛存在,从微观的基因层面到宏观的物种层面都有其表现。
一、适应性进化的机制适应性进化的机制主要包括自然选择、基因突变和基因流三个方面。
1. 自然选择自然选择是适应性进化的核心机制,也是达尔文进化论的基本原理之一。
自然选择通过选择性死亡和繁殖的方式,筛选适应环境的个体,促使有利基因在种群中的频率增加,从而使整个种群适应环境的能力提高。
例如,在草原中,由于长颈鹿脖子长的个体可以更容易获取到食物,它们比颈子短的个体更有机会生存下来,并把长颈鹿的长颈基因传递给下一代,以适应食物获取的环境需求。
2. 基因突变基因突变是适应性进化的另一个重要机制。
基因突变是指在基因组中发生的一种变异,可以产生新的基因型和表型,从而为物种在新环境中的适应提供了基础。
例如,在繁殖细菌的过程中,由于突变导致某些细菌对抗生素具有抵抗力,这些抗药突变菌株在抗生素环境中具备竞争优势,逐渐占据种群的主导地位。
3. 基因流基因流是指物种间基因交换的过程,也是适应性进化的重要机制之一。
基因流使得不同种群之间的基因得以互相交流,从而增加遗传多样性,促进适应性进化的速度。
例如,在动物迁徙过程中,各地区的个体之间会进行基因交换,从而增加种群的遗传多样性,提高适应新环境的能力。
二、适应性进化的案例1. 鸟类的翅膀进化鸟类的翅膀进化过程是一种显著的适应性进化现象。
通过数百万年的进化,最初的爬行动物逐渐演化出具备飞行能力的翅膀。
这一进化过程中,翅膀的形态和功能不断优化,以适应不同的飞行习性和飞行方式。
其中,燕尾翼、平衡翼和扑克翼等不同类型的翅膀形态适应了不同的飞行环境和飞行速度需求。
2. 水生哺乳动物的进化水生哺乳动物的进化是适应性进化的又一典型案例。
例如,海豚在陆地上的祖先逐渐进化出具备水生生活的特化结构,如扁平的身体、鳍状的四肢以及尾部的鳍等。
珠江口水域中华白海豚形态学和遗传结构的研究的开题报告

珠江口水域中华白海豚形态学和遗传结构的研究的开题报告一、选题背景与意义中华白海豚(Sousa chinensis)是一种生活在中国南海和珠江口等海域的海洋哺乳动物,被国际自然保护联盟(IUCN)列为濒危物种。
然而,其种群数量逐年缩减,生存状况十分严峻。
同时,由于近年来珠江口口岸的建设和污染等人为因素的影响,中华白海豚的生存环境不断受到破坏。
因此,对于中华白海豚的形态学特征和遗传结构的研究具有重要的科学意义和保护价值。
二、研究内容本研究拟通过实地观察和采样,对珠江口水域中华白海豚的形态学特征进行系统研究,并利用遗传学方法,对其遗传结构进行分析和比较。
具体研究内容包括以下几个方面:1. 中华白海豚的形态学特征:通过实地观察和采样,对珠江口水域中华白海豚的体形、颜色、尾鳍形态等方面的特征进行详细描述和记录。
2. 中华白海豚的遗传结构:采集中华白海豚样本,利用PCR扩增和DNA测序技术,对其线粒体DNA和核DNA序列进行分析,探讨中华白海豚种群的遗传多样性和遗传结构,以便为其保护和管理提供科学依据。
3. 中华白海豚的种群数量估算:利用遗传标记,结合统计学方法,对珠江口水域中华白海豚的种群数量进行估算,为其保护和管理提供参考。
三、研究方法本研究将采用综合的研究方法。
珠江口水域中华白海豚的形态学特征将通过实地观察、测量及拍摄照片等方法进行记录和描述;遗传结构的研究将采用PCR扩增及DNA测序技术,基于线粒体DNA和核DNA序列,进行系统进化分析、遗传多样性和遗传结构分析等;种群数量的估算则将采用遗传标记法,结合统计学方法进行计算和分析。
四、研究预期成果本研究将为珠江口水域中华白海豚的保护和管理提供重要的科学数据和理论基础,具体预期成果如下:1. 揭示中华白海豚的形态学特征及其在珠江口水域的分布情况。
2. 揭示中华白海豚在珠江口水域的遗传结构和种群数量分布情况,提供科学依据和参考,为其保护和管理提供基础数据。
- 1、下载文档前请自行甄别文档内容的完整性,平台不提供额外的编辑、内容补充、找答案等附加服务。
- 2、"仅部分预览"的文档,不可在线预览部分如存在完整性等问题,可反馈申请退款(可完整预览的文档不适用该条件!)。
- 3、如文档侵犯您的权益,请联系客服反馈,我们会尽快为您处理(人工客服工作时间:9:00-18:30)。
ORIGINAL ARTICLEHigh gene flow in oceanic bottlenose dolphins (Tursiops truncatus )of the North AtlanticSophie Que ´rouil ÆMo ´nica A.Silva ÆLuı´s Freitas ÆRui Prieto ÆSara Magalha ˜es ÆAna Dinis ÆFilipe Alves ÆJose ´A.Matos ÆDiogo Mendonc ¸a ÆPhilip S.Hammond ÆRicardo S.SantosReceived:26May 2006/Accepted:16January 2007/Published online:15February 2007ÓSpringer Science+Business Media B.V.2007Abstract Despite the openness of the oceanic envi-ronment,limited dispersal and tight social structure often induce genetic structuring in marine organisms,even in large animals such as cetaceans.In the bottle-nose dolphin,mitochondrial and nuclear DNA analy-ses have revealed the existence of genetic differentiation between pelagic (or offshore)and coastal (or nearshore)ecotypes in the western North Atlantic,as well as between coastal populations.Be-cause previous studies concentrated on continental margins,we analysed the population structure of bot-tlenose dolphins in two of the most isolated archipel-agos of the North Atlantic:the Azores and Madeira.We analysed 112samples collected on live animals inthe two archipelagos,and nine samples collected on stranded animals in Madeira and mainland Portugal.Genetic analyses consisted in molecular sexing,sequencing of part of the mitochondrial hyper-variable region,and screening of ten microsatellite loci.We predicted that:(1)there is at least one pelagic and one or more coastal populations in each archipelago;(2)populations are differentiated between and possibly within archipelagos.Contrary to these predictions,re-sults indicated a lack of population structure in the study area.In addition,comparison with published sequences revealed that the samples from the Azores and Madeira were not significantly differentiated from samples of the pelagic population of the western North Atlantic.Thus,bottlenose dolphins occurring in the pelagic waters of the North Atlantic belong to a large oceanic population,which should be regarded as a single conservation unit.Unlike what is known for coastal populations,oceanic bottlenose dolphins are able to maintain high levels of gene flow.Keywords Cetaceans ÁAzores ÁMadeira ÁPopulation genetics ÁEcotypesIntroductionStock assessment has become an important issue for the conservation and sustainable management of marine ecosystems.The improvement of molecular genetic techniques over the last twenty years enables to identify conservation units on the basis of genetic population structure and dynamics (e.g.Frankham et al.2002).In the marine environment,barriers toS.Que´rouil UR175CAVIAR,IRD–GAMET,361rue Jean Franc ¸ois Breton,BP5095,34196,Montpellier Cedex 5,France e-mail:squerouil@notes.horta.uac.ptS.Que´rouil ÁM.A.Silva (&)ÁR.Prieto ÁS.Magalha˜es ÁR.S.Santos Departamento de Oceanografia e Pescas,Instituto do Mar (IMAR)da Universidade dos Ac ¸ores,Cais Santa Cruz,9901-862Horta,Azores,Portugal e-mail:monica@notes.horta.uac.ptS.Que ´rouil ÁJ.A.Matos ÁD.Mendonc ¸aINETI/Departamento de Biotecnologia,Edifı´cio E -1°andar,Estrada do Pac ¸o do Lumiar 22,1649-038Lisboa,PortugalM.A.Silva ÁP.S.HammondSea Mammal Research Unit Gatty Marine Laboratory,University of St.Andrews,St.AndrewsKY168LB,Scotland,UKL.Freitas ÁA.Dinis ÁF.AlvesMuseu da Baleia -Municı´pio de Machico,Largo Manuel Alves,9200-032Canic ¸al,Madeira,PortugalConserv Genet (2007)8:1405–1419DOI 10.1007/s10592-007-9291-5dispersal are few,and one may expect species with high dispersal capacities to demonstrate little population structure.However,recent studies have revealedfine-scale population genetic structure in highly vagile marine organisms such as squids(Shaw et al.1999)and cods(Knutsen et al.2003).In marine mammals,most species show extensive structure among populations (Hoelzel et al.2002).Population differentiation can occur on a small geographic scale,as a result of isola-tion by distance(e.g.in western Australian bottlenose dolphins,Kru¨tzen et al.2004)or due to ecological specialisation in relation with habitat features(e.g.in the Pacific white-sided dolphin,Hayano et al.2004, and the killer-whale,Hoelzel et al.1998a).In the bottlenose dolphin,Tursiops truncatus (Montagu1821),a distinction can be made between pelagic(or offshore)and coastal(or nearshore)eco-types(see Hoelzel et al.1998b for a review).Mito-chondrial and nuclear DNA analyses have revealed the existence of genetic differentiation between the two ecotypes in the North-West Atlantic(Hoelzel et al.1998b).Recently,a comprehensive study showed significant differentiation between several coastal populations and two highly polymorphic pe-lagic populations,one in the north-eastern Pacific and one in the north-western Atlantic(Natoli et al.2004). Some coastal populations appeared to be morpho-logically and genetically sufficiently distinct to be classified as a separate species,such as T.aduncus in Chinese waters(Wang et al.1999,2000)and a po-tential third species along the South African coast (Natoli et al.2004).Pelagic forms have been reported to range primarily between the200-and2000m-iso-baths(cf.Wells et al.1999).Genetic differentiation between ecotypes has been used to characterise eco-type distribution according to water depth and/or distance to the coast.In the North-West Atlantic,the pelagic ecotype occurs mainly in waters beyond34km from shore and34m depth while the coastal one occurs at least up to7.5km from shore(Torres et al. 2003).In the Gulf of California,a distribution break is found around the60m-isobath(Segura et al.2006). At a regional scale,genetic analyses evidenced dif-ferentiation between the eastern and western basins of the Mediterranean Sea(Natoli et al.2005),as well as between coastal populations of the Gulf of Mexico (Sellas et al.2005)and the Northern Bahamas(Par-sons et al.2006).Despite the broad geographic cov-erage of all these studies,bottlenose dolphins have only been studied in peri-continental areas,and vir-tually nothing is known about distant offshore re-gions.The aim of the present study was tofill in this gap,by studying the population structure of bottle-nose dolphins around two of the most isolated archi-pelagos in the North Atlantic,the Portuguese archipelagos of the Azores and Madeira.The archipelago of the Azores is situated about 1500km away from the nearest coast.It comprises nine islands divided into three groups that are sep-arated by a few hundreds of kilometres.The archi-pelago of Madeira is located about500km west of the North African coast.It comprises two main is-lands separated by a few dozens of kilometres and two sub-archipelagos,with a total of seven islands. Previously reported bathymetric limits between coastal and pelagic populations of bottlenose dol-phins cannot apply to the Portuguese archipelagos, because deep waters(>200m)occur at very short distances from the coast(Santos et al.1995).None-theless,in the Azores,cetacean species seem to present different habitat preferences,with a distinc-tion between a coastal and a pelagic zone(Silva et al.2003).Bottlenose dolphins tend to be more abundant in coastal waters,less than9km from the coast and shallower than1000m(Silva et al.2003). Another way to distinguish between ecotypes is to look at patterns of residency,as coastal dolphins tend to be resident while pelagic ones may be tran-sient(Wells et al.1999).Bottlenose dolphins are present year-round in the two Portuguese archipel-agos.Photo-identification surveys carried out in each archipelago have shown that some individuals are sighted repeatedly in the same area at different seasons(Silva2006;L.F.,unpublished results).These animals are probably resident.On the opposite, some individuals are rarely observed in the main study area and can travel large distances.They may be visitors.Thus,it can be hypothesised that the individuals ranging in each archipelago are from at least two populations,at least one population of coastal/residents and at least one population of pe-lagic/transients.Alternatively,or in combination with that hypothesis,population structure could fol-low the geographical and physical structure of the archipelagos.Different populations could occupy the two archipelagos and there may be some population differentiation between groups of islands.In that case,a correlation between geographical and genetic distances can be expected.We used a combination of mitochondrial DNA (mtDNA)sequences and microsatellite markers to test our predictions about the population structure of bot-tlenose dolphins around the Portuguese archipelagos of the Azores and Madeira.Sampling was performed at a wide range of distances from the coast(from0.2to 100km)in order to cover both coastal and pelagichabitats.A few samples from the continental coast of Portugal were also parisons were made with published mtDNA sequences from other popula-tions of the Atlantic Basin,in order to evaluate the degree of differentiation of the two archipelagos in relation with peri-Atlantic areas.Material and methods Study sitesThe archipelago of the Azores (AZ—Portugal,Fig.1A and B)is located in the North Atlantic Ocean,about 1500km away from the continent.It lies between the 37th and 41st northern parallel and the 25th and 31stwestern meridian,extending more than 480km along a Northwest-Southeast axis and crossing the Mid-Atlan-tic Ridge.It is composed of nine volcanic islands di-vided into three groups (the eastern,central and western groups)separated by deep waters (ca .2000m)with scattered seamounts (Santos et al.1995).Shallow waters (<200m)occur only at very short distances from the coast,and in the channel between Pico and Faial islands.Most field work was conducted in the central group of islands (around the islands of Pico and Faial,from the harbour of Horta—38.53°N and 28.63°W),on a daily basis.Cruises of longer duration were organized in order to cover the whole archipelago.The archipelago of Madeira (MA—Portugal,Fig.1A)is located in the North Atlantic Ocean,580km West of Morocco,Africa.It is composed of two main volcanic islands,Madeira and Porto Santo,which are separated by a stretch of 35km getting as deep as 3000m.It also comprises two sub-archipelagos,De-sertas Islands and Selvagens Islands,located 11km Southeast and 300km South of Madeira,respectively.Fieldwork was conducted on the southern coast of Madeira and West of the Desertas Islands,from the harbour of Canic ¸al (32.7°N and 16.7°W).Samples from mainland Portugal (MP,Fig.1A-hereafter ‘‘Mainland’’)were obtained from animals that stranded along the oceanic shoreline (38.15°N–8.73°W to 40.48°N–8.78°W).Sample collection and DNA extractionSkin samples were collected using a biopsy darting system (a 125-lb Barnett crossbow,with arrows and darts specially designed for small cetaceans by rsen,Ceta-Dart).In the Azores,86biopsy samples were obtained between 2002and 2005:46samples in the central group,24in the eastern group,9in the western group and 5around seamounts located 100km south of the central group.All samples but two were from adult and subadult individuals,and all samples were retained for analyses.Samples were stored either in a 20%dimethyl-sulfoxide (DMSO)solution satu-rated with salt,or in 90%ethanol,which proved to be a better preservative than DMSO.Photographs of sam-pled individuals were collected for photo-identification purpose.Eight individuals were identified as being resident in the central group of islands (Silva 2006).In Madeira,26biopsy samples were collected in 2004and 2005,at a maximum of 10km from the coast of the main highland.Sampling scheme precluded any at-tempt to make comparisons between groups of islands.All samples were from adult individuals and stored in alcohol.Two additional samples were obtained fromSWAEABAHNWAP NWAC GM AZ MSUKMAMP 38.5039.50ABindividuals that stranded on the coast of Madeira in 1998.In addition,seven samples were collected on ani-mals that stranded along the coast of mainland Portu-gal between1997and2005.These samples were used for comparison with a continental population,despite small sample size.Biopsy samples were classified into two categories according to habitat characteristics at sampling loca-tion,following the dichotomy suggested by previous work on cetacean distribution in the Azores(Silva et al.2003):(1)distance to the coast smaller than9km and depth lower than1000m(mean depth396m±266, 95%CI:331–461m;N=64for the Azores and21for Madeira),(2)distance to the coast larger than9km and depth ranging from385to1655m(mean depth 884m±414,95%CI:698–1070m;N=19for the Az-ores and3for Madeira).Depth and distance to the coast at sampling location were estimated by means of a Geographic Information System.Samples were processed at the INETI,Lisbon, Portugal.DNA extractions were performed following the protocol of Gemmel and Akiyama(1996).About 1–2mm3of skin were minced and rinsed in dd-water prior to extraction.Digestion was extended overnight at56°C,using recombinant proteinase K.The LiCl2 precipitation and chloroform extraction were per-formed as described by the authors,except that the chloroform extraction was repeated twice.Mitochondrial DNA sequencesAcquisition of sequencesPart of the tRNA-Thr,the tRNA-Pro and the most variable part of the mitochondrial D-loop were ampli-fied using the primers Dloop-16L5¢-CCCGG TCTTGTAAACC-3¢(Hoelzel et al.1991)and H00034 5¢-TACCAAATGTATGAAACCTCAG-3¢(Rosel et al.1994).For26samples,a longer fragment of833 base pairs(bp)was obtained with the primers Dloop-16L and Dloop-19H5¢-ATTTTCAGTGTCTTGCTTT-3¢(Hoelzel et al.1991).Longer sequences were used to assess the impact of using shorter sequences on haplo-type diversity.They were truncated to604bp before subsequent analyses.PCR reactions were carried out in a25l l volume using0.75units of Taq DNA polymerase(MBI Fer-mentas)and2mM MgCl2.The number of cycles was set to35and the annealing temperature to52°C.PCR products were purified with the GFX PCR DNA purification kit(Amersham Biosciences),following the manufacturer’s protocol.Sequencing was done on ABI-prism capillary sequencers(Applied Biosystems), at one of the following institutions:(1)CRIBI,Uni-versity of Padova,Italy,(2)INETI,Portugal,and(3) Macrogen,Korea.Two samples were sequenced at all three locations to ensure cross-institution reliability. All samples were sequenced with the16L primer,using an annealing temperature of55°C.Thirty-three sam-ples were also sequenced with the reverse primer and no ambiguities were found.All sequences were double-checked for errors.Sequences were deposited in GenBank,with reference numbers DQ073641to DQ073729and DQ525357to DQ525388.Alignment was performed visually.Three gaps were identified.Thefirst23nucleotide positions were de-leted due to potential misreading at the beginning of the sequence.Thefinal alignment was604bp long.In addition,194published D-loop sequences of Tursiops truncatus were used to obtain a general pic-ture of population structure in the Atlantic Basin (Fig.1A).Seven populations were considered:United Kingdom(UK;N=38:29sequences from Parsons et al.2002,and9from Natoli et al.2004),Mediterra-nean Sea(MS;N=18;Natoli et al.2004),North-West Atlantic Pelagic(NWAP;N=25;Natoli et al.2004), East Atlantic(EA;N=17;Natoli et al.2004),North-West Atlantic Coastal(NWAC;N=29;Natoli et al. 2004),Bahamas(BAH;N=55;Parsons et al.2006), and Gulf of Mexico(GM;N=12;Natoli et al.2004). These populations were classified as coastal or pelagic according to the nomenclature adopted in one of the most recent studies(Natoli et al.2004).As most frag-ments were only296bp long,all sequences were truncated to that length for the analyses within the Atlantic Basin.Two additional gaps were added for alignment with these sequences.Haplotype networksWe investigated the phyletic relationships between the haplotypes from the Portuguese archipelagos and Mainland using network-building methods.These methods are more efficient than classical phylogenetic algorithms when genetic distances between individuals are small and the number of equally parsimonious connections is high,as expected for intra-specific comparisons(Templeton et al.1992;Crandall1996). We selected the Median Joining approach(MJ), implemented by the software Network4(Bandelt et al. 1999),for being one of the most efficient network-building methods available to date(Cassens et al. 2003).The homoplasy parameter(e)was set to zero. Two weighting schemes were applied in order to ac-count for differences in substitution rates:(1)equalweight for all classes of changes,and(2)weight of10 for transitions and30for transversions and gaps,as suggested by the authors for a tenfold difference in mutation rates between substitution classes.Population structureGenetic distances between and within archipelagos were calculated using the Tamura-Nei formula(Tam-ura and Nei1993).Corrected distances accounting for intra-population variability(PiXY–(PiX+PiY)/2) were also calculated.Genetic differentiation among potential populations was assessed taking into account nucleotide differences between haplotypes(F ST,Weir and Cockerham1984),after correction by the Tamura-Nei formula.Significance was assessed by a permuta-tion procedure(10,000permutations).These calcula-tions were performed with Arlequin 3.1(Excoffier et al.2005).Genetic differentiation between the studied popu-lations and other populations of the Atlantic Basin was assessed by calculating F ST and its significance,as above.For each population,gene diversity(H)and nucleotide diversity(p)were calculated using Arlequin 3.1.Shared haplotypes between populations were identified using the same software.An asymmetric estimate of the migration rate(N e m)between relevant populations was calculated using Migrate2.0(Beerli 2004).Initial runs were set estimating h and M with F ST.Reruns were performed using the parameters estimated during thefirst run,with10short chains of 50,000steps and3long chains of500,000steps.For each estimate of M,significant departure from zero and from a symmetric migration scheme was tested by a lilekihood ratio test.We tested for the effect of geographic distances on population structure by means of a Mantel test,using the program Genetix4.03(Belkhir et al.2001).Given that the distribution of sampling locations was three-dimensional,F ST/(1–F ST)was expected to vary line-arly with the logarithm of geographic distances.Indi-viduals were grouped according to sampling locations following two different schemes.First,we considered Madeira,the Mainland,and four populations within the Azores:the three groups of islands and the sea-mounts.Second,we divided the central group of is-lands into three groups:Graciosa(N=4samples), Terceira(N=5),and the remnant islands(N=37). The latter scheme allowed increasing the number of populations and accounting for the large distances between sampling locations within the central group, but resulted in lower sample sizes.The significance of the tests was assessed by10,000Monte Carlo–Markov Chain(MCMC)simulations.In order to determine whether there was some de-gree of genetic differentiation between individuals sampled in‘‘coastal’’or‘‘pelagic’’habitats,we per-formed a Molecular Analysis of Variance(AMOVA) using Arlequin3.1.Because differentiation between groups of islands was also expected,two alternative grouping schemes were compared:(1)clustering of samplesfirst according to habitats(within or beyond 9km from the coast)and second according to groups of islands(Madeira,the three groups of Azorean is-lands,and the seamounts);(2)clustering of samples first according to groups of island and second according to habitats.Finally,we measured gene diversity(H)and nucle-otide diversity(p)in known resident individuals,using Arlequin3.1.Microsatellites and molecular sexingData acquisitionTen polymorphic dinucleotide microsatellite loci were analysed:d22(Shinohara et al.1997),EV5,EV14, EV37(Valsecchi and Amos1996),FCB1,FCB17 (Buchanan et al.1996),Mk6,Mk8(Krutze¨n et al. 2001),Sw10and Sw19(Richard et al.1996).PCR reactions were performed in multiplex whenever pos-sible,applying a touched-down decrease in annealing temperatures of0.1°C/cycle:Sw10and Sw19(50fi47.5°C);FCB1,FCB17and EV37(56fi53.5°C); Mk6,Mk8,d22(56fi53.5°C).Fragments were scanned on an ABI310capillary sequencer using the size marker ROX350(Applied Biosystems).Molecular sexing was performed by co-amplification of a short fragment of the male-specific SRY gene(CSY,157bp, Abe et al.2001)and a monomorphic microsatellite fragment used as a PCR control for positive identifi-cation of females(Sw15,234bp,Richard et al.1996). Polymorphism controlPrior to analyses,genotypes were checked for potential errors and replicated individuals using Microsatellite Tools(MsTools,Park2001).Genotyping was repeated whenever necessary.There were three cases of indi-viduals that had been sampled twice in the Azores and one case in Madeira.The duplicated samples were removed from all data sets,so that thefinal number of individuals analysed was83for the Azores,and27for Madeira.Polymorphism was estimated as the number of al-leles per locus,observed heterozygosity(H O),unbiased expected heterozygosity(H E),and polymorphism information content(PIC;Botstein et al.1980),using Cervus(Marshall et al.1998).The PIC,which is based on expected heterozygosity and the number of alleles per site,is representative of the diversity found at each locus.Departure from Hardy–Weinberg(HW)fre-quencies within populations was tested with FSTAT2.9.3(Goudet2001)using a randomization procedure.A sequential Bonferroni correction was applied to compensate for multiple tests(Rice1989).For the maintwo populations,global F IS was calculated and its sig-nificance estimated by a permutation procedure(10.000 replicates)using Genetix4.03(Belkhir et al.2001). Population structurePreliminary analysis of allele-size distribution indicated that half of the loci seemed to conform to the uni-or bi-modal distribution of allele sizes expected under the Stepwise Mutation Model(SMM,Ohta and Kimura 1973).Other loci presented multimodal distributions and/or large gaps in allele sizes,more in agreement with the Infinite Allele Model(IAM,Kimura and Crow1964) or the Two Phase Model(TPM,DiRienzo et al.1994). Thus,genetic differentiation among potential popula-tions was assessed based on both the IAM model(F ST, Weir and Cockerham1984)using Arlequin3.1,and the SMM model(R ST=Rho ST of Slatkin1995)using Rst-Calc(Goodman1997).In the latter case,data were standardized in order to compensate variance differ-ences between loci.Significance was assessed by a per-mutation procedure(10,000permutations).The influence of allele size on population differentiation was tested with the permutation test implemented in SPA-GeDi1.1b(Hardy and Vekemans2002).Note that,al-though R ST was designed especially for microsatellites and accounts for differences in allele sizes,F ST was shown to be more reliable than R ST when sample size is limited(Gaggiotti et al.1999)and when geneflow is high (Balloux and Goudet2002).Therefore,F ST should be preferred to R ST when allele size does not contribute to population differentiation.An asymmetric estimate of the migration rate(N e m)between the Azores and Ma-deira was calculated using Migrate2.0(Beerli2004),as described above,and using the Brownian motion model.Population structure was also evaluated by Bayesian analyses,using the software Structure2.1(Pritchard et al.2000).We examined the possibility of an unde-tected population structure by carrying out MCMC simulations with no prior information on the origin of samples.The maximum number of populations(K)was assumed to vary between1and6.For each potential value of K,five replications were performed.The pro-gram was also run for the whole data set using prior knowledge on geographic population structure,in order to identify potential migrants.Three populations were considered based on sample origin:Azores,Madeira and Mainland.In both cases,the number of steps for the burning process and the simulations was set to50,000.We tested for the effect of geographic distances on population structure by means of a Mantel test,as explained above,but replacing F ST by F ST.Given the difficulty of defining boundaries between groups and the high mobility of focus animals,we also performed the Mantel test at the individual level,using Alleles In Space 1.0(AIS;Miller2005).The genetic distance implemented in this program is an analogue of Nei’s distance(Nei et al.1983)applied to pairs of individu-als.Log-transformed geographic distances were used and significance was assessed by10,000permutations. Table2Asymmetric migration rates(Nm)with95%confidence intervals(between brackets)between populations,based on DNA sequences.All estimates were significantly different from zero(P<0.001)From\To n Azores Madeira NWAP Azores83–0.4 1.0[0.1–3.9][0.2–8.6] Madeira25222.1–9.5[67.7–671.3][2.3–30.3] NWAP3610.6 1.4–[2.3–220.1][0.3–6.4]Table1Population differentiation within the archipelago of the Azores(A) and between the Portuguese archipelagos and Mainland (B)based on604bp-longD-loop sequences:F STwith level of significance (*P<0.05,**P<0.01)A n Western Central Seamounts Eastern Western9–0.163**0.1210.025 Central46––0.0520.032 Seamounts5––0.011 Eastern23–B n Azores Madeira MainlandAzores83–0.059*0.089Madeira25–0.020Mainland7–The degree of genetic differentiation between indi-viduals sampled in‘‘coastal’’or‘‘pelagic’’habitats was estimated by means of an AMOVA,as described above.Because haplotypes clustered in two distinct groups(cf.result section),an AMOVA was also per-formed to determine how microsatellite diversity was partitioned between haplotype groups.Mean degree of relatedness between resident indi-viduals was compared to mean relatedness in the Az-ores based on Moran’s I coefficients calculated with SPAGeDi 1.1b(Hardy and Vekemans2002).This coefficient was chosen because it is defined in a way that mean relatedness is zero for the whole population. Actual variance and standard deviation were estimated by the method of Ritland(2000).Sex-biased dispersal was tested using the program FSTAT2.9.3(Goudet2001)based on sex-specific expectations with respect to F IS,F ST,and a likelihood assignment index.Significance was tested by10,000 permutations.The analysis was performed twice,using adults only,and using adults and subadults,as a mean to increase sample size.ResultsMolecular sexing indicated a sampling bias in favour of males in the Azores.Excluding the samples from stranded animals(2males from Madeira),there were 61males and22females in the Azores(sex-ra-tio=2.77:1)and13males and12females in Madeira (sex-ratio=1.08:1).Mitochondrial DNA sequencesVariabilityAmong the26Azorean samples for which long sequences were obtained,long sequences(833bp)revealed19different haplotypes,while short sequences (604bp)corresponded to18haplotypes,resulting in a loss of5.3%.For the entire set of604bp sequences,there were37 different haplotypes out of83samples for the Azores, 16out of25samples for Madeira(note that two sam-ples from Madeira could not be sequenced)and5out of7samples for the Mainland.Gene diversity and nucleotide diversity were high at the three locations and similar to the values obtained for the296bp se-quences(cf.Table4).Population structure within and between archipelagos Twelve haplotypes were shared between the Azores and Madeira.The mean Tamura-Nei distance between archipelagos was7.17,but lowered to0.47after cor-rection for intra-population polymorphism.Within the Azores,the mean Tamura-Nei distance was7.45,while it was5.95in Madeira.In the Azores,fixation indexes indicated a lack of population differentiation between all sampling sites, except between the central and western groups of islands (Table1A).Comparisons between the Azores,Madeira and the Mainland revealed significant differentiation between the two archipelagos(F ST=0.059,P=0.017), but no significant differentiation with regards to com-parisons involving the Mainland(Table1B).Estimates of migration rates indicated that geneflow was very high from Madeira to the Azores(Table2),and significantly higher than in the opposite direction(P<0.001).Man-tel tests were not significant when performed on the originally defined populations(Z=4.200,P=0.254)or on refined populations(central group of islands subdi-vided between Terceira,Graciosa,and the remnant is-lands:Z=1.103,P=0.200).The AMOVA indicated that most(>95%)of the genetic variance was found within groups of samplesTable3AMOVA with samples grouped first according to island groups and then according to habitats(A),or first according to habitats and then according to island groups(B)based on D-loop sequences(Tamura-Nei distances)and microsatellites(number of different alleles)D-loop MicrosatellitesSource of variation df%var F P df%var F PAAmong habitats(F CT)1–3.78–0.0380.9511–0.02–0.0010.335 Among island groups within habitats(F SC)7 5.280.0510.17270.210.0020.352 Within island groups(F ST)9898.500.0150.07420799.810.0020.329 BAmong island groups(F CT)48.600.0860.2504–0.20–0.0020.447 Among habitats within island groups(F SC)4-4.54–0.0500.70340.390.0040.085 Within habitats(F ST)9895.950.0410.07620799.810.0020.329 df:degree of freedom,%var:percentage of variance,F:fixation indices,P:probability of significance。