lab3
Loudspeaker LAB 3 中文版简易入门指南

Loudspeaker LAB 3中文版简易入门指南Loudspeaker LAB 3基本功能:●时域和频域测量(脉冲、频率响应和阻抗)。
●分频器设计与模拟。
●箱体设计与模拟。
最低系统要求:操作系统Windows 95CPU 奔腾120显示800x600、16 位彩色声卡16 位, 立体声全双工,见帮助文件支持硬件。
推荐配置:操作系统Windows 2000 SP3 / Windows XPCPU 奔腾III 1 GHz、阿瑟龙1GHz 或更高显示1024x768、16 位彩色或更高声卡24 位、立体声全双工,见帮助文件支持硬件。
首先了解一下软件安装后的目录结构Loudspeaker LAB3 软件的根目录。
Alignments 保存音箱的调准。
Background 保存LspLAB3的桌面背景即墙纸,用户可以随意加入BMP各式的图片。
Calibration 保存LspLAB3的校准。
Examples 一些实例。
Mixer Windows混音器设置。
Presets 保存自定义的测量预置文件。
TEMP 临时目录。
用户界面吕工具栏总体设置在桌面空白处单击鼠标右键,在弹出的选单中选择总体设置。
或单击文件,选择总体设置。
在这里你可以关闭每次启动时那个讨厌的开始图片,还可以改变环境温度、桌面背景的图片和临时目录位置。
外观式样在已测量或打开的曲线图中单击鼠标右键,选择外观,打开外观式样对话框。
总感觉自己的测量软件根本就不像专业的测量系统,怎么看都像是业余软件,为了心理感觉,发挥想象,随便改吧。
入门指南因为这里仅仅是简易的入门指南,所以下面只介绍测量部分的设置与基本操作,对于箱体设计与分频器设计及模拟部分,因为软件本身有相应的操作向导,可以指导你一步一步进行操作,如果使用汉化的软件将会更容易使用。
A.测量设置点击工具栏的测量设置按钮硬件设置在弹出的测量设置对话框中选择硬件标签。
1、在输入与输出设备栏的下拉选单中选择当前系统的实际输入与输出设备,名称就是你当前使用的声卡的名称。
CCNP上午班排错部分实验题

CCNP上午排错部分实验题
姓名:测试日期:测试分数
LAB1:VLAN间路由trouble shooting
实验要求:
1,一家小型企业决定实施 VLAN,并且在 Core 交换机上配置 VLAN 间路由,以提升性能。
但自从实施 VLAN 之后,用户便无法使用网络资源。
请排除网络故障并解决所有配置问题。
记录连通性和配置问题以协助故障排除。
2,保存每台路由器Ping命令结果及show run配置到记事本当中
LAB1:OSPF trouble shooting
实验要求:
1,在R2上对area1 的loop口路由进行汇总,使每台路由器互通
2,保存每台路由器Ping命令结果及show run配置到记事本当中
LAB3: BGP Trouble Shooting
实验要求:1, 解决R4,R5无法互相学习到对方的BGP路由的问题
2, 保存每台路由器Ping命令结果及show ip bgp summary, show run配置到记事本当中。
Lab3 Format String Vulnerability
Format String Vulnerability Lab 学号:SA11011083 姓名:汪于波一、发现格式字符串漏洞实验中给出了一个程序,你需要输入一些字符存放在缓冲区,之后这些字符将被printf 函数输出。
但是这个程序存在一些漏洞。
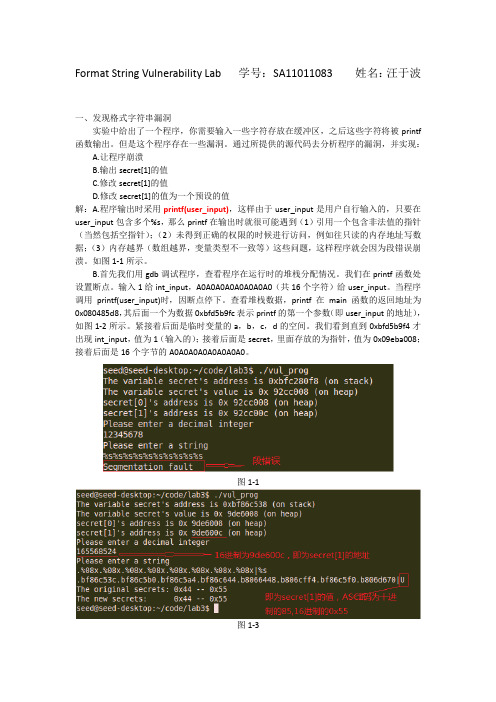
通过所提供的源代码去分析程序的漏洞,并实现:A.让程序崩溃B.输出secret[1]的值C.修改secret[1]的值D.修改secret[1]的值为一个预设的值解:A.程序输出时采用printf(user_input),这样由于user_input是用户自行输入的,只要在user_input包含多个%s,那么printf在输出时就很可能遇到(1)引用一个包含非法值的指针(当然包括空指针);(2)未得到正确的权限的时候进行访问,例如往只读的内存地址写数据;(3)内存越界(数组越界,变量类型不一致等)这些问题,这样程序就会因为段错误崩溃。
如图1-1所示。
B.首先我们用gdb调试程序,查看程序在运行时的堆栈分配情况。
我们在printf函数处设置断点。
输入1给int_input,A0A0A0A0A0A0A0A0(共16个字符)给user_input。
当程序调用printf(user_input)时,因断点停下。
查看堆栈数据,printf在main函数的返回地址为0x080485d8,其后面一个为数据0xbfd5b9fc表示printf的第一个参数(即user_input的地址),如图1-2所示。
紧接着后面是临时变量的a,b,c,d的空间。
我们看到直到0xbfd5b9f4才出现int_input,值为1(输入的);接着后面是secret,里面存放的为指针,值为0x09eba008;接着后面是16个字节的A0A0A0A0A0A0A0A0。
图1-1图1-3图1-2通过上面的调试,我们知道,printf(user_input)函数调用时,第一个参数与int_input相距16个字节。
Lab3 Network Analyzer(射频实验3)

LAB #3 – NETWORK ANALYZERINTRODUCTIONNetwork analyzers test and analyze electrical networks. They are used to test both passive and active devices and components. When RF power enters a device, some of it is reflected, some passes through and some is absorbed. High-frequency network analysis involves examining these incident, reflected, absorbed and transmitted waves traveling along transmission lines.Insertion loss and return loss are expressed in dB, and defined as Equ. 2-1 and Equ. 2-2.input outputP P oss InsertionL log 10=− Equ. 2-1input reflectedP P turnLoss log 10Re =− Equ. 2-2Additionally, network analyzers can function as tools to troubleshoot network problems, building up historical and statistical charts for viewing data in real-time. In this application, they are often referred to as “sniffers”.In the Cellular Tech experiments, there are four specific losses to be measured based on the concepts of insertion loss and return loss, (1) insertion loss , (2) input return loss , (3) output return loss and (4) isolation .1. The insertion loss of a DUT (Device under Test) is measured as shown inFig. 2-1.Fig. 2-1 Insertion Loss Measurement2. The input return loss of a DUT is measured as shown in Fig. 2-2.Fig. 2-2 Input Return Loss Measurement3. The output return loss of a DUT is measured as shown in Fig. 2-3.4. The isolation between two ports of a DUT is measured as shown in Fig. 2-4.Fig. 2-4 Isolation MeasurementHP/Agilent 8711C/12C/13C/14C network analyzers are used in Cellular Technology labs for characterizing components from 300 KHz to 3.0 GHz.PREPARATIONTo gain a better understanding of how a network analyzer works, visit the web sites below for data sheets and configuration guides:/litweb/pdf/5965-1464E.pdf /litweb/pdf/5965-1461EN.pdf To get more information about Agilent’s latest network analyzers, you can search on the Agilent Technologies home page at: /PURPOSEzTo set the frequency and scale range for measurements zTo calibrate the network analyzer for measurements zTo measure the insertion loss z To measure the return loss(2) MEAS (4) SOURCE (6) CONFIGURE(10) Context SensitiveButtons (1) Power (8) FloppyDriver(3) RF OUT (5) RF IN(7) SYSTEM(9) ENTRYFig. 2-5 HP/Agilent Network AnalyzerMATERIALS & SETUP•HP/Agilent network analyzer• Coaxial cables•RF adaptersPROCEDUREInsertion Loss Measurement1. Set up a frequency range between 800MHz and 900MHz you want tooperate over1-1. Turn the power (1) on. Note: The equipment will take several seconds to self-check and initialize.1-2. Under Source box (4), press the FREQ button.1-3. On the right side of the display, find the Start and press the associated button (10) to the right of the screen.1-4. On the keypad, enter 8001-5. On the display, find the MHz and press the associated button to the right of the screen1-6. On the right side of the display, find the Stop and press the associated button to the right of the screen.1-7. On the keypad, enter 9001-8. On the display, find the MHz and press the associated button to the right of the screenAlternative method:1-1. Turn the power on. Note: The equipment will take several seconds to self-check and initialize.1-2. Under Source box, press the FREQ button.1-3. On the right side of the display, find the Center and press the associated button to the right of the screen.1-4. On the keypad, enter 8501-5. On the display, find the MHz and press the associated button to the right of the screen1-6. On the right side of the display, find the Span and press the associated button to the right of the screen.1-7. On the keypad, enter 1001-8. On the display, find the MHz and press the associated button to the right of the screen2. Calibrate the network analyzer for the insertion loss measurement2-1. Connect a short piece of 50Ohm coax cable to the REFLECTION RF OUT(3) type N-female port2-2. Connect a short piece of 50Ohm coax cable to the TRANSMISSION RF IN(5) type N-female connector2-3. Using the appropriate connector, join the two open ends of the coaxial cables together2-4. Under the MEAS box (2), press the MEAS 1 button2-5. On the right side of the display, find the Transmission and press the associated button to the right of the screen.2-6. Under the CONFIGURE box (6), press CAL. This is the calibration button.2-7. On the display, find the Normalize and press the associated button to the right of the screen. Listen for a beep. This tells you that theequipment is now normalized.Note: The losses in the coax jumper cables are now normalized or factored out. Losses between 800 to 900MHz are now adjusted to 0dB.Anything placed between these two cables will indicate an accurate measurement made on it, independent of the losses in the two coax cables.3. Set the certain frequency markers3-1. Under the CONFIGURE box, press the MARKER button3-2. Note on the right side of the display, there is 1>, 2:, 3:, and 4:.These are four markers 1 through 4. The > symbol indicates whichmarket is active.3-3. Press the associated button for marker 1 (if the > symbol is not indicating at 1)3-4. On the keypad in ENTRY box (9), enter 8243-5. On the display, find the MHz and press the associated button to the right of the screenAlternative method: if you do not require great accuracy, or you are trying to make a specific insertion loss measurement, you can use the larger round tuning knob known in the ENTRY box and dial up the frequency.3-6. Press the associated button for marker 23-7. On the keypad, enter 8493-8. On the display, find the MHz and press the associated button to the right of the screen3-9. Repeat steps 3-7 and 3-8 for markers 3 at 869 MHz and marker 4 at 894 MHzNote: You have now set up markers for the lowest and highest frequencies for both mobile and base transmit and receive in the cellular band.4. Set the vertical scale4-1. Under the CONFIGURE box, press SCALE4-2. On the right side of the display, find the Scale/Div and press the associated button to the right of the screen.4-3. On the left of the screen, you will see, for example, 5.0dB/ displayed.4-4. On the keypad, enter 10.4-5. Under the Entry box, find Enter and press it.4-6. Note on the display that 10.0dB/ is now displayed. The vertical scale is now 10.0dB/division.4-7. Under the CONFIGURE box, press Marker. The Insertion loss is now displayed for each of the four frequencies you previously setup.4-8. Repeat steps 4 through 7 for 1.0dB and 0.1dB. Note that as you change the scale to smaller values, the signal trace becomes lessstable. This is normal as you are trying to measure very smallchanges.Alternative method: You can use the larger round tuning knob in the ENTRY box to change the vertical scale rather than the keypad.4-9. Under the CONFIGURE box, press SCALE. On the right side of the display, find Reference Position and press the associated buttonto the right of the screen. The vertical scale has 10 divisions. 0 isthe bottom and 10 is the top.4-10. On the keypad, press 5.4-11. Press Entry button in the ENTRY box. The 0dB vertical position is now in the centre of the screen. This setting will be required whenmeasuring systems, such as receiver multicouplers, which producegain.5. Make some conclusions and observations based on your insertion lossmeasurements.__________________________________________________________________________________________________________________________________________________________________________________________________________________________________________________________________________________________________________________________________________________________________Return Loss Measurement6. Set up a frequency range between 800 MHz and 900 MHz you want tooperate over, as you did in steps 1-1 to 1-9 in the Insertion Loss Measurement section.7. Calibrate the network analyzer for the return loss measurement7-1. Connect a short piece of 50 Ohm coax cable to the REFLECTION RF OUT type N-female connector.7-2. Leave the other end of the coax cable open (not connected).7-3. Under the MEAS box, press the MEAS 2 button.7-4. On the right side of the display, find the Reflection and press the associated button to the right of the screen.7-5. Under the CONFIGURE box, press CAL. This is the calibration button.7-6. On the display, find the Normalize and press the associated button to the right of the screen. Listen for a beep. This tells you that theequipment is now normalized.Note: The losses in the coax jumper cables are now normalized or factored out. Measurements made at the open end of the cable are now independent of the loss in the cable used to connect to the equipment.Losses between 800 MHz to 900 MHz are now adjusted to 0dB at the end of the cable. Return loss is a measurement of the power going out to the power being returned. Since this equipment is a 50 Ohm system, anything other than 50 Ohm will reflect some signal back to the equipment. An open (or short) circuit, in a lossless system will reflect all the power back to the equipment, and will give 0dB return loss. 1% of the power reflected would measure -20dB return loss. The reflected signal is 20dB lower than the forward signal. -14dB (VSWR=1.5:1) is 4% reflected power. -6dB (VSWR=3:1) is 25% reflected power.8. Make the frequency markers of 824, 849, 869 and 894 MHz as in steps 3-1 to 3-9 in Insertion Loss Measurement section.9. Set the vertical scales9-1. Under the CONFIGURE box, press SCALE.9-2. On the right side of the display, find the Scale/Div and press the associated button to the right of the screen9-3. On the left of the screen, you will see, for example, 5.0dB/ displayed.9-4. On the keypad, enter 10.9-5. Under the Entry box, find Enter and press it.9-6. Note on the display that 10.0dB/ is now displayed. The vertical scale is now 10.0dB/division.9-7. Under the CONFIGURE box, press Marker. The return loss is now displayed for each of the four frequencies you previously set up.9-8. Repeat steps 9-4 through 9-7 for 1.0dB and 0.1dB. Note that as you change the scale to smaller values, the signal trace becomesless stable. This is normal as you are trying to measure very smallchanges.Alternative method: You can use the larger round control knob in the ENTRY box to change the vertical scale rather than the keypad.10. Make some conclusions and observations based on your return lossmeasurements.__________________________________________________________________________________________________________________________________________________________________________________________________________________________________________________________________________________________________________________________________________________________________________________________________________________________________ ________________________________________________________________ ________________________________________________________________ ________________________________________________________________ ________________________________________________________________ ________________________________________________________________ ________________________________________________________________ ________________________________________________________________ ________________________________________________________________ ________________________________________________________________ ________________________________________________________________ ________________________________________________________________ ________________________________________________________________ ________________________________________________________________ ________________________________________________________________ ________________________________________________________________ ________________________________________________________________ ________________________________________________________________ ________________________________________________________________ ________________________________________________________________ ________________________________________________________________ ________________________________________________________________ ________________________________________________________________ ________________________________________________________________ ________________________________________________________________ ________________________________________________________________ ________________________________________________________________ ________________________________________________________________________________________________________________________________ ________________________________________________________________ ________________________________________________________________ ________________________________________________________________ ________________________________________________________________ ________________________________________________________________ ________________________________________________________________ ________________________________________________________________ ________________________________________________________________ ________________________________________________________________ ________________________________________________________________ ________________________________________________________________ ________________________________________________________________ ________________________________________________________________ ________________________________________________________________ ________________________________________________________________ ________________________________________________________________ ________________________________________________________________ ________________________________________________________________ ________________________________________________________________ ________________________________________________________________ ________________________________________________________________ ________________________________________________________________ ________________________________________________________________ ________________________________________________________________ ________________________________________________________________ ________________________________________________________________ ________________________________________________________________。
遥感图像处理 图像配准、图像裁剪 实验报告
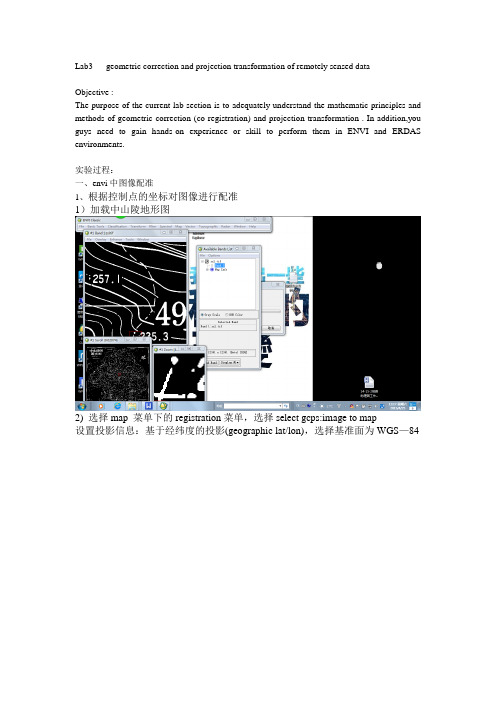
Lab3 geometric correction and projection transformation of remotely sensed dataObjective :The purpose of the current lab section is to adequately understand the mathematic principles and methods of geometric correction (co-registration) and projection transformation . In addition,you guys need to gain hands-on experience or skill to perform them in ENVI and ERDAS environments.实验过程:一、envi中图像配准1、根据控制点的坐标对图像进行配准1)加载中山陵地形图2) 选择map 菜单下的registration菜单,选择select gcps:image to map设置投影信息:基于经纬度的投影(geographic lat/lon),选择基准面为WGS—843)开始配准依次移动一级窗口中的光标到四个图廓点的位置,在三级放大窗口中把十字司放在经纬线的交点的中间位置,输入该点的经纬度于编辑对话框中:点击add point,完成对控制点的编辑4)选择option菜单下的wrap file将配准好的地图生成一幅新的影像修改生成图像信息,改为50带的UTM投影,基准面为WGS-84,保存2、图像到图像的配准1)加载全色波段影像作为待配准的影像将配准好的地形图作为基准图,全色影像作为要配准的图像在两幅图像上选择5个同名地物点进行配准点击show list 查看误差,不断调整误差直至所有误差在1以内二、erdas中的配准1、打开erdas,将zsl.tiff格式的数据导为erdas.img2、viewer中打开刚刚保存的图像,选择data preparation中的配准image geometric correction点击select viewer,点击下图层,选择polynomial多项式模型点击ok,修改投影Set projection from GCP tool,选择手动输入“keyboard”将4个图廓点的坐标输入表格display,保存图像,并加载,对配准后的图像进行投影修改3、图到图的配准以刚刚配准好的地形图为基准,加载多光谱图像选择data preparation中的配准image geometric correction选择地形图作为基准面,多光谱图像为待配准影像将相同点的坐标输入表格,并调整误差4、图像裁剪创建感兴趣区域,AOI下Tools创建一个任意形状的区域后,双击保存区域。
模拟集成电路版图基础

N阱电容
• 在场效应管的栅极和衬底之间,存在寄生电容。 称之为恶性寄生。但是,如果正好需要电容,这 个寄生是需要的。
金属电容
• 扩散电容缺点:
– 传递噪声:扩散电容在PN 结上会有一个寄生电容。任 何输入到扩散电容底部平行板上的信号将会自动耦合 到衬底上。在电路设计中有些情况,需要一个电容器 阻断直流信号,但是允许交流信号传输到下个电路块。
层与层间的寄生电容
• 寄生包括:
– 层对衬底形成寄生,层与层之间,层与层的侧面之间等等。 – 在ASIC 设计中,会用到自动布局布线工具,有些金属连线常常直接从某
个功能块上通过,如图3-3 所示。这是因为,数字集成电路为了节约芯片 面积,减少流片成本,而不得已为之。
• 在模拟集成电路中:
– 常常需要把敏感的信号线互相隔离开来,使它们不会互相影响。 – 所以为了减少寄生对电路的干扰,就需要在作版图时,最好不要到处布
– 它不仅具有寄生效应小 – 与偏置电压无关 – 低的温度系数 – 单位面积的电容值很高。
– 在制作固定面积金属电容中,交叉金属来得到 更大电容的方法同样可以用在POLY 电容中, 我们形象的称之为“三明治电容”
几种集成电容的比较
电阻电容画法实例: 电阻画法实例
• 现在以1.5K 和250Ω的Poly 电阻为例,介绍一下电阻的画 法。 – 首先查到Poly 的方块电阻值为25Ω/□ – 先做一个电阻单元,Poly 宽为2u,长为40u,两端通过引 线孔用金属引出。此电阻阻值为500Ω。
• 金属电容
– 大多数信号电容会由金属制成。这可以消除PN 结,可 以消除寄生二极管带来的电容。电容依赖性也将得到 消除。
金属电容
• 为了保证上部平行板和下部平行板没有短接,几乎所有的IC 工 艺都有一个非常厚的金属介质层。
Lab3多元均值的推断1均值向量的检验2均值向量的置信域

Lab3:多元均值的推断1.内容:练习多元正态分布特征的计算手段2.作业提交:完成后面的作业,现场演示给助教并解释结果.1均值向量的检验对多元数据,当关心其均值的假设检验问题时候,如果数据来自多元正态总体,则Hotelling’s T2统计量的精确分布可以得到,于是可以得到的检验p值是精确的.library(ICSNP)data(pulmonary)HotellingsT2(pulmonary)当总体不是多元正态分布,但是样本量充足,此时可以使用Hotelling’s T2统计量的极限分布来得到一个渐近检验,其p值是近似的.HotellingsT2(pulmonary,mu=c(0,0,2),test="chi")练习1.对表5.2数据(T5-2.dat),试检验假设H0:µ =(550,55,25).比较使用正态总体假设和渐近分布两种检验方法下的p值,分别(1)使用ICSNP包,(2)按步骤计算;对比你的结果.2均值向量的置信域利用Hotelling’s T2统计量,我们可以构造关于均值向量的置信域或者同时置信区间.在正态总体假设下,所得区域或区间为精确的置信域或区间;而当样本量充分时候,不假定正态性也可得一个渐近的置信域或者置信区间.练习2.阅读课件中关于置信区间的R代码,完成课本第五章作业5.30题.在分别假定正态和不假定正态两种情况下讨论.3缺失数据的处理观测数据的缺失是实际中常见的现象,判断缺失发生的机制是进行分析前必不可少的步骤.当数据的缺失机制是MAR时候,若数据来自正态总体,则估计总体参数的常用方法是EM算法.x<-read.csv("tao.csv",s=1)x.na<-apply(x,2,is.na)apply(x.na,2,sum)#variables have missing valuesx.case<-apply(x.na,1,sum)x.case.na<-x.case[x.case>0]length(x.case.na)/nrow(x)table(x.case.na)#missingness in cases###plotmmin<-apply(x,2,min,na.rm=T)sea.surface.temp<-x[,5]air.temp<-x[,6]humidity<-x[,7]#分析缺失机制#---------------------------------------------#impute missing values with fixed valuesea.na<-is.na(sea.surface.temp)sea.surface.temp[sea.na]<-mmin[5]*0.9air.na<-is.na(air.temp)air.temp[air.na]<-mmin[6]*0.9humidity.na<-is.na(humidity)humidity[humidity.na]<-mmin[7]*0.9par(mfrow=c(1,2))plot(humidity,air.temp,col=factor(x[,1]),pch=19)legend(-7.5,70,legend=c("1993","1997"),col=1:2,pch=19,border=FALSE)#存在许多一个变量缺失而另一个变量没有缺失的样本个体plot(sea.surface.temp,air.temp,col=factor(x[,1]),pch=19)legend(20,70,legend=c("1993","1997"),col=1:2,pch=19)#sea.surface.temp的缺失值比air.temp要多#有两个变量都缺失的样本个体#没有sea.surface.temp缺失而air.temp没有缺失的样本个体#两个图都明显存在两个类:1993和1997#所有humidity缺失的都是1993年的样本#shadow matrix,take air.temp(5)and humidity(6)as exampleismis.mat<-is.na(x)a<-apply(ismis.mat[,5:6],1,sum)table(a)a[ismis.mat[,5]<ismis.mat[,6]]<-3#对总共缺失1个变量的区分#哪个变量缺失:humidity缺失赋值3a<-a+1table(a)pchs<-ifelse(x[,1]==1993,20,24)par(mfrow=c(1,2))plot(jitter(as.numeric(ismis.mat[,5])),jitter(as.numeric(ismis.mat[,6])), xlab="air.temp",ylab="humidity",col=a,pch=pchs)plot(x[,7],x[,8],xlab="uwind",ylab="vwind",col=a,pch=pchs)##发现较小的uwind样本没有缺失,从而##缺失依赖于观察的其他变量,缺失机制可能是MAR练习3.阅读课件中关于置信区间的R代码,对数据集tao.csv,讨论(1)学习上述探索缺失机制的分析过程.(3)若假定数据的4-8列来自正态总体,使用EM算法分别估计1993和1997年正态总体的均值和协方差参数.。
Xv6实验报告

XV6实验报告学院软件学院专业软件工程年级2012级姓名殷博学号25122184822012 年11 月1日Xv6 Lab3实验报告PART AEx.1 分配环境数组设置page[]数组已经在Lab2中做过,以下envs是具体代码:Kern/pmap.c: men_init()分配物理空间,然后为它在虚拟地址空间中创建映射:Kern/pmap.c: men_init()EX.3 处理中断和异常读Chapter9,那里大致完整的介绍了一下中断的机制,在9.5 IDT Descriptors中提到了IDT 中一共有三种类型的描述符:∙Task gates∙Interrupt gates∙Trap gates下面是我在网上找到的对三种的门的描述:任务门(Task gates):任务门指示任务。
任务门内的选择子必须指示GDT中的任务状态段TSS描述符,门中的偏移无意义。
任务的入口点保存在TSS中。
利用段间转移指令JMP和段间调用指令CALL,通过任务门可实现任务切换。
中断门和陷阱门(Interrupt gates and Trap gates):中断门和陷阱门描述中断/异常处理程序的人口点。
中断门和陷阱门内的选择子必须指向代码段描述符,门内的偏移就是对应代码段的人口点的偏移。
中断门和陷阱门只有在中断描述符表IDT中才有效。
关于中断门和陷阱门的区别将在以后的文章中论述。
EX.4 建立IDT1.在kern/trapentry.S中定义好每个中断对应的中断处理程序首先开始定义中断处理程序,在kern/trapentry.S中提供了两个宏:Kern/trapentry.S他们的功能就是接受一个函数名和对应处理的中断向量编号,然后定义出一个相应的以该函数名命名的中断处理程序。
这样的中断向量程序的执行流程就是向栈里压入相关错误码和终端号,然后跳转到_alltraps来执行共有的部分(把Trapframe剩下的那些结构在栈中设置好)。
清华大学操作系统lab3实验报告范文
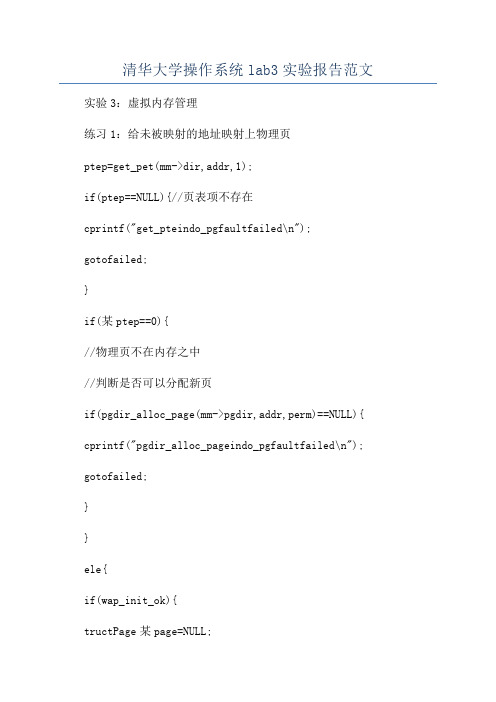
清华大学操作系统lab3实验报告范文实验3:虚拟内存管理练习1:给未被映射的地址映射上物理页ptep=get_pet(mm->dir,addr,1);if(ptep==NULL){//页表项不存在cprintf("get_pteindo_pgfaultfailed\n"); gotofailed;}if(某ptep==0){//物理页不在内存之中//判断是否可以分配新页if(pgdir_alloc_page(mm->pgdir,addr,perm)==NULL){ cprintf("pgdir_alloc_pageindo_pgfaultfailed\n"); gotofailed;}}ele{if(wap_init_ok){tructPage某page=NULL;ret=wap_in(mm,addr,&page);if(ret!=0){//判断页面可否换入cprintf("wap_inindo_pgfaultfailed\n");gotofailed;}//建立映射page_inert(mm->pgdir,page,addr,perm);wap_map_wappable(mm,addr,page,1);}ele{cprintf("nowap_init_okbutptepi%某,failed\n",某ptep); gotofailed;}}ret=0;failed:returnret;}练习2:补充完成基于FIFO算法_fifo_map_wappable(tructmm_truct某mm,uintptr_taddr,tructPage某page,intwap_in){lit_entry_t某head=(lit_entry_t某)mm->m_priv;lit_entry_t某entry=&(page->pra_page_link);aert(entry!=NULL&&head!=NULL);lit_add(head,entry);return0;}pra_page_link用来构造按页的第一次访问时间进行排序的一个链表,这个链表的开始表示第一次访问时间最近的页,链表的尾部表示第一次访问时间最远的页。
Lab3_分支结构
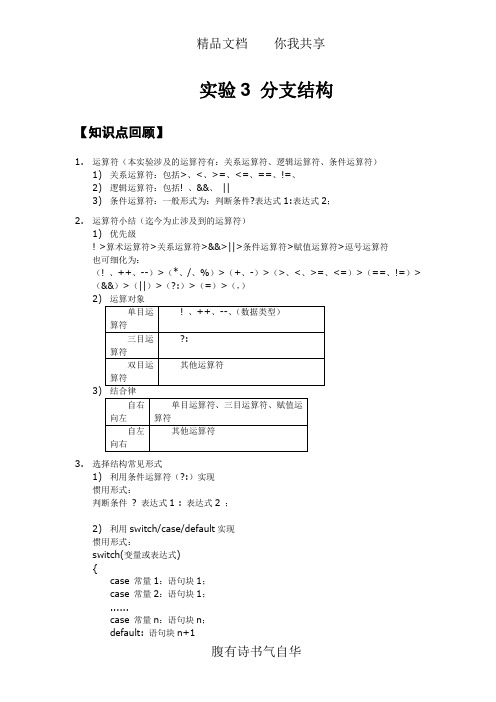
实验3 分支结构【知识点回顾】1.运算符(本实验涉及的运算符有:关系运算符、逻辑运算符、条件运算符)1)关系运算符:包括>、<、>=、<=、==、!=、2)逻辑运算符:包括! 、&&、||3)条件运算符:一般形式为:判断条件?表达式1:表达式2;2.运算符小结(迄今为止涉及到的运算符)1)优先级! >算术运算符>关系运算符>&&>||>条件运算符>赋值运算符>逗号运算符也可细化为:(! 、++、--)>(*、/、%)>(+、-)>(>、<、>=、<=)>(==、!=)>(&&)>(||)>(?:)>(=)>(,)2)3)3.选择结构常见形式1)利用条件运算符(?:)实现惯用形式:判断条件? 表达式1 : 表达式2 ;2)利用switch/case/default实现惯用形式:switch(变量或表达式){case 常量1:语句块1;case 常量2:语句块1;......case 常量n:语句块n;default: 语句块n+1}3)利用if/else实现惯用形式以及流程图:【典型例题】1.例1:水费问题。
编写计算客户水费的程序。
水费包括阶梯水费,阶梯一:用水量20千加仑以内(含20),每一千加仑1.10美元的消费水费;阶梯二:超过20加仑,但不超过40千加仑用水量,每一千加仑1.50美元的消费水费;阶梯三:超过40千加仑以上的部分,每一千加仑2.00美元的消费水费。
用量从最近水表读数和前一抄表周期末的读数计算得到。
此外,如果客户的未缴纳余额大于零,还要交纳2美元滞纳金。
效果如下图:分析:总水费是阶梯用量水费、未缴纳余额、以及可能的滞纳金之和。
阶梯用量水费必须计算。
为了得到计算结果,必须知道以前和现在的水表读数(问题输入)。
西电电报实验lab3无线电报干扰抗干扰

无线电报系统工程体验实验Lab3:无线电报干扰/抗干扰学院:通信工程学院专业名称:通信工程姓名:班级:1401014学号:140101400设计时间:2016.4.11(一)概要本次实验分为两个任务,通过两人一小组,六人三个小组一个大组合作实验的方式,通过使用电键、对讲机、耳机、电报盒子,对通信系统中的差错控制技术和跳频技术进行了简单的体验。
在之前实验的基础上增添发送了分组数据+校验码,以及接收方反馈信号,同时体验了两个发送方占用同一频道时的干扰现象。
实验较为成功,利用差错控制技术信息传递的准确率有了明显的提高,利用不断转换频道的方式使得干扰组没有足够的时间进行数据传输的干扰,使得信息顺利传递。
(二)实验内容1、简介本次实验主要任务是对通信系统中的差错控制技术和跳频技术进行简单的体验,并理解通信系统中的抗干扰技术。
对关于差错控制、跳频等抗干扰技术有一直观了解。
本次实验的目标:个人目标:∙ 掌握检错重发(ARQ)技术;∙ 掌握跳频技术以躲避人为干扰;∙ 使用检错重发/跳频完成数据的传输。
团队目标:∙ 完成使用检错重发/跳频技术的无线电报的通信;∙ 确保每个成员完成个人目标;∙组织完成一次抗干扰技术的专题讨论。
2、理论差错控制(error control)是在数字通信中利用编码方法对传输中产生的差错进行控制,以提高数字消息传输的准确性。
在ARQ方式中,接收端检测出有差错时,就设法通知发送端重发,直到正确的码字收到为止。
ARQ方式使用检错码,但必须有双向信道才可能将差错信息反馈到发送端。
同时,发送方要设置数据缓冲区,用以存放已发出的数据以便于重发出错的数据。
跳频技术(Frequency-Hopping Spread Spectrum;FHSS)。
跳频是最常用的扩频方式之一,其工作原理是指收发双方传输信号的载波频率按照预定规律进行离散变化的通信方式,也就是说,通信中使用的载波频率受伪随机变化码的控制而随机跳变。
LabVIEW进阶培训_数据采集

Lab1熟悉实验环境目标:NI ELVIS和NI myDAQ是NI针对高校教学的两种多功能虚拟仪器实验平台(详见附录),其功能中包含了数据采集。
对于数据采集相关的功能而言(模拟信号输入、模拟信号生成、数字信号输入与输出、计数器相关的输入与输出),其开发方式与其他NI数据采集设备完全相同。
因此在后续练习中,我们将以NI ELVIS或NI myDAQ作为学习数据采集操作的硬件平台。
通过本练习,您将首先熟悉后续练习中将反复用到的这两个平台的基本操作,主要是通过使用ELVIS或myDAQ上的标准函数信号发生器(FGEN),示波器(SCOPE),数字万用表(DMM),数字信号输入(DigIn),数字信号输出(DigOut)等仪器功能,了解和掌握ELVIS和myDAQ 驱动程序自带的虚拟仪器软面板的使用.Pre-Lab 检查硬件连接与配置1. (如果使用ELVIS)检查ELVIS工作台的电源(位于ELVIS背后)已经连接并打开,并且已经通过USB线缆连接至PC机,同时ELVIS工作台上的原型板电源也已上电。
这一部完成的标志是ELVIS右上方的指示灯点亮,同时ELVIS原型板左下方的三盏电源指示灯也点亮。
(如果使用myDAQ)检查myDAQ已通过USB线缆连接至电脑,如果正常,myDAQ上USB接口旁边的蓝色LED指示灯会点亮。
2. 通过开始>>所有程序>>National Instruments>>Measurement & Automation打开NIMeasurement & Automation Explorer (以后简称MAX,这是一个可以管理所有系统中的NI设备硬件资源并进行相关配置和自检的一个软件,随任何NI驱动程序会安装在PC中)3. (对于ELVIS)在MAX中单击“设备和接口”,检查是否能找到NI ELVIS II+ (取决于实验室配置, 有可能找到的是NI ELVIS II,不带加号),如果连接正常,前面的板卡符号应该显示为绿色. 可以单击右键选择“自检”对设备进行自检. 检查设备名是否已经是像下图一样显示为“Dev1”,如果不是的话,点击右键可以将设备重命名为“Dev1”.(对于myDAQ)在MAX中单击“设备和接口”,检查是否能找到NI myDAQ,如果连接正常,前面的板卡符号应该显示为绿色. 可以单击右键选择“自检”对设备进行自检. 检查设备名是否已经是像下图一样显示为“Dev1”,如果不是的话,点击右键可以将设备重命名为“Dev1”.Lab 1.1 函数发生器(FGEN)和示波器(SCOPE)1. (对于ELVIS)用BNC接线将ELVIS工作台上的SCOPE CH0的BNC接口与原型板(Prototyping Board)上的BNC 1接口相连;在原型板的面包板上用导线将FGEN连接到BNC 1+(对于myDAQ)用导线将AO 0连至AI 0+,将AGND连至AI 0-2. 然后通过Windows中的开始>>所有程序>>National Instruments>>NI ELVISmx for NIELVIS & NI myDAQ>>NI ELVISmx Instrument Launcher打开NI ELVISmx Instrument Launcher(如果打开NI ELVISmx Instrument Launcher时出现问题也没有关系,可通过开始>>所有程序>>National Instruments>>NI ELVISmx for NI ELVIS & NI myDAQ>>Instruments展开Instruments文件夹,可以看到12种仪器的图标文件。
Loudspeaker LAB 3 中文版简易入门指南

Loudspeaker LAB 3中文版简易入门指南Loudspeaker LAB 3基本功能:●时域和频域测量(脉冲、频率响应和阻抗)。
●分频器设计与模拟。
●箱体设计与模拟。
最低系统要求:操作系统Windows 95CPU 奔腾120显示800x600、16 位彩色声卡16 位, 立体声全双工,见帮助文件支持硬件。
推荐配置:操作系统Windows 2000 SP3 / Windows XPCPU 奔腾III 1 GHz、阿瑟龙1GHz 或更高显示1024x768、16 位彩色或更高声卡24 位、立体声全双工,见帮助文件支持硬件。
首先了解一下软件安装后的目录结构Loudspeaker LAB3 软件的根目录。
Alignments 保存音箱的调准。
Background 保存LspLAB3的桌面背景即墙纸,用户可以随意加入BMP各式的图片。
Calibration 保存LspLAB3的校准。
Examples 一些实例。
Mixer Windows混音器设置。
Presets 保存自定义的测量预置文件。
TEMP 临时目录。
用户界面吕工具栏总体设置在桌面空白处单击鼠标右键,在弹出的选单中选择总体设置。
或单击文件,选择总体设置。
在这里你可以关闭每次启动时那个讨厌的开始图片,还可以改变环境温度、桌面背景的图片和临时目录位置。
外观式样在已测量或打开的曲线图中单击鼠标右键,选择外观,打开外观式样对话框。
总感觉自己的测量软件根本就不像专业的测量系统,怎么看都像是业余软件,为了心理感觉,发挥想象,随便改吧。
入门指南因为这里仅仅是简易的入门指南,所以下面只介绍测量部分的设置与基本操作,对于箱体设计与分频器设计及模拟部分,因为软件本身有相应的操作向导,可以指导你一步一步进行操作,如果使用汉化的软件将会更容易使用。
A.测量设置点击工具栏的测量设置按钮硬件设置在弹出的测量设置对话框中选择硬件标签。
1、在输入与输出设备栏的下拉选单中选择当前系统的实际输入与输出设备,名称就是你当前使用的声卡的名称。
Mit6.824Lab3KVRaft实现

Mit6.824Lab3KVRaft实现paperLab3 之前,结合 Lab2 的实现以及 Raft 论⽂进⾏实现 Lab3,即基于 Lab2 实现的 Raft 库构建容错键/值存储服务。
的 paper 中给出的进⾏理解本架构,下⾯会给出个⼈理解的通俗版本的图,来帮助理解。
其次,如果读过paper和Raft论⽂,应该会清楚⼀个要点:每个KVServer(raftServerId) 对应paper架构图⾥的 State Machine,也就是状态机,⽽每个 KVServer 对应 Lab2 实现的 Raft peer,并且 KVServer 之间是借助 Raft Service 来实现共识性,不直接交互的。
根据 paper ⾥对 Lab3 要求的描述,可以清楚 KVServer 通过ClientId可以知道 Client 的请求来⾃具体哪个客户端,同时保存每个客户端的请求信息和状态,所以每个客户端请求过来时,都赋予了⼀个刚⽣成的唯⼀ID,并且同⼀个请求对应唯⼀的序列号(ClientId),这两个 ID 就可以确定唯⼀性请求。
这些在 client.go 和 server.go 就有具体代码和注释说明。
客户端的Id⽤ nrand() 随机⽣成唯⼀ID,经过测试最多有7个客户端ID且不会重复,每个 Client 维护⼀个 lastRequestId,通过mathrand(len(KVServer))⽣成,表⽰每⼀次请求的 Seq 序列号 clientId。
KVServer lastRequestId,使得 Client 并发调⽤时,能通过最新的 RequestId,得到最新的结果,保证应⽤程序的强⼀致性,这个强⼀致性通过定时器实现⼀段时间内(500ms)的分布式数据强⼀致性。
请求和响应流程请求响应流程,以Put/Get为例⼦:KVServer 收到 Client 的Request请求后,通过raft.Start() 提交Op给raft 库, 然后通过Chan机制,等待Raft 返回结果到 waitApplyCh,也就是等待Raft应⽤⽇志到状态机后,才通过给chan缓冲区放⼊响应数据来响应给KVServer。
实验三交流(AC)仿真

实验四、交流(AC)仿真概述该实验继续amp_1900任务并与上一实验使用相同子电路。
这个练习教交流(AC)仿真的基础,包括小信号增益和噪声,也给出了许多数据显示中控制和操作数据的许多细节特性。
任务●进行交流(AC)小信号和噪声仿真●调整引脚/导线符号●变量扫描和建立方程●控制图表,曲线,数据组和交流(AC)源目录1.从一个设计到另一个设计的复制&粘贴(Ctrl+C/ Ctrl+V)操作 (56)2.对复制的电路和引脚符号进行改正 (56)3.层次(push and pop)操作验证子电路 (58)4.设置带噪声的AC仿真 (58)5.对噪声数据仿真并列表 (60)6.控制方程和节点电压的输出 (61)7.无噪声仿真 (63)8.用测量方程写出数据显示方程 (63)9.使用测量和数据显示子方程 (63)10.对AC分析数据绘出相位和群时延图 (65)11.变量信息和what函数 (68)12.选学——Vcc扫描(如同电源电压在减小) (68)步骤1.从一个设计到另一个设计的复制&粘贴(Ctrl+C/ Ctrl+V)操作a. 打开上一设计(dc_net),并通过在周围区域拖动鼠标复制变亮的电路,这被称为橡皮条(rubber banding)。
当该项目变亮时,通过Ctrl+C键或Edit>Copy命令复制。
推荐使用Ctrl+C,这样可以省去鼠标点击。
b. 用File>New Design命令创建一个新原理图,命名为:ac_sim。
然后,用Ctrl+V键或Edit>Paste并通过点击新原理图插入(ghost镜像)复制内容。
c. 保存ac_sim设计。
你必须保存它,否则它不会被写入数据库。
d. 点击Window>design Open命令。
这个命令可以让你进入那些在内存中但在窗口中未显示或未存在记录中的设计。
出现对话框后,选择dc_net 并点击OK,然后用File>Close Design命令关闭dc_net设计(不需要保存改变的设置)。
品牌化妆品全成分表
5
3Lab
水、月桂醇硫酸酯铵、氢化霍霍巴油、椰油酰两性基二乙酸二钠、丙二醇 3Lab 完美去角 、椰油酰胺丙基甜菜碱、乙酰丙酸钠、大茴香酸钠、甘油、氢氧化铵、丙 质洁面乳 烯酸(酯)类/C10-30 烷醇丙烯酸酯交联聚合物、羟乙基纤维素、尿囊素、 丁二醇、母菊(CHAMOMILLA RECUTITA)花提取物、EDTA 二钠、(日用)香精
7
3Lab
水、甘油、丙二醇、丁二醇、山梨(糖)醇、酵母提取物、透明质酸钠、绞 股蓝(GYNOSTEMMA PENTAPHYLLUM)提取物、人参(PANAX GINSENG)根提取物 、茶(CAMELLIA SINENSIS)叶提取物、银杏(GINKGO BILOBA)叶提取物、余 3Lab 完美平衡 甘子(PHYLLANTHUS EMBLICA)果提取物、PCA 钠、聚乙二醇-6、聚乙二醇爽肤水 32、羟丙基双-羟乙基二甲基氯化铵、木糖醇基葡糖苷、脱水木糖醇、木糖 醇、乙酰丙酸钠、大茴香酸钠、苯氧乙醇、辛甘醇、EDTA 二钠、(日用)香 精
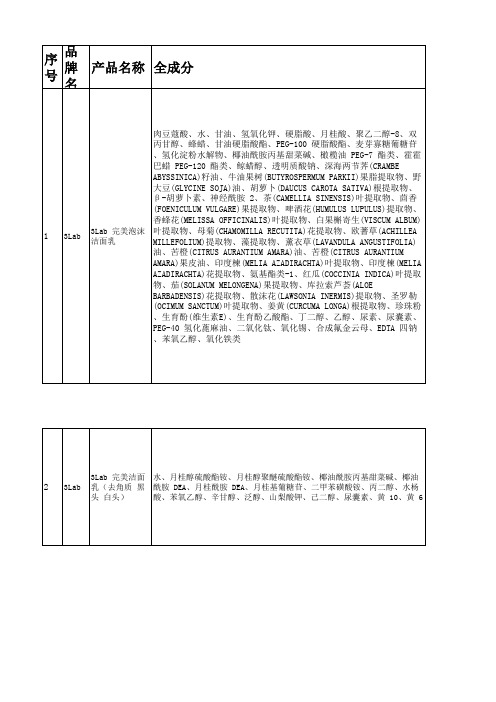
号序号品牌名称产品名称全成分13lab3lab完美泡沫洁面乳肉豆蔻酸水甘油氢氧化钾硬脂酸月桂酸聚乙二醇8双丙甘醇蜂蜡甘油硬脂酸酯peg100硬脂酸酯麦芽寡糖葡糖苷氢化淀粉水解物椰油酰胺丙基甜菜碱橄榄油peg7酯类霍霍巴蜡peg120酯类鲸蜡醇透明质酸钠深海两节荠crambeabyssinica籽油牛油果树butyrospermumparkii果脂提取物野大豆glycinesoja油胡萝卜daucuscarotasativa根提取物胡萝卜素神经酰胺2茶camelliasinensis叶提取物茴香foeniculumvulgare果提取物啤酒花humuluslupulus提取物香蜂花melissaofficinalis叶提取物白果槲寄生viscumalbum叶提取物母菊chamomillarecutita花提取物欧蓍草achilleamillefolium提取物藻提取物薰衣草lavandulaangustifolia油苦橙citrusaurantiumamara油苦橙citrusaurantiumamara果皮油印度楝meliaazadirachta叶提取物印度楝meliaazadirachta花提取物氨基酯类1红瓜cocciniaindica叶提取物茄solanummelongena果提取物库拉索芦荟aloebarbadensis花提取物散沫花lawsoniainermis提取物圣罗勒ocimumsanctum叶提取物姜黄curcumalonga根提取物珍珠粉生育酚维生素e生育酚乙酸酯丁二醇乙醇尿素尿囊素peg40氢化蓖麻油二氧化钛氧化锡合成氟金云母edta四钠苯氧乙醇氧化铁类23lab3lab完美洁面乳去角质黑头白头水月桂醇硫酸酯铵月桂醇聚醚硫酸酯铵椰油酰胺丙基甜菜碱椰油酰胺dea月桂酰胺dea月桂基葡糖苷二甲苯磺酸铵丙二醇水杨酸苯氧乙醇辛甘醇泛醇山梨酸钾己二醇尿囊素黄10黄633lab3lab完美卸妆凝胶水月桂醇聚醚硫酸酯钠椰油酰胺丙基甜菜碱月桂基葡糖苷聚季铵盐10椰油酰两性基二丙酸二钠木糖醇基葡糖苷脱水木糖醇木糖醇尿囊素聚山梨醇酯20泛醇柠檬酸薰衣草lavandulaangustifolia油茶camelliasinensis叶提取物银杏ginkgobiloba叶提取物丁二醇余甘子phyllanthusemblica果提取物乙酰丙酸钠大茴香酸钠苯氧乙醇辛甘醇43lab3lab完美洁面乳液水辛酸癸酸甘油三酯甘油
一级注册计量师《计量专业案例分析》冲刺试卷一
一级注册计量师《计量专业案例分析》冲刺试卷一[问答题]4.使用格拉布斯准则检验以下n=6个重复观测值中是否存在异常值:0.82,0.78,0.80,0.91,0.79,0.76参考答案:参考解析:算术平均值:实验标准偏差:s(x)=0.0529;计算各个观测值的残差为:0.01,-0.03,-0.01,0.10,-0.02,-0.05;其中绝对值最大的残差为0.10,相应的观测值x=0.91为可疑值则按置信度(概率)p=95%=0.95,即显著性水平ɑ=1-0.95=0.05,n=6,查表3-4得:G(0.05,6)=1.82,则可以判定=0.91为异常值,应予以剔除。
在剔除=0.91后,剩下n=5个重复观测值,重新计算算术平均值为0.79,实验标准偏差s=0.022,并在5个数据中找出残差绝对值为最大的值=0.76,则|0.76-0.79|=0.03再按格拉布斯准则进行判定:α=0.05,n=5,查表得:G(0.05,5)=1.67,则可以判定0.76不是异常值。
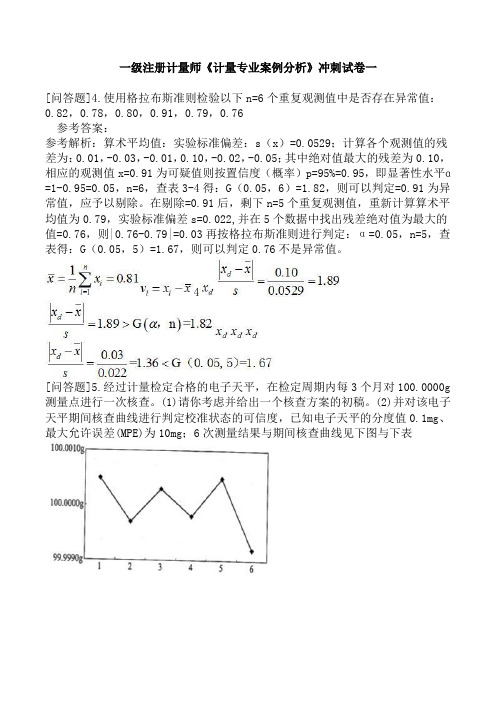
4[问答题]5.经过计量检定合格的电子天平,在检定周期内每3个月对100.0000g 测量点进行一次核查。
(1)请你考虑并给出一个核查方案的初稿。
(2)并对该电子天平期间核查曲线进行判定校准状态的可信度,已知电子天平的分度值0.1mg、最大允许误差(MPE)为10mg;6次测量结果与期间核查曲线见下图与下表参考答案:参考解析:(1)该电子天平期间核查方案的初稿①选用100gF1等级克组砝码作为核查标准②对电子天平100.0000g秤量点作为核查点③对测量点进行多次测量,取其平均值作为核查结果.④以2次核查结果的差值或核查结果与已知砝码量值之间的差值来评价核查结果⑤若差值小于电子天平的相应秤量的允许误差或测量不确定度,则该电子天平校准状态保持(2)分析电子天平期间核查校准状态的可信度从期间核查测量结果与期间核查曲线,获知计算相邻2次测量数据之差,见下表:[问答题]6.表1相色谱仪(×××检测器)期间核查用部分计量器具表2气相色谱仪(×××检测器)部分计量技术指标要求(1)指出表1和表2中计量单位使用不规范之处并更正;(2)列出计量单位“V•L/kg”对应的两种中文符号的表示形式和该单位的中文名称;(3)由表中气相色谱仪的灵敏度的计量单位推算基本国际单位中的量纲表示形式。
晶体管特性曲线实验报告

竭诚为您提供优质文档/双击可除晶体管特性曲线实验报告篇一:Lab3三极管特性实验报告丁俐夫实验报告课程名称:_______________________________指导老师:________________成绩:__________________实验名称:_______________________________实验类型:________________同组学生姓名:__________一、实验目的和要求(必填)二、实验内容和原理(必填)三、主要仪器设备(必填)四、操作方法和实验步骤五、实验数据记录和处理六、实验结果与分析(必填)七、讨论、心得一、实验目的1.2.3.4.1.2.3.4.理解三极管的基本结构、工作原理与工作特性理解三极管非门电路的基本原理,会设计基本的三极管非门电路学会测量三极管非门电路的特性理解集成门电路的基本构造,学会测试集成门电路的静态逻辑功能,并测量集成门电路的特性使用万用表或multisim仿真测试三极管的特性利用三极管设计简单的非门电路,测试三极管非门电压传输的特性测量集成门电路的输入输出信号与静态逻辑功能测试集成非门电压传输的特性二、实验内容三、实验原理1.万用表判断三极管类型与极性的方法1)导通法测量类型与极性假定我们并不知道被测三极管是npn型还是pnp型,也分不清各管脚是什么电极。
首先判断哪个管脚是基极。
这时,我们任取两个电极(如这两个电极为1、2),用万用表二极管蜂鸣档位正反向测量,再取1、3电极和2、3电极,分别正反向测量。
在这三次颠倒测量中,必然有一次正反向均不导通,这一次的两极分别为集电极(c)和发射极(e),剩下的一个管脚必然是要寻找的基极(b)。
找到基极后我们可以判断三极管的类型。
将万用表置于二极管蜂鸣档位,把红表笔接在基极上,将黑表笔先后接在其余两个极上,如果两次均导通,则为npn 型,否则为pnp型。
最后判断集电极与发射极。
对npn型二极管用二极管档位,红表笔与基极相连,把红表笔接在基极上,将黑表笔先后接在其余两个极上,有两次读数,大的一次就是发射极。
- 1、下载文档前请自行甄别文档内容的完整性,平台不提供额外的编辑、内容补充、找答案等附加服务。
- 2、"仅部分预览"的文档,不可在线预览部分如存在完整性等问题,可反馈申请退款(可完整预览的文档不适用该条件!)。
- 3、如文档侵犯您的权益,请联系客服反馈,我们会尽快为您处理(人工客服工作时间:9:00-18:30)。
Adding Custom IP to the System IntroductionThis lab guides you through the process of creating and adding a custom peripheral to a processor system by using the Vivado IP Packager. You will create an AXI4Lite interface peripheral. ObjectivesAfter completing this lab, you will be able to:∙Use the IP Packager feature of Vivado to create a custom peripheral∙Modify the functionality of the IP∙Add the custom peripheral to your design∙Add pin location constraints∙Add block memory to the systemProcedureThis lab is separated into steps that consist of general overview statements that provide information on the detailed instructions that follow. Follow these detailed instructions to progress through the lab.This lab comprises 4 primary steps: You will use a peripheral template to create a peripheral, Package the IP using IP Packager, import, add and connect the IP in the design, and add the Block RAM (BRAM) Memory.Design DescriptionYou will extend the Lab 2 hardware design by creating and adding an AXI peripheral (refer to LED_IP in Figure 1) to the system, and connecting it to the LEDs on the ZYBO board.You will use the IP Packager to generate the custom IP. Next, you will connect the peripheral to the system and add pin location constraints to connect the LED display controller peripheral to the on-board LED display. Finally, you will add BRAM Controller and BRAM before generating the bitstream.Figure 1. Design Updated from Previous LabGeneral Flow for this LabCreate a Custom IP using the Create and Package IP WizardStep 1 1-1.Use the provided axi_lite slave peripheral template and the custom IPsource code to create a custom IP.1-1-1.Open Vivado by selecting Start > All Programs > Xilinx Design Tools > Vivado 2013.4 > Vivado 2013.41-1-2.Click Manage IP and select New IP Location and click Next in the New IP Locationwindow1-1-3.Select Verilog as the Target Language, Mixed as the Simulator language, and for IP location, type C:\xup\embedded\labs\led_ip and click Finish (leave other settings as defaults)Figure 2. New IP Location formA Virtex 7 part is chosen for this project, but later compatibility for other devices will be added tothe packaged IP later.1-1-4.Click OK to create the led_ip directory.1-2.Run the Create and Package IP Wizard1-2-1.Select Tools > Create and Package IPStep 1:CreateCustom IPusingPeripheralTemplateStep 2:PackageP eripheralusing IPPackagerStep 3:Set theProjectSettingsStep 4:Add the IP.BRAM, andConstraints1-2-2.In the window, click Next1-2-3.Select Create new AXI4 peripheral, specify the IP Definition location asC:/xup/embedded/labs/led_ip and click Next1-2-4.Fill in the details for the IPName: led_ipDisplay Name: led_ip_v1_0(Fill in a description, Vendor Name, and URL)Figure 3. Updating Peripheral Details form1-2-5.Click Next1-2-6.Change the Name of the interface to S_AXI1-2-7.Leave the other settings as default and click Next (Lite interface, Slave mode, Data Width 32, Registers 4)Figure 4. Naming the AXI interface1-2-8.Select Generate Drivers and click Next1-2-9.Select Add IP to Catalog and open IP in editing session selected and click Finish1-2-10.In the sources panel, double-click the led_ip_v1_0.v file and scroll down to line 15 where users port definition space is provided.1-2-11.Add the line:output wire [3:0] LED,(Notice the extra comma needed at the end of line)Figure 5. Adding users port definition1-2-12.Insert the following at line ~48:. LED(LED),Figure 6. Adding port connection with a lower-level module1-2-13.Save the file by selecting File > Save File1-2-14.Expand led_ip_v1_0 in the sources view if necessary, and open led_ip_v1_0_S_AXI.v1-2-15.Add the LED port to this file too, at line 15Figure 7. Declaring users port in the lower-level module1-2-16.Scroll down to ~line 397 and insert the following code to instantiate the user logic for the LED IP (This code can be typed directly, or copied from the user_logic_instantiation.txt file in the lab3 source folder.)Figure 8. Instantiating lower-level user moduleCheck all the signals that are being connected and where they originate.1-2-17.Save the file by selecting File > Save File1-2-18.Click on the Add Sources in the Flow Navigator pane, select Add or Create Design Sources, browse to c:\xup\embedded\sources\lab3, select the lab3_user_logic.v file and click OK, and then click Finish to add the file.Check the contents of this file to understand the logic that is being implemented. Notice theformed hierarchy.1-2-19.Click Run Synthesis and Save if prompted. (This is to check the design synthesizes correctly before packaging the IP.1-2-20.Check the Messages tab for any errors and correct if necessary before moving to the next stepWhen Synthesis completes successfully, click Cancel.1-3.Update the IP project with the necessary source files in the appropriate directory1-3-1.Expand the source hierarchy, if needed, and select lab3_user_logic entry.1-3-2.Right-click and select Remove File from the Project.1-3-3.Click OK to remove the file.Similarly, remove all the files which were added from outside the project directory. In this lab, you don’t have more files to be removed.ing Windows Explorer, copy the lab3_user_logic.v file from thec:\xup\embedded\sources\lab3 directory and paste it in the current IP project directory atc:\xup\embedded\labs\led_ip\led_ip_1.0\hdl directory.1-3-5.Click on the Add Sources in the Flow Navigator pane, select Add or Create Design Sources, browse to c:\xup\embedded\labs\led_ip\led_ip_1.0\hdl, select the lab3_user_logic.v file and click OK, and then click Finish to add the file.1-4.Package the IP1-4-1.Click on the Package IP – led_ip tab1-4-2.For the IP to appear in the IP catalog in particular categories, the IP must be configured to be part of those categories. To change which categories the IP will appear in the IP catalog click thebrowse box on the Categories line. This opens the Choose IP Categories window1-4-3.For the exercise purpose, uncheck the AXI Peripheral box and check the Basic Elements and click OK.Figure 9. Specify the category for IP Packager IP1-4-4.Select IP Compatibility. This shows the different Xilinx FPGA Families that the IP supports. The value is inherited from the device selected for the project.1-4-5.Right click in the Family Support table and select Add Family… from the menu.1-4-6.Select the Zynq family as we will be using this IP on the ZYBO board, and click OK.1-4-7.You can also customize the address space and add memory address space using the IP Addressing and Memory category. We won’t make any changes.1-4-8.Click on IP File Groups and click Merge changes from IP File Groups WizardFigure 10. Updating the file groupThis is to update the IP Packager with the changes that were made to the IP and thelab3_user_logic.v file that was added to the project.1-4-9.Do the same for IP Customization Parameters (Merge changes from IP Customization Parameters Wizard)Notice that the IP Ports view now shows the user created LED portFigure 11. User port imported1-4-10.Select Review and Package, and notice the path where the IP will be created.Figure 12. IP location1-4-11.Click Re-Package IPYou will see a warning message indicating that the led_ip directory is already in the project. Click OK to ignore it.1-4-12.In the Vivado window click File > Close ProjectModify the Project Settings Step 3 2-1.Open the previous project, or use the lab2 project from the labsolution directory, and save the project as lab3. Set Project Settings to point to thecreated IP repository.2-1-1.Start the Vivado if necessary and open either the lab2 project you created in the previous lab or the lab2 project in the labsolution directory2-1-2.Select File > Save Project As … to open the Save Project As dialog box. Enter lab3 as the project name. Make sure that the Create Project Subdirectory option is checked, the projectdirectory path is c:\xup\embedded\labs\ and click OK.This will create the lab3 directory and save the project and associated directory with lab3 name. 2-1-3.Click Project Settings in the Flow Navigator pane.2-1-4.Select IP in the left pane of the Project Settings form.2-1-5.Click on the Add Repository… button, browse to c:\xup\embedded\labs\led_ip and click Select.The led_ip_v1_0 IP will appear the IP in the Selected Repository window.Figure 13. Specify IP Repository2-1-6.Click OK.Add the Custom IP, BRAM, and the Constraints Step 4 3-1.Add led_ip to the design and connect to the AXI4Lite interconnect in the IPI.Make internal and external port connections. Establish the LED port asexternal FPGA pins.3-1-1.Click Open Block Design under IP Integrator in the Flow Navigator pane, and select system.bd to open IP Integrator3-1-2.Click the Add IP icon and search for led_ip_v1_0 in the catalog by typing “le d” in the search field.Figure 12. Searching for led_ip in the IP Catalog3-1-3.Double-click led_ip_v1_0 to add the core to the design.3-1-4.Select the IP in the block diagram and change the instance name to led_ip in the properties view. 3-1-5.Click on Run Connection Automation, select /led_ip/S_AXI and click OK to automatically make the connection from the AXI Interconnect to the IP.3-1-6.Click the regenerate button () to redraw the diagram.Figure 13. LED IP Block added and connected3-1-7.Select the LED[3:0] port on the led_ip instance (by clicking on its pin), right-click and select Make External.Lab WorkbookAdding Custom IP to the System/support/university ZYBO 3-11xup@ © copyright 2014 XilinxFigure 14. LED external port added and connected3-1-8. Select the Address Editor tab and verify that an address has been assigned to led_ip .Figure 15. Address assigned for led_ip 3-2. Add BRAM to the design3-2-1. In the Block Diagram, click the Add IP iconand search for BRAM and add one instance of the AXI BRAM Controller3-2-2. Run Connection Automation on axi_bram_ctrl_0/S_AXI and click OK when prompted to connectit to the M_AXI_GP0 Master.3-2-3. Double click on the block to customize it and change the number of BRAM interfaces to 1 andclickOK .Notice that the AXI Protocol being used is AXI4 instead of AXI4Lite since BRAM can provide higher bandwidth and the controller can support burst transactions.Adding Custom IP to the SystemLab WorkbookZYBO 3-12/support/universityxup@ © copyright 2014 XilinxFigure 16. Customize BRAM controller3-2-4. Run Connection Automation to add and connect a Block Memory Generator (This could beadded manually)3-2-5. Validate the design to ensure there are no errors, and click the regenerate button () to redrawthe diagram.The design should look similar to the figure below.Figure 17. Completed Block DiagramLab Workbook Adding Custom IP to the System/support/university ZYBO 3-13xup@ © copyright 2014 Xilinx 3-2-6. In the Address editor, increase the Range of the axi_bram_ctrl_0 to 8KFigure 20. Adjusting memory size3-2-7. Press F6 to validate the design one last time.3-3. Update the top-level wrapper and add the provided lab3_system.xdcconstraints file.3-3-1. In the sources view, right-click on the block diagram file, system.bd , and select Create HDLWrapper to update the HDL wrapper file, and when prompted, select Let Vivado ManageWrapper and auto-update and click OKThe system_wrapper.vhd file will be updated to include the new IP and ports. Double-click on the system-wrapper content to verify that LED port has been added.3-3-2. Click Add Sources in the Flow Navigator pane, select Add or Create Constraints , and clickNext .3-3-3. Click the Add Files button, browse to the c:\xup\embedded\sources\lab3 folder, selectlab3_system.xdc3-3-4. Click Finish to add the file.3-3-5. Expand Constraints folder in the Sources pane, and double-click lab3_system.xdc file entry tosee its content. This file contains the pin locations and IO standards for the LEDs on the ZYBOboard. This information can usually be found in the manufacturer ’s datasheet for the board.3-3-6. Click on the Generate Block Design > system.bd in the Flow Navigator, to generate the outputproducts of various IPs added to the project.3-3-7. Select File > Close Project to close the project as we will implement the design in the next lab. 3-3-8. Click Save, and OK to save the design and close the project.ConclusionVivado IP packager was used to import a custom IP block into the IP library. The IP block was then addedto the system. Connection automation was run where available to speed up the design of the system by allowing Vivado to automatically make connections between IP. An additional BRAM was added to the design. Finally, pin location constraints were added to the design.。
