Performance Bounds for Bi-Directional Coded Cooperation Protocols
Synopsys RTL Architect

DATASHEET OverviewThe RTL Architect™ solution is the industry’s first physically aware RTL design system that significantly reduces the development cycle and delivers superior quality-of-results. RTL Architect continues the “shift-left” strategy introduced in the Synopsys Fusion Design Platform™ to address power, performance, and area (PPA) challenges earlierin the design cycle. The complexities of advanced process nodes have made it more difficult to meet PPA targets through physical implementation techniques alone, so RTL designers are tasked with exploring domain-specific architectures to dramatically improve PPA. RTL Architect provides a logical/physical workbench that can accurately predict the PPA impact of architectural changes without waiting for feedback from the physical design team.Key Benefits• Unified data model that provides multi-billion gate capacity and comprehensive hierarchical design capabilities• Fast, multi-dimensional implementation prediction engine that enables RTLdesigners to predict power, performance, area, congestion• Dedicated workflow environment for ease-of-use and seamless analysis of key quality metrics• RTL re-structuring with automatic constraint updates for architectural changes and IP re-targeting• Hierarchical floorplan creation for block area, timing, and congestion estimation • Leverages Synopsys’ world-class implementation and golden signoff solutions to deliver results that correlate-by-construction• RTL power estimation and optimization of energy efficient designs with thePrimePower golden signoff power analysis engine• Comprehensive cross-probing facilitates debug from layout, schematic andreports to RTLRTL Architect’s “shift-left” strategy significantly reduces time-to-feedback RTL Architect2Predictive ModelingRTL Architect’s new Predictive Engine (PE) is derived from Synopsys’ implementation environment and enables rapid multi-dimensional analysis and optimization of RTL to predict PPA of downstream implementation accurately. This Predictive Engine utilizes new correct-by-construction modeling, leveraging the proven and widely used core implementation algorithms and architectures of the Synopsys Fusion Design Platform. This ensures tight correlation to the best implementation.This also allows the RTL designers to experiment and tune their HDL code without multiple, back-and-forth, hand-offs to synthesis and to pinpoint timing bottlenecks in their source code to improve RTL quality.Design PlanningRTL Architect’s hierarchical, design planning, infrastructure automatically generates a physical implementation, with clock trees, to provide the RTL designer with accurate power, timing and area estimates. Additionally, the RTL block integrator can use the design planning capabilities to integrate in-house and third-party IP (as seen in Figure 1 Arteris ® IP FlexNoC ® Interconnect Integration) including bus and pipeline register planning. This fast and deep look-ahead allows the designers to not only predict but also drivephysical implementation.Figure 1: Arteris IP FlexNoC Interconnect IntegrationRTL Design ExperienceThe RTL Architect experience is built around the RTL designer. The PE maps leaf cells back to the RTL so that the designer can see the direct impact a code change has on PPA. Figure 2 RTL Cross-Probing, shows the cross-probing capability from various design views to RTL. Color coded reports indicate severity level.Layout viewRTL Architect Unified GUI EnvironmentRTL view view viewFigure 2: RTL Cross-Probing©2020 Synopsys, Inc. All rights reserved. Synopsys is a trademark of Synopsys, Inc. in the United States and other countries. A list of Synopsys trademarks isavailable at /copyright .html . All other names mentioned herein are trademarks or registered trademarks of their respective owners.02/28/20.CS469885535_RTL Architect_DS.For example, the designer can see how the logic is physically implemented by cross-probing from a report directly to the layout. This is useful for seeing the predicted congestion hotspots caused by RTL, so they can experiment with different architectures to reduce the congestion. Figure 3 shows the high degree of correlation between the place and route engines of RTL Architect and Fusion Compiler™.Fusion CompilerRTL Architect Figure 3: RTL Architect vs. Fusion Compiler CongestionAnother key concern for RTL designers is power usage. The interactive power summary report provides an overview of key power metrics, such as, switching and glitch power, leakage, and clock gating efficiency. The results are based on the PrimePower golden signoff power analysis engine. The report data can be sorted, filtered and cross-probed to RTL.Bridging the GapRTL Architect significantly improves the quality of RTL before handing off to implementation. It addresses the limitations of the existing solutions which are hampered by inaccuracies that impact productivity as downstream implementation tools compensate. The shift-left strategy identifies and corrects physical implementation issues early in the design cycle to achieve aggressive PPA targets at advanced nodes through better RTL.。
Performance Guide for ViDi说明书

Performance Guide for ViDi18-Mar-2019 16:11:24 EDTThinking about PerformanceTool and stream processing timeThroughputPerformance ToolkitApplication DesignTool ParametersNVIDIA GPU Selection and ConfigurationNVIDIA Device Branding SummaryGraphics Card RequirementsConsiderationsEstimating Run-Time PerformanceGlossary of Standard NVIDIA GPU TerminologyMultiple GPUsSystem Configuration for Multi-GPU SystemsWhat About Training Time?Thinking about PerformanceWhat performance aspect is important to you?Tool and stream processing timeIndividual tool processing time is shown in the Database Overview panel:averageThe reported time is the processing time for all of the images processed during the most recent processing.The processing time for a stream containing multiple tools is not available through the ViDi Suite GUI, and you cannot estimate it by summing the tool execution time, as it includes the time required to prepare and transmit view information between tools.When thinking about stream processing, remember that the processing of tools in a ViDi stream is always serialized when you call Stream. Process()Tool.Process() . Only one tool is ever processed at a time unless you explicitly process tools individually using .ThroughputThroughput refers to the total number of images that can be processed per unit time. If your application can process multiple streams concurrently using different threads, it may be able to improve system throughput, although individual tool processing will be slower.Performance ToolkitIn terms of increasing expense (but not efficacy):Application designTool parametersSystem configurationHardware optionsMultiple GPUsApplication DesignThe following table summarizes application design characteristics that may produce faster run-time performance. Application design choices that improve performance typically have minimal impact on the behavior of the system.Design Pattern Why it's Faster Best Bang for Buck But Watch Out ForUse a small number of tools per stream.The processing time for a singleViDi tool does vary significantlynotbased on the amount of informationthat the tool returns.For example, a single Blue tool thatis trained to find 100 differentfeatures runs at the same speed asa tool that is trained to find only asingle feature. Further, the numberof features returned makes only aminimal speed difference.Similarly, a Red tool runs at thesame speed regardless of howmany defects it finds, and a Greentool can classify into 2 classes or2000 classes at the same speed.Start building your application with asingle tool.Avoiding Image Conversions During tool operation, the imagemust be sampled for processing bythe neural network. This samplingrequires a raster (uncompressed)format image such as a bitmap.Performing this conversion takestime.Similarly, if the tool is configured touse a single-channel (grey-scale)image as input, but the suppliedimages are multi-channel colorimages, the luminance value mustbe computed for each image at runtime.Attempt to solve your applicationusing a single-channel grey-scaleimage.Some applications require colorinformation.Reduce the amount of processed data Reducing the number of processeddata by:Using a smaller ROIUsing a maskUsing as few image channels aspossibleImproves processing speed byreducing the total amount of dataprocessed.Restricted ROI ViDi tools need contextualinformation to work well – don'tconstrain the ROI too much.Downsampling is usually not needed– selecting a larger feature size canimprove speed and remove theneed for run-time downsampling.Multi-threading On systems with multiple GPUs,processing multiple streamsconcurrently allows tools to executein parallel, increasing throughput.On single-GPU systems, you canconfigure the system to allowmultiple processes to make use ofthe same GPU. This allows a higherGPU occupancy and can improvethroughput, although tool executiontime will e the --max-process-countcommand line argument to enablemultiple threads to access a singleGPU.To enable multi-process GPUaccess for a runtime applicationusing the local control's GlobalConfimethod:g()control.GlobalConfig("max_process_count=2");Processing time for an individual toolwill increase.C++ (unmanaged)Use of an unmanaged languageenvironment reduces the impact ofsystem activity on tool execution.For low-latency, high-performanceapplications, use the C++ API.Windows is not a RTOSTool ParametersTool parameter choices directly effect tool execution speed, but there is typically a tradeoff between tool speed and accuracy or robustness. Tool Parameter How it Affects Speed Best Bang for Buck But Watch Out ForFeature size At run time, ViDi tools need tosample the entire input image. Thefeature size determines the numberof samples required for a givenimage size. The larger the featuresize, the fewer the samples.O(n)2 increase in speed with largerfeature size.Larger feature sizes may cause thetool to miss features or defects.Use parameter optimization to findan optimal size.Sampling Density Similarly to feature size, thesampling density determines thenumber of samples required for agiven image size.O(n)2 increase in speed with lowersampling density.Risk of missing features or defects.Refinement Parameters The Blue and Red tools includeprocessing-time parameters thatprovide more accurate results at thecost of increasing execution time:Blue tool: PrecisionRed tool: Iterations Increasing the iteration value increases processing time linearly.Low-precision mode If your system meets certain specificrequirements (CUDA ComputeCapability 6.1 or greater), you canenable mlow-precision processingode for any ViDi tool.Enabling low-precision modeconverts any existing trained tool touse low-precision computationduring processing, and it generateslow-precision tools for all futuretraining operations until it isdisabled. (Once a tool has beenconverted to low-precision mode, itmust be retrained to disable low-precision mode.Low-precision tools can executefrom 25% to as much as 50% fasterthan normal-precision tools.Additional run-time speedimprovements for low-precision toolsare seen on systems with TuringTensor cores.Changing a tool to low-precisionmode may change the results thetool produces to a small degree.Generally high-level featureidentification, defect classification,and general classification will beunchanged, but specific feature anddefect regions and scores maychange slightly.NVIDIA GPU Selection and ConfigurationSystem configuration choices directly affect tool processing speed without affecting tool accuracy or behavior. They are the most expensive and hardest to predict the effect of.Configuration Option Why it's Faster Best Bang for Buck But Watch Out ForNVIDIA Device Type The number of CUDA cores isdirectly related to high-precisionprocessing speed and training.The number of standard Tensorcores is directly related toprocessing speed and trainingspeed.The number of Tensor coresTuringis related to processing speed in low-precision mode only. These coresdo not affect standard precisionprocessing or training speed.NVIDIA Driver ModeConsumer-grade gaming-oriented NVIDIA devices only support the WDDM device driver model. This driver is intended to supportgraphics display, not computation.Professional-grade NVIDIA cards support the TCC driver mode, which provides better performance and stability.Select a Quadro or Tesla (or selected Titan)-branded NVIDIA card.If using a GeForce-branded card, be aware that NVIDIA Geforce drivers are updated frequently and may not be compatible with ViDi. Please visit Cognex's support page for driver recommendations.Using TCC mode driver prevents the use of Video output on the GPU card; use onboard video instead.Optimized memoryViDi optimized memory, which is enabled by default, improves performance by overriding the standard NVIDA GPU memory management system.Make sure your card has at least 4GB of GPU memory.Performance improvement is not as significant for cards using the TCC driver.NVIDIA Device Branding SummaryThe following table summarizes the different NVIDIA device types.Class ConsumerProfessionalBrandingGeForceTitanQuadroTeslaVolta Architecture Cards ---Titan V GV100V100Pascal Architecture Cards GTX 1xxx Titan Xp G/GPxxx P100Turing Architecture Cards RTX 2xxx Titan RTX Quadro RTX4xxx T4Video Output Yes Yes Yes ---Price Point$1K $3K $5K $5K+TCC Driver Support --- Yes Yes Yes ECC Memory ------ YesYes Tensor CoresRTX2xxx and newer:Yes Titan V :Yes Titan RTX:Yes Quadro RTX :Yes Quadro GV100:Yes V100:Yes T4:Yes Graphics Card RequirementsNVIDIA® CUDA® enabled GPUCUDA compute capability 3.0 or higherConsiderationsWhile consumer cards and professional cards perform similarly, some considerations should be made:Heat dissipationProfessional cards are intended for continuous duty cycle use and are designed to dissipate heat effectively.SupplyProfessional cards are manufactured by NVIDIA and have a longer product cycle.Performance and ControlProfessional cards support the TCC mode drivers. This allows the GPU to run as a computing device with no display output.This means you will need a second card for display (or use the motherboard's built-in display).Estimating Run-Time PerformanceThe following numbers are an approximate guide to the potential performance increment for different card families (baseline = non-run-time TensorCore, standard mode):ViDi Operating Mode No Tensor Cores (ex GTX)Volta Tensor Cores (ex V100)Turing Tensor Cores (ex T4)Standard 100%150%150%Low-precision125%125%175%Glossary of Standard NVIDIA GPU TerminologyTerm What it isIs it important?CUDA CoreStandard NVIDIA parallel processing unit.Yes . This is the 'standard' measure of NVIDIA GPU processing – the number of CUDA cores. The more cores, the faster the ViDi processing and training.ECC Memory Error-correcting-code memoryHardware support for verifying that memory reads/writes do not contain errors.No Because of the huge number of computations involved in training andprocessing neural networks, the likelihood of a memory error affecting a tool result is very low.TCC Tesla Compute Cluster (Driver).A high-performance driver that is optimized for computational use of an NVIDIA GPU.Not supported by all cardsDisables video output from the card Provides faster training and runtime performanceDiminishes or eliminates the advantages of using ViDi optimized memoryConfigured using the nvdia-smi utilityYes . Whenever possible, customers should select cards that support the TCC driver mode, and they should enable the mode.Tensor CoreFull-precision, mixed-precision (and evt. integer math) parallel processing unit dedicated to matrix multiply operations.Yes . Starting with ViDi 3.2, ViDiautomatically takes advantage of tensor cores for faster processing and training, as long as the user has a Standard or Advanced license.TensorRTNVIDIA framework for optimizing (by using low-precision and integer math) run-time performance of TensorFlow, Caffe, and other standard framework networks running on a GPU with Tensor Cores.No: ViDi uses a proprietary network architecture that is not compatible with Tensor RT.Multiple GPUsExcept under very narrow circumstances, using multiple GPUs in a single system will not reduce ViDi tool training or processing time. What multiple GPUs do is to:can Increase system throughput when your application uses multiple threads to concurrently process images Increase training productivity, by allowing you to train multiple tools at the same timeThere is one circumstance under which multiple GPUs can be used to reduce tool processing time. If you configure your system in MultipleDevic mode, then all installed s are treated as a single . This means that only one tool can be processed at a esPerTool GPU GPU during processing time for the entire server.NoteIn comparison with other Tesla cards, the T4 is oriented toward run-time operation. It supports ViDi training and run-time, but training performance will likely be slower than a V100.In the specific case of a Red Analyze tool, the use of may speed up the tool, especially a tool with a high image-MultipleDevicesPerTool modeto-feature size ratio. However, this potential speed up comes at the expense of latency across all clients.System Configuration for Multi-GPU SystemsWhen configuring a host system for multiple GPUs, keep the following in mind:The chassis may need to provide up to 2KW of powerQuadro and Tesla cards provide better cooling configuration for multiple-card installationsMake sure that the PCIe configuration has 16 PCIe lanes available for each GPUDo not enable SLIWhat About Training Time?Reducing tool training time does not affect your performance at run time, but it can improve the productivity of your development team.ViDi training uses a mixture of CPU and GPU resources. When considering training specifically, there are three phases: computing image statistics, building the model, and then processing the image set with the newly trained model. The model building phase of training usually takes the longest, and it is an iterative process. Each iteration requires that the tool generate training data from all of the training images. If the images are in a non-BMP format, they need to be converted to BMP for each iteration.Tool training is always single-threaded and single GPU. You cannot make training faster using multiple GPUs.canUsing multiple GPUs improve your productivity because you can train multiple tools concurrently.。
双向奔赴的母爱作文

双向奔赴的母爱作文英文回答:Mother's love is an incredible force that drives a woman to go to great lengths for the well-being of her children. It is a love that knows no bounds and is willing to go the extra mile, even when faced with challenges and obstacles. The concept of "双向奔赴" (sìang xiàng bēnfù) or "bi-directional dedication" perfectly captures the essence of a mother's love.A mother's love is bi-directional in the sense that it is both given and received. She dedicates herself to providing for her children, ensuring their needs are met and their dreams are supported. This often meanssacrificing her own desires and aspirations to prioritize her children's well-being. At the same time, a mother also receives love and fulfillment from her children, creating a reciprocal relationship of care and support.In the face of challenges, a mother's love knows no bounds. She is willing to go to great lengths, sacrificing her own comfort and happiness for the sake of her children. Whether it's working multiple jobs to make ends meet,staying up all night to care for a sick child, or offering unwavering emotional support during tough times, a mother's love is unwavering and unconditional.中文回答:母爱是一种不可思议的力量,它驱使一位母亲不惜一切为了孩子的幸福而努力奔赴。
JBL AC2212 00 两路扬声器说明说明书

AC2212/00 Compact 2-Way Loudspeakerwith 1 x 12” LFKey Features:u100° x 100° Coverage.u P T™ Progressive Transition™Waveguide for good pattern controlwith low distortion.u B i-Amp/Passive Switchable.u O ptional U-Bracket for easy installation.u O ptional planar array frame kit(see AE Series Array Guide).Applications:u L ecture hallsu H ouses of worshipu C orporate learning centersu S mall performing arts facilitiesu T heatrical sound designu A uditoriumsu S ports facilitiesu T hemed entertainment venuesAC2212/00 is a compact 2-way full-range loudspeaker system comprised of one 300 mm (12 in) low frequency drive r and one 38 mm (1.5 in) exit/ 44 mm (1.75 in) voice-coil compression driver. The PT Progressive Transition waveguide provides wide 100° by 100° coverage. High-slope passive crossovers minimize band overlap.The cabinet is fitted with M10 threaded suspension points. Optional U-bracket, as well as pre-engineered array bracketryis available for easy installation. Four threaded inserts located on back ofthe enclosure allow attachment of an Omnimount™ or simila r mounting bracket.AC2212/00 is part of JBL’s AE Application Engineered Series, a versatil e family of loudspeakers for a wide variety of fixed installation application s.Specifications:System:Frequency Range1 (-10 dB): 50 Hz – 19 kHzFrequency Response1 (±3 dB): 55 Hz – 17 kHzCoverage Pattern: 100° x 100°Directivity Factor (Q): 7.1Directivity Index (DI): 8.5 dBCrossover Modes: Bi-amp/Passive switchablePassive Crossover Slopes2: 4th order (24 dB/oct) Transitional HP & LP, 1.3 kHzTransducer Power Rating (AES)3: L F: 300 W (1200 W peak), 2 hrs250 W (1000 W peak), 100 hrsHF: 50 W (200 W peak), 2 hrsLong-Term System Power Rating (IEC)4: Passive mode: 250 W (1000 W peak), 100 hrsMaximum SPL5: B i-amp mode:LF: 120 dB-SPL cont avg (126 dB peak)HF: 126 dB-SPL cont avg (132 dB peak)Passive mode:120 dB-SPL cont avg (126 dB peak)System Sensitivity6 (1W @ 1m): Passive mode: 95 dB SPLTransducers:Low Frequency Driver: 1 x JBL M112-8 300 mm (12 in) driver with 63 mm (2.5 in) voice coilNominal Impedance: 8 ohmsSensitivity6 (1W @ 1m, within operational band): 95 dB SPLHigh Frequency Driver: J BL 2418H-1/MTA, 38 mm (1.5 in) exit compression driver, 44 mm(1.75 in) voice coilNominal Impedance: 8 ohmsSensitivity (1W @ 1m): 109 dB SPLWaveguide: PT-F1010HFPhysical:Enclosure: T rapezoidal with 15 degree side angles, 16 mm (5/8 in) exterior grade11-ply Finnish birch plywoodSuspension Attachment: 15 points (4 top, 4 bottom, 2 each side, 3 rear), M10 threaded hardware.4 x M8 on rear for MultiMount® MM-022-BT,MM-024-BT, or MM-020-CMFinish: Black DuraFlex™ finish. White available upon request.Grille: P owder coated 14 gauge perforated steel, with acoustically transparentblack foam backing.Input Connector: N L4 Neutrik Speakon® and CE-compliant covered barrier stripterminals. Barrier terminals accept up to 5.2 sq mm (10 AWG) wire ormax width 9 mm (.375 in) spade lugs. Speakon in parallel with barrierstrip for loop-through.Environmental Specifications: Mil-Std 810; IP-x3 per IEC529.Dimensions (H x W x D): 548 x 355 x 352 mm(21.6 x 14.0 x 13.9 in)Net Weight: 19.1 kg (42 lb)Optional Accessories: M10 x 35 mm forged shoulder eyebolts with washersU-Bracket MTU-4Optional planar array frame kit. See AE Series Bracket GuideBi-amp mode, with recommended active tuning.Resultant engineered acoustical response of crossover network and components.AES standard, one decade pink noise with 6 dB crest factor within device’s operational band, free air. Standard AES 2 hr rating pluslong-term 100 hr rating are specified for low-frequency transducers.IEC standard, full bandwidth pink noise with 6 dB crest factor, 100 hours.Calculated based on power rating and sensitivity, exclusive of power compression.Anechoic sensitivity in free field, no additional sensitivity gain from boundary loading.JBL continually engages in research related to product improvement. Changes introduced into existing products without notice arean expression of that philosophy.u AC2212/00 Compact 2-Way Loudspeaker with 1 x 12” LFHorizontal 1/3 Octave PolarsSS AC2212/00CRP 10M 8/16u AC2212/00 Compact 2-Way Loudspeaker with 1 x 12” LFVertical 1/3 Octave PolarsJBL Professional 8500 Balboa Boulevard, P.O. Box 2200Northridge, California 91329 U.S.A.© Copyright 2016 JBL ProfessionalA Harman International Company。
纹理物体缺陷的视觉检测算法研究--优秀毕业论文
摘 要
在竞争激烈的工业自动化生产过程中,机器视觉对产品质量的把关起着举足 轻重的作用,机器视觉在缺陷检测技术方面的应用也逐渐普遍起来。与常规的检 测技术相比,自动化的视觉检测系统更加经济、快捷、高效与 安全。纹理物体在 工业生产中广泛存在,像用于半导体装配和封装底板和发光二极管,现代 化电子 系统中的印制电路板,以及纺织行业中的布匹和织物等都可认为是含有纹理特征 的物体。本论文主要致力于纹理物体的缺陷检测技术研究,为纹理物体的自动化 检测提供高效而可靠的检测算法。 纹理是描述图像内容的重要特征,纹理分析也已经被成功的应用与纹理分割 和纹理分类当中。本研究提出了一种基于纹理分析技术和参考比较方式的缺陷检 测算法。这种算法能容忍物体变形引起的图像配准误差,对纹理的影响也具有鲁 棒性。本算法旨在为检测出的缺陷区域提供丰富而重要的物理意义,如缺陷区域 的大小、形状、亮度对比度及空间分布等。同时,在参考图像可行的情况下,本 算法可用于同质纹理物体和非同质纹理物体的检测,对非纹理物体 的检测也可取 得不错的效果。 在整个检测过程中,我们采用了可调控金字塔的纹理分析和重构技术。与传 统的小波纹理分析技术不同,我们在小波域中加入处理物体变形和纹理影响的容 忍度控制算法,来实现容忍物体变形和对纹理影响鲁棒的目的。最后可调控金字 塔的重构保证了缺陷区域物理意义恢复的准确性。实验阶段,我们检测了一系列 具有实际应用价值的图像。实验结果表明 本文提出的纹理物体缺陷检测算法具有 高效性和易于实现性。 关键字: 缺陷检测;纹理;物体变形;可调控金字塔;重构
Keywords: defect detection, texture, object distortion, steerable pyramid, reconstruction
II
Hyperion System 9 BI+ Release 9.2.0.2 (SP2) 支持矩阵说明

Hyperion System 9™ BI+™The Hyperion System 9 BI+ Release 9.2.0.2 (SP2) Support Matrix includes support information for the following areas:Operating Systemso Servero ClientWeb / Application ServersDatabasesWeb BrowsersAuthentication SourcesData SourcesThird Party Software Componentso Spreadsheetso JDBC/ ODBC Driverso Java ComponentsHyperion ProductsHyperion System 9 BI+ is supported on the platform software specified in the Platform Software Support Matrix. Subsequent maintenance releases and service packs may be used where the vendor asserts backward compatibility. Please be aware, however, that while these assertions are made in good faith, certain incompatibilities may exist. In the event that an incompatibility is identified, Hyperion may experience a delay in reproducing and fixing resultant issues for the affected versions.O PERATING S YSTEMSS ERVER O PERATING S YSTEMOperating System Support CommentsWindows 2000 (SP4) SupportedWindows Server 2003 (SP1) SupportedWindows 2003 (64-bit)Sun Solaris 9 SupportedSun Solaris 10 SupportedAIX V5.2 SupportedAIX V5.3 SupportedHP-UX (11i) Supported V1 (11.11) RISCHP-UX (11i) V2 (11.23) ItaniumHyperion System 9 BI+ ProductionOperating System Support CommentsReporting™ (standalone) does support \Red Hat Linux AS 3.0 Hyperion System 9 BI+ ProductionReporting™ (standalone) does support Red Hat Linux AS 4.0 SupportedC LIENT O PERATING S YSTEMOperating System Support CommentsWindows 2000 Server SupportedWindows 2000 Professional SupportedWindows 2003 SupportedWindows XP Professional SupportedW EB /A PPLICATION S ERVERSWeb / Application Server Support CommentsIBM WebSphere 5.1.17 Supported Includes support for ExpressIBM WebSphere 6.0.2BEA WebLogic 8.1.4 Supported Includes support for Express andPremium.Web Analysis does not supportclustering in a WebLogic ExpressdeploymentOracle 10g 9.0.4 Supported Windows and Linux only; manualdeploymentSun One (Open Net) 8.1 Supported Solaris only ; manual deployment Apache Tomcat 5.0.28 Supported Tomcat deployments not installed by theHyperion installer are not supported forHyperion System 9 BI+ EnterpriseMetrics™ and Hyperion System 9Performance Scorecard™, and must bemanually configured for other modules.The Hyperion installer has an option toinstall Tomcat if requested and is therecommended choice.Microsoft InternetInformation Server 5.0Microsoft Internet Information Server 6.0 Supported Supported with Tomcat ApplicationServer only.Not supported when Hyperion System 9Performance Scorecard™ is installed.Apache Server 2.0.52 Supported Not supported by Hyperion System 9Performance Scorecard™R EPOSITORY D ATABASESDatabases Support CommentsOracle 9i – 9.2.0.5 SupportedOracle 10g – 10.1.0.2 SupportedIBM DB2 8.1 FP 7a / 8.2 SupportedIBM DB2 8.2 SupportedMicrosoft SQL Server 2000SP 3aSupportedMicrosoft SQL Server 2005SP1SupportedMySQL 4.0.12 Supported Supported for Hyperion System 9Foundation Shared Services™ only D ATABASES AS D ATA S OURCES*All connectivity is through 32-bit clients since Hyperion System 9 BI+ is a 32 bit platform. The database server can be running on 64-bit hardware, provided the 32-bit clients provide access in such a configuration.Key: IR = Hyperion System 9 BI+ Interactive Reporting™, FR = Hyperion System 9 BI+ Financial Reporting™, WA = Hyperion System 9 BI+ Web Analysis™, PR = Hyperion System 9 BI+ Production Reporting™, PS=Hyperion System 9 Performance Scorecard™, EM = Hyperion System 9 BI+ Enterprise Metrics™Database Support CommentsOracle 9i v9.x Supported IR - OCI and ODBCPR - OCI, ODBC, JDBCWA – JDBCPSEMOracle 10g 10.x Supported IR - OCI and ODBCPR - OCI, ODBC, JDBCWA – JDBCPSEMIBM DB2 UDB 7.2 FP7 &higherIBM DB2 UDB 8.1 FP7a & higher Supported IR - ODBCPR - ODBC, JDBC, IBM ConnectWA – JDBCPSEMDatabase Support Comments MS SQL Server 2000 Supported IR - ODBCPR - ODBCWA – JDBCPSEMMicrosoft SQL Server 2005 SP 1 Supported IR - ODBCPR - ODBCWA – JDBCInformix 9.2 & higher Supported IR - ODBCPR - ODBC, JDBC, SDKWA – JDBCSybase 12.x ASE Supported IR - ODBCPR - ODBC, JDBC, CTLibWA – JDBCSybase 12.x IQ Supported IR – ODBCPR – ODBCTeradata v2r5 & higher Supported IR – ODBC (Obtain Drivers from NCR)PR - PP2 (Solaris, PA-RISC HP-UX)WA – JDBC (Virtual Cubes only) Teradata v2r6 & higher Supported IR – ODBC (Obtain Drivers from NCR)PR - PP2 (Solaris, PA-RISC HP-UX) Redbrick Warehouse v6.x Supported IR – ODBCPR -- ODBCIBM DB2 OLAP 8.1 Supported IR, WA, FR, PRMicrosoft Analysis Services 2000 Supported IR - ODBOPR - DDOMicrosoft Analysis Services2005Supported IR - ODBOSAP BW 3.1, 3.5 Supported IR - ODBOPR - BAPIFR - BAPIWA - BAPISAP R3 4.6C & higher Supported PR – BAPIXML and CSV Supported PR - XML4JODBC (generic) Supported Interactive Reporting only** OLEDB (generic) Supported Interactive Reporting only****ODBC AND OLEDB SUPPORT ARE TO THE M ICROSOFT STANDARDS LEVEL.W HILE ANY ODBC OR OLEDB DRIVER SHOULD WORK PROPERLY WITH H YPERION I NTERACTIVE R EPORTING, THERE ARE SOMETIMES DIFFERENCES IN DRIVER VENDOR IMPLEMENTATIONS.H YPERION WILL MAKE A REASONABLE EFFORT TO ADDRESS ISSUES WITH DRIVERS THAT PERFORM ACCORDING TO THE STANDARDS.F OR DRIVERS THAT DO NOT FUNCTION PER THE STANDARDS,H YPERION MAY ELECT TO NOT PURSUE A RESOLUTION.HYPERION P RODUCTSHyperion Products Support CommentsHyperion Essbase® 7.1 Supported IR, WA, FR, PR, EM, PS data sourceNote: The installed Runtime Clientversion must match the Server version.Hyperion System 9 BI+ Analytic Services™ 9.2 Supported IR, WA, FR, PR, EM, PS data sourceNote: The installed Runtime Clientversion must match the Server version.Hyperion System 9 BI+Analytic High AvailabilityServices 9.2 /HyperionEssbase DeploymentServices 7.1Supported FR & WA onlyHyperion System 9 BI+Analytic IntegrationServices 9.2/HyperionEssbase IntegrationServices 7.1Supported FR & WA onlyHyperion System 9 Planning™ 9.2 Supported FR, WA, & EM data sourceThe release of the Hyperion System 9Planning™ ADM used must match theversion of the Hyperion System 9Planning™ server for FR.WA and EM connect to Planning’s cubevia the Hyperion System 9 BI+ AnalyticServices™ ADM driver.Hyperion Planning™ 4.02 Supported FR & WA data sourceThe version of the Hyperion Planning™ADM used must match the release ofthe Hyperion Planning™ server for FR.WA connects to Planning’s Essbasecube via the Hyperion Essbase®ADMdriver.Hyperion System 9 Financial Management™ 9.2 Supported FR & WA data sourceThe version of the Hyperion System 9Financial Management™ ADM usedmust match the version of the HyperionSystem 9 Financial Management™serverHyperion Products Support CommentsHyperion Financial Management™ 4.02 Supported FR & WA data sourceThe version of the Hyperion FinancialManagement™ ADM used must matchthe version of the Hyperion FinancialManagement™ serverHyperion System 9 Foundation Shared Services™ 9.2 SupportedFormerly known as Hyperion Hub™F OR MORE INFORMATION ON H YPERION P ERFORMANCE S CORECARD SUPPORT, PARTICULARLYOF OTHER H YPERION PRODUCTS, PLEASE DOWNLOAD ITS S UPPORT M ATRIX.W EB B ROWSERSWeb Browsers Support CommentsMicrosoft InternetExplorer 6.0SupportedFirefox 1.0.7 SupportedA UTHENTICATION SOURCESAuthentication Sources Support CommentsSun Open Net 5.2 LDAP SupportedNovell eDirectory 8.7LDAPSupportedIBM Directory Server 5.1LDAPSupportedDomino LDAP 5.X SupportedDomino LDAP 6.0 SupportedMicrosoft NTLM Supported Requires installation of HyperionRemote Authentication Module for Unixauthentication against NTLM. Microsoft Active Directory2000SupportedMicrosoft Active Directory2003SupportedNetegrity SiteMinder 5.5(SP2)SupportedIBM Tivoli DirectoryServer 5.2SupportedOpen LDAP 2.3. 37 SupportedT HIRD-P ARTY S OFTWARE C OMPONENTSS PREADSHEETSSpreadsheets Support CommentsMicrosoft Office 2000 Supported Excel onlyMicrosoft Office 2002 (XP) SupportedMicrosoft Office 2003 SupportedJDBC/ODBC D RIVERSJDBC / ODBC Drivers Support CommentsJDBC DataDirect 3.5 (SP3) Supported Where JDBC support is providedSupported Where MySQL support is provided Hyperion JDBC MySQL3.0.7ODBC DataDirect 5.1 Supported Where ODBC support is provided J AVA C OMPONENTSSupport Comments3rd Party SoftwareComponentsJDK Server 1.4.2 Build 08 Supported Windows, Solaris, HPUX, LinuxSupported AIXJDK Server 1.4.2 bld 420-20040626 AIXSupported Windows, Solaris, HPUX, Linux Java Runtime Environment1.4.2 Build 08Supported AIXJava Runtime Environment1.4.2 bld cal 420-20040626SupportedBrowser Plug-In JVM 1.4.2Build 10SupportedBrowser Plug-In JVM 1.3.1Build 17O THEROther Platform elements Support CommentsSupportedAdobe Reader 6.0 andabove。
安装与维护手册 VK300 和 VK3000 三口和五口直接操作喷气阀说明书

Installation and Maintenance ManualSeries VK300 and VK3000 3 Port and 5 Port Direct Operating Solenoid ValvesThis Manual should be read in conjunction with the current product CatalogueFor future reference,please keep this manual in a safe placeThese safety instructions are intended to prevent a hazardous situation and/or equipment damage.These instructions indicate the level of potential hazard by label of “Caution”,“Warning”or “Danger”.To ensure safety,be sure to observe ISO4414 (Note1),JIS B 8370 (Note2)and other safety practices.Note 1:ISO 4414:Pneumatic fluid power – Recommendations for the application of equipment to transmission and control systems.Note 2:JIS B 8370:Pneumatic system axiom.CAUTION :Operator error could result in injury orequipment damage.WARNING:Operator error could result in serious injury or loss of life.DANGER :In extreme conditions, there is apossible result of serious injury or loss of life.1.The compatibility of pneumatic equipment is theresponsibility of the person who designs the pneumatic system or decides its specifications.Since the products specified here are used in various operatingconditions,their compatibility for the specific pneumatic system must be based on specifications or after analysis and/or tests tomeet your specific requirements.2.Only trained personnel should operate pneumaticallyoperated machinery and equipment.Compressed air can be dangerous if an operator is unfamiliar with it.Assembly,handling or repair of pneumatic systems should be performed by trained and experienced operators.3.Do not service machinery/equipment or attempt toremove component until safety is confirmed.1) Inspection and maintenance of machinery/equipment shouldonly be performed after confirmation of safe locked-out control positions.2) When equipment is to be removed,confirm the safety processas mentioned above.Switch off air and electrical supplies and exhaust all residual compressed air in the system.3)Before machinery/equipment is re-started,ensure all safetymeasures to prevent sudden movement of cylinders etc.(Bleed air into the system gradually to create back-pressure,i.e.incorporate a soft-start valve).4.Contact SMC if the product is to be used in any of thefollowing conditions:1)Conditions and environments beyond the givenspecifications,or if product is used outdoors.2)Installations in conjunction with atomic energy,railway,airnavigation,vehicles,medical equipment,food and beverage,recreation equipment,emergency stop circuits,press applications,or safety equipment.3)An application which has the possibility of having negativeeffects on people,property,or animals,requiring special safety analysis.Ensure that the air supply system is filtered to 5 micron.ENSURE THAT THE EXHAUST PORTS ARE LEFT OPEN WHEN CONVERTING A VALVE TO 3 PORT CONFIGURATION.VK300-TFM71Specifications Type of operation Direct operated 2-position single solenoid Operating fluid AirStandard Operating pressure rangeVacuum Ambient temperature and operating fluid temperature MAX.50 ºC Standard * Response timeLow wattManual Operation Non-lock push type LubricationUnnecessary Mounting positionAny position ** Impact,vibration resistance 300m/s 2,50m/s ProtectionIP65*In accordance with the dynamic performance test of JIS B 8374-1981 (at the rated voltage,**Impact resistance:No malfunction from test using drop impact tester to axis and right angle direction of main valve and armature,one time when energised and de-energised.Vivration resistance:No malfunction from test with from 8.3 to 2000Hz 1 sweep to axis and right angle direction of main valve andarmature each time when energised and de-energised (Value in the initial stage).Solenoid Specifications Electrical entry DIN type terminal (D)AC Rated voltage DC Allowable voltage ±10%Inrush Apparent power Holding Standard Power consumptionLow watt AC Surge voltage protection circuit Fig 1PlugPlug231425134242513513M3X26Screw W/Spring washer Manifold gasketDXT199-23-4M3X8Screw W/Spring washer Blanking plate VK300-33-3VK3000-7-1Manifold gasket for blanking plateVK3000-6-3M3X26Screw W/Spring washer DXT199-23-4VK3120-OG-01VK3140-OGVK3000-6-1Manifold gasket VK3000-6-2Applicable base Model VV5k3-20Model VV5k3-21Manifold base}Applicable base VK3000-9-1Model VV5k3-40Model VV5k3-(S)41Model VV5k3-(S)42Manifold baseSubplate }(3) Blanking plate Ass’y Parts No.:VK3000-7-1AApplicable base:common for all VV5k3 modelsFig 2(1) Model VK332(2) Model VK334M3X26Screw W/Spring washerManifold gasket DXT199-23-4M3X26Screw W/Spring washer DXT199-23-4VK332-OG-01VK334-OGVK300-41-1VK300-33-3Manifold gasketVK300-41-2Applicable base Model VV3k3-20Model VV3k3-21Model VV5k3-20Model VV5k3-21Manifold baseManifold baseSubplate }Applicable baseVK300-45-1Model VV3k3-40Model VV3k3-(S)42Model VV5k3-40Model VV5k3-(S)41Model VV5k3-(S)42(3) Blanking plate Ass’y Parts No.:VK300-42-1A M3X8Screw W/Spring washer VK300-42-1Blanking plate VK300-41-3Manifold gasket for blanking plateApplicable base:common for all VV3k3 models}Mixed Mounting of VK300 Series and VK3000 Series (Fig 4)It is possible to mount the VK300 onto the Manifold base of the VK3000 Series.When specifying VV5K3-20 or VV5K3-40,ensure that theappropriate Exhaust Port on the Manifold base is PLUGGED using a rubber plug part No.VK3000-8-1,as this Exhaust port becomes redundant when mounting 3 port Valves.The 3 port Valve can also be mounted on additional Manifolds i.e.VV5K3-21,VV5K3-(S)41 and VV5K3-(S) 42 without additional modifications.CAUTION•When converting a 5 port Valve,from 3 ports back to 5 ports ensure that the exhaust plug is removed.•When a 3 port Valve (VK300) is Mounted onto the Manifold base of the VK3000 Series,the Valve function will be NORMALLY CLOSED.If a NORMALL Y OPEN function is required plug port No.of a 5 port Valve.•When piping from the Manifold base,the port No.Valve becomes the port No.4 of the 5 port Valve.possibility of incorrect piping to the port No.port No.2 is plugged.Model VV5K3-20VK332-OG-01VK3120-OG-01Plug VK3000-8-1Plug VK3000-8-1Notch mark (Recession)Notch mark (Recession)VK334-OGModel VV5K3-40VK3140-OGConnection Method for Lamp/Surge Voltage Protection Circuit (Fig 7)When using a DIN connector with DC voltage connect the positive side (-) to the symbol 2 of the terminal block.Part No.of the connector without lamp:VK300-82-1Part No.of the connector with lamp:Refer to the following table Rated voltage *Marking Parts No.AC100V 100V VK300-82-2-01AC110V 110V VK300-82-2-03AC200V 200V VK300-82-2-02AC220V 220V VK300-82-2-04AC240V 240V VK300-82-2-07DC6V 6V VK300-82-4-51DC12V 12V VK300-82-4-06DC24V 24VD VK300-82-3-05DC48V48VDVK300-82-3-53*Indicated on the terminal block.Changing the Direction of the Connector (Cable)After separating the Terminal block from the housing,the cable direction can be changed 4 ways at 90º intervals.WARNINGIf the connector is fitted with a lamp,ensure that the lamp is not damaged by the lead wire of the cable.Applicable Cable.( 2 conductors or 3* conductors)Outside diameter of the cable should be ø3.5 ~ ø7mm.Note 3 Conductor cables are used when connecting to Ground.CAUTIONEnsure that the connector is straight during insertion or removal.Piping tightening torque Connecting screwAppropriate tightening torqueN•m {kgf•cm}M5 1.5~2{15~20}Rc (PT) 1/87~9 {70~90}LubricationThe valve has been lubricated for life on assembly and requires no additional lubrication.element.Keep the residual leakage voltage to 20% or less of the rated voltage for AC coils and 2% or less of the rated voltage for DC coils.MaintenanceWARNINGWhen changing the rated voltage the valve MUST be replaced,as it is NOT possible to change the coil.It is NOT possible to dismantle the valve due to its design.Application of undue force to the valve may damage the valve section.Neon glow lamp with DC,connect the positive side to the Red lead wire and the Negative side to the Black the Blue lead wire is for 100VAC,and the Red Fig 7Varistor Varistor LED LED V a r i s t o rNo.1No.2No.2No.1(+)No.2(-)DiodeNo.1(+)2D i o d eRed (+)Black (-)Surge voltage protection circuitFig 9When you enquire about the product,please contact the following SMC Corporation :ENGLAND Phone 01908-563888TURKEY Phone 212-2211512ITALY Phone 02-92711GERMANY Phone 6103-402-0HOLLAND Phone 020-*******FRANCE Phone 01-64-76-10-00SWITZERLAND Phone 052-396 31 31SWEDEN Phone 08-603 07 00SPAIN Phone 945-184100AUSTRIA Phone 02262-62-280Phone 902-255255IRELAND Phone 01-4501822GREECE Phone 01-3426076DENMARK Phone 70 25 29 00FINLAND Phone 09-68 10 21NORWAY Phone 67-12 90 20BELGIUM Phone 03-3551464POLAND Phone 48-22-6131847PORTUGAL Phone 02-610 8922*Marking*MarkingFor AC and DC 12V or less For DC 24V or moreLight (built in connector)Surge voltage protection circuit (built into the terminal block)AC circuit drawingNL:Neon lamp R:ResistorDC circuit drawing 12V or lessLED:Light emitting diode R:ResistorDC circuit drawing 24V or moreD:Protective diodeLED:Light emitting diode R:Resistor*C o n t a c t p o i n tC -R e l e m e n tCurrent leakageVoltage leakageValvePower sourceC o i lC o i lCoilCoil CoilCoil No.1No.2No.1No.2No.1Neon glow lamp DiodeD i o d eNo.2No.12No.1V a r i s t o rFig 6Fixing screwHousing(Code)Refer to table below Terminal screw (3 places)Slotted area(Light installation position)Terminal block Grommet (Rubber)WasherGland nut。
40CFR P63(美国)

I NSPECTION C HECKLIST FOR THE P HARMACEUTICALS MACT S TANDARD40CFR P ART 63September2001DisclaimerThe United State Environmental Protection Agency (USEPA) designed this checklist as a compliance tool and/or a guidance document to be used by USEPA, State and Local agency inspectors, as well as the pharmaceutical industry, for the purposes of a facility compliance inspection or a self audit. This checklist is not intended, nor can it be relied on, to create any rights enforceable by any party in litigation with the United States. EPA and State and Local officials may decide to follow this checklist or to act at variance with it, based on analysis of specific site circumstances. This checklist may be revised without public notice to reflect changes in EPA’s policy. The most current version will be posted on the pharmaceutical MACT website. The address is: /ttn/uatw/pharma/pharmpg.htmlThis checklist is meant to be used for onsite inspections; therefore, certain records and reports that might need to be reviewed prior to the onsite inspection are not addressed in this checklist. For example, we do not discuss precompliance reports or stack tests.Please refer to Table 1 of the pharmaceuticals NESHAP for overlapping provisions with 40 CFR part 63 subpart A (General Provisions). All provisions in Table 1 and definitions in the General Provisions are incorporated by reference.Please be aware that the USEPA made its best effort to make this an accurate inspection checklist, however, in the event that there are typing errors or deviations from the final pharmaceutical MACT rule, the final rule stands.iiTABLE OF CONTENTSI. GENERAL APPLICABILITY (1)A.Is the facility a major HAP source? (1)B.Does the facility produce any pharmaceutical products? (1)C.Are any processes that produce a pharmaceutical product using, processing, orproducing HAP? (1)D.Are any of the following HAP emission points located within pharmaceuticalmanufacturing process units? (1)E.Was the pollution prevention alternative selected for one or more processes? (1)II. COMPLIANCE DEADLINES (2)A.All Pharmaceutical Manufacturing Operations Subject to New Source Standards (2)B.All Pharmaceutical Manufacturing Operations Subject to Existing Source Standards (2)III. REPORTING REQUIREMENTS (3)A.Performance Testing (3)B.Initial Notifications (3)C.Notification of Compliance Status Report (NOCSR) (4)D.Periodic Reports (6)E.Process Changes (10)F.Startup, Shutdown and Malfunction (SSM) Plan (11)G.Startup, Shutdown and Malfunction Reports (12)IV.RECORDKEEPING (13)A.Data Retention (13)B.Records for Emission Points (13)V. REQUIREMENTS FOR PROCESS VENTS (13)A.Applicability (13)B.Control Requirements for Process Vents at Existing Sources (14)C.Control Requirements for Process Vents at New Sources (19)D.Recordkeeping Specific for Process Vents (22)E.Reporting Specific for Process Vents (24)VI. REQUIREMENTS FOR STORAGE TANKS (24)A.Applicability (24)B.Control Requirements for Storage Tanks (25)C.Recordkeeping Requirements for Storage Tanks (27)D.Periodic Reports for Storage Tanks Equipped with a Closed-Vent SystemRouted to a Control Device (29)VII. REQUIREMENTS FOR WASTEWATER STREAMS (29)A.Applicability (29)B.Control Requirements for Wastewater Streams and Residuals (31)C.Maintenance Wastewater Requirements (34)D.Monitoring Requirements (34)E.Recordkeeping Requirements (35)VIII. REQUIREMENTS FOR EQUIPMENT LEAKS (38)A.Applicability (38)B.Monitoring (39)C.Records of LDAR Programs (40)iiiIX. HEAT EXCHANGE SYSTEMS (46)A.Applicability (46)B.Monitoring (47)C.Recordkeeping (48)D.Reporting (49)X.POLLUTION PREVENTION (P2) – 40 CFR 63.1252 (49)A.For facilities using 75% HAP emission reduction P2 plan –Monitoring and Recordkeeping (49)B.For facilities using 50% HAP emission reduction with 25% add-on control P2 plan –Monitoring and Recordkeeping (49)XI. GENERIC CHECKLIST ITEMS: EMISSION STREAMS ROUTED TO A CONTROL DEVICE..50A.Control Devices (50)B.Monitoring for Alternative Standard (53)C.Exceedances of Operating Parameters (54)D.Excursions of Operating Parameters (54)E.Control Device Data Sheets (55)ivSection I. General Applicability 1I. GENERAL APPLICABILITYNote: The answers to question A, B, and C must be “yes” for the facility to be subject to the pharmaceuticals NESHAP. Additionally, research and development facilities are not subject to the pharmaceuticals NESHAP.A.Is the facility a major HAP source?[ ]Potential to emit $ 10 tons per year (tpy) of any of the 188 HAPs listedin §112(b) of the Clean Air Act (with the exception of delisted HAPs), or[ ]Potential to emit $ 25 tpy of total HAPs.Note: Although research and development facilities are not subject to thepharmaceuticals NESHAP, their emissions must be included in the potentialto emit calculations.Yes [ ] No [ ]B.Does the facility produce any pharmaceutical products? (Check all ofthe following that apply.)[ ]Any material described by the SIC code 2833 or 2834[ ]Any material whose manufacturing process is described by NAICScode 325411 or 325412[ ]A finished dosage form of a drug (e.g., tablet, capsule, solution, etc.)[ ]Any active ingredient or precursor produced at a facility whose primaryoperations are described by SIC code 2833 or 2834[ ]Any material whose primary use is as an active ingredient that isproduced at a facility whose primary operations are not described bySIC code 2833 or 2834Yes [ ] No [ ]C.Are any processes that produce a pharmaceutical product using,processing, or producing HAP?Yes [ ] No [ ]D.Are any of the following HAP emission points located withinpharmaceutical manufacturing process units? (Check the emissionpoints below that apply.)[ ]Process vents[ ]Storage tanks[ ]Wastewater streams and treatment operations[ ]Equipment containing or contacting a HAPYes [ ] No [ ]E.Was the pollution prevention alternative selected for one or moreprocesses?Note: If the answer to this question is “yes,” skip sections V through VIII ofthis checklist for that process or processes.Yes [ ] No [ ]N/A [ ]Section II. Compliance Deadlines 2II. COMPLIANCE DEADLINESA.All Pharmaceutical Manufacturing Operations Subject to New SourceStandards1.Except as specified in questions 2 through 4, was the new orreconstructed affected source in compliance upon startup or August 29,2000 (i.e., the date of publication of the final amendments), whichever was later?Yes [ ] No [ ]N/A [ ]2.Affected sources that commenced construction or reconstruction afterApril 2, 1997 and before September 21, 1998 are not required to comply with the new source requirements in the amended final rule untilSeptember 21, 2001 if both of the following are true:a)Are the requirements of the amended final rule more stringentthan the requirements published on September 21, 1998? andYes [ ] No [ ]N/A [ ]b)Did the facility comply with the April 2, 1997 proposed rule duringthe period until September 21, 2001?Yes [ ] No [ ]N/A [ ]3.Affected sources that commenced construction or reconstruction afterSeptember 21, 1998 and before April 10, 2000 are not required tocomply with the new source requirements in the amended final rule until October 21, 2002 if both of the following are true:a)Are the requirements of the amended final rule more stringentthan the requirements published on September 21, 1998? andYes [ ] No [ ]N/A [ ]b)Did the facility comply with the requirements published onSeptember 21, 1998 during the period between startup andOctober 21, 2002?Yes [ ] No [ ]N/A [ ]4.Affected sources that commenced construction or reconstruction afterApril 10, 2000 and before August 29, 2000 are not required to comply with the new source requirements of the amended final rule untilAugust 29, 2001 if both of the following are true:a)Are the requirements of the amended final rule more stringent thatthe proposed amendments? andYes [ ] No [ ]N/A [ ]b)Did the facility comply with the requirements published onSeptember 21, 1998 during the period between startup andAugust 29, 2001?Yes [ ] No [ ]N/A [ ]B.All Pharmaceutical Manufacturing Operations Subject to ExistingSource StandardsWere all emission points in compliance by October 21, 2002, or by the date of a compliance extension granted under § 63.1250(f)(6)(i)?Yes [ ] No [ ]N/A [ ]III. REPORTING REQUIREMENTSA.Performance TestingNote: The questions in this section apply for each individual control device for which a performance test is required. Facilities may submit anapplication for approval of an alternative test method, which must bereviewed and approved per §63.7(f).1.Did the facility conduct an initial performance test of all pollution controlequipment for which it is required?(If the inlet HAP emissions to a pollution control device exceed 10 tpy, and the control device is used to control process vent emissions, aninitial performance test is generally required. A performance test is not required for vents using the alternative standard as described by§63.1254(c). Either performance tests or design evaluations may be conducted for control devices used to control storage tanks orwastewater systems. Note that no performance tests are required for floating roofs, process heaters > 44 MW with vent introduced into the flame zone, condensers, or RCRA devices.)Yes [ ] No [ ]N/A [ ]2.Did the facility notify the regulatory authority at least 60 days prior toeach test? (§63.1260(l))Yes [ ] No [ ]3.Did the facility submit the test plan and emission profile with thenotification of the performance test? (§63.1260(l))Yes [ ] No [ ]4.Was the initial performance test plan approved by EPA within 60 daysof submission? (§63.7(c)(3))Note: The facility can proceed with the performance test if EPA does notrespond within the specified review period.Yes [ ] No [ ]B.Initial Notifications1.For pharmaceutical manufacturing operations subject to existing sourcestandards:a)Does the report contain all of the following information(§63.9(b)(2)(i) through (v)):•The name and address of the owner or operator?Yes [ ] No [ ]N/A [ ]•The physical location (address) of the affected sources?Yes [ ] No [ ]N/A [ ]•The relevant standard, or other requirements, that are the basis of the notification?Yes [ ] No [ ]N/A [ ]•The source’s compliance date?Yes [ ] No [ ]N/A [ ]• A brief description of the nature, size, design, and method ofoperations of the source, including its operating and design capacity and a preliminary identification of emission sources?Yes [ ] No [ ]N/A [ ]3• A statement indicating that the affected source is a major source?Yes [ ] No [ ]N/A [ ]b)Did the facility submit the notification within 120 calendar days afterSeptember 21, 1998?Yes [ ] No [ ]N/A [ ]2.For new or reconstructed sources or dedicated PMPU:a)Did the facility submit a notification of intention to construct a newmajor affected source, reconstruct a major affected source, orreconstruct a major source such that it becomes a major affectedsource (§63.1260(b) and §63.9(b))? The notification should havebeen submitted in accordance with one of the following:•If construction or reconstruction began BEFORE the effective date of the Pharmaceutical MACT standard (i.e., September 21,1998), was the notification submitted with the faclility’sapplication for approval to construct or reconstruct, and did it indicate the date when construction or reconstruction began?Yes [ ] No [ ]N/A [ ]•If construction or reconstruction began AFTER the effective date of the Pharmaceutical MACT standard, did the notification indicate the date when construction began, and was the reportpostmarked no later than 30 days after such date (§63.9(b)(4)(iii))?Yes [ ] No [ ]N/A [ ]b)Did the facility submit a notification of the anticipated startup of thesource, and was it delivered or postmarked between 30 and 60 days before such date (§63.9(b)(4)(iv))?Yes [ ] No [ ]N/A [ ]c)Did the facility submit a notification of the actual startup date, andwas is delivered or postmarked within 15 days after that date (§63.9(b)(4)(v))?Yes [ ] No [ ]N/A [ ]C.Notification of Compliance Status Report (NOCSR)Note: This Checklist identifies the types of information that must beincluded in the NOCSR, but an evaluation of whether the informationdemonstrates compliance is beyond the scope of this checklist. See§63.1260(f) in the rule for guidance on how to evaluate the information.1.Did the facility submit a NOCSR within 150 days after the applicablecompliance date (i.e., by March 21, 2003 for existing sources and 150days after startup for new sources) (§63.1260(f))? Yes [ ] No [ ]2.Did the report include the results of all applicability determinations,emissions calculations, and/or analyses used to identify and quantify HAP emissions from the affected source (§63.1260(f)(1))?Yes [ ] No [ ]N/A [ ]3.Did the report include the results of emissions profiles, performancetests, engineering analyses, design evaluations, and/or calculations used to demonstrate compliance (§63.1260(f)(2))?Yes [ ] No [ ]N/A [ ]a)For performance tests, did the results include descriptions ofsampling and analysis procedures and quality assurance procedures?Yes [ ] No [ ]N/A [ ]44.Did the report contain each of the following about monitoring(§63.1260(f)(3)):a)Descriptions of monitoring devices?Yes [ ] No [ ]N/A [ ]b)Descriptions of monitoring frequencies?Yes [ ] No [ ]N/A [ ]c)Values for monitoring parameters established during the initialcompliance determinations, and the supporting data and calculations?Yes [ ] No [ ]N/A [ ]d) A definition of the source’s operating day or block used to determineaverage values of monitored parameters? If using an operatingday, does the definition include the times an operating day begins and ends?Yes [ ] No [ ]N/A [ ]5.Did the report contain a list of operating scenarios for each process(§63.1260(f)(4))?Yes [ ] No [ ]N/A [ ]6.Did the report contain descriptions of worst-case operating and/ortesting conditions for applicable control devices (§63.1260(f)(5))?Yes [ ] No [ ]N/A [ ]7.For processes subject to equipment leak provisions:a)Did the report include the following general information(§63.1255(h)(2)(i)):•The process group identification?Yes [ ] No [ ]N/A [ ]•The number of each equipment type in organic HAP service, excluding equipment in vacuum service?Yes [ ] No [ ]N/A [ ]•The method of compliance with the standard (e.g., “monthly LDAR” or “equipped with dual mechanical seal”)?Yes [ ] No [ ]N/A [ ]b)For enclosed-vented process units, did the report include thefollowing information (§63.1255(h)(2)(iii)):•Process identification?Yes [ ] No [ ]N/A [ ]• A description of the system used to create a negative pressurein the enclosure and the control device used to comply with the requirements of §63.1255(b)(3)?Yes [ ] No [ ]N/A [ ]c)For each process subject to the requirements for pressure testing in§63.1255(b)(4)(iv), did the report include the following information (§63.1255(h)(2)(ii)):• A listing of all applicable products or product codes?Yes [ ] No [ ]N/A [ ]• A planned schedule for pressure testing when equipment isconfigured for production of products subject to the equipment leak provisions?Yes [ ] No [ ]N/A [ ]58.If the source is using a series of wastewater treatment devices or aseries of control devices to control emissions from wastewater streams,did the report identify the treatment and/or control devices, including the first and last in each series (§63.1256(g)(7)(i)(C) and (ii)(B))?Yes [ ] No [ ]N/A [ ]9.If the source uses process knowledge to determine annual average HAPconcentrations in a wastewater stream, did the report document how thepartially soluble, soluble, and/or total HAP concentrations were determined (§63.1257(e)(ii)(B))?Yes [ ] No [ ]N/A [ ]10.Did the report include a statement by the owner or operator as towhether the source has complied with the relevant standard or otherrequirements (§63.9(h)(2)(i)(G))?Yes [ ] No [ ] 11.Did the report identify emission points subject to overlappingrequirements and the authority under which the facility complies (§63.1260(f)(6))?Yes [ ] No [ ]N/A [ ]D.Periodic Reports1.Except under the conditions specified in items 2 and 4 of this checklist,has the facility submitted Periodic Reports semiannually beginning 240days after the due date of the NOCSR (i.e., by November 15, 2003 forexisting sources and 390 days after startup for new sources)?(§63.1260(g)(1))Note: For existing sources, the compliance date is October 21, 2002, and the NOCSR is due 150 days after the compliance date (i.e., March 21, 2003 unless a compliance extension was granted). The first periodic report is due 240 days after March 21, 2003. Thus, the first periodic report is due November 15, 2003 unless a compliance extension was granted.Yes [ ] No [ ]N/A [ ]2.If the facility experienced an exceedance of a temperature monitoringlimit for a condenser, an exceedance of an outlet concentration limit when monitoring with a CEM, or an exceedance of any of theparametric monitoring limits specified in §63.1258(b)(5) for thealternative standard: (§63.1260(g)(1)(ii))a)Were the Periodic Reports submitted quarterly? or Yes [ ] No [ ]N/A [ ]b)Has the source received permission to revert back to semiannualreporting?Yes [ ] No [ ]N/A [ ]3.Does the report identify each new operating scenario that wasimplemented during the reporting period? (§63.1260(g)(2)(vii)) Note: For the initial periodic report, each operating scenario for each process operated since the compliance date must be submitted.Yes [ ] No [ ]N/A [ ]4.When a new operating scenario was implemented since the last report,did the source submit reports quarterly? (§63.1260(g)(1)(iii))Yes [ ] No [ ]N/A [ ]5.Do the reports include all of the following (§63.1260(g)(2)(i) and§63.10(e)(3)(vi)):a)The affected source’s company name and address?Yes [ ] No [ ]6b)Identification of each HAP monitored at the affected source?Yes [ ] No [ ]c)Beginning and ending dates of the reporting period?Yes [ ] No [ ]d) A brief description of the process units?Yes [ ] No [ ]e) A description of any changes in processes or controls since the lastreporting period?Yes [ ] No [ ] f)The emission and operating limitations applicable to the affectedsource under 40 CFR part 63, subpart GGG?Yes [ ] No [ ] g)The total operating time of the affected source during the reportingperiod?Yes [ ] No [ ] h)An emissions data summary (or similar summary if the affectedsource is monitoring control system parameters), including each ofthe following:•The total duration of excess emissions, expressed in hours?Yes [ ] No [ ]N/A [ ]•The total duration of excess emissions, expressed as a percent of the total source operating time during the reporting period?Yes [ ] No [ ]N/A [ ]• A breakdown of the total duration of excess emissions during the reporting period into those that are due to startup/shutdown,control equipment problems, process problems, other known causes, and other unknown causes?Yes [ ] No [ ]N/A [ ]i)The name, title, and signature of the responsible official who iscertifying the accuracy of the report?Yes [ ] No [ ] j)The date of the report?Yes [ ] No [ ]6.Periodic reporting requirements for CMS.a)For each CMS, do the reports include all of the following:(§63.10(e)(3)(vi)(F), (G), and (K))•Equipment manufacturer(s) and model number(s)?Yes [ ] No [ ]N/A [ ]•Date of latest CMS certification or audit?Yes [ ] No [ ]N/A [ ]• A description of any changes in CMS since the last reporting period?Yes [ ] No [ ]N/A [ ]b)For each CMS, do the reports include a CMS performance summary(or similar summary if the affected source is monitoring controlsystem parameters) that contains all of the following(§63.1260(g)(2)(i) and §63.10(e)(3)(vi)(J)):•The total CMS downtime during the reporting period, expressed in hours?Yes [ ] No [ ]N/A [ ]•The total duration of CMS downtime, expressed as a percent of the total source operating time during that reporting period?Yes [ ] No [ ]N/A [ ]7• A breakdown of the total CMS downtime during the reporting period that are due to monitoring equipment malfunctions, non-monitoring equipment malfunctions, quality assurance/qualitycontrol calibrations, other known causes, and other unknown causes?Yes [ ] No [ ]N/A [ ]c)If the total duration of excess emissions, parameter exceedances, orexcursions is $1 percent of the total operating time during thereporting period or the total CMS downtime is $5 percent of the total operating time during the reporting period, does the report include each of the following (§63.1260(g)(2)(ii)(D) and §63.10(c)(5) through(13)):•The date and time during which the CMS was inoperative except for zero and high-level checks?Yes [ ] No [ ]N/A [ ]•The date and time during which the CMS was out of control? Note: “Out-of-control” includes periods when (1) the zero-, mid-, or high-level calibration drift exceeds 2 times the drift specification; or (2) the CMS fails a performance test audit, relative accuracy audit, relative accuracy test audit, or linearity test audit (§63.8(c)(7)(i)).Yes [ ] No [ ]N/A [ ]•Date and time of commencement and completion of each period of excess emissions and parameter monitoringexceedances that occurs during startups, shutdowns, and malfunctions of the affected source?Yes [ ] No [ ]N/A [ ]•Date and time of commencement and completion of each period of excess emissions and parameter monitoringexceedances that occurs during periods other than startups, shutdowns, and malfunctions of the affected source?Yes [ ] No [ ]N/A [ ]•The nature and cause of any malfunction?Yes [ ] No [ ]N/A [ ]•The corrective action taken or preventive measures adopted?Yes [ ] No [ ]N/A [ ]•The nature of the repairs or adjustments to the CMS that was inoperative or out of control?Yes [ ] No [ ]N/A [ ]•The total process operating time during the reporting period?Yes [ ] No [ ]N/A [ ]7.If the total duration of excess emissions, parameter exceedances, orexcursions for the reporting period is $1 percent of the total operatingtime for the reporting period, or the total downtime for the reportingperiod is $5 percent of the total operating time, does the report includeeach of the following (§63.1260(g)(2)(ii)(A) through (C)):a)Monitoring data, including 15-minute monitoring values and daily (orblock) average values of monitored parameters, for all operatingdays when the average values were outside of the ranges established in the NOCSR or operating permit?Yes [ ] No [ ]N/A [ ]8b)Duration of excursions?Yes [ ] No [ ]N/A [ ]c)Operating logs and operating scenarios for all operating days whenthe values are outside the levels established in the NOCSR or operating permit?Yes [ ] No [ ]N/A [ ]8.For each inspection conducted on a vapor collection system, closed-vent system, fixed roof, cover, or enclosure pursuant to §63.1258(h)(2) or (3) during which a leak is detected during the reporting period, does the report include all of the following information (§63.1260(g)(2)(iii) and§63.1259(i)(7)):a)The instrument identification number(s)?Yes [ ] No [ ]N/A [ ]b)The operator name or initials?Yes [ ] No [ ]N/A [ ]c)Identification of the equipment?Yes [ ] No [ ]N/A [ ]d)The date the leak was detected?Yes [ ] No [ ]N/A [ ]e)The date of the first attempt to repair the leak?Yes [ ] No [ ]N/A [ ]f)The maximum instrument reading measured (by the method in§63.1258(h)(4)) after the leak is successfully repaired or determined to be nonrepairable?Yes [ ] No [ ]N/A [ ]g)If the leak is not repaired within 15 calendar days after discovery ofthe leak, each of the following:• A statement that repair is delayed?Yes [ ] No [ ]N/A [ ]•The reason for the delay?Yes [ ] No [ ]N/A [ ]•The name, initials, or other form of identification of the owner oroperator (or designee) whose decision it was that repair could not be effected without a shutdown?Yes [ ] No [ ]N/A [ ]•The expected date of successful repair?Yes [ ] No [ ]N/A [ ]h)Dates of shutdowns that occur while the equipment is unrepaired?Yes [ ] No [ ]N/A [ ]i)The date of successful repair of the leak?Yes [ ] No [ ]N/A [ ]99.For each vapor collection system or closed-vent system with a bypassline and a flow indicator (i.e., subject to §63.1252(b)(1)), does the report include the following records (§63.1260(g)(2)(iv) and §63.1259(i)(6)(i)):a)Records identifying the hourly periods during which a diversion ofthe vent stream from the control device was detected?Yes [ ] No [ ]N/A [ ]b)Records of the times and durations of all periods when the ventstream is diverted?Yes [ ] No [ ]N/A [ ]c)Records of times and durations of all periods when the flow indicatoris not operating?Yes [ ] No [ ]N/A [ ]10.For each vapor collection system or closed-vent system with a bypassline and a bypass line valve that is secured with a car seal or lock and key (i.e., subject to §63.1252(b)(2)), does the report include records of the following occurrences (§63.1260(g)(2)(iv) and §63.1259(i)(6)(ii)):a)All periods in which the seal mechanism is broken?Yes [ ] No [ ]N/A [ ]b)All periods in which the bypass valve position has changed?Yes [ ] No [ ]N/A [ ]c)All periods when the key to unlock the bypass line valve waschecked out?Yes [ ] No [ ]N/A [ ]11.Does the report include the following statements when applicable(§63.1260(g)(2)(v)):a)No excess emissions?Yes [ ] No [ ]N/A [ ]b)No exceedances of a parameter?Yes [ ] No [ ]N/A [ ]c)No excursions?Yes [ ] No [ ]N/A [ ]d)No CMS has been inoperative, out of control, repaired, or adjusted?Yes [ ] No [ ]N/A [ ] 12.For each storage tank subject to control requirements, does the reportidentify periods of planned routine maintenance during which the controldevice did not meet the control requirements specified in §63.1253(b) through (d)? (§63.1260(g)(2)(vi))Yes [ ] No [ ]N/A [ ]E.Process Changes1.Has the facility made any process changes or a change in theinformation submitted in the NOCSR? (§63.1260(h)(1))Note: For the purposes of §63.1260(h)(1), a process change means thestarting of a new process.Yes [ ] No [ ]2.If the answer to question G.1 is “yes,” did the facility submit a summaryof the changes in its Periodic Report? (See Checklist item III.G.5.e)Yes [ ] No [ ]N/A [ ]10。
FortiGate FortiWiFi 40F系列安全SD-WAN一体化威胁管理防火墙IPS NGF

Firewall IPS NGFW Threat Protection Interfaces 5 Gbps 1 Gbps 800 Mbps 600 MbpsMultiple GE RJ45Refer to specification table for detailsThe FortiGate/FortiWiFi 40F series offers an excellent Security and SD-WAN solution in a compact fanless desktop form factor for enterprise branch offices and mid-sized businesses. Protects against cyber threats with industry-leading secure SD-WAN in a simple, affordable, and easy to deploy solution.Security§Identifies thousands of applications inside network traffic for deep inspection and granular policy enforcement§Protects against malware, exploits, and malicious websites in both encrypted and non-encrypted traffic§Prevents and detects against known and unknown attacks using continuous threat intelligence from AI-powered FortiGuard Labs security services Performance§Delivers industry’s best threat protection performance and ultra-low latency using purpose-built security processor (SPU) technology§Provides industry-leading performance and protection for SSL encrypted traffic Certification§Independently tested and validated best security effectiveness and performance§Received unparalleled third-party certifications from NSS Labs, ICSA, Virus Bulletin, and AV ComparativesNetworking§Best of Breed SD-WAN capabilities to enable application steering using WAN path control for high quality of experience§Delivers advanced networking capabilities, high-performance, and scalable IPsec VPN capabilities Management§Includes a Management Console that is effective, simple to use, and provides comprehensive network automation & visibility.§Provides Zero Touch Integration with Security Fabric’s Single Pane of Glass Management§Predefined compliance checklist analyzes the deployment and highlights the best practices to improve overall security posture Security Fabric§Enables Fortinet and Fabric-ready partners’ products to provide broader visibility, integrated end-to-end detection, threat intelligence sharing and automated remediation§Automatically builds Network Topology visualizations which discover IoT devices and provide complete visibility into Fortinet and Fabric-ready partner productsDATA SHEET | FortiGate/FortiWiFi® 40F SeriesDeploymentU nified Threat Management(UTM)§Integrated wired and wireless networking to simplify IT§Purpose-built hardware for industry best performance with easyadministration through cloud management§Provides consolidated security and networking for smallbusinesses and consistently provides top-rated threat protection§Proactively blocks newly discovered sophisticated attacks inreal-time with advanced threat protectionS ecureSD-WAN§Secure direct Internet access for Cloud Applications forimproved latency and reduced WAN cost spending§High-performance and cost-effective threat protectioncapabilities§WAN Path Controller and Link Health Monitoring for betterapplication performance and quality of experience§Security Processer powered industry’s best IPsec VPN and SSLInspection performance§Simplified Management and Zero Touch deploymentFortiGate 40F deployment in Small Office(UTM)FortiGate 40F deployment in Enterprise Branch(Secure SD-WAN)Secure AccessSwitchDATA SHEET | FortiGate/FortiWiFi ® 40F Series3HardwareInterfaces1. USB Port2. Console Port3. 1x GE RJ45 WAN PortFortiGate/FortiWiFi 40F Series4. 1x GE RJ45 FortiLink Port5. 3x GE RJ45 Ethernet PortsPowered by Purpose-built Secure SD-WAN ASIC SOC4§Combines a RISC-based CPU with Fortinet’s proprietary Security Processing Unit (SPU) content and network processors for unmatched performance§Delivers industry’s fastest application identification and steering for efficient business operations§Accelerates IPsec VPN performance for best user experience on direct internet access§Enables the best of breed NGFW Security and Deep SSL Inspection with high performance§Extends security to access layer to enable SD-Branch transformation with accelerated and integrated switch and access point connectivity3G/4G WAN ConnectivityThe FortiGate 40F Series includes a USB port that allows you to plug in a compatible third-party 3G/4G USB modem, providing additional WAN connectivity or a redundant link for maximum reliability.Compact and Reliable Form FactorDesigned for small environments, you can place it on a desktop or wall-mount it. It is small, lightweight yet highly reliable with a superior MTBF (Mean Time Between Failure), minimizing the chance of a network disruption.Exte nds Se curity to Acce ss Laye r with FortiLink PortsFortiLink protocol enables you to converge security and the network access by integrating the FortiSwitch into the FortiGate as a logical extension of the NGFW. These FortiLink enabled ports can be reconfigured as regular ports as needed.allows security to dynamically expand and adapt as more and moreworkloads and data are added. Security seamlessly follows andprotects data, users, and applications as they move between IoT,devices, and cloud environments throughout the network. All thisis tied together under a single pane of glass management therebydelivering leading security capabilities across your entire environmentwhile also significantly reducing complexity.FortiGates are the foundation of Security Fabric, expanding securityvia visibility and control by tightly integrating with other Fortinetsecurity products and Fabric-Ready Partner solutions.FortiOSControl all security and networking capabilities across the entireFortiGate platform with one intuitive operating system. R educecomplexity, costs, and response time with a truly consolidated next-generation security platform.§ A truly consolidated platform with a single OS and pane-of-glass for all security and networking services across all FortiGateplatforms.§Industry-leading protection: NSS Labs Recommended, VB100,AV Comparatives, and ICSA validated security and performance.Ability to leverage latest technologies such as deception-basedsecurity.§Control thousands of applications, block the latest exploits, andfilter web traffic based on millions of real-time UR L ratings inaddition to true TLS 1.3 support.§Prevent, detect, and mitigate advanced attacks automaticallyin minutes with integrated AI-driven breach prevention andadvanced threat protection.§Improved user experience with innovative SD-WAN capabilitiesand ability to detect, contain and isolate threats with Intent-basedSegmentation.§Utilize SPU hardware acceleration to boost security capabilityperformance.ServicesFortiGuard™Security ServicesFortiGuard Labs offer real-time intelligence on the threat landscape,delivering comprehensive security updates across the full rangeFortiCare™Support ServicesOur FortiCare customer support team provides global technicalsupport for all Fortinet products. With support staff in the Americas,DATA SHEET | FortiGate/FortiWiFi ® 40F Series5Specifications(1518 / 512 / 64 byte UDP packets)Firewall Latency (64 byte UDP packets) 4 μs Firewall Throughput (Packets Per Second)7.5 Mpps Concurrent Sessions (TCP)700,000New Sessions/Second (TCP)35,000Firewall Policies5,000IPsec VPN Throughput (512 byte) 1 4.4 Gbps Gateway-to-Gateway IPsec VPN Tunnels 200Client-to-Gateway IPsec VPN Tunnels 250SSL-VPN Throughput490 Mbps Concurrent SSL-VPN Users(Recommended Maximum, Tunnel Mode)200SSL Inspection Throughput (IPS, avg. HTTPS) 3310 Mbps SSL Inspection CPS (IPS, avg. HTTPS) 3320SSL Inspection Concurrent Session (IPS, avg. HTTPS) 355,000Application Control Throughput (HTTP 64K) 2990 Mbps CAPWAP Throughput (HTTP 64K) 3.5 Gbps Virtual Domains (Default / Maximum)10 / 10Maximum Number of FortiSwitches Supported 8Maximum Number of FortiAPs (Total / Tunnel Mode)10 / 5Maximum Number of FortiTokens500Maximum Number of Registered FortiClients 200High Availability ConfigurationsActive / Active, Active / Passive, ClusteringNote: All performance values are “up to” and vary depending on system configuration. 1. IPsec VPN performance test uses AES256-SHA256.2. IPS (Enterprise Mix), Application Control, NGFW, and Threat Protection are measured with Logging enabled.3. SSL Inspection performance values use an average of HTTPS sessions of different cipher suites.4. NGFW performance is measured with Firewall, IPS, and Application Control enabled.5. Threat Protection performance is measured with Firewall, IPS, Application Control, and Malware Protection enabled.(External DC Power Adapter, 12 VDC)Maximum Current100V AC / 0.2A, 240V AC / 0.1ATotal Available PoE Power Budget*N/APower Consumption (Average / Maximum)12.4 W / 15.4 W 13.6 W / 16.6 W Heat Dissipation 52.55 BTU/hr56.64 BTU/hrOperating Temperature 32–104°F (0–40°C)Storage Temperature -31–158°F (-35–70°C)Humidity 10–90% non-condensingNoise Level Fanless 0 dBA Operating Altitude Up to 7,400 ft (2,250 m)Compliance FCC Part 15 Class B, C-Tick, VCCI, CE, UL/cUL, CB CertificationsICSA Labs: Firewall, IPsec, IPS, Antivirus, SSL-VPN* Maximum loading on each PoE/+ port is 30 W (802.3at).DATA SHEET | FortiGate/FortiWiFi ® 40F SeriesCopyright © 2020 Fortinet, Inc. All rights reserved. Fortinet®, FortiGate®, FortiCare® and FortiGuard®, and certain other marks are registered trademarks of Fortinet, Inc., and other Fortinet names herein may also be registered and/or common lawtrademarks of Fortinet. All other product or company names may be trademarks of their respective owners. Performance and other metrics contained herein were attained in internal lab tests under ideal conditions, and actual performance and other results may vary. Network variables, different network environments and other conditions may affect performance results. Nothing herein represents any binding commitment by Fortinet, and Fortinet disclaims all warranties, whether express or implied, except to the extent Fortinet enters a binding written contract, signed by Fortinet’s General Counsel, with a purchaser that expressly warrants that the identified product will perform according to certain expressly-identified performance metrics and, in such event, only the specific performance metrics expressly identified in such binding written contract shall be binding on Fortinet. For absolute clarity, any such warranty will be limited to performance in the same ideal conditions as in Fortinet’s internal lab tests. Fortinet disclaims in full any covenants, representations, and guarantees pursuant hereto, whether express or implied. Fortinet reserves the right to change, modify, transfer, or otherwise revise this publication without notice, and the most current version of the publication shall be applicable. Fortinet disclaims in full any covenants, representations, and guarantees pursuant hereto, whether express or implied. Fortinet reserves the right to change, modify, transfer, or otherwise revise this publication without notice, and the most current version of the publication shall be applicable.FST -PROD-DS-GT40FFGFWF-40F-DAT -R2-202002Order InformationProduct SKU DescriptionFortiGate 40F FG-40F 5 x GE RJ45 ports (including 4 x Internal Ports, 1 x WAN Ports), Max managed FortiAPs (Total / Tunnel) 10 / 5FortiWiFi 40FFWF-40F5 x GE RJ45 ports (including 4 x Internal Ports, 1 x WAN Ports), Wireless (802.11a/b/g/n/ac-W2), Max managed FortiAPs (Total / Tunnel) 10 / 5BundlesFortiGuard BundleFortiGuard Labs delivers a number of security intelligence services to augment the FortiGate firewall platform. You can easily optimize the protection capabilities of your FortiGate with one of these FortiGuard Bundles.Bundles 360 Protection Enterprise Protection UTM Threat Protection FortiCareASE 124x724x724x7FortiGuard App Control Service ••••FortiGuard IPS Service••••FortiGuard Advanced Malware Protection (AMP) — Antivirus, Mobile Malware, Botnet, CDR, Virus Outbreak Protection and FortiSandbox Cloud Service ••••FortiGuard Web Filtering Service •••FortiGuard Antispam Service •••FortiGuard Security Rating Service ••FortiGuard Industrial Service ••FortiCASB SaaS-only Service ••FortiConverter Service•SD-WAN Cloud Assisted Monitoring 2•SD-WAN Overlay Controller VPN Service 2• FortiAnalyzer Cloud2•FortiManager Cloud 2•1. 24x7 plus Advanced Services Ticket Handling2. Available when running FortiOS 6.2。
VR中英文对照

Global Switches(全局光照开关设置)Materials(材质)Reflection/Refraction(反射/折射)Max Depth(最大深度)2 Max Transp.Level(最大透明级别)50Transp. Cutoff(透明终止值)0.001 Maps(帖图)Filter Maps(过滤贴图)Glossy Effects(光滑效果)Override materials(覆盖材质)Indirect Illumination(间接照明)Don't render final image(不渲染最终的图象)Raytracing(光线跟踪)Secondary ray bias(二级光线偏移)0Render(渲染)Batch render(批量渲染)Low thread priority(低线程优先权)Show progress window(显示步进窗口)Lighting(照明)Lights(灯光)Hidden Lights(隐蔽灯光)Default Lights(缺省灯光)Shadows(阴影)Show GI Only(只显示全局光照)Gamma Correction(伽玛值修正)Output(导出)2.2 Input(导入)2.2 LCorrect RGB(修正三原色)Correct LDR Textures(修正LDR材质)System(系统设置)Raycaster Params(光线追踪参数)Max Depth(最大深度)60 Min Leaf(最小树叶)0Face/Level(面/级)2 Mem Limit(限制)400Distributed Rendering(分布式渲染设置)Distributed Rendering(分布式渲染)Settings(设置)Region Division(区域分割)Width(宽)48 Height(高)48Means(方法):Region W/H(区域宽/高)▲Sequence(排序):Triangulation(三角剖分)▲Reverse Sequence(区域排序)Camera(照相机设置)Default Camera(缺省照相机)Type(类型):Standard(标准)▲Height(高度)400 Delta(深度)2Override FOV(视野)45 Auto Fit Curve(自动适合曲线)1Physical Camera(物理照相机)On(开)Type(类型):Still camera(静止照相机)▲Override Focal Length(焦距)40Shutter speed(快门速度)125 Film Width(宽)36 Distortion(矢真)0Shutter angle(快门角度)180 Zoom(焦距缩放)1 Lens shift(焦距移动)0Shutter offset(快门位移)0 F-number(焦距比数)11 White balance(白平衡)Latency(潜伏)0 Film speed (ISO)(感光度)125Exposure(曝光)V ignetting(渐晕)Depth of Field(景深)On(开)Aperture(光圈)0.1 Sides(段数)5 Rotation(旋转)0 Center Bias(中心偏移)0 Anisotropy(各向异性)0 Subdivs(细分)6 Override Focal Dist.(焦距)200Motion Blur(运动模糊)On(开)Duration(持续时间)1 Interval Center(间隔中心)0.5 Subdivs(细分)6Bias(偏移)0 Geometry samples(几何结构采样)2Output(导出设置)Output Size(导出大小)Override Viewport(替代视窗)Width(宽)320 640x480 / 1024x768 / 1600x1200Height(高)240 800x600 / 1280x960 / 2048x1536Image Aspect(图像比率)1.3333 L Pixel Aspect(像素)1 LRender Output(渲染导出)Save file(保存文件)V-Ray Raw Image File(VRay专用RA W格式图像文件)Render to VRImage(渲染到VRay图像)Animation(动画)On(开)Frame Rate(框架率)NTSC / PAL / Film(电影)/ Custom(自定义)FPS(帧)30Environment(环境设置)GI (Skylight)(全局光照(天空光))1 M Reflection(反射)1 mBackground(背景)1 M Refraction(折射)1 mImage Sampler(图像采样设置)Image Sampler(图像采样)Fixed Rate(固定细分)■Subdivs(细分)1Adaptive QMC(自适应准蒙特卡罗)■Min Subdivs(最小细分)1 Max Subdivs(最大细分)16Adaptive Subdivision(自适应细分)■Min Rate(最小比率)-1 Max Rate(最大比率)2 Threshold(极限值)0.1 Normaks (法线)0.1Antialiasing filter(边缘抗齿锯过滤)On(开)Area(面积):Size(大小)1.5▲QMC Sampler(准蒙特卡罗采样设置)QMC Sampler(准蒙特卡罗采样)Adaptive Amount(自适应数量)1 Min Samples(最小采样值)8Noise Threshold(噪波极限值)0.01 Subdiv Mult(细分倍增)1Path Sampler(路径采样器):Randomized Halton(使随机化)▲Color Mapping(颜色映射设置)Color Mapping(颜色映射)Type(类型):Reinhard()▲Multiplier(倍增)1 Burn V alue(曝光值)0.8 Affect Background(影响背景)Clamp Output(加强输出)Sub-pixel(子像素贴图)VFB Channels(VFB通道设置)VFB Channels(VFB通道):Atmosphere(空气)▲Diffuse(漫反射)Shadow(阴影)Lighting(照明)GI(全局光照)Caustics(散焦)Raw GI(RA W全局光照)Raw Shadow(RA W阴影)Z-Depth(Z轴深度)Normals(法向)Background (背景)Displacement(置换设置)Displacement(置换)Edge Length(pix)(边界长度)4 Max Subdivs(最大细分)256 Amount(数量)1 Relative to bbox(相对边界盒)V iew-Dependent(依靠视图)Tight Bounds(紧密跳跃`)Indirect Illumination(间接照明设置)GI(全局光照)On(开)Reflect Caustics(反射)Refract Caustics(折射)Post-Processing(布置数据处理)Saturation(饱和度)1 Contrast Base(基本对比度)0.5Contrast(对比度)1 Save maps per frame(保存每帖贴图)Primary Engine(首次反弹)Multiplier(倍增)1 Quasi Monte-Carlo(准蒙特卡罗算法)■▲Secondary Engine(二次反弹)Multiplier(倍增)1 Light Cache(灯光缓冲)■▲Quasi-Monte Carlo GI(准蒙特卡罗全局光照设置)■QMC GI(准蒙特卡罗全局光照)Subdivs(细分)8 Secondary Bounces(二次反弹)3Light Cache(灯光缓冲设置)■Calculation Parameters(计算参数)Subdivs(细分)1000 Scale(比例):Screen(屏幕)▲Sample Size(采样大小)0.02 Num.Phases(进程数量)4Store Direct Light(存储直接灯光)Show Calc.Phase(显示计算相位)Adaptive(自适应)Reconstruction Parameters(重建参数)Pre-filter(预滤器)10 Use For Glossy Rays(使用灯光缓冲光滑光线)Filter(过滤):Nearest(接近)▲Interp.Samples(插补采样)5Mode(方式)Single Frame(单帧)Fly Through(通过)Path Tracing(路径跟踪)From File(来自文件)Current Map(当前贴图)Save(保存)Reset(清除)Post Render(渲染后)Don't Delete(不删除)Auto Save(自动保存)Irradiance Map(发光贴图)■Basic Parameters(基本参数)Min Rate(最小比率)-3 Max Rate(最大比率)0 Color Threshold(色彩极限值)0.3 HSph.Subdivs(半球细分)50 Samples(采样)20 Normal Threshold(法线极限值)0.1Distance Threshold(距离极限值)0.1Basic Options(基本选项)Show Calculation Phase(显示计算相位)Show Samples(显示采样点)Show Direct Light(存储直接灯光)Detail enhancement(细节增强)On(开)Scale(比例):Screen(屏幕)▲Radius(半径)60 Subdiv mult(细分倍增)0.3 Advanced Options(高级选项)Interpolation Type(插值类型):Least Squares Fit(最小平方适应)▲Sample Lookup Type(采样查找类型):Density Based(基于密度)▲Calc Samples(计算采样)15 Multipass(多重预计算)Randomize Samples(随机采样)Check Sample Visibility(检查样本可见性)Mode(方式)Single Frame(单帧)Incremental add to current map(添加方式增加到当前贴图)Bucket Mode(块模式)From File(来自文件)Current Map(当前贴图)Save(保存)Reset(清除)Post Render(渲染后)Don't Delete(不删除)Auto Save(自动保存)Photon Map(光子贴图)■Basic Parameters(基本参数)Bounces(反弹)10 Max Photons(最大光子)30Search Distance(搜寻距离)20 Multiplier(倍增)1Retrace Threshold(反射极限值)0 Max Density(最大密度)0Retrace Bounces(反射反弹数)10 Interp. Samples(插值采样)10Convex Hull Estimate(凸起表面区域评估)Store Direct Light(存储直接灯光)Mode(方式)New Map(新贴图)From File(来自文件)Current Map(当前贴图)Save(保存)Reset(清除)0 samples(采样)Post Render(渲染后)Don't Delete(不删除)Auto Save(自动保存)Caustics(散焦设置)Caustics(散焦)On(开)Max Photons(最大光子)50 Multiplier(倍增)1Max Density(最大密度)0 Search Distance(搜索距离)20Mode(方式)New Map(新贴图)From File(来自文件)Current Map(当前贴图)Save(保存)Reset(清除)0 samples(采样)Post Render(渲染后)Don't Delete(不删除)Auto Save(自动保存)Material Editor(材质编辑)Material Preview(材质预览)Update Preview(更新查阅)Material Workspace(材质预览)Scene Materials(场材质)Default_VRay_Material(默认材质)Add material(增加材质)*Add V rayMld(增加VRay专用材质)*Add VRay2SidedMld(增加VRat双面材质)[ Front(正面)Back(背面)Color(颜色)] *Add VRaySKp2SidedMld(增加VRaySKp双面材质)[ Front(正面)Back(背面)] Import new material(导入新材质)Purge unused materials(清除不用的材质)Rename(改名)Remove(移除)Duplicate(副本复制)Import(导入)Export(导出)Select objects by material(选择对象到材质)Apply material to object(s)(应用到物体)Apply material to layer(s)(应用到层)Add new layer(增加新的层)Emissive(发光)Color(颜色)Intensity(强度)1 Transparency(透明度)Reflection(反射)Reflection(反射)Filter(过滤)Highlight Glossiness(高光光泽)1 Reflection Glossiness(反射光泽)1Subdivs(细分)8 Anisotropy(各向异性)0Shader Type(阴影类型):Blinn(材质)▲Rotation(旋转)0Diffuse(漫反射)Color(颜色)Transparency(透明度)Refraction(折射)Refraction(折射)Transparency(透明度)Glossiness(光泽度)1 IOR(折射率)1.55 Subdivs(细分)8Translucency(透明)Translucent(半透明)Fog Color(雾色)Thickness(厚度)1000 Fog Multiplier(雾强度)1Scatter coeff(扩散系数)0 Affect Shadows(影响阴影)Fwd/bck coeff(前向/后向系数)1 Affect Alpha(影响通道)Options(选项)Trace Reflections(追踪反射)Double-Sided(双面)Trace Refractions(追踪折射)Reflect on Backside(内表面反射)Cutoff(终止)0.001 Disable V olume Fog(禁止体积雾)Maps(贴图)Bump(凹凸)Background(背景)Reflection(反射)Displacement(置换)GI(全局光照明)Refraction(折射)Keep continuity(保持连续性)Spotlight(聚光灯)Intensity(强度)On(开)Color(颜色)Multiplier(倍增)1Options(选项)Decay(衰退):Linear(线状的)▲Hardness(坚硬)0.5Sampling(采样)Photon Subdivs(光子细分)500 Caustic Subdivs(腐蚀细分)1000 Shadows(阴影)Enabled(开启)Bias(偏移)0 Radius(半径)0 Subdivs(细分)8Point light(点光源)Intensity(强度)On(开)Color(颜色)Multiplier(倍增)1Options(选项)Decay(衰退):Linear(线状的)▲Sampling(采样)Photon Subdivs(光子细分)500 Caustic Subdivs(腐蚀细分)1000 Shadows(阴影)Enabled(开启)Bias(偏移)0 Radius(半径)0 Subdivs(细分)8Directional light(平行光)Intensity(强度)On(开)Color(颜色)Multiplier(倍增)1Sampling(采样)Photon Subdivs(光子细分)500 Caustic Subdivs(腐蚀细分)1000 Shadows(阴影)Enabled(开启)Bias(偏移)0 Radius(半径)0 Subdivs(细分)8Rectangular light(区域光)Intensity(强度)On(开)Color(颜色)Multiplier(倍增)1Options(选项)Light Portal(光线入口)Invisible(不可见)Double Sided(双面)No Decay(不衰减)Store with Irradiance Map(存储发光贴图)Ignore Light Normals(忽略灯光法向)Sampling(采样)Subdivs(细分)8 Photon Subdivs(光子细分)500 Caustic Subdivs (腐蚀细分)1000Shadows(阴影)Enabled(开启)Bias(偏移)0Linear light(管状光)Color(颜色)On(开)Shadows intensity(阴影厚度)100 Spotlight hardness(聚光灯锐利度)100Displacement(置换)On(开)Advanced controls(高级控制器)Texture(材质)Mapping channel(映射通道)1Displacement(置换)Black point(黑点)0.00 White point(白点)1.00 Ignore creases (忽略皱痕)Subdivision(细分)Subdivide(细分)Contrast(对比度)20% Max steps(最大步幅)4。
performanceindicators
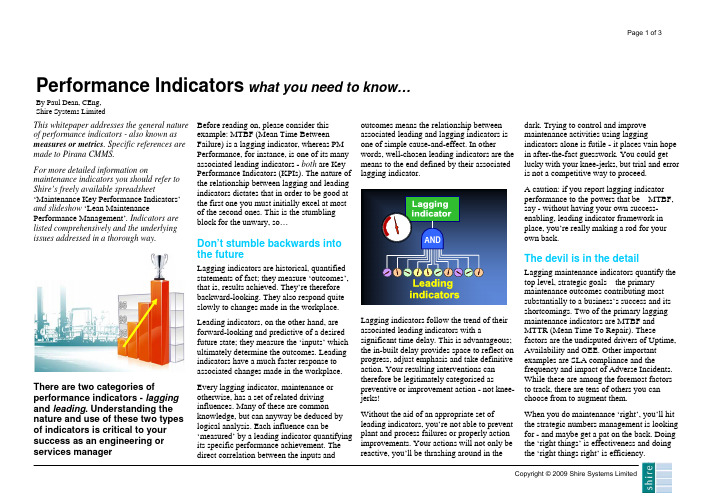
Performance Indicators what you need to know…By Paul Dean, CEng,Shire Systems LimitedThis whitepaper addresses the general nature of performance indicators - also known as measures or metrics. Specific references are made to Pirana CMMS.For more detailed information on maintenance indicators you should refer to Shire’s freely available spreadsheet‘Maintenance Key Performance Indicators’ and slideshow ‘Lean Maintenance Performance Management’. Indicators are listed comprehensively and the underlying issues addressed in a thorough way.There are two categories of performance indicators - lagging and leading. Understanding the nature and use of these two types of indicators is critical to your success as an engineering or services manager Before reading on, please consider thisexample: MTBF (Mean Time BetweenFailure) is a lagging indicator, whereas PMPerformance, for instance, is one of its manyassociated leading indicators - both are KeyPerformance Indicators (KPIs). The nature ofthe relationship between lagging and leadingindicators dictates that in order to be good atthe first one you must initially excel at mostof the second ones. This is the stumblingblock for the unwary, so…Don’t stumble backwards intothe futureLagging indicators are historical, quantifiedstatements of fact; they measure ‘outcomes’,that is, results achieved. They’re thereforebackward-looking. They also respond quiteslowly to changes made in the workplace.Leading indicators, on the other hand, areforward-looking and predictive of a desiredfuture state; they measure the ‘inputs’ whichultimately determine the outcomes. Leadingindicators have a much faster response toassociated changes made in the workplace.Every lagging indicator, maintenance orotherwise, has a set of related drivinginfluences. Many of these are commonknowledge, but can anyway be deduced bylogical analysis. Each influence can be‘measured’ by a leading indicator quantifyingits specific performance achievement. Thedirect correlation between the inputs andoutcomes means the relationship betweenassociated leading and lagging indicators isone of simple cause-and-effect. In otherwords, well-chosen leading indicators are themeans to the end defined by their associatedlagging indicator.Lagging indicators follow the trend of theirassociated leading indicators with asignificant time delay.This is advantageous;the in-built delay provides space to reflect onprogress, adjust emphasis and take definitiveaction. Your resulting interventions cantherefore be legitimately categorised aspreventive or improvement action - not knee-jerks!Without the aid of an appropriate set ofleading indicators, you’re not able to preventplant and process failures or properly actionimprovements. Your actions will not only bereactive, you’ll be thrashing around in thedark. Trying to control and improvemaintenance activities using laggingindicators alone is futile - it places vain hopein after-the-fact guesswork. You could getlucky with your knee-jerks, but trial and erroris not a competitive way to proceed.A caution: if you report lagging indicatorperformance to the powers that be – MTBF,say - without having your own success-enabling, leading indicator framework inplace, you’re really making a rod for yourown back.ANDThe devil is in the detailLagging maintenance indicators quantify thetop level, strategic goals – the primarymaintenance outcomes contributing mostsubstantially to a business’s success and itsshortcomings. Two of the primary laggingmaintenance indicators are MTBF andMTTR (Mean Time To Repair). Thesefactors are the undisputed drivers of Uptime,Availability and OEE. Other importantexamples are SLA compliance and thefrequency and impact of Adverse Incidents.While these are among the foremost factorsto track, there are tens of others you canchoose from to augment them.When you do maintenance ‘right’, you’ll hitthe strategic numbers management is lookingfor - and maybe get a pat on the back. Doingthe ‘right things’ is effectiveness and doingthe ‘right things right’ is efficiency.The problem is that lagging indicators don’t actually measure the multiplicity of things you have to do ‘right’ on the day - and day after day - in order to achieve the strategic results you’re aiming for. The devil is in the detail and, because lagging indicators don’t focus on the detail of what and how on the ground, they’re practically useless for controlling the real-time activities ofmaintenance. To do that, you need leading indicators targeting the prerequisitemaintenance practices that you have to adopt and be good at. Only then can you start to achieve the outcomes management expects and holds you accountable for.Leading indicators are used to identify trends Total focus on the task in hand– they’re not pass-fail monitors. You’ll have good days and bad days, so an improvingbatting average is what you’re aiming forwith each of your selected indicators. Lagging indicators are like the tracksidescoreboard at a motor racing circuit. The scoreboard displays track positions, laptimes, speeds, and so on. It’s good for keeping spectators and commentatorsinformed - and handy for drivers, especially the losers, to reflect on after the race. But that’s it. During a Formula One race, the leader is not looking backwards or sideways at the scoreboard; he’s totally focused on the track ahead and his task in hand, hyper-conscious of the information being fed back from his car’s real-time dashboard array. This presents the leading indicators that directly influence his race performance.The car’s dashboard array alerts of any developing problem – with oil pressure, water temperature, etc. In an F1 car, the dashboard also feeds back up-to-the-minute information on driver performance compared with the previous lap on successive sectors of the track. And, there are blinking red-green-blue gear-shift advice lights which enable the driver to time his actions to perfection. Real-time detail is what’s important for driver success.Formula One team philosophy in respect of the dashboard display is: ‘all the information the driver needs and nothing more’. So, there’s no speedo. To realise the potential of the car and win the race, the driver has toconstantly push his speed to the limit. All things being equal, the driver’s competence,confidence and commitment determine the speed; a speedo is an unnecessary distraction in the car.There are parallels to draw in maintenance for the engineering and service manager. To realise the innate potential of the equipment and facilities in your care, and of your crew, you must be hands-on, fully engaged and precisely informed. You need clear forwardvisibility and an array of in-the-face, up-to-the-minute information to guide you. You need real time detail. Pirana provides you with these essentials in a superbly interactive way.Pirana allows the monitoring of two sets of indicators: a leading set on the Dashboard and a lagging set on the Scoreboard. You can focus on the Dashboard while keeping an eye on - but not distracted by - the Scoreboard. The first will tell you how you’re doing and the second will tell you, and inevitably your boss and others, how you’ve done.Align maintenance with business needsYour boss and your customers haveperformance needs and expectations; these can be sometimes fuzzy. It’s logical that concrete goals should be established. The way to do this is to select the headline lagging maintenance indicators that best apply to current aspirations and circumstances. In manufacturing,Availability and other OEE influences will figure, along with their drivers: MTBF and MTTR. In services, contractual SLA measures will be king.Performance targets must be agreed for each selected lagging indicator. Afterwards, the ball is in the engineering or servicemanager’s court. You must get down to the job of delivering the required performance. To do that, you have to choose andimplement your own leading indicators – the means of performance delivery.Total system overviewMaintenance management in any sector is a complex business process with manydiscrete, yet closely interrelated, activities. To have any chance of satisfying your lagging indicator targets, you need a total system overview.Your leading performance indicators must therefore target vital aspects across-the-board. Chosen indicators should provide information on crucial aspects of your maintenance system’s health and performance, warning of a particulardeveloping condition before it becomes a real problem, alerting you to new events, andprompting you to necessary action.And, leading indicators should be monitored in aggregate – just like the set of instrumentsand annunciators on a car’s dashboard.So, configure your leading indicatorDashboard to display everything you need to keep your eyes on and monitor repeatedly, if not constantly, for you to be able perform confidently and effectively to achieve your strategic targets. All the information you need and nothing more, that is; workstatistics should certainly be displayed. Give careful consideration to choosing the ‘critical few’ parameters - five to ten - that best suit your immediate needs. Refer to Shire’s guidance: Maintenance Key Performance Indicators.Choosing the best indicators requires careful thought, but it’s not an arduous task; given your business goals, the immediate imperatives and prevailing circumstances – and a bit of engineering common sense - the decisions will be more or less obvious. Best practice makes perfect Each leading maintenance indicator is always associated with a maintenance best practice; the connection between the two is simple and clear cut. A leading indicator is a numerical expression of its associated best practice and provides a practical means of deploying and monitoring the best practice’s implementation in the workplace. A lagging indicator, with its many associated leading indicators, obviously depends on an equivalent number of maintenance best practices. A lagging indicator is innately complex and, to reiterate, it cannot be controlled except by divide and rule.Look around for straightforward examples of best practice you can and should be using – this high value activity is known as‘benchmarking’. As stated, Shire provides free, comprehensive guidance in other publications. You can also root out maintenance indicators and benchmark best practices from sources like: BSI 15341:2007, SMRP (The Society for Maintenance & Reliability Professionals – ), a sister organisation or a supply chain partner. Good provenance adds weight when youneed to convince others in your organisation.You may also spot something valuable onyour travels, or in the media – and it could befrom a totally different sector.In the days before KPIs came on the scene,an organisation’s maintenance performancewas judged by noting the presence or absenceof known best practices. Nothing has reallychanged except that, with the use ofcomputers, we’re getting much smarter atmeasuring and putting a number on theresults. It’s become very easy to makeobjective comparisons between operatingunits and track incremental improvements intheir individual performance.To reaffirm, don’t focus on more than ahandful or two of benchmark best practices atany one time. The management time andattention their implementation will inevitablyconsume is considerable. Your Dashboardmust balance the inherent complexity ofmaintenance management against your owntime-bound capacity to assess, plan andcoordinate activities. The Working TimeDirective has its good points!Maintenance performance is ultimatelydetermined by the practices in use and,critically, the behaviour of those individualsapplying them; these are the realdeterminants of maintenance success. Yourmain concentration and effort shouldtherefore be on bedding-in your chosen bestpractices in the workplace, educating andguiding members of your crew and othercontributors to ensure the necessary winningbehaviours. Being able to see the results oftheir input efforts directly reflected inimproving indicator values will drive theircommitment and enthusiasm.Leading indicators measure and express inquantified terms what’s happening on theground – they keep a tally. They tell you ifyou’re getting better or worse - and they helpyou decide what’s working, what’s not andwhat, who and where to push to get your nextincremental win.One big proviso – it’s no use measuring ifyou don’t take action. It’s a total waste oftime. The only purpose of measurement is totrigger and guide appropriate action.Performance management demands that youhave a bias for action – so it’s essential thatyou never duck out of taking promptcontrolling action in response to yourmeasures.Sustaining your gainsYou may gain, but can never sustain,competitive maintenance and businessperformance without achieving theprerequisite level of competency in eachcontributory best practice. Competency hasto become embedded within yourorganisation; ingrained discipline is whatyou’re looking for. Going back to the cardriving example: even with a fullyinformative dashboard, some individuals stillrun out of fuel and even blow up theirengines! Success is not assured without thenecessary attentive, disciplined behaviour.That takes good leadership to achieve.Let’s go!The drivers of maintenance managementsuccess are generally well-known:maximisation of planned work, preventivemaintenance, schedule compliance, failureanalysis, ready availability of spare parts,operator maintenance, etc, etc – savvyindividuals in the workplace can reel themoff – and yet they’re too often ignored. Betteruptime, equipment reliability, processcapability, costs, safety, profit and your ownsuccess as an engineering or servicesmanager all depend on them. So, with a biasfor action, make a start; set the targets andconfigure your Dashboard. Let’s go!Pirana CMMS is your essential partner on theroad to maintenance success. It will makeyour journey so much easier, less stressfuland more successful. JIf you’re wondering, it’s a Cobra dashboardWe’re always on hand to give free, no-obligation advice to CMMS enquirers –including on maintenance strategy andbest practices.Call us today+44 (0) 23 8022 4111Be a winner with Shire!。
PerformancePresentation
150,000,000
High data rate with low CPU overhead
0
CCPPUUUUttiilliizzaattiioonn<< 22%%
Copyright Lane15 SoftwareTM 2001-2002 all rights reserved
150,000,000
Roland Scherzinger / Thomas Dippon
Performance Analysis of InfiniBand™ Switches - A Case Study -
Overview
• The performance parameters of switches are key to overall performance of fabric topologies such as InfiniBand™ Architecture
Demonstration z VIPL-based data pump z High-speed data transfers z Low protocol overhead z OS bypass technology z Yield high data rates z Minimal CPU overhead
150,000,000 bytes per second
with < 2% CPU Utilization!
Lane15 Application Enabler™
Lane15 Fabric Manager™
Copyright Lane15 SoftwareTM 2001-2002 all rights reserved
3
The Leader in InfiniBandTM Management Software IBSC Performance Presentation Brad Benton Technical Relationship Manager
油藏近井耦合确定的射孔方位与油田开发的关系

文章编号:1000 − 7393(2023)06 − 0729 − 09 DOI: 10.13639/j.odpt.202311052油藏近井耦合确定的射孔方位与油田开发的关系潘豪1,2 曹砚锋1,2 文敏1,2 侯泽宁1,2 马楠1,2 齐致远1,21. 海洋油气高效开发全国重点实验室;2. 中海油研究总院有限责任公司引用格式:潘豪,曹砚锋,文敏,侯泽宁,马楠,齐致远. 油藏近井耦合确定的射孔方位与油田开发的关系[J ]. 石油钻采工艺,2023,45(6):729-737.摘要:为了在油藏数值模拟中实现水平井不同射孔方位的精确模拟,并提高油藏数值模拟在井筒处及近井区域的模拟精度,探究水平井各种射孔方位对油藏开发的影响,利用角点网格、分层非结构化网格以及三维径向网格等3种网格建立了油藏-近井-井筒精细耦合模型,实现了近井的径向渗流和射孔方位的空间分布的精细描述。
利用该耦合模型研究了2种不同井径条件下的顶部、中部、底部和全部射孔4种射孔方位对油藏开发的影响。
模拟结果表明,顶部射孔的波及范围最大,井底压力最低,累产油量最高,生产效果最佳;中部和全部射孔的生产效果相近,其波及范围和累产油量等在4种射孔方位里为中等,但井底压力较高;底部射孔的波及范围最小,井底压力较低,累产油量最低,生产效果最差。
因此,水平井的射孔方位选择优先考虑顶部射孔,但因顶部射孔的井底压力较低,若有可能造成脱气则考虑中部或全部射孔,不建议选择底部射孔。
关键词:射孔方位;水平井;多重耦合;底水油藏中图分类号:TE329;TE257 文献标识码: AThe relationship between perforation orientation determined by near well coupling inoil reservoirs and oilfield developmentPAN Hao 1,2, CAO Yanfeng 1,2, WEN Min 1,2, HOU Zening 1,2, MA Nan 1,2, QI Zhiyuan 1,21. National Key Laboratory for Efficient Development of Offshore Oil and Gas , Beijing 100028, China ;2. CNOOC Research Institute Co., Ltd., Beijing 100028, ChinaCitation: PAN Hao, CAO Yanfeng, WEN Min, HOU Zening, MA Nan, QI Zhiyuan. The relationship between perforation orientation determined by near well coupling in oil reservoirs and oilfield development [J ]. Oil Drilling & Production Technology,2023, 45(6): 729-737.Abstract: In order to achieve accurate simulation of different perforation orientations during reservoir numerical simulation for horizontal wells, and to improve the simulation accuracy in the well and near-well regions, as well as to investigate the influence of various perforation orientations in horizontal wells on reservoir development, a detailed reservoir-near well-well coupling model was established using three types of grids: corner-point grids, layered unstructured grids and three-dimensional radial grids. This model enables a detailed description of radial flow near the well and the spatial distribution of perforation orientations. By using this model,the influences of four perforating patterns, including top, middle, bottom and all perforations, on reservoir development under two different well diameter conditions were studied. The simulation results show that the top perforation pattern covers the largest affected area, with the lowest bottomhole pressure, the highest cumulative oil production and the best production behavior. The middle and all perforation patterns show similar production behavior, with moderate affected areas and cumulative oil production among the four基金项目: 中国海洋石油有限公司科研项目“海上油藏精细控水完井关键技术研究”(编号:KJZH-2023-2302)。
GlancePlus Pak 2000 系统性能监控与诊断工具说明书

GlancePlus Pak 2000 integrates:GlancePlus – a powerful system performance monitoring and diagnostic tool. Easy to learn and use, GlancePlus provides immediate performance information about your system.It lets you easily examine system activities,identify and resolve performance bottlenecks,and tune your system for more efficient operation. With GlancePlus your users are more productive and your business applications run more smoothly.HP OpenView VantagePoint Performance Agent -- keeps a history of your system’s performance and sends alarms of impending performance problems. Using VantagePoint Performance Agent, you can pinpoint trends in system activities. This allows you to balance workloads and accurately plan for future system growth. VantagePoint Performance Agent also allows you tointegrate your system into an HP OpenView VantagePoint Operations or HP OpenView VantagePoint Performance Manager-based framework for centrally managing your distributed environment.Single-system Event and AvailabilityManagement (**1) — provides you, out-of-the-box, the ability to detect key events thatimpact the performance and availability of your system, and get notification when these events occur. In addition it can automatically suggest or invoke actions when these events are detected.Furthermore, you can easily monitor the status and proper functioning of the component products GlancePlus and VantagePoint Performance Agent. You can start and stop these components as well as easily configure VantagePoint Performance Agent.GlancePlus Features :•Hierarchy of performance information,that allows you to view quick summaries of overview data and drill down to diagnostic detail. (System-level,application-level, and process-level data provide different views of a system’s performance.)•Rules-based diagnostics that usescustomizable system performance rules to identify system performance problems and bottlenecks.•Alarms that are triggered when customizable system performancew G l a n c e P l u s a n dP a k 2000GlancePlus Pak 2000 provides you with a single product for managing a system’s availability and performance. As an integrated product, it offers everything the previous GlancePlus Pak offered and adds single-system event and availability management **1.With GlancePlus Pak 2000, you get the real-time diagnostic and monitoring capabilities of GlancePlus and the historical data collection capabilities of HP OpenView VantagePointPerformance Agent software. In addition, GlancePlus Pak 2000 monitors your system for key events that could impact performance. When such events are detected, you are notified and can respond by accepting the suggested or automatically invoked actions you receive through GlancePlus Pak 2000.With GlancePlus Pak 2000, you can handle a wide range of system performance and availability problems so that you can efficiently get the best availability and performance from your system and the applications running on it.thresholds are exceeded. (Thesealarms generate on-screennotifications, and can executecommands or scripts for automatedactions.)• A Motif-based interface that is easy to learn and use. A character modeinterface is also included, allowingyou to use GlancePlus on non-X-Window displays.•Online Help that provides anoutstanding online User’s Guide —complete with a guided tour of theproduct, context-sensitive help, andflexible search capabilities.•Dynamic system performance graphs and alarms displayed fromGlancePlus while it runs as an icon.•Graphical displays of performance data that provide a quick view of asystem’s performance, bottlenecks,and usage of CPU, memory, disk, andLAN resources.•System table resource information that provides status of importantconfigurable system parameters suchas process tables, buffer cache, bufferheaders, and shared memory.•Network performance information, such as Network File System (NFS)and local area network (LAN)metrics.•Graphs that can show short-term history cumulative totals and runningaverages of performance metrics.• A customizable interface that gives you extensive choices for filteringprocess information, setting updateintervals and selecting fonts andcolors. These features make it easy toconfigure GlancePlus to your work-style and preferences.•The ability to display and alarm on Application Response Measurement(ARM) data such as transactionaverage response time, distribution oftransaction response times, servicelevel objective value, and number oftimes it has been exceeded. Theability to display groups oftransactions, to drill down to a singletransaction, and display resourceconsumption by the transactions.•The ability to monitor and graphicallydisplay resource usage of resourceallocation groups set up by HPProcess Resource Management (HPPRM) software running on HP 9000systems.Benefits:•Efficiently keep business applicationsrunning smoothly.•Save time and effort managing yoursystem resources.•Better understand your computingenvironment.Efficiently Keep Business ApplicationsRunning SmoothlyGlancePlus software allows you to identifyand solve performance problems quickly.If you suspect a problem, you can examinehow different software programs and usersare using system resources. You can viewdetailed information on individualprocesses, including CPU and memory useand time spent waiting for different systemresources. You can group users andprocesses into “applications,” then usethese groupings to efficiently determinetheir impact on system resources. With thisinformation, you can quickly get a pictureof how your system’s major resources arebeing used and who is using them.On-screen alarms notify you of developingproblems when customizable systemperformance thresholds are exceeded. Thisallows you to address problems beforethey impact users and business processes.In addition, GlancePlus’s rules-basedadviser uses its customizable systemperformance rules to help you quicklyidentify system performance problems andbottlenecks.GlancePlus provides you information thatenables you to identify and resolveproblems quickly, and to choosealternative system and kernelconfigurations or processing priorities.Save Time and Effort Managing YourSystem ResourcesGlancePlus's Motif-based interface is easyto learn and use. In addition, the Helpfacility gives you a quick start in using theproduct and interpreting performance datawithout having to search through volumesof manuals. GlancePlus’ extensiveconfigurability allows you to tailor it tobest suit your needs and work style. Youcan set filters based on thresholds on anyof the displayed performance metrics (suchas CPU utilization, and disk input/output(I/O) rate). This allows you to see only themost active processes. You can definecolor highlighting on process data thatexceeds user-defined thresholds. Thishelps you to quickly identify processes orusers that are having the greatest impact onyour system’s performance.You can run GlancePlus as an icon andhave alarms and dynamic systemperformance graphs displayed within theicon, allowing you to efficiently keep aneye on your system’s performance whileattending to other tasks.Better Understand Your ComputingEnvironmentUsing GlancePlus, you are more aware ofhow your systems and software programsinteract. By using its ability to grouprelated programs and users into“applications,” you can efficiently assessand track system resource usage by relatedprocesses or users.The CPU, disk, and memory detail screensgive you a detailed view of systemactivity. You can view disk I/O rates and queue lengths by disk device, file system, or by logical volume, to determine whether your disks are in balance. You can also see how much disk activity is due to virtual memory I/O and swapping. By using GlancePlus’ displays of short-term history and averages, you get a view of your system’s performance that extends beyond the last interval.GlancePlus software helps you monitor your LAN, enabling you to identify networking problems that are affecting the performance of your systems’ and applications.GlancePlus’ graphs give you the information you need to quickly assess how your system is performing. Whether you manage multi-user systems or a network of workstations, GlancePlus enables you to more efficiently understand and manage your computing environments.VantagePoint Performance Agent[Refer to VantagePoint Performance product brief for more details]VantagePoint Performance Agent gives you the data you need to effectively analyze, understand, and make informed decisions about your computing environment. It collects comprehensive information on system activity and is available on different computer system platforms.Using its Data Source Integration technology (DSI), VantagePoint Performance Agent can gather data from other IT resources such as applications, databases, and networks. VantagePoint Performance Agent then summarizes, time stamps, logs, and alarms on all the collected data for total resource and performance management.VantagePoint Performance Agent providesdata and alarms to HP OpenViewVantagePoint Performance Manager foranalysis and can forward alarms to the HPOpenView Network Node Manager andHP OpenView VantagePoint Operations.As part of GlancePlus Pak 2000,VantagePoint Performance Agent will out-of-the-box forward messages to the EventManagement facility of GlancePlus Pak2000. ( **1) VantagePoint PerformanceAgent data can also be exported to avariety of third-party products for capacityplanning, statistical analysis, and resourceand performance management. Thisflexibility ensures that VantagePointPerformance Agent easily integrates intoyour management strategy.Single system event andavailability management[**1]Features:•Out-of-the-box monitoring of keyevents and processes that canimpact the performance of yoursystem and the applicationsrunning on it.•Key event and process monitoringon the system that includesnotifying users when these eventsare detected.•Message browser for receivingand displaying messages on eventsthat have been identified,including VantagePointPerformance Agent alarmmessages.•Automatic and operator-initiatedactions that allow a quick responseto identified events•Facility to start GlancePlus fromthe Java-GUI to diagnoseproblems on the system.•Facility to start VantagePointPerformance Manager, if installedon that system, to use the loggedVantagePoint Performance Agentdata for longer term performanceand resource analysis and problemresolution•Display that allows configuringand managing the componentparts of GlancePlus Pak through aJava GUI•Ability to configure and customizeconditions that define themonitored events.•Ability to customize actionsinvoked when particular eventsare detected.•One interface for monitoring andmanaging the component parts ofthe GlancePlus Pak 2000 productsuch as VantagePoint PerformanceAgent. With this interface, youcan configure, start, and stopVantagePoint Performance Agent.•Online Help to quickly getanswers to questions on how touse the product.Benefits:•Proactive monitoring, problemdetection and corrective actions.•Easy-to-install, out-of-the-box, eventand availability management.•Customizable/adaptable to your eventand availability management needs.•Monitoring and maintaining theavailability of component parts ofGlancePlus Pak such as VantagePointPerformance Agent.Ordering InformationOne license to use for GlancePlus and GlancePlus Pak 2000 covers the right to manage one system. In addition to the license-to-use, the corresponding media and manual product must be purchased.HP GlancePlus Pak 2000HP OpenView GlancePlus Pak 2000 for HP 9000 Servers, Sun SPARC, IBM RS/6000, and NCR WorldMark systemsLicense-to-use (LTU) product numbersB6131AA LTU on a Tier 1 * – HP 9000 Server, Sun SPARC, IBM RS/6000 or NCR WorldMark systemB6132AA LTU on a Tier 2 * – HP 9000 Server, Sun SPARC, IBM RS/6000 or NCR WorldMark systemB6133AA LTU on a Tier 3 * – HP 9000 Server, Sun SPARC, IBM RS/6000 or NCR WorldMark systemMedia product numbersB3701AA Media/manual product for GlancePlus Pak 2000 on HP 9000 ServersB3703AA Media/manual product for GlancePlus Pak 2000 on Sun SPARC systemsB3705AA Media/manual product for GlancePlus Pak 2000 on IBM RS/6000 systemsB5023AA Media/manual product for GlancePlus Pak 2000 on NCR WorldMark systemsHP OpenView GlancePlus Pak 2000 for Siemens/Nixdorf systemsB6112AA License-to-use GlancePlus Pak on Siemens/Nixdorf systemsB6113AA Media and manual for GlancePlus Pak on Siemens/Nixdorf systems HP OpenView GlancePlus Pak 2000 forHP 9000 WorkstationsB6130AA License-to-use GlancePlus Pak2000 on HP 9000 WorkstationsB3699AA Media and manual forGlancePlus Pak 2000 on HP 9000WorkstationsHP OpenView GlancePlusHP OpenView GlancePlus for HP 9000Servers, Sun SPARC, IBM RS/6000 andNCR WorldMark systemsLicense-to-use (LTU) product numbersB6121AA LTU on a Tier 1 * – HP 9000Server, Sun SPARC, IBM RS/6000 orNCR WorldMark systemB6122AA LTU on a Tier 2 * – HP 9000Server, Sun SPARC, IBM RS/6000 orNCR WorldMark systemB6123AA LTU on a Tier 3 * – HP 9000Server, Sun SPARC, IBM RS/6000 orNCR WorldMark systemMedia product numbersB3693AA Media product for GlancePluson HP 9000 ServersB3695AA Media product for GlancePluson Sun SPARC systemsB3697AA Media product for GlancePluson IBM RS/6000 systemsB5021AA Media product for GlancePluson NCR WorldMark systemsHP OpenView GlancePlus forSiemens/Nixdorf systemsB6112AA License-to-use GlancePlus onSiemens/Nixdorf systemsB6113AA Media and manual forGlancePlus on Siemens/Nixdorf systemsHP OpenView GlancePlus for HP 9000WorkstationsB6120AA License-to-use GlancePlus onHP 9000 WorkstationsB3691AA Media and manual forGlancePlus on HP 9000 WorkstationsTo order OpenView GlancePlus or HPOpenView GlancePlus Pak 2000 you mustorder the respective License-to-use productnumber and the media and manual productnumber.HP OpenView GlancePlus1. Identify System Performance BottlenecksUse the GlancePlus rules-based adviser to interpret performance data and identify bottlenecks. A customizable set of default rules handles a variety of system conditions.2. Configure/Customize Graphical DisplaysSelect from extensive choices for display options, colors, and fonts. Define the data sample intervals and durations for the graphs.3. Monitor with Threshold-based AlarmsProactively manage your computer system by using alarms. Use the default alarm thresholds or define your own to meet the particular needs of your environment.4. Get Quick Answers to Your Questions Using the Online Help FacilityUse the guided tour to learn about how GlancePlus is used. Use the on-item help to quickly get answers to your questions on specific items on the GlancePlus screen report.5. Track CPU, Memory, Disk, and Network ResourcesGraphical and tabular onscreen color reports show your system's performance and resource utilization in real time. GlancePlus software can also display a short-term history of these measurements.6. View the Level of Metrics That Gives You the Detail You Need Metrics are displayed at the global, application, or process level.7. Create Customized Tabular Data Displays Define the order of the data columns and sort criteria.Define filters to see only the processes that are of interest to you and color-highlight those that meet conditions that you define. Select the metrics you want to display.8. Monitor System Performance While Tending to Other TasksRun GlancePlus as an icon and use the dynamic graphs displayed in the icon to keep an eye on the performance of yoursystems63467216Resource and Performance MatrixTable 1:Summary of Featured Information for HP OpenView GlancePlusGlobal InformationCPU Percent of CPU utilized by system, and user activityCPU detail CPU utilization both globally and per processor on multiprocessor systemsCPU utilization by user processes broken out by standard-run prioritiesCPU run queue lengths, system call counts, and activity rates of interrupts and context switchesInput/output (I/O)Disk I/O rate by file system, virtual memory, and raw activityI/O detail Physical reads and writes per disk and file systemDisk utilization and physical I/Os broken out by user, virtual memory, and raw categoriesQueue lengths of each disk deviceFile system capacity, and file system space utilizationLogical volume detail Read and writes, counts, and bytes per logical volumeMemory Paging rates: pages in and pages outMemory Detail Percent of available physical memory utilized by system and user processesPhysical, available, and free memoryPage faults, page I/Os, swap I/Os, virtual memory reads and writes, and cache sizeNetwork Packets in, packets out, collisions, and errorsNetwork detail Packets in, packets out, and collisions and errors for each LAN deviceSwap Percent of enabled swap space that has been reserved and is activeSwap detail Swap space available and used, and percent utilization by device and file systemSystem tables Amount of system table resources available and used, including nbuf, nproc, nfile, and shmemSystem attributes System CPU type, OS release, configuration information including number of CPUs, disks, LAN cards, Logical Volume Manager volume groups, and physical memoryNFS detail NFS reads and writes byte rates and response time, both inbound and outbound, for all clients or servers that are communicating with the hostNFS in and out operation counts for the nodeApplication InformationApplication summary CPU, I/O, and virtual memory utilization by applicationNumber of processes, number of active processes, and major faults per applicationApplication detail CPU utilization per application broken down by user CPU and system CPUTabular report of short-term history of CPU, I/O, and Virtual Memory utilization by applicationProcess InformationProcess summary For all processes: process and parent process identification numbers, run priority, user name, CPU utilization, disk I/O rate, resident set size, and resource the process is waiting onProcess detail For each process: detailed information on CPU, disk, memory utilization, and open filesTable 2: Featured VantagePoint Performance Agent InformationData Type Metric TypeGlobal Record identification, summary, CPU, disk, networking, memory use, process queue depths (load factors), user/process, and terminal transactionApplication Record identification, application identification, summary, process count, terminal transaction, average process wait state, CPU, disk, memoryProcess Record identification, process identification, summary, CPU, disk, memory, terminal transaction, average process wait state, and overall process lifetimeTransaction Tracker Transaction name, count, average response time, distribution of response time metrics, and aborted transactionsHardware and Software Requirements• 32 MB RAM and 64 MB virtual memory minimum.• A system with a 100 MHz or faster processor is recommended for running the GlancePlus Pak 2000 event-management Java user interface.• Disk space used: about 13 MB for GlancePlus, 28 MB for the VantagePoint Performance Agent, and 27 MB is needed for the Event Management portion of GlancePlus Pak 2000. An additional 60 MB is suggested for the VantagePoint Performance Agent data files though it is configurable depending on how much data you want to collect and store.• HP-UX 10.20 with X-Windows libraries X11R5 and Motif libraries 1.2, or HP-UX 11.0 with X-Windows libraries X11R5 or X11R6 and Motif libraries 2.1• Netscape 4.0 (or later) browser for viewing the GlancePlus Pak Event Management online Help files that is available through the Java Event Management interface (HTML format).• A color graphics monitor with a minimum of 1280 x 1024 resolution required, and 8 color planes recommended.For HP 9000 Servers and HP 9000 Workstations• HP-UX 10.20, and 11.0For Sun SPARC systems• Sun Solaris 2.5 and 2.6 Operating System releasesFor IBM RS/6000 systems• IBM AIX 4.1, 4.2, 4.3, 4.3.1 and 4.3.2 Operating System releasesFor NCR WorldMark systems• MP-RAS 3.02 Operating System releasesFor Siemens Nixdorf RM systems• SNI Reliant Unix 5.43For More InformationFor more information about HP OpenView, please call your local HP reseller or local HP sales office.Australia/New Zealand+613 9272 2895EuropeE-Mail:*******************Hong Kong+852 2599 7051Japan+813 3331 6111USA and Canada+1 800 637 7740Visit the HP OpenView Web site:Technical information in this document is subject to change without notice.Copyright © 1999 Hewlett-Packard CompanyPrinted in USA 2/00Part Number 5968-5607E。
哈格-斯坦(Haag-Streit)泡沫磨削计算器指南(Hill-RBF计算器)说明书

Hill-RBF Calculator Instructions for UseVersion: V3.0Issuing Date: September 2020HS-Doc. no. 1500.7020037.02030 / 2020 – 09PrefaceThank you for choosing the Hill-RBF Calculator for IOL power selection prior to cataract surgery. Provided you carefully follow these instructions for use, the use of the calculator should be reliable and trouble-free.WARNING!Please read the instruction manual carefully before using this calculator. It contains importantsafety information for both the patient and the surgeon.IntroductionThe Hill-RBF Calculator is an advanced, self-validating method for IOL power selection employing pattern recognition and a sophisticated form of data interpolation. It has been optimized for use with biometry data from the Haag-Streit LENSTAR LS 900 optical biometer in combination with the Alcon SN60WF biconvex IOL for powers from +6.00 D to +30.00 D and IOL powers up to +35.00 D based on a similar biconvex IOL design. For IOL powers from +5.00 D to -5.00 D, it performs best with this combination of biometry device and the Alcon MA60MA extended range IOL.The Hill-RBF on-line calculator may also be used with data from other optical biometers, which provide clinically equivalent biometry data as compared to the LENSTAR LS 900. It may also be used with other biconvex IOL models in the power range of +6.00 D to +35.00 D and other meniscus design IOL models in the power range of +5.00 D to -5.00 D. Intended purposeIntended useThe Hill-RBF Calculator is designed to assist the user in selecting the appropriate IOL power for cataract surgery when optical biometry is used to calculate the power of a biconvex intraocular lens (IOL) from +6.00 D to +35.00 D IOL power and for a meniscus design IOL from +5.00 D to -5.00 D IOL power.IndicationReplacement of the natural crystalline lens; e.g.: aphakia or cataract.ContraindicationsSince this is a software product, there are no contraindications.Patient populationAll patients who are eligible for implantation of biconvex or meniscus design IOL.Intended usersThis software product is intended to be used by ophthalmic surgeons.Clinical benefitThe Hill-RBF Calculator employs the Hill-RBF algorithm for the selection of appropriate power for biconvex intraocular lenses. The correct lens selection is essential for optimal post-operative visual acuity after IOL implantation.ReportingAdverse events that suggest that an erroneous IOL power calculation may have caused an adverse event must be reported to your Haag-Streit representative and to the local competent authority.SafetyWARNING!These signs must be strictly adhered to, to ensure safe operation of the instrument and to avoidendangering users and patients.Patient populationThe Hill-RBF Calculator is an advanced, self-validating method for IOL power selection employing pattern recognition and a sophisticated form of data interpolation. This method of IOL power selection performs well for short, normal and long eyes. Based in artificial intelligence, this methodology is data driven and free of calculation bias. This approach also employs multiple validating boundary models, indicating to the user when it is performing within a defined area of accuracy.IOL models and biometry devices supportedThe Hill-RBF Calculator is meant to serve as an adjunct tool to assist physicians in selecting the appropriate IOL power for a particular patient. It is intended to be used in conjunction with a comprehensive ophthalmic examination and the appropriate diagnostic tests and measurements necessary for cataract surgery candidates. It was developed based on LENSTAR LS 900 biometry data in combination with the Alcon SN60WF for IOL powers ranging from +6.00 D to +30.00 D and IOL powers from +30.50 D to +35.00 D based on a similar biconvex IOL design. Because patients requiring IOL powers in excess of +30.00 D are relatively uncommon, there may be more out-of-bounds indications for this expanded power range. For IOL powers from +5.00 D to -5.00 D, the prototype IOL is the extended range Alcon MA60MA. The Hill-RBF method performs best when using the Haag-Streit Lenstar LS900 biometer and these two IOL models. The Hill-RBF method may also be used with other biconvex and meniscus design IOL models within the power range of +35.00to -5.00 D. The switch in lens-design from a biconvex to meniscus design is at + 5.00 D. Calculations from +5.00 D to -5.00 D are based on a meniscus lens design, calculations from +6.00D to +35.00D are based on a biconvex lens design.WARNING!Using other data sources or IOL models other than the SN60WF and MA60MA, may reduce theoverall performance of the calculator. The Hill-RBF Calculator can only be used with biconvex IOLdesigns for IOL powers from +6.00 D to +35.00 D and meniscus IOL designs for IOL powers from+5.00 D to -5.00 D. For example, anterior chamber IOLs are often based on a convex-plano designand are therefore not suitable to be used in combination with the current release of the Hill-RBFCalculator.DisclaimerThe results obtained by the Hill-RBF Calculator are not intended to serve as medical or surgical instruction or be definitive; nor can it be guaranteed that the results will be accurate for every case. Physicians who use the calculator must arrive at their own independent determinations regarding the proper treatment of their patients and are solely responsible for the final post-operative refractive outcome. By using the Hill-RBF Calculator, the user agrees to waive all claims against and hold Warren E. Hill and Haag-Streit AG harmless from any claims arising out of your use of this tool.Data safetyThe use of this Calculator may involve the entry of certain confidential patient data, which may be deemed “protected health information” (“PHI”) under the Health Insura nce Portability and Accountability Act of 1996 and Standards for Privacy of Individually Identifiable Health Information, 45 CFR Parts 160 & 164 (“HIPAA”) as amended, or supplemented by additional legislation or regulations from time to time. All information during transfer of the data from the original computer and the server is encrypted. The data provided is stored for the purpose of improving the performance of the Calculator and for ongoing research. All PHI data is encrypted using technology customary to the industry. Haag-Streit, as the provider of the Hill-RBF Calculator service, uses reasonable efforts to avoid unauthorized disclosure of data. Supported web browsersThe Hill-RBF Calculator was tested on the following web browsers:Edge (Microsoft) V. 44.18362.449.0Firefox (Mozilla) V. 76.0.1 (Macintosh) V. 79.0 (Windows)Chrome (Google) V. 81.0.4044.138 (Macintosh) V 84.0.4147.105 (Windows)Safari (Apple) V. 13.1IntroductionUser interfaceOperationThis chapter describes the use of the Hill-RBF Calculator step by step.Patient data entryAs a first step, patient data must be entered. This area allows the user to identify the patient for which the calculation is to be carried out.The fields for the patient ID number and patient’s name (family name) are mandatory entries. The patient’s first name is an optional entry. The patient’s birthdate must be in the following format: DD.MM.YYY. Clicking on the calendar icon next to the date of birth field opens a calendar tool that allows for the easy section of the correct date of birth.Surgeon date entryWith the current release, all fields in the surgeon data entry section are optional entries.Data entered in the surgeon entry section will be visible on the printout and this area allows for easy identification of the surgeon.chamber depth (ACD), flat - (K1) and steep keratometry value (K2) and their corresponding meridians in degrees. The WTW, LT, CCT and patient gender are optional. This additional information, however, will enhance the calculation accuracy.Input field for the IOL data. The Hill-RBF Calculator was developed based on optical biometry data using the LENSTAR LS900 and surgical outcome data following the implantation a biconvex aspheric IOL (Alcon SN60WF) for IOL powers of +6.00D to +35.00D and a meniscus aspheric IOL (Alcon MA60MA) for IOL powers of +5.00 D to -5.00 D. The calculator performs best when theses particular IOLs are used. The calculator may also be used with other IOL models from any manufacturer with equivalent lens design at a certain IOL powers.The result field displays the proposed power of the IOL and the anticipated spherical equivalent for the refractive outcome. Version number of the Hill-RBF Calculator currently in use.Patient data entry fields. Mandatory fields are the patient identification number (ID), the family name (Name) and the birthdate in therequired format.Surgeon data entry fields. Select the target refraction for the right (OD) and the left (OS) eye.In the current release of the Hill-RBFCalculator, target refraction valuesfrom +1.00 D to -2.50 D are mostlysupported, depending on the pre-operative measurements.Clicking on the …?“ opens the on-linehelp file.Clicking on the printer icon generates aPDF file of the current calculation. The printout is displayed in a separate tab ofthe browser. Therefore pop-ups have to beenabled in the browser settings to allow thedisplay of the PDF report. Input fields for biometry data Mandatory fields are the device name selection, axial length (AL), anteriorIn a future release, this data will be used to remind the user to provide stable post-operative refraction data for a respective patient. This information is anonymized and will be used as part of an ongoing process to improve the performance of the Hill-RBF Calculator. Biometry data entryEntering biometry data is divided into two steps. First, the user selects the biometry device used to acquire the measurement data. Afterwards, the following biometry values are entered: Axial length (AL), anterior chamber depth (ACD) and keratometry flat (K1) and steep (K2) keratometry values and their corresponding meridians in degrees. All other fields are optional with the current release.Even though only the above-mentioned fields are necessary to calculate IOL power with the current release of the Hill-RBF Calculator, it is recommended that all data available beentered to allow for improved accuracy of the calculation.WARNING!The Hill-RBF Calculator was developed based on LENSTAR LS 900 biometry data in combinationwith the Alcon SN60WF for IOL powers from +6.00 D to +30.00 D IOL powers and up to +35.00 Dbased on a similar biconvex IOL design. For IOL powers from +5.00 D to -5.00 D, it performs bestwith the Alcon MA60MA extended range biconvex IOL.Using other types of biometry, or IOL models, may reduce the overall performance of thecalculator. With the current release, the calculator accepts input data from the following opticalbiometers: HAAG-STREIT LENSTAR LS 900, HAAG-STREIT EYESTAR ES 900, ZEISSIOLMASTER 500, ZEISS IOLMASTER 700, NIDEK AL-SCAN, TOMEY OA 2000, TOPCONAladdin, OCULUS PENTACAM AXL, ZIEMER GALILEI G6, MOVU/ALCON ARGOS,HEIDELBERG ANTERION.Selection of the target refractionSelect your desired spherical equivalent target refraction. With the current version of the calculator values from +1.00 D to -2.50 D are accepted.IOL data entryEnter the IOL manufacturer’s name as well as the specific model name in the ir respective entry fields. Then add the A-constant for the SRK/T formula that has been optimized for optical biometry in the A-Constant field.Even though only the A-Constant field is mandatory, entering all data will help to improve the performance of the calculator.WARNING!The Hill-RBF Calculator was developed based on LENSTAR LS 900 biometry data in combinationwith the Alcon SN60WF for IOL powers from +6.00 D to +30.00 D IOL powers and up to +35.00 Dbased on a similar biconvex IOL design. For IOL powers from +5.00 D to -5.00 D, it performs bestwith the Alcon MA60MA extended range biconvex IOL. The Hill-RBF method performs best withthis combination of biometry device and IOLs.Preforming the IOL calculationAfter all mandatory data has been entered, the calculation button at the bottom is enabled.Clicking on this button will display the IOL calculation result. The Hill-RBFcalculator is self-validating, which means that if the pre-operative data isoutside one or more internal calculator boundary models, a warningmessage will be displayed. In this case, it is recommended to validate thecalculation with other latest generation IOL calculation formulas, such asthe Barrett Universal II formula and/or the Olsen formula.Printing the calculation resultTo print the calculation, click on the printer icon as described in the introduction. A 2nd browser window will open, providing a PDF printout of the results for documentation purposes.Terms of Use, License Agreement and Privacy Policy PLEASE READ THESE TERMS OF USE, LICENSE AGREEMENT AND PRIVACY POLICY (“AGREEMENT”) IN FULL. THIS IS A LEGALLY BINDING CONTRACT BETWEEN YOU (“USER”) AND WARREN E. HILL AS THE AUTHOR AND HAAG-STREIT AG AS THE SERVICE PROVIDER OF THIS CALCULATOR AND GOVERNS ALL ASPECTS OF USER’S ACCESS TO AND USE OF THE HILL-RBF CALCULATOR. BY CLICKING ON THE “I AGREE” BUTTON AT THE BOTTOM OF THIS AGREEMENT, USER AGREES TO ALL TERMS AND CONDITIONS SET FORTH BELOW AS WELL AS THE TERMS OF USE AND PRIVACY POLICY.DisclaimerThe Hill-RBF Calculator is meant to serve as an adjunct tool to assist physicians in selecting the appropriate IOL power for a particular patient. It is intended to be used in conjunction with a comprehensive ophthalmic examination and the appropriate diagnostic tests and measurements necessary for cataract surgery candidates.The Hill-RBF Calculator was developed based on LENSTAR LS 900 biometry data in combination with the Alcon SN60WF and the Alcon MA60MA IOL. It performs best with this combination of biometry device and IOL models. It may also be used with other biconvex IOL models in the power range of +6.00 D to +35.00 D and other meniscus IOL models in the power range of +5.00 D to -5.00 D.WARNING: Using other data sources or IOL models than the original ones the model was derived on, may reduce the overall performance of the calculator. The results obtained by the calculator are not intended to serve as medical or surgical instruction, or be definitive; nor can it be guaranteed that the results will be accurate in every case. Physicians who use the calculator must arrive at their own independent determinations regarding the proper treatment for their patients and are solely responsible for the refractive outcome. By using the Hill-RBF Calculator, the user agrees to waive all claims against and hold Warren E. Hill and Haag-Streit AG harmless from any claims arising out of your use of this tool. OwnershipThe Hill-RBF Calculator is based on intellectual property of Dr. Warren E. Hill. It is provided to the user by Haag-Streit AG, for educational and internal business, including the user’s clinical operations and purposes only. The user may not reverse engineer, decompile, or disassemble the Hill-RBF Calculator. The user may not adapt or modify, create derivative works, operate a service bureau, or act as a Software as a Service (SaaS) provider based upon the Hill-RBF Calculator. The License below defines the extent of Licensee’s rights with respect to the Hill-RBF Calculator.Non-exclusive, Limited LicenseThis agreement gives the user the right to access the Hill-RBF Calculator and to use it for the limited purpose of performing IOL power calculations for user’s internal business, includinguser’s clinic al operations and purposes only. Said license rights are not transferable or sublicense able, nor may the Hill-RBF Calculator be reproduced, or modified without the express prior written consent of Dr. Warren E. Hill and Haag-Streit AG. Licensee agrees to use all reasonable efforts to prevent unauthorized use, distribution, disclosure or publication of the Calculator or any data generated using the Calculator.By this license, the user acquires no ownership right, title or interest in the Hill-RBF Calculator, or in any applicable patents, trademarks, copyrights, trade secrets and other intellectual property rights which may be embodied or contained therein.Use and entry of patient, biometry and IOL information; cookiesUse of this Calculator may involve the entry of certain patient data, which may be deemed “protected health information” (“PHI”) under the Health Insurance Portability and Accountability Act of 1996 and Standards for Privacy of Individually Identifiable Health Information, 45 CFR Parts 160 & 164 (“HIPAA”) as amended or supplemented by additional legislation or regulations from time to time. All data is encrypted during transfer of the data from the original computer and the server. The data provided is stored for the purpose of improving the performance of the Calculator and research. All PHI data is encrypted using technology customary in the industry Haag-Streit as provider of the Hill-RBF Calculator service uses reasonable efforts to avoid unauthorized disclosure of data. The Calculator site uses cookies to facilitate easier navigation within the site and provide a higher level of convenience for the visitor. A cookie is a small piece of information about an Internet session that may be created when a visitor accesses a web site. The cookies used by the Calculator site are not written to the visitor’s hard drive, exist only until the browser is shut down, do not contain any personal information regarding the visitor, and do not retrieve any information from the visitor’s personal computer.No warrantiesTHE HILL-RBF CALCULATOR IS PROVIDED “AS-IS” WITHOUT ANY WARRANTY WHATSOEVER. THE USERS ASSUMES ALL RISKS AND RESPONSIBILITIES FOR IOL POWER SELECTION BY THE CALCULATOR TO ACHIEVE THE USER'S INTENDED RESULTS, FOR THE USE OF THE CALCULATOR, AND FOR THE USE OF ANY RESULTS OBTAINED FROM THE CALCULATOR AND SHALL INDEMNIFY AND HOLD WARREN E. HILL AND HAAG-STREIT AG HARMLESS FROM AND AGAINST ALL LOSS, COST, CLAIMS OR DAMAGES ARISING OUT OF THE USER’S USE OF THE HILL-RBF CALCULATOR AND THE INFORMATION CONTAINED IN OR COMPILED BY THE CALCULATOR.TO THE MAXIMUM EXTENT PERMITTED BY APPLICABLE LAW, AND IN ALL STATES AND JURISDICTIONS WHERE SUCH DISCLAIMERS ARE PERMITTED BY LAW, WARREN E. HILL AND HAAG-STREIT AG EXPRESSLY DISCLAIM ALL REPRESENTATIONS AND WARRANTIES REGARDING THE CALCULATOR, EITHER EXPRESS OR IMPLIED, INCLUDING BUT NOT LIMITED TO IMPLIED WARRANTIES OF MERCHANTABILITY, FITNESS FOR A PARTICULAR PURPOSE, AND NON-INFRINGEMENT.WARREN E. HILL AS WELL AS HAAG-STREIT AG EXPRESSLY DISCLAIMS ANY WARRANTY, EITHER EXPRESS OR IMPLIED, REGARDING SYSTEM AND/OR CALCULATOR AVAILABILITY, ACCESSIBILITY, OR PERFORMANCE. BY ACCEPTING THESE TERMS, THE USER HEREBY ACKNOWLEDGES THAT, AT ANY GIVEN TIME, THE HILL-RBF CALCULATOR MAY NOT BE AVAILABLE OR MAY BECOME UNAVAILABLE DUE TO ONE OR MORE OF THE FOLLOWING: PERIODIC SYSTEM MAINTENANCE, TECHNICAL FAILURE OF THE HILL-RBF CALCULATOR, TELECOMMUNICATIONS INFRASTRUCTURE, OR DELAY OR DISRUPTION ATTRIBUTABLE TO VIRUSES, DENIAL OF SERVICE, INCREASED OR FLUCTUATING DEMAND, ACTS OR OMISSIONS OF THIRD PARTIES, ACTS OF GOD, OR ANY OTHER CAUSE REASONABLY BEYOND THE CONTROL OF WARREN E. HILL AS WELL AS HAAG-STREIT AG.Limitations on liabilityTHE USER HEREBY EXPRESSLY ASSUMES THE ENTIRE COST OF ANY DAMAGE RESULTING FROM THE USER’S USE OF THE HILL-RBF CALCULATOR AND THE INFORMATION CONTAINED IN OR COMPILED BY THE CALCULATOR AND SHALL INDEMNIFY AND HOLD WARREN E. HILL AND HAAG-STREIT AG HARMLESS FROM AND AGAINST ALL LOSS, COST, CLAIMS OR DAMAGES ARISING OUT OF THE USER’S USE OF THE HILL-RBF CALCULATOR AND THE INFORMATION CONTAINED IN OR COMPILED BY THE CALCULATOR.TO THE MAXIMUM EXTENT PERMITTED BY APPLICABLE LAW, AND IN ALL STATES AND JURISDICTIONS WHERE SUCH LIMITATIONS AND EXCLUSIONS ARE PERMITTED, IN NO EVENT WILL WARREN E. HILL AS WELL AS HAAG-STREIT AG BE LIABLE FOR ANY DAMAGES WHATSOEVER (INCLUDING, WITHOUT LIMITATION, DIRECT, INDIRECT, SPECIAL, CONSEQUENTIAL, PUNITIVE OR INCIDENTAL DAMAGES) ARISING OUT OF THE USE OF OR INABILITY TO USE THE CALCULATOR, EVEN IF WARREN E. HILL AND/OR HAAG-STREIT AG HAVE BEEN ADVISED OF THE POSSIBILITY OF SUCH DAMAGES.Terms and conditionsUpon acceptance of the terms of this Agreement by clicking “I agree” below, the user will be bound by the terms of this Agreement. Warren E. Hill and Haag-Streit AG reserve the right to change this policy at any time. This Agreement cannot be modified except by Warren E. Hill and Haag-Streit AG.This Agreement shall be governed by and interpreted in accordance with the laws of Switzerland, without giving effect to its conflict of law provisions. Exclusive place of jurisdiction shall be Koeniz (Switzerland).This Agreement may be terminated by Warren E. Hill or Haag-Streit AG at any time for a violation of its terms; any failure by Warren E. Hill or Haag-Streit AG to immediately address or enforce any aspect of this Agreement shall not be considered a general or continuing waiver of such right of termination. Warren E. Hill and Haag-Streit AG may discontinue temporarily or permanently the Hill-RBF Calculator and the availability of the Hill-RBF Calculator to the user or to others at any time, in their sole discretion.Alcon is a registered trademark of Novartis AG, Basel, CH-4002, SwitzerlandLENSTAR and 900 are registered trademarks to Haag-Streit Holding AG, Gartenstadtstrasse 10, 3098 Koeniz, Switzerland(C) 2020 Warren E. Hill and Haag-Streit AGWarren E. Hill, MDEast Valley Ophthalmology5620 East Broadway RoadMesa, Arizona, 85206 USAHaag-Streit AGGartenstadtstrasse 10CH-3098 Koeniz, SwitzerlandShould you have any further questions, please contact HAAG-STREIT at: https:///haag-streit-diagnostics/contact/。
citroen c5

citroen c5Citroen C5: A Perfect Blend of Elegance and PerformanceIntroductionThe Citroen C5 is a popular mid-size sedan that offers a perfect blend of elegance, comfort, and performance. This European car has been loved by car enthusiasts worldwide for its stylish design, advanced features, and exceptional driving experience. In this document, we will explore the various aspects of the Citroen C5, including its design, interior, performance, safety features, and technology.DesignOne of the first things that catch your eye about the Citroen C5 is its elegant and sophisticated design. The car boasts smooth lines, a sleek profile, and a beautifully sculpted body that exudes class and refinement. The modern and aerodynamic design not only enhances the car's aesthetics but also improves its fuel efficiency and overall performance.The Citroen C5 is available in a range of vibrant colors, allowing buyers to choose the one that best suits their personality. The front end of the car features a bold grille and sleek headlights that add to its attractiveness. The rear of the car is equally captivating, with stylish taillights and a well-designed bumper.InteriorStep inside the Citroen C5, and you will be welcomed by a luxurious and comfortable cabin. The car offers ample space for both the driver and passengers, ensuring a comfortable journey even on long drives. The seats are well-padded and upholstered with high-quality materials, providing optimal comfort and support.The car comes equipped with a range of features that enhance the driving experience. The dashboard is well-designed, with easy-to-use controls and a user-friendly interface. The Citroen C5 offers a spacious trunk, allowing you to easily store your belongings during road trips or daily commutes.PerformanceThe Citroen C5 is equipped with a range of powerful and efficient engines, ensuring a dynamic driving experience. The car offers a choice of gasoline, diesel, and hybrid engines, allowing buyers to choose the one that best suits their preferences and driving style.The powerful engines, combined with the car's lightweight construction, result in exceptional acceleration and handling. The Citroen C5 offers a smooth and refined ride, absorbing bumps and road imperfections with ease. The car's precise steering and responsive braking make it a joy to drive in both city traffic and on the open road.Safety FeaturesWhen it comes to safety, the Citroen C5 leaves no stone unturned. The car is equipped with a range of advanced safety features that ensure the safety of both the driver and passengers. These include adaptive cruise control, blind-spot detection, lane-keep assist, automatic emergency braking, and a 360-degree camera system.The car also features an advanced airbag system, stability control, and anti-lock braking system, which further enhance the safety of occupants. The Citroen C5 has received top ratings in various crash tests, making it one of the safest choices in its class.TechnologyThe Citroen C5 offers a range of advanced technology features that add convenience and entertainment to your driving experience. The car is equipped with a high-resolution touchscreen infotainment system that supports smartphone integration, allowing you to access your favorite apps and make calls while on the move.The car also offers a premium sound system, Bluetooth connectivity, USB ports, and a built-in navigation system, ensuring a seamless and enjoyable driving experience. The Citroen C5 also features advanced driver-assistance systems such as traffic sign recognition, automatic high beams, and parking sensors, making driving easier and safer.ConclusionIn conclusion, the Citroen C5 is a mid-size sedan that offers a perfect combination of elegance, comfort, and performance. With its stylish design, spacious interior, powerful engines, advanced safety features, and cutting-edge technology, it stands out among its competitors. Whether you are looking for a car for daily commutes or long road trips, the Citroen C5 is a worthy choice that will never disappoint. So why wait? Take a test drive and experience the Citroen C5 for yourself.。
描写折纸飞机的过程英语作文

In the realm of childhood play and imaginative exploration, few activities hold as much universal appeal as the creation of a paper airplane. This seemingly simple pastime, with roots tracing back centuries, offers a fascinating intersection of artistry, engineering, and physics. This essay embarks on an in-depth, analytical journey through the process of crafting a paper airplane, delving into the intricate steps, the underlying principles, and the multifaceted joys it brings.**I. The Preamble: Selecting and Preparing the Canvas**The inception of any paper airplane begins with the choice of its canvas – the sheet of paper that will be transformed into a soaring marvel. While myriad options exist, ranging from lightweight tissue to sturdy cardstock, a standard 8.5 x 11-inch piece of printer paper is the most common and versatile choice. It strikes a balance between aerodynamic properties, ease of folding, and accessibility. The paper's weight, typically around 20-24 pounds (or 75-90 gsm), ensures sufficient stiffness for structural integrity while remaining light enough to glide effortlessly.Once selected, the paper assumes a critical role in determining the airplane's flight characteristics. Its square or rectangular shape allows for symmetrical folds, essential for balanced flight. The pristine white surface serves as a blank slate, inviting creative expression through decorations or personalized markings, adding an artistic touch to the functional design.**II. The Art of Folding: Precision, Patience, and Perseverance**The construction of a paper airplane is a dance between precision and dexterity, where each fold, crease, and tuck contributes to the final product's performance. It typically commences with a series of preparatory folds designed to establish a foundation for subsequent steps:1. **The Diagonal Fold:** The paper is folded diagonally from one corner to the opposite corner, unfolded, and then repeated along the other diagonal. These preliminary folds create guidelines for the subsequent valley and mountain folds that will define the airplane's wings and body.2. **The Valley and Mountain Folds:** Along the creases formed by the diagonal folds, the paper is accordion-folded, creating a series of alternating valleys (folds that dip inward) and mountains (folds that protrude outward). These establish the longitudinal symmetry crucial for stable flight.3. **The Wings and Tail:** The wings are formed by folding the top layer of the paper down along the centerline, aligning the edges precisely. The tail, often achieved through a series of smaller, intricate folds, provides stability and directional control. The exact configuration of the tail varies depending on the chosen design, with some models featuring a single vertical stabilizer and others incorporating a more elaborate rudder and elevator setup.Throughout this process, patience and perseverance are paramount. Each fold must be executed with meticulous care, ensuring crisp, clean lines and accurate alignment. The slightest deviation can significantly impact the airplane's flight performance, highlighting the delicate interplay between craftsmanship and functionality.**III. The Science Behind Flight: Understanding Aerodynamics**Beneath the surface of this playful pursuit lies a profound engagement with the principles of aerodynamics. A well-designed paper airplane harnesses several key concepts to achieve lift, stability, and control:1. **Lift:** The wings, shaped like airfoils, generate lift as air flows over them at an angle of attack. The curved upper surface creates lower air pressure than the flat underside, resulting in an upward force that counteracts gravity. Adjusting the wing's dihedral angle (the upward tilt from the horizontal plane) enhances lateral stability by naturally correcting any roll caused by uneven airflow.2. **Drag and Weight Distribution:** The streamlined profile of the fuselage and the positioning of the wings and tail minimize drag, allowing the airplane to maintain forward momentum. Strategic placement of folds and tucks distribute weight evenly, preventing nose-dives or stalls.3. **Stability and Control:** The tail section plays a critical role inmaintaining pitch and yaw stability. The vertical stabilizer resists rotation around the airplane's roll axis, while the rudder and elevator (if present) enable fine adjustments to the flight path.**IV. Launching and Flight Testing: A Moment of Anticipation and Discovery** With the paper airplane meticulously crafted, the moment of truth arrives – the launch. This ritual is imbued with anticipation, as the creator holds their breath, gauging wind direction, adjusting the throw angle, and finally unleashing their creation into the open sky. The initial ascent, the graceful arc, and the gentle descent become a microcosm of human fascination with flight, encapsulating dreams of soaring beyond terrestrial bounds.Flight testing is not merely an end in itself but also an opportunity for iterative improvement. Observing the airplane's performance – its altitude, distance, stability, and maneuverability – provides valuable insights into the effectiveness of the design and folding technique. Tweaks to the wing dihedral, tail configuration, or launch angle can dramatically alter flight characteristics, turning a mediocre flyer into a champion of the skies.**V. Beyond the Craft: The Multifaceted Benefits of Paper Airplane Making** Beyond the immediate thrill of flight, the art of paper airplane making confers a multitude of benefits:1. **Cognitive Development:** Engaging in the step-by-step process of designing and folding a paper airplane fosters spatial awareness, fine motor skills, and problem-solving abilities. It encourages children and adults alike to think creatively, experiment, and learn from trial and error.2. **STEM Education:** Paper airplanes serve as an accessible and engaging introduction to fundamental principles of science, technology, engineering, and mathematics. They offer a tangible, hands-on means of exploring concepts such as aerodynamics, force, and motion.3. **Social Interaction:** Group activities involving paper airplane making can promote collaboration, friendly competition, and the sharing of knowledge and techniques. It transcends linguistic and cultural barriers, uniting peoplethrough a shared experience of joy and discovery.4. **Relaxation and Mindfulness:** The focused, meditative nature of paper folding can provide a respite from daily stressors, promoting mental clarity and relaxation. It encourages individuals to slow down, appreciate the beauty of simplicity, and find satisfaction in the process rather than just the outcome.In conclusion, the process of crafting a paper airplane is far more than a casual pastime. It is a nuanced blend of artistry and science, an exercise in precision and creativity, and a portal to the boundless wonders of flight. From the selection of the paper canvas to the final launch, every step is imbued with meaning and purpose, reflecting the intricate interplay between human ingenuity and the laws of nature. This timeless activity continues to captivate and inspire generations, serving as a testament to the enduring allure of transforming the ordinary into the extraordinary.。
双向中继系统的中断概率分析

双向中继系统的中断概率分析林晓晨;肖骁琦【摘要】分析、比较两时隙无线双向中继系统采用中继放大转发和解码转发的中断概率性能.首先推导得出中继放大转发中断概率的一个下界,且仿真结果证明该下界是紧致的.然后,计算出中继解码转发中断概率的闭合表达式,得到当信噪比和复用增益足够小时,解码转发优于放大转发,反之,放大转发中断性能更优的结论.最后,通过仿真考查了中继节点的位置、时隙分配和速率分配对中断性能的影响.【期刊名称】《上海电机学院学报》【年(卷),期】2014(017)004【总页数】7页(P192-198)【关键词】双向中继;中断概率;放大转发;解码转发【作者】林晓晨;肖骁琦【作者单位】上海电机学院电子信息学院,上海200240;上海电机学院电子信息学院,上海200240【正文语种】中文【中图分类】TN919.3双向中继(Two-Way Relaying, TWR)系统[1-2]是指两个源节点在一个中继节点的帮助下完成信息交换。
由于半双工设备的限制,采用传统的单向传输需要4个时隙完成信息交换,频谱效率很低。
在引入物理层网络编码[3-4](Physical LayerNetwork Coding,PLNC)后,可以将传统的四时隙通信简化为三时隙或两时隙,大大提高了频谱利用率。
三时隙模型[5]是指两个源节点在前两个时隙分别发送消息给中继节点,在第3个时隙,中继节点利用无线信道的广播特性,广播信号给两个源节点。
两时隙模型[6]是利用无线信道的多址特性,把三时隙模型中的前两个时隙合并,即两个源节点同时向中继节点发送独立的信息,然后,中继节点在第2个时隙同样广播信号。
由于半双工设备的限制,两时隙和三时隙模型的一个主要区别在于,在两时隙模型中,两个源节点之间不存在直接链路(Direct Link,DL);而在三时隙模型中,两个源节点之间存在直接链路。
双向中继系统中,基于物理层网络编码技术,无论是两时隙还是三时隙模型,中继节点都具有先处理接收信号再转发的能力。
- 1、下载文档前请自行甄别文档内容的完整性,平台不提供额外的编辑、内容补充、找答案等附加服务。
- 2、"仅部分预览"的文档,不可在线预览部分如存在完整性等问题,可反馈申请退款(可完整预览的文档不适用该条件!)。
- 3、如文档侵犯您的权益,请联系客服反馈,我们会尽快为您处理(人工客服工作时间:9:00-18:30)。
a r X i v :c s /0703017v 4 [c s .I T ] 5 J u n 2008Performance Bounds for Bi-Directional CodedCooperation ProtocolsSang Joon Kim,Patrick Mitran,and Vahid TarokhAbstract In coded bi-directional cooperation,two nodes wish to exchange messages over a shared half-duplex channel with the help of a relay.In this paper,we derive performance bounds for this problem for each of three decode-and-forward protocols.The first protocol is a two phase protocol where both users simultaneously transmit during the first phase and the relay alone transmits during the second.In this protocol,our bounds are tight.The second protocol considers sequential transmissions from the two users followed by a transmission from the relay while the third protocol is a hybrid of the first two protocols and has four phases.In the latter two protocols the bounds are not identical.Numerical evaluation shows that in some cases of interest our bounds do not differ significantly.Finally,in the Gaussian case with path loss,we derive achievable rates and compare the relative merits of each protocol.This case is of interest in cellular systems.Surprisingly,we find that in some cases,the achievable rate region of the four phase protocol contains points that are outside the outer bounds of the other two protocols.Index TermsCooperation,capacity bounds,performance bounds,bi-directional communication,network coding.Sang Joon Kim and Vahid Tarokh are with the School of Engineering and Applied Sciences,Harvard University,Cambridge,MA 02138.Emails:sangkim,vahid@.Patrick Mitran is with the Department of Electrical and Computer Engineering,University of Waterloo,Waterloo,Canada.Email:pmitran@uwaterloo.ca.This research is supported in part by NSF grant number ACI-0330244and ARO MURI grant number W911NF-07-1-0376.This work was supported in part by the Army Research Office,under the MURI award N0.N00014-01-1-0859.The views expressed in this paper are those of the authors alone and not of the sponsor.I.I NTRODUCTIONConsider two users,denoted by a and b,who wish to share independent messages over a shared channel.Traditionally,this problem is known as the two-way channel[2],[10].In many realistic broadcast environments,such as wireless communications,it is not unreasonable to assume the presence of a third node which may aid in the exchange of a and b’s messages.In particular, if a is a mobile user and b is a base station,then we may suppose the presence of a relay station r to assist in the bi-directional communication.Traditionally,without the presence of the relay station,communication between nodes a and b is performed in two steps:first a transmits its message to b followed by similar transmission from b to a(illustrated in Fig.1.i).In the presence of relay node r,one might initially assume that four phases are needed(see Fig.1.ii).However,by taking advantage of the shared wireless medium,it is known that the third and fourth transmissions may be combined(Fig.1.iii)into a single transmission using,for example,ideas from network coding[1],[13].In particular,if the messages of a and b are w a and w b respectively and belong to a group,then it is sufficient for the relay node to successfully transmit w a⊕w b simultaneously to a and b.In[4],[5],such a three phase coded bi-directional protocol is considered when the group is Z k2,the binary operator is component-wise modulo2addition(i.e.,exclusive or)and encoding is performed linearly to produce parity bits.As each user transmits sequentially,each user is amenable to receive“side-information”from the opposite user during one of thefirst two phases.The works of[7]and[8]not only consider the three phase protocol,but combine thefirst two phases into a single joint transmission by nodes a and b followed by a single transmission by the relay which forwards its received signal(Fig.1.iv).Coded bi-directional cooperation may also be extended for the case of multiple relaying nodes[11],[12].In[9],achievable rate regions are derived assuming full duplex capabilities at all nodes.In this paper,we are interested in determining fundamental bounds on the performance of coded bi-directional communications assuming various decode-and-forward protocols for half-duplex channels.In the case of a two phase protocol where both users transmit simultaneously in thefirst phase followed by a transmission from the relay,we derive the exact performance1.In the case of three or more phase protocols,we take into account any side information that a node may acquire when it is not transmitting and derive inner and outer bounds on the capacity regions.Wefind that a four phase hybrid protocol is sometimes strictly better than the outerbounds of two or three phase decode-and-forward protocolsFig.1.(i)Traditional approach,(ii)Naive four phase bi-directional cooperation,(iii)coded broadcast three phase protocol, (iv)two phase protocol.previously introduced in the literature.This paper is structured as follows.In Section II,we define our notation and the protocols that we consider.In Section III,we derive performance bounds for the protocols while in Section IV,we numerically compute these bounds for fading Gaussian channels.II.P RELIMINARIESA.Notation and DefinitionsWefirst start with a somewhat more general formulation of the problem.We consider an m node set,denoted as M:={1,2,...,m}(where:=means defined as)for now,where node i has message W i,j that it wishes to send to node j.Each node i has channel input alphabet X∗i=X i∪{∅}and channel output alphabet Y∗i=Y i∪{∅},where∅is a special symbol distinct of those in X i and Y i and which denotes either no input or no output.In this paper,we assume that a node may not simultaneously transmit and receive at the same time.In particular,if node i selects X i=∅,then it receives Y i∈Y i and if X i∈X i,then necessarily Y i=∅,i.e.,X i=∅iff Y i=∅2.Otherwise,the effect of one node remaining silent on the received variable at another node may be arbitrary at this point.The channel is assumed discrete memoryless.In Section IV,we will be interested in the case X∗i=Y∗i=C∪{∅},∀i∈M.The objective of this paper is to determine achievable data rates and outer bounds on these for some particular cases.We use R i,j for the transmitted data rate of node i to node j,i.e.,W i,j∈{0,...,⌊2nR i,j⌋−1}:=S i,j.1Similar results were independently derived in[6].2Thus,FDM cannot be allowed as it violates the half-duplex constraint.For a given protocol P,we denote by∆ℓ≥0the relative time duration of theℓth phase.Clearly, ℓ∆ℓ=1.It is also convenient to denote the transmission at time k,1≤k≤n at node i by X k i,where the total duration of the protocol is n and X(ℓ)i denotes the random variable with alphabet X∗i and input distribution p(ℓ)(x i)during phaseℓ.Also,X k i corresponds to a transmission in thefirst phase if k≤∆1n,etc.We also define X k S:={X k i|i∈S},the set of transmissions by all nodes in the set S at time k and similarly X(ℓ):={X(ℓ)i|i∈S},a set of random variables with channel input distribution Sp(ℓ)(x S)for phaseℓ,where x S:={x i|i∈S}.Lower case letters x i denote instances of the upper case X i which lie in the calligraphic alphabets X∗i.Boldface x i represents a vector indexed by time at node i.Finally,it is convenient to denote by x S:={x i|i∈S},a set of vectors indexed by time. Encoders are then given by functions X k i(W i,1,...,W i,m,Y1i,...,Y k−1),for k=1,...,n and de-icoders byˆW j,i(Y1i,...,Y n i,W i,1,...,W i,m).Given a block size n,a set of encoders and decoders has associated error events E i,j:={W i,j=ˆW i,j(·)},for decoding the message W i,j at node j at the end of the block,and the corresponding encoders/decoders result in relative phase durations{∆ℓ,n},where the subscript n indicates that the phase duration depends on the choice of block size(as they must be multiples of1/n).A set of rates{R i,j}is said to be achievable for a protocol with phase durations{∆ℓ},if there exist encoders/decoders of block length n=1,2,...with P[E i,j]→0and∆ℓ,n→∆ℓas n→∞∀ℓ.An achievable rate region(resp.capacity region)is the closure of a set of(resp.all)achievable rate tuples forfixed{∆ℓ}.B.Basic ResultsIn the next section,we will use a variation of the cut-set bound.We assume that all messages from different sources are independent,i.e.,∀i=j,W i,k and W j,l are independent∀k,l∈M.In contrast to [2],we relax the independent assumption from one source to different nodes,i.e.,in our case W i,j and W i,k may not be independent.Given subsets S,T⊆M,we define W S,T:={W i,j|i∈S,j∈T}and R S,T=lim n→∞1phaseℓof protocol P.Proof:Replacing W(T)by W S,S c and W(T c)by W S c,M in(15.323)-(15.332)in[2],then all the steps in[2]still hold and we haveH(W S,S c)=H(W S,S c|W S c,M)≤nk=1I(X k S;Y k S c|X k S c)+nǫn,whereǫn→0since i∈S,j∈S c P[E i,j]→0and the distributions p(x k1,...,x k m,y k1,...,y k m)are those induced by encoders for which P[E i,j]→0as n→∞.Defining Q1,Q2,...to be discrete random variables uniform over{1,...,n·∆1,n},{n·∆1,n+1,...,n·∆1,n+n·∆2,n},...,we thus haveH(W S,S c)≤ ℓn·∆ℓ,n I(X QℓS;Y QℓS c|X QℓS c,Qℓ)+nǫn,(2) Defining the discrete random variable Q:=(Q1,Q2,...),then1C.ProtocolsIn bi-directional cooperation,two terminal nodes denoted a and b exchange their messages.The messages to be transmitted are W a:=W a,b,W b:=W b,a and the corresponding rates are R a:=R a,b and R b:=R b,a.The two distinct messages W a and W b are taken to be independent and uniformly distributed in the set of{0,...,⌊2nR a⌋−1}:=S a and{0,...,⌊2nR b⌋−1}:=S b,respectively.Then W a and W b are both members of the additive group Z L,where L=max(⌊2nR a⌋,⌊2nR b⌋).The simplest protocol for the bi-directional channel,is that of Direct Transmission(DT)(Fig.2.i). Here,since the channel is memoryless andǫ>0is arbitrary,the capacity region from Lemma1is:R a≤supp(1)(x a)∆1I(X(1)a;Y(1)b|X(1)b=∅)R b≤supp(2)(x b)∆2I(X(2)b;Y(2)a|X(2)a=∅),where the distributions are over the alphabets X a and X b respectively.With a relay node r,we suggest three different decode-and-forward protocols,which we denote as Multiple Access Broadcast(MABC)protocol,Time Division Broadcast(TDBC)and Hybrid BroadcastFig.2.Proposed protocol diagrams.Shaded areas denote transmission by the respective nodes.It is assumed that all nodes listen when not transmitting.(HBC).Then,the message from a(resp.b)to r is W a,r=W a(resp.W b,r=W b)and the corresponding rate is R a,r=R a(resp.R b,r=R b).Also,in our protocols,all phases are contiguous,i.e.,they are performed consecutively and are not interleaved or re-ordered.3In the MABC protocol(Fig.2.ii),terminal nodes a and b transmit information simultaneously during phase1and the relay r transmits some function of the received signals during phase2.With this scheme, we only divide the total time period into two regimes and neither node a nor node b is able to receive any meaningful side-information during thefirst phase due to the half-duplex constraint.In the TDBC protocol(Fig.2.iii),only node a transmits during thefirst phase and only node b transmits during the second phase.In phase3,relay r performs a transmission based on the received data from thefirst two phases.Here,node a attempts to recover the message W b based on both the transmissions from node b in the second phase and node r in the third phase.We denote the received signal at node a in the second phase as second phase side information.Likewise,node b may also recover W a based on first phase side information and the received signal at node b during the third phase.Finally,we consider a Hybrid Broadcast(HBC)protocol(Fig.2.iv)which is an amalgam of the MABC and TDBC protocols.In this scheme,there are4distinct transmissions,two of which result in side-information at a and b.3If we relax the contiguous assumption,the achievable region could increase by cooperation between interleaving phases.III.P ERFORMANCE B OUNDSA.MABC ProtocolTheorem2:The capacity region of the half-duplex bi-directional relay channel with the MABC pro-tocol is the closure of the set of all points(R a,R b)satisfyingR a<min ∆1I(X(1)a;Y(1)r|X(1)b,X(1)r=∅,Q),∆2I(X(2)r;Y(2)b|X(2)a=X(2)b=∅,Q)R b<min ∆1I(X(1)b;Y(1)r|X(1)a,X(1)r=∅,Q),∆2I(X(2)r;Y(2)a|X(2)a=X(2)b=∅,Q)R a+R b<∆1I(X(1)a,X(1)b ;Y(1)r|X(1)r=∅,Q)over all joint distributions p(q)p(1)(x a|q)p(1)(x b|q)p(2)(x r|q)with|Q|≤5over the alphabet X a×X b×X r.Remark:If the relay is not required to decode both messages,then the region above is still achievable, and removing the constraint on the sum-rate R a+R b yields an outer bound.Proof:Achievability:Random code generation:For simplicity of exposition only,we take|Q|=1 and therefore consider distributions p(1)(x a),p(1)(x b)and p(2)(x r).First we generate random(n·∆1,n)-length sequences x(1)a(w a)with w a∈S a and x(1)b(w b)with w b∈S b,and(n·∆2,n)-length sequences x(2)r(w r)with w r∈Z L where L=max(⌊2nR a⌋,⌊2nR b⌋),according to p(1)(x a),p(1)(x b)and p(2)(x r) respectively.Encoding:During phase1,encoders of node a and b send the codewords x(1)a(w a)and x(1)b(w b) respectively.Relay r estimatesˆw a andˆw b after phase1using jointly typical decoding,then constructs w r=ˆw a⊕ˆw b in Z L and sends x(2)r(w r)during phase2.Decoding:a and b estimate˜w b and˜w a after phase2using jointly typical decoding.Since w r=w a⊕w b and a knows w a,node a can reduce the number of possible w r to⌊2nR b⌋and likewise at node b,the cardinality is⌊2nR a⌋.Error analysis:For convenience of analysis,first define E(ℓ)i,j as the error event at node j that node j attempts to decode w i at the end of phaseℓusing jointly typical decoding.Let A(ℓ)S,T represents the set ofǫ-weakly typical(x(ℓ)S,y(ℓ)T)sequences of length n·∆ℓ,n according to the input distributionsemployed in phaseℓ.Also define the set of codewords x(ℓ)S(w S):={x(ℓ)i(w i)|i∈S}and the events D(ℓ)S,T(w S):={(x(ℓ)S(w S),y(ℓ)T)∈A(ℓ)S,T},where S and T are disjoint subsets of nodes.P[E a,b]≤P[E(1)a,r∪E(1)b,r∪E(2)r,b](4)≤P[E(1)a,r∪E(1)b,r ]+P[E(2)r,b|¯E(1)a,r∩¯E(1)b,r](5)Following the well-known MAC error analysis from(15.72)in[2]:P[E(1)a,r∪E(1)b,r]≤P[¯D(1){a,b},{r}(w a,w b)]+2nR a2−n·∆1,n(I(X(1)a;Y(1)r|X(1)b,X(1)r=∅)−3ǫ)+2nR b2−n·∆1,n(I(X(1)b;Y(1)r|X(1)a,X(1)r=∅)−3ǫ)+2n(R a+R b)2−n·∆1,n(I(X(1)a,X(1)b;Y(1)r|X(1)r=∅)−4ǫ)(6) Also,P[E(2)r,b |¯E(1)a,r∩¯E(1)b,r]≤P[¯D(2){r},{b}(w a⊕w b)]+P[∪˜wa=w aD(2){r},{b}(˜w a⊕w b)]≤P[¯D(2){r},{b}(w a⊕w b)]+2nR a2−n·∆2,n(I(X(2)r;Y(2)b|X(2)a=X(2)b=∅)−3ǫ)(7)Sinceǫ>0is arbitrary,with the conditions of Theorem2and the AEP property,we can make the right hand sides of(6)–(7)tend to0as n→∞.Similarly,P[E b,a]→0as n→∞.Converse:We use Lemma1to prove the converse part of Theorem2.As we have3nodes,there are 6cut-sets,S1={a},S2={b},S3={r},S4={a,b},S5={a,r}and S6={b,r},as well as two rates R a and R b.The outer bound corresponding to S1is thenR a≤∆1I(X(1)a;Y(1)r,Y(1)b|X(1)r,X(1)b,Q)+∆2I(X(2)a;Y(2)r,Y(2)b|X(2)r,X(2)b,Q)+ǫ(8)=∆1I(X(1)a;Y(1)r|X (1)b,X(1)r=∅,Q)+ǫ,(9) where(9)follows since in the MABC protocol,we must haveY(1)a=Y(1)b=X(1)r=∅(10)X(2)a=X(2)b =Y(2)r=∅.(11)Wefind the outer bounds of the other cut-sets in the same manner:S2:R b≤∆1I(X(1)b;Y(1)r|X (1)a,X (1)r=∅,Q)+ǫ.(12) S3:N/A(13)S4:R a+R b≤∆1I(X(1)a,X(1)b;Y(1)r|X (1)r=∅,Q)+ǫ,(14) S5:R a≤∆2I(X(2)r;Y(2)b|X(2)a=X(2)b=∅,Q)+ǫ,(15)S6:R b≤∆2I(X(2)r;Y(2)a|X (2)a=X (2)b=∅,Q)+ǫ.(16) Sinceǫ>0is arbitrary,together,(9),(12)–(16)and the fact that the half-duplex nature of the channelconstrains X(1)a to be conditionally independent of X(1)bgiven Q yields the converse.By Fenchel-Bunt’s theorem in[3],it is sufficient to restrict|Q|≤5.B.TDBC ProtocolTheorem3:An achievable region of the half-duplex bi-directional relay channel with the TDBC protocol is the closure of the set of all points(R a,R b)satisfyingR a<min ∆1I(X(1)a;Y(1)r|X(1)b=X(1)r=∅,Q),∆1I(X(1)a;Y(1)b |X(1)b=X(1)r=∅,Q)+∆3I(X(3)r;Y(3)b|X(3)a=X(3)b=∅,Q)R b<min ∆2I(X(2)b;Y(2)r|X(2)a=X(2)r=∅,Q),∆2I(X(2)b ;Y(2)a|X(2)a=X(2)r=∅,Q)+∆3I(X(3)r;Y(3)a|X(3)a=X(3)b=∅,Q)over all joint distributions p(q)p(1)(x a|q)p(2)(x b|q)p(3)(x r|q)with|Q|≤4over the alphabet X a×X b×X r.Proof:Random code generation:First,we generate a partition of S a randomly by independently as-signing every index w a∈S a to a set S a,i,with a uniform distribution over the indices i∈{0,...,⌊2nR a0⌋−1}.We denote by s a(w a)the index i of S a,i to which w a belongs and likewise,a partition for w b∈S b is similarly constructed.For simplicity of exposition,we take|Q|=1.For anyǫ>0and distributions p(1)(x a),p(2)(x b)and p(3)(x r),we generate random(n·∆1,n)-length sequences x(1)a(w a)with w a∈S a, (n·∆2,n)-length sequences x(2)b(w b)with w b∈S b and(n·∆3,n)-length sequences x(3)r(w r)with w r∈Z L, L=⌊2n·max{R a0,R b0}⌋.Encoding:During phase1(resp.phase2),the encoder at node a(resp.node b)sends the codewordx(1)a(w a)(resp x(2)b(w b)).Relay r estimatesˆw a andˆw b after phases1and2respectively.The relay then constructs w r=s a(ˆw a)⊕s b(ˆw b)in Z L,and sends x(3)r(w r)during phase3.Decoding:Terminal nodes a and b estimate the indices˜s b(w b)and˜s a(w a)after phase3from x(3)rand then decode˜w b and˜w a if there exists a unique˜w b∈S b,˜sb ∩A(2){b},{a}and˜w a∈S a,˜sa∩A(1){a},{b}.Error analysis:Define E(ℓ)i,j as the error events from node i to node j assuming node j attempts to decode w i at the end of phaseℓusing jointly typical decoding and˜s a or˜s b if available.Also we use thesame definitions of A(ℓ)S,T and D(ℓ)S,T(w S)as in the proof of Theorem2.Then:P[E a,b]≤P[E(1)a,r∪E(2)b,r∪E(3)r,b∪E(3)a,b](17)≤P[E(1)a,r]+P[E(2)b,r]+P[E(3)r,b|¯E(1)a,r∩¯E(2)b,r]+P[E(3)a,b|¯E(1)a,r∩¯E(2)b,r∩¯E(3)r,b].(18)AlsoP[E(1)a,r]≤P[¯D(1){a},{r}(w a)]+2nR a2−n·∆1,n(I(X(1)a;Y(1)r|X(1)b=X(1)r=∅)−3ǫ)(19)P[E(2)b,r ]≤P[¯D(2){b},{r}(w b)]+2nR b2−n·∆2,n(I(X(2)b;Y(2)r|X(2)a=X(2)r=∅)−3ǫ)(20)P[E(3)r,b|¯E(1)a,r∩¯E(2)b,r]≤P[¯D(3){r},{b}(s a(w a)⊕s b(w b))]+P[∪˜sa=s a(w a)D(3){r},{b}(˜s a⊕s b(w b))]≤P[¯D(3){r},{b}(s a(w a)⊕s b(w b))]+2nR a02−n·∆3,n(I(X(3)r;Y(3)b|X(3)a=X(3)b=∅)−3ǫ)(21)P[E(3)a,b|¯E(1)a,r∩¯E(2)b,r∩¯E(3)r,b]≤P[¯D(1){a},{b}(w a)]+P[∪˜wa=w aD(1){a},{b}(˜w a),s a(w a)=s a(˜w a)]≤P[¯D(1){a},{b}(w a)]+2n(R a−∆1,n I(X(1)a;Y(1)b|X(1)b=X(1)r=∅)−R a0+3ǫ)(22) Sinceǫ>0is arbitrary,with the proper choice of R a0,the conditions of Theorem3and the AEP property,we can make the right hand sides of(19)–(22)vanish as n→∞.Similarly,P[E b,a]→0as n→∞.By Fenchel-Bunt’s theorem in[3],it is sufficient to restrict|Q|≤4.C.HBC ProtocolTheorem 5:An achievable region of the half-duplex bi-directional relay channel with the HBC protocol is the closure of the set of all points (R a ,R b )satisfyingR a <min ∆1I (X (1)a ;Y (1)r |X (1)b =X (1)r =∅,Q )+∆3I (X (3)a ;Y (3)r |X (3)b ,X (3)r =∅,Q ),∆1I (X (1)a ;Y (1)b |X (1)b=X (1)r=∅,Q )+∆4I (X (4)r ;Y (4)b |X (4)a=X (4)b=∅,Q )R b <min ∆2I (X (2)b ;Y (2)r |X (2)a =X (2)r =∅,Q )+∆3I (X (3)b ;Y (3)r |X (3)a ,X (3)r =∅,Q ),∆2I (X (2)b ;Y (2)a |X (2)a=X (2)r=∅,Q )+∆4I (X (4)r ;Y (4)a |X (4)a =X (4)b =∅,Q ) R a +R b <∆1I (X (1)a ;Y (1)r |X (1)b =X (1)r=∅,Q )+∆2I (X (2)b ;Y (2)r |X (2)a=X (2)r=∅,Q )+∆3I (X (3)a ,X (3)b ;Y (3)r |X (3)r=∅,Q )over the joint distribution p (q )p (1)(x a |q )p (2)(x b |q )p (3)(x a |q )p (3)(x b |q )p (4)(x r |q )over the alphabet X 2a ×X 2b ×X rwith |Q|≤5.Proof outline:Generate random codewords x (1)a (w a ),x (2)b (w b ),x (3)a (w a ),x (3)b (w b ).Relay r receives data from terminal nodes during phases 1–3,which is decoded by the relay using a MAC protocol to recover w a ,w b .Theorem 5then follows the same argument as the proof of Theorem 3.IV.T HE G AUSSIAN C ASEIn the following section,we apply the performance bounds derived in the previous section to the AWGN channel with pass loss.Definitions of codes,rate,and achievability in the memoryless Gaussian channels are analogous to those of the discrete memoryless channels.If X a[k]=∅,X b[k]=∅,X r[k]=∅,then the mathematical channel model is Y r[k]=g ar X a[k]+g br X b[k]+Z r[k]and Y a[k]and Y b[k]are given by similar expression in terms of g ar,g br and g ab if only one node is silent.If X a[k]=X b[k]=∅and X r[k]=∅,then Y a[k]=g ra X r[k]+Z a[k]and Y b[k]=g rb X r[k]+Z b[k]and similar expressions hold if other pairs of nodes are silent,where the effective complex channel gain g ij between nodes i and j combines both quasi-static fading and path loss and the channels are reciprocal,i.e.,g ij=g ji.For convenience,we define G ij:=|g ij|2,i.e.G ij incorporates path loss and fading effects on received power. Furthermore,we suppose the interesting case that G ab≤G ar≤G br.Finally,we assume full Channel State Information(CSI)at all nodes(i.e.each node is fully aware of g ab,g br and g ar)and that each node has the same transmit power P for each phase,employs a complex Gaussian codebook and the noise is of unit power,additive,white Gaussian,complex and circularly symmetric.For convenience of analysis, we also define the function C(x):=log2(1+x).For a fading AWGN channel,we can optimize the∆i’s for given channel mutual informations in order to maximize the achievable sum rate(R a+R b).First,we optimize the time periods in each protocol and compare the achievable sum rates obtained to determine an optimal transmission strategy in terms of sum-rate in a given channel.For example,applying Theorem3to the fading AWGN channel,the optimization constraints for the TDBC protocol are4:R a≤min{∆1C(P G ar),∆1C(P G ab)+∆3C(P G br)}(23)R b≤min{∆2C(P G br),∆2C(P G ab)+∆3C(P G ar)}(24) We have taken|Q|=1in the derivation of(23)and(24),since a Gaussian distribution simultaneously maximizes each mutual information term individually as each node is assumed to transmit with at most power P during each phase.Linear programming may then be used tofind optimal time durations.The optimal sum rate corresponding to the inner bounds of the protocols is plotted in Fig.3.As expected, the optimal sum rate of the HBC protocol is always greater than or equal to those of the other protocols since the MABC and TDBC protocols are special cases of the HBC protocol.Notably,the sum rate of4The power constraint is satisfied almost surely as n→∞in the random coding argument for Gaussian input distributions with E[X2]<P.Fig.3.Achievable sum rates of the protocols(P=15dB,G ar=0dB)the HBC protocol is strictly greater than the other cases in some regimes.This implies that the HBC protocol does not reduce to either of the MABC or TDBC protocols in general.In the MABC protocol,the performance region is known.However,in the other cases,there exists a gap between the expressions.An achievable region of the4protocols and an outer bound for the TDBC protocol is plotted in Fig.4(in the low and the high SNR regime).As expected,in the low SNR regime, the MABC protocol dominates the TDBC protocol,while the latter is better in the high SNR regime. It is difficult to compute the outer bound of the HBC protocol numerically since,as opposed to the TDBC case,it is not clear that jointly Gaussian distributions are optimal due to the joint distribution p(3)(x a,x b|q)as well as the conditional mutual information terms in Theorem6.For this reason,we do not numerically evaluate the outer bound.Notably,some achievable HBC rate pairs are outside the outer bounds of the MABC and TDBC protocols.R EFERENCES[1]R.Ahlswede,N.Cai,S.-Y.R.Li,and R.W.Yeung,“Network informationflow,”IEEE rm.Theory,vol.46,pp.1204–1216,2000.[2]T.Cover and J.Thomas,Elements of Information Theory,2nd ed.New York:Wiley,2006.[3]J.B.Hiriart-Urruty and C.Lemar´e chal,Fundamentals of Convex Analysis.New York;Springer,2001.[4]rsson,N.Johansson,and K.-E.Sunell,“Coded bi-directional relaying,”in the5th Scandanavian Workshop on Wirelessad-hoc Networks,Stockholm,May2005.[5]——,“Coded bi-directional relaying,”in Proc.IEEE Veh.Technol.Conf.-Spring,2006,pp.851–855.Fig.4.Achievable rate regions and outer bounds with P=0dB(top)and P=10dB(bottom)(G ar=0dB,G br=5dB, G ab=−7dB)[6]T.J.Oechtering,C.Schnurr,I.Bjelakovic,and H.Boche,“Achievable rate region of a two phase bidirectional relaychannel,”in Proc.Conf.on Inf.Sci.and Sys.,Baltimore,MD,Mar.2007.[7]P.Popovski and H.Yomo,“The anti-packets can increase the achievable throughput of a wireless multi-hop network,”inProc.IEEE mun.,2006,pp.3885–3890.[8]——,“Bi-directional amplification of throughput in a wireless multi-hop network,”in Proc.IEEE Veh.Technol.Conf.-Spring,2006,pp.588–593.[9] B.Rankov and A.Wittneben,“Achievable rate regions for the two-way relay channel,”in Proc.IEEE rm.Theory,Seattle,Jul.2006,pp.1668–1672.[10] C.E.Shannon,“Two-way communications channels,”in4th Berkeley Symp.Math.Stat.Prob.,Chicago,IL,Jun.1961,pp.611–644.[11]Y.Wu,P.A.Chou,and S.-Y.Kung,“Information exchange in wireless networks with network coding and physical-layerbroadcast,”Microsoft Research,Tech.Rep.,Aug.2004,MSR-TR-2004-78.[12]——,“Information exchange in wireless networks with network coding and physical-layer broadcast,”in Proc.Conf.onInf.Sci.and Sys.,Baltimore,MD,Mar.2005.[13]L.L.Xie,“Network coding and random binning for multi-user channels,”in the10th Canadian Workshop on InformationTheory,Edmonton,Alberta,Canada,Jun.2007,pp.85–88.。