Turbulent Molecular Cloud Cores Rotational Properties
基因沉默番木瓜环斑病毒复制酶基因(PRSV-Nib)获得抗病毒病番木瓜的研究
热带作物学报2024, 45(4): 837 846Chinese Journal of Tropical Crops基因沉默番木瓜环斑病毒复制酶基因(PRSV-Nib)获得抗病毒病番木瓜的研究吴清铧1,2,贾瑞宗2*,郭静远2,杨牧之2,胡玉娟2,郝志刚2,赵辉2**,郭安平2** 1. 海南大学热带作物学院,海南海口 570228;2. 海南省南繁生物安全与分子育种重点实验室/中国热带农业科学院三亚研究院/中国热带农业科学院热带生物技术研究所,海南三亚 572024摘要:番木瓜是重要的热带经济水果。
番木瓜环斑病毒(Papaya ringspot virus, PRSV)是番木瓜的重要病毒病,经常导致严重的产量损失和质量恶化。
自从1998年第一例转基因番木瓜问世以来,使得基于“致病菌衍生的抗病性(pathogen-derived resistance, PDR)”的抗病育种策略获得成功广泛应用。
然而依赖于序列同源性的抗病性与病毒突变导致多样性增加之间的矛盾成为番木瓜育种科学家的新挑战。
本研究拟采用RNAi策略针对复制酶(nuclear inclusion b. Nib)获得广谱抗PRSV番木瓜新种质。
通过团队已建立的胚性愈伤诱导-农杆菌介导转化-再生苗诱导的番木瓜遗传转化体系,共获得经过抗性筛选的再生苗52株,通过特异性PCR进行筛选共计获得24株转基因阳性植株。
通过对T0代田间自然发病试验中,转基因番木瓜株系抗病性明显高于非转基因对照,其中NibB5-2田间抗病性最优。
通过hi TAIL-PCR方法确定NibB5-2插入位点位于第2号染色体supercontig_30的1976766的位置。
T1代接种试验中,无病毒积累且无发病症状,初步确认具有良好的病毒抗性,为番木瓜抗病育种提供新思路。
关键词:番木瓜;番木瓜环斑病毒;Nib基因;RNA介导的病毒抗性中图分类号:S436.67 文献标志码:AGene Silencing of Papaya ringspot virus Replicase Gene (PRSV-Nib) to Obtain Virus Resistant PapayaWU Qinghua1,2, JIA Ruizong2*, GUO Jingyuan2, YANG Muzhi2, HU Yujuan2, HAO Zhigang2, ZHAO Hui2**, GUO Anping2**1. College of Tropical Crops, Hainan University, Haikou, Hainan 570228, China;2. Hainan Key Laboratory for Biosafety Monitor-ing and Molecular Breeding in Off-Season Reproduction Regions / Sanya Research Institutey, Chinese Academy of Tropical Agri-cultural Sciences / Institute of Tropical Bioscience and Biotechnology, Chinese Academy of Tropical Agricultural Sciences, Sanya, Hainan 572024, ChinaAbstract: Papaya is an economically important tropical fruit. Papaya ringspot virus (PRSV) is an important virus dis-ease of papaya, often causing significant yield losses and quality deterioration. Since the introduction of the first trans-genic papaya in 1998, PDR-based breeding strategies for disease resistance have been successfully applied. The contra-diction between disease resistance based on sequence homology and increased virus genetic diversity became a new challenge for papaya breeding. In this study, we propose to use RNAi strategies aim at nuclear inclusion b gene (Nib) to obtain broad-spectrum resistance to PRSV papaya. With optimized embryo callus generation-Agrobatium meidated transformation-shoot regeneration, 52 shoots were obtained after resistance screening and a total of 24 transgenic posi-tive shoots were obtained by specific PCR screening for the T0 generation. In the T0 generation field natural disease test, 收稿日期 2022-12-16;修回日期 2023-02-15基金项目 海南省重大科技计划项目(No. ZDKJ202002);海南省重点研发计划项目(No. ZDYF2022XDNY257);崖州湾科技城菁英人才项目(No. SCKJ-JYRC-2022-67)。
识别热量限制标记物和热量限制模拟物[发明专利]
![识别热量限制标记物和热量限制模拟物[发明专利]](https://img.taocdn.com/s3/m/e66c696283d049649a665861.png)
专利名称:识别热量限制标记物和热量限制模拟物
专利类型:发明专利
发明人:A·玛斯塔咯迪斯,S·伍德,T·A·波拉,J·L·巴杰,R·温德鲁奇,J·昌
申请号:CN201280039802.2
申请日:20120615
公开号:CN103732745A
公开日:
20140416
专利内容由知识产权出版社提供
摘要:通过使动物暴露于CR条件和多个对象组中选择在响应CR条件差异表达的一种或多种基因,可在选定组织中识别热量限制(CR)标记物。
通过将经所述候选化合物处理的动物与经过CR的动物中的基因表达产物的组织水平进行比较,可筛选在被给予动物时可能具有模拟CR效果能力的候选化合物。
申请人:NSE产品公司
地址:美国犹他州
国籍:US
代理机构:北京纪凯知识产权代理有限公司
更多信息请下载全文后查看。
超临界二氧化碳在水平螺旋槽管和光管管内传热特性的数值模拟

doi: 10.3969/j.issn.2095-4468.2022.04.102超临界二氧化碳在水平螺旋槽管和光管管内传热特性的数值模拟邱晗1,陶乐仁*1, 2,李猛1,林智博1(1-上海理工大学能源与动力工程学院,上海 200093; 2-上海市动力工程多相流动与传热重点实验室,上海 200093)[摘 要] 本文采用RNG k-ε湍流模型(RNG 为一种重整化群的数学方法)对超临界二氧化碳流体在主管内径为22.12 mm 、长度为960 mm 的螺旋槽管内的冷却换热进行了数值模拟,研究了入口雷诺数,入口压力和有无浮升力对管内流动传热的影响,并和水平光管内的冷却换热进行了对比。
结果表明,当入口雷诺数相同时,入口压力为8、9和10 MPa 下螺旋槽管的平均传热系数分别比光管高24.64%、28.75%、25.56%;在入口压力相同,入口雷诺数分别为35 000、45 000、55 000下螺旋槽管的湍动能分别比光管高4.4%、18.5%和16.0%;在螺旋槽管和光管中有浮升力的传热系数大于无浮升力情况下的传热系数,且相比光管,浮升力对螺旋槽管具有更大的影响。
[关键词] 超临界二氧化碳;数值模拟;螺旋槽管;冷却换热 中图分类号:TB61+1; TP391.9文献标识码:ANumerical Simulation of Heat Transfer Characteristics of Supercritical CarbonDioxide in Horizontal Spirally Fluted Tube and Smooth TubeQIU Han 1, TAO Leren *1, 2, LI Meng 1, LIN Zhibo 1(1-School of Energy and Power Engineering, University of Shanghai for Science and Technology, Shanghai 200093, China; 2-Shanghai Key Laboratory of Multiphase Flow and Heat Transfer for Power Engineering, Shanghai 200093, China)[Abstract] The cooling heat transfer of supercritical carbon dioxide fluid in a spirally fluted tube with an inner diameter of 22.12 mm and a length of 960 mm is simulated by using the RNG k-ε turbulence model. RNG is a mathematical method for renormalizing groups. The effects of inlet Reynolds number, inlet pressure and the presence of buoyant lift force on the flow heat transfer in the tube are studied. The cooling heat transfer in a horizontal smooth tube is compared with that in a horizontal smooth tube. The results show that when the inlet Reynolds number is the same, the average heat transfer coefficient of spirally fluted tube under inlet pressure of 8 MPa, 9 MPa and 10 MPa is 24.64%, 28.75% and 25.56% higher than that of light pipe, respectively. When the inlet pressure is the same and the inlet Reynolds number is 35 000, 45 000 and 55 000, the turbulent kinetic energy of spirally fluted tube is 4.4%, 18.5% and 16.0% higher than that of light pipe, respectively. The heat transfer coefficient with buoyancy in the spiral grooved tube and the smooth tube is greater than that without buoyancy, and compared with the smooth tube, the buoyancy has a greater influence on the spirally fluted tube. [Keywords] Supercritical carbon dioxide; Numerical simulation; Spirally fluted tube; Cooling and heat exchange0 引言近年来,能源短缺和环境资源破坏已经受到世*陶乐仁(1962—),教授,博士。
美国研发出可大幅提高海淡效率的二硫化钼薄膜

美国研发出可大幅提高海淡效率的二硫化钼薄膜
佚名
【期刊名称】《中国建设信息》
【年(卷),期】2016(000)003
【摘要】美国伊利诺伊州立大学研究人员2015年在《自然通讯》杂志上发表论文称,他们发现二硫化钼高能材料可更高效地去除海水中的盐分,通过计算机模拟各种薄膜的海水淡化效率并进行对比后发现。
二硫化钼薄膜的效率最高,比石墨烯膜还要高出70%。
【总页数】1页(P24-24)
【正文语种】中文
【中图分类】TQ136.12
【相关文献】
1.二硫化钼薄膜可大幅提高海水淡化效率 [J], 房琳琳
2.二硫化钼薄膜可提高海水淡化效率比石墨烯膜高出70% [J],
3.美国新技术大幅提高海水提铀效率 [J], 伍浩松;戴定
4.美国喷气推进实验室开发出一种可大幅提高Landsat图像质量的方法 [J], 岳桢干
5.美国开发出大幅提高太阳能收集能力的新技术 [J],
因版权原因,仅展示原文概要,查看原文内容请购买。
微尺燃烧及其应应用
din=1 mm, t=0.5 mm
din=2 mm, t=0.5 mm
d=2 mm
L=10, 15 and 20 mm
d=3 mm
L=10, 15 and 20 mm
ห้องสมุดไป่ตู้
d=3 mm
L=10, 15 and 20 mm
d=4 mm
L=10, 15 and 20 mm
s=0.5 mm s=1.0 mm s=0.5 mm s=1.0 mm
第7页/共13页
Wall heat flux maximization
• Cylindrical tubes with backward-facing steps 有凸台的圆管
Fixed parameters
Independent Variables
Dependant variables
After combustion experiment, surface oxidized
Challenges
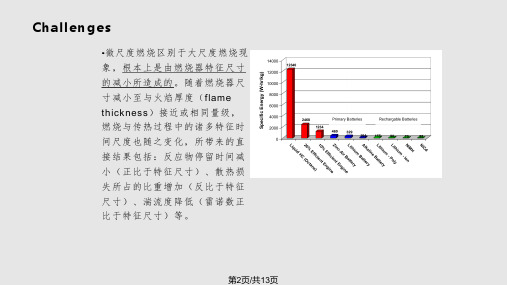
•微 尺 度 燃 烧 区 别 于 大 尺 度 燃 烧 现 象,根本上是由燃烧器特征尺寸 的减小所造成的。随着燃烧器尺 寸减小至与火焰厚度(flame thickness)接近或相同量级, 燃烧与传热过程中的诸多特征时 间尺度也随之变化,所带来的直 接结果包括:反应物停留时间减 小(正比于特征尺寸)、散热损 失所占的比重增加(反比于特征 尺寸)、湍流度降低(雷诺数正 比于特征尺寸)等。
A
B
流速 2
m/s
Φ=0.6
Φ=0.8
3 m/s
Φ=1.0
Φ=0.6
Φ=0.8
Φ=1.0
第11页/共13页
Thank you very much for your attention!
聚二甲基硅氧烷芯片自由酶反应器检测葡萄糖
聚二甲基硅氧烷芯片自由酶反应器检测葡萄糖仲海燕;周洁;余晓冬;陈洪渊【期刊名称】《分析化学》【年(卷),期】2010(38)6【摘要】应用电泳中介微分析(EMMA)技术,构建聚二甲基硅氧烷(PDMS)芯片自由酶反应器, 在线检测葡萄糖(Glu),在十字形的芯片通道上,采用自制的碳纤维微电极检测葡萄糖氧化酶(GOD)催化氧化Glu生成的H2O2,并对检测电位、GOD浓度、GOD进样时间、分离电压等参数进行了优化,测定了该自由酶反应器的线性范围和检出限,考察了其重现性及稳定性.结果表明,此自由酶反应器制作方便,操作简单,重现性好,Glu浓度在0.1~20 mmol/L之间有较好的线性关系(r=0.997),检出限为19.8 μmol/L(S/N=3).【总页数】4页(P767-770)【作者】仲海燕;周洁;余晓冬;陈洪渊【作者单位】南京大学化学化工学院,生命分析化学教育部重点实验室,南京,210093;南京大学化学化工学院,生命分析化学教育部重点实验室,南京,210093;南京大学化学化工学院,生命分析化学教育部重点实验室,南京,210093;南京大学化学化工学院,生命分析化学教育部重点实验室,南京,210093【正文语种】中文【相关文献】1.葡萄糖氧化酶修饰聚二甲基硅氧烷-纳米金电极的制备及其应用 [J], 王伟;毕连花;唐帆2.PDMS芯片自由酶反应器检测葡萄糖 [J], 仲海燕;周洁;余晓冬;陈洪渊3.PDMS芯片自由酶反应器检测葡萄糖 [J], 仲海燕;周洁;余晓冬;陈洪渊4.微型HPLC-固定化酶柱后反应器-电化学检测法测定血清和全血中的葡萄糖 [J], 邹公伟;文红梅5.用微芯片化学反应器实现酶催化化学发光测定葡萄糖的研究 [J], 徐溢因版权原因,仅展示原文概要,查看原文内容请购买。
阿联酋西部地区白垩系森诺曼阶高孔渗灰岩储层特征及控制因素

第35卷第6期2023年11月岩性油气藏LITHOLOGIC RESERVOIRSV ol.35No.6Nov.2023收稿日期:2023-06-08;修回日期:2023-07-03;网络发表日期:2023-08-11基金项目:国家自然科学基金项目“特提斯演化控制下的油气差异富集机理与勘探领域”(编号:92255302)和中国石油天然气股份有限公司科学研究与技术开发项目“海外复杂碳酸盐岩精细勘探关键技术研究”(编号:2021DJ3104)联合资助。
第一作者:罗贝维(1986—),男,博士,高级工程师,主要从事中东地区石油地质综合研究和油气勘探研究方面的工作。
地址:(100083)北京市海淀区学院路20号910信箱。
Email :************************.cn 。
文章编号:1673-8926(2023)06-0063-09DOI :10.12108/yxyqc.20230608引用:罗贝维,尹继全,胡广成,等.阿联酋西部地区白垩系森诺曼阶高孔渗灰岩储层特征及控制因素[J ].岩性油气藏,2023,35(6):63-71.Cite :LUO Beiwei ,YIN Jiquan ,HU Guangcheng ,et al.Characteristics and controlling factors of high porosity and permeability lime ‐stone reservoirs of Cretaceous Cenomanian in the western United Arab Emirates [J ].Lithologic Reservoirs ,2023,35(6):63-71.阿联酋西部地区白垩系森诺曼阶高孔渗灰岩储层特征及控制因素罗贝维1,尹继全1,胡广成2,陈华1,康敬程1,肖萌1,朱秋影1,段海岗1(1.中国石油勘探开发研究院,北京100083;2.中国石油国际勘探开发有限公司,北京100034)摘要:利用岩心及薄片分析、核磁共振、微米CT 测试、层序格架下的等时追踪及古地貌恢复等方法,对阿联酋西部地区白垩系森诺曼阶高孔渗灰岩的沉积特征、层序及沉积演化特征和成岩作用进行了系统剖析,从构造-沉积-成岩多维度对高孔渗储层的控制因素进行了研究。
我科学家在南大西洋发现5热液区多个热液异常区

我科学家在南大西洋发现5热液区多个热液异常区
佚名
【期刊名称】《科技与生活》
【年(卷),期】2011(0)7
【摘要】中国“大洋一号”科考船的环球之旅,取得丰硕的科学成果。
在南大西洋的正中央,大洋一号发现了多个新的热液区。
【总页数】1页(P4-4)
【关键词】大西洋;科学家;科学成果;大洋
【正文语种】中文
【中图分类】G316
【相关文献】
1.海底热液硫化物矿体内部流体混合过程的数值模拟:以大西洋TAG热液活动区为例 [J], 李怀明;翟世奎;于增慧;陶春辉;初凤友
2.大西洋中脊TAG热液活动区海底热液沉积物的硫同位素组成及其地质意义 [J], 曾志刚;秦蕴珊;赵一阳;翟世奎
3.南大西洋中脊热液区异化铁还原微生物及其矿化产物分析 [J], 李光玉;曾湘;邵宗泽
4.基于瞬变电磁法的南大西洋热液硫化物区电性结构 [J], 杨悦;李传顺;叶俊;李兵;党院;王赛
5.大西洋中脊TAG热液活动区中热液沉积物的稀土元素地球化学特征 [J], 曾志刚;翟世奎;赵一阳;秦蕴珊
因版权原因,仅展示原文概要,查看原文内容请购买。
鹰嘴豆壳二孢叶枯病环介导等温扩增快速检测方法[发明专利]
![鹰嘴豆壳二孢叶枯病环介导等温扩增快速检测方法[发明专利]](https://img.taocdn.com/s3/m/9e30d3c4482fb4daa48d4b54.png)
专利名称:鹰嘴豆壳二孢叶枯病环介导等温扩增快速检测方法专利类型:发明专利
发明人:马德英,马丽娟,羌松
申请号:CN201310186323.X
申请日:20130520
公开号:CN103215375A
公开日:
20130724
专利内容由知识产权出版社提供
摘要:本发明涉及一种鹰嘴豆壳二孢叶枯病环介导等温扩增快速检测方法,该方法包括真菌DNA 的提取、真菌的环介导等温扩增、显示检测步骤完成,以克服现有技术所需周期长、操作复杂等问题,该方法优点是快速、特异性强、灵敏度高,且成本低,可用于田间鹰嘴豆壳二孢叶枯病的早期诊断和病菌的监测和鉴定。
申请人:新疆农业大学
地址:830052 新疆维吾尔自治区乌鲁木齐市南昌路42号
国籍:CN
代理机构:乌鲁木齐中科新兴专利事务所
代理人:李静
更多信息请下载全文后查看。
4-吡啶基甲基-酞嗪衍生物在制备治疗骨髓增生异常综合征的药物中的用途[发明专利]
![4-吡啶基甲基-酞嗪衍生物在制备治疗骨髓增生异常综合征的药物中的用途[发明专利]](https://img.taocdn.com/s3/m/6e43596ebceb19e8b9f6ba7b.png)
专利名称:4-吡啶基甲基-酞嗪衍生物在制备治疗骨髓增生异常综合征的药物中的用途
专利类型:发明专利
发明人:M·H·杜根,A·利斯特
申请号:CN03822711.8
申请日:20030923
公开号:CN1684684A
公开日:
20051019
专利内容由知识产权出版社提供
摘要:本发明涉及治疗骨髓增生异常综合征的方法,该方法包括对需要其的温血动物施用治疗有效量的4-吡啶基甲基-酞嗪衍生物。
申请人:诺瓦提斯公司,亚利桑那州董事会代表的亚利桑那州立大学
地址:瑞士巴塞尔
国籍:CH
代理机构:北京市中咨律师事务所
更多信息请下载全文后查看。
古龙油页岩干酪根热解特性分子动力学模拟

热解产物的分布与组成
气体产物
热解过程中会产生大量的气体产物,如二氧化碳 、甲烷、氢气等。
液体产物
热解过程中也会产生一些液体产物,主要是由古 龙油页岩干酪根中的有机物质分解而成。
固体产物
热解过程中会产生一些固体产物,主要是由古龙 油页岩干酪根中的无机物质分解而成。
热解动力学参数的计算与分析
反应活化能
古龙油页岩是一种具有重要开 采价值的页岩资源
干酪根是页岩中的重要有机质 ,其热解特性对页岩气的生成
和释放具有重要影响
分子动力学模拟是一种研究物 质微观结构和性质的有效手段
研究目的和方法
研究古龙油页岩干酪根在不同温度和压力下的热 解特性
通过分子动力学模拟,揭示干酪根热解过程中的 微观机制
分析热解产物分布、反应路径和动力学参数,为 页岩气开采提供理论指导
03
分子动力学模拟方法
分子动力学模拟基本原理
分子动力学模拟是一种基于量子力学 原理的计算机模拟方法,可以研究分 子体系的运动和相互作用,从而揭示 物质的微观结构和性质。
该方法通过求解牛顿运动方程来模拟 分子的运动轨迹,进而计算体系的能 量、构型、振动频率等性质。
建立模型与参数设置
01
首先,根据实际研究对象构建一 个合理的模型,包括确定分子的 化学式、构型、原子间的相互作 用等。
研究不足与展望
01
02
03
当前研究主要集中在古龙油页岩 干酪根的化学组成和结构特性上 ,对其热解过程中的详细反应路 径和机理仍需进一步研究。
未来研究可以结合实验手段,通 过测定古龙油页岩干酪根在不同 条件下的热解产物,进一步验证 和优化分子动力学模拟结果。
针对古龙油页岩干酪根热解过程 中涉及的复杂反应机制,可以引 入更先进的计算方法和技术,深 入研究其反应细节,为其开发应 用提供更有价值的理论依据。
非离子型与阳离子型瓜尔胶复配对卷烟纸网下白水循环利用的影响

摘要:探究了添加非离子型和阳离子型瓜尔胶复配在卷烟纸网下白水封闭循环回用过程中对卷烟纸物理性能的影响。
实验结果表明:适当的白水循环能够提高填料的留着率,当白水封闭程度为40%时,填料的留着率达到最理想的41.3%;然而,随着封闭程度进一步加深,纸机环境变得恶劣,留着率最终下降到33.0%,纸张的机械强度、白度及不透明度也随之下降。
而在白水回用过程中加入非离子和阳离子型瓜尔胶可明显提高卷烟纸的物理强度,当它们的添加量分别为0.3%和0.1%时,助留和增强效果最优,填料的留着提升至51.4%,卷烟纸的抗张强度和撕裂指数分别达到为46.7 N .m/g和1.98 mN .m 2/g。
关键词:网下白水;循环回用;填料留着率;瓜尔胶;卷烟纸Abstract: This paper investigated the effect of the proportion of white water circulation and the amount of non-ionic and cationic guar gum on filler retention. The results showed that proper white water circulation can improve the retention of fillers. When the sealing degree of white water is 40%, the retention rate of fillers reached the optimal 41.3%. However, further deepening非离子型与阳离子型瓜尔胶复配对卷烟纸网下白水循环利用的影响⊙ 陈非奕1曹淑婉1余振华2*宋云杉3鲁红昌3*彭林才1张俊华1*(1.昆明理工大学化学工程学院,昆明 650500;2.云南中烟工业有限责任公司技术中心,昆明 650231;3.云南红塔蓝鹰纸业有限公司,云南建水 654300)陈非奕 女士在读硕士研究生;主要从事卷烟材料开发方面的研究。
一种可俘获二氧化碳的“热”聚合物

一种可俘获二氧化碳的“热”聚合物
佚名
【期刊名称】《化工环保》
【年(卷),期】2002(022)006
【总页数】1页(P372)
【正文语种】中文
【中图分类】X701
【相关文献】
1.一种捕获二氧化碳的“热”聚合物 [J], 彭琳
2.一种可俘获二氧化碳的“热”聚合物 [J],
3.辉绿岩脉中的俘获锆石:地壳构造-热历史的"探针"——来自玉树混杂带辉绿岩俘获锆石的研究实例 [J], 丁妍;杨天南;张洪瑞;王召林;薛万文;张玉宝
4.一种捕获二氧化碳的“热”聚合物 [J],
5.一种应用在航天回路热控系统上的二氧化碳两相冷凝器防冻设计的数值模拟 [J], 黄臻成;莫冬传;吕树申;何振辉
因版权原因,仅展示原文概要,查看原文内容请购买。
一种可俘获二氧化碳的“热”聚合物

一种可俘获二氧化碳的“热”聚合物
佚名
【期刊名称】《气体净化》
【年(卷),期】2003(003)001
【总页数】1页(P28)
【正文语种】中文
【中图分类】X701.7
【相关文献】
1.一种可俘获二氧化碳的“热”聚合物 [J],
2.一种捕获二氧化碳的“热”聚合物 [J], 彭琳
3.辉绿岩脉中的俘获锆石:地壳构造-热历史的"探针"——来自玉树混杂带辉绿岩俘获锆石的研究实例 [J], 丁妍;杨天南;张洪瑞;王召林;薛万文;张玉宝
4.一种捕获二氧化碳的“热”聚合物 [J],
5.一种应用在航天回路热控系统上的二氧化碳两相冷凝器防冻设计的数值模拟 [J], 黄臻成;莫冬传;吕树申;何振辉
因版权原因,仅展示原文概要,查看原文内容请购买。
形状记忆生物医学聚合物

形状记忆生物医学聚合物
佚名
【期刊名称】《现代化工》
【年(卷),期】2002(22)9
【总页数】1页(P65-65)
【关键词】形状记忆生物医学聚合物;德国技术与大分子化学学院;美国麻省理工学院;环状二酯;内酯;嵌段共聚物
【正文语种】中文
【中图分类】TQ324.8
【相关文献】
1.形状记忆聚合物在生物医学领域的研究进展 [J], 胡金莲
2.形状记忆聚合物特性及在生物医学领域应用中的优势 [J], 朱文超;崔海坡;郭丹一;许彦坤
3.形状记忆聚合物微纳米纤维膜在生物医学中的应用进展 [J], 郑威;王亚立;张风华;李春妍;刘彦菊;冷劲松;;;;;;
4.形状记忆聚合物在生物医学领域中的应用 [J], 卢天恒;尹玉霞;彦秉运;王鲁宁;曹明昆;张海军
5.形状记忆聚合物智能材料在生物医学领域的应用 [J], 吴雪莲;杨建;屈阳;王秀敏因版权原因,仅展示原文概要,查看原文内容请购买。
超临界混合流体辅助PtRuNi纳米粒子负载于石墨用于乙醇电催化氧化

超临界混合流体辅助PtRuNi纳米粒子负载于石墨用于乙醇电催化氧化谭东兴;李洪起;王春晓;赵健【期刊名称】《青岛科技大学学报(自然科学版)》【年(卷),期】2016(037)002【摘要】以氧化石墨(GO)为原料,利用超临界CO2和甲醇混合流体的黏度低、密度可控、表面张力为零等优点,以二甲基铵硼烷(DMAB)为还原剂将GO还原为石墨烯(RGO),并将PtRuNi、PtRu、Pt等金属纳米粒子成功地负载到石墨烯表面.通过X射线衍射(XRD)、透射电子显微镜(TEM)等方法分析了PtRuNi/RGO等复合物的结构特征,并用电化学的方法比较了PtRuNi/RGO,PtRu/RGO,Pt/RGO与PtRuNi/XC-72,PtRu/XC-72,Pt/XC-72对乙醇氧化的电催化活性.结果显示,所制备的PtRuNi/RGO具有更高的乙醇电催化效能.【总页数】6页(P151-155,161)【作者】谭东兴;李洪起;王春晓;赵健【作者单位】青岛科技大学橡塑材料与工程教育部重点实验室,山东青岛266042;青岛科技大学橡塑材料与工程教育部重点实验室,山东青岛266042;青岛科技大学橡塑材料与工程教育部重点实验室,山东青岛266042;青岛科技大学橡塑材料与工程教育部重点实验室,山东青岛266042【正文语种】中文【中图分类】O643.36+1【相关文献】1.卟啉化合物的电催化行为(Ⅵ)——在经热处理的载于石墨上的四对甲氧基苯基卟啉钴电极上半胱氨酸氧化反应的动力学研究 [J], 邓中一2.活性炭和石墨混合载体的Pt催化剂(Pt/CG)对乙醇氧化电催化活性的影响 [J], 尹蕊;邬冰;高颖3.超临界混合流体辅助PtRuNi纳米粒子负载于低缺陷石墨烯的乙醇电催化氧化性能 [J], 王希玮;殷耀禹;李洪起;赵健4.超临界CO2/甲醇流体制备PtRu/石墨烯催化剂应用于甲醇氧化 [J], 赵健;喻慧;刘振生5.在超临界流体中将PtRu纳米粒子沉积在石墨烯片层及其电催化性能研究 [J], 赵健;冯百强;刘振生因版权原因,仅展示原文概要,查看原文内容请购买。
超导体又创新纪录

超导体又创新纪录
辛渊
【期刊名称】《稀土信息》
【年(卷),期】1995(000)008
【摘要】美国新墨西哥州的洛斯阿拉莫斯国家实验室的研究人员最近开发出一种
挠性超导带,其负载电流的能力超过同类超导带的100倍。
在液氮温度(77K)下,该
超导带的负载电流密度高于1.3百万安培/厘米~2以上。
原来的超导带由“薄膜”技术制备,即
【总页数】1页(P13-13)
【作者】辛渊
【作者单位】
【正文语种】中文
【中图分类】O511
【相关文献】
1.1463 m!胜利油田钻井院新型钻头又创新纪录 [J], 科技日报
2.Kip Cullers又创大豆高产新纪录 [J], 孙寰
3.薄膜太阳能电池效率又创新纪录转换率达22.9% [J],
4.薄膜太阳能电池效率又创新纪录 [J],
5.硅量子计算又创两项新纪录 [J],
因版权原因,仅展示原文概要,查看原文内容请购买。
- 1、下载文档前请自行甄别文档内容的完整性,平台不提供额外的编辑、内容补充、找答案等附加服务。
- 2、"仅部分预览"的文档,不可在线预览部分如存在完整性等问题,可反馈申请退款(可完整预览的文档不适用该条件!)。
- 3、如文档侵犯您的权益,请联系客服反馈,我们会尽快为您处理(人工客服工作时间:9:00-18:30)。
This figure "f1.gif" is available in "gif" format from: /ps/astro-ph/0006010v1a r X i v :a s t r o -p h /0006010v 1 1 J u n 2000Turbulent Molecular Cloud Cores:Rotational Properties †Andreas Burkert 11Max-Planck-Institut f¨u r Astronomie,K¨o nigstuhl 17,D–69117Heidelberg,Germany;burkert@mpia-hd.mpg.dePeter Bodenheimer 22University of California Observatories/Lick Observatory,Board of Studies in Astronomy and Astrophysics,University of California,Santa Cruz,CA 95064;peter@ ReceivedABSTRACTThe rotational properties of numerical models of centrally condensed,turbulent molecular cloud cores with velocityfields that are characterized by Gaussian randomfields are investigated.It is shown that the observed line width–size relationship can be reproduced if the velocity power spectrum is a power-law with P(k)∝k n and n=−3to−4.The line-of-sight velocity maps of these cores show velocity gradients that can be interpreted as rotation.For n=−4, the deduced values of angular velocityΩ=1.6km s−1pc−1×(R/0.1pc)−0.5and the scaling relations betweenΩand the core radius R are in very good agreement with the observations.Asa result of the dominance of long wavelength modes,the cores also have a net specific angularmomentum with an average value of J/M=7×1020×(R/0.1pc)1.5cm2s−1with a large spread.Their internal dimensionless rotational parameter isβ≈0.03,independent of the scale radius R.In general,the line-of-sight velocity gradient of an individual turbulent core does not provide a good estimate of its internal specific angular momentum.Wefind however that the distribution of the specific angular momenta of a large sample of cores which are described by the same power spectrum can be determined very accurately from the distribution of their line-of-sight velocity gradientsΩusing the simple formula j=pΩR2where p depends on the density distribution of the core and has to be determined from a Monte-Carlo study.Our results show that for centrally condensed cores the intrinsic angular momentum is overestimated by a factor of2-3if p=0.4is used.Subject headings:hydrodynamics–stars:formation–ISM:clouds–infrared sources†UCO/Lick Observatory Bulletin,No..........1.Introduction:Rotating Cloud CoresAlthough the rotation in the dense(n∼104−105cm−3)cores of molecular clouds has small dynamical effects compared with gravity,it has important consequences once a core collapses to form a single star or binary system with associated disks.The distribution of separations of binary systems,the distribution of disk sizes,and the properties of emerging planetary systems all depend on the range of angular momenta among the different cores as well as on the angular momentum distributions within individual cores. Most theoretical calculations of the collapse of rotating cloud cores(see Bodenheimer et al.2000for a review)assume as an initial condition that the core is uniformly rotating;furthermore,the observational determination of rotational properties of cores are based upon a model of uniform rotation(Goodmanet al.1993;Goldsmith&Arquilla1985;Menten et al.1984.)However the material in molecular clouds is observed to have supersonic line widths over a wide range of scales indicating a supersonic,irregular velocityfield.The line width correlates with size,providing evidence that has been interpreted in terms of turbulent motions(Larson1981,Myers&Gammie1999;see below),probably associated with a magnetic field(Arons&Max1975).Observed line profiles in molecular clouds have been shown to be consistent with Gaussian velocityfields with a Kolmogorov spectrum(Dubinski,Narayan,&Phillips1995,Klessen2000). Even cores on scales of0.1pc or less show non-thermal motions whose velocity dispersion is comparable to, but definitely less than,the sound speed(Barranco&Goodman1998).Thus the rotational properties of cores may be more complicated than the simple law of uniform rotation would indicate.The evidence for rotation in the cores of molecular clouds(Myers&Benson1983;Goldsmith&Arquilla 1985)consists of observations of gradients in the line-of-sight velocity along cuts across the cores.Goodman et al.(1993;updated by Barranco&Goodman1998)have observed cores in the size range0.06to0.6pc in the NH3molecule,finding evidence of rotation in29out of43cases studied andfinding velocity gradientsΩin the range0.3to3km s−1pc−1(corresponding to10−14–10−13s−1).Over this range of scales,Ωscales roughly as R−0.4,and the specific angular momentum j≡J/M as inferred fromΩscales roughly as R1.6, with a value of j≈1021cm2s−1on the smallest scales measured.The dimensionless quantityβ,defined as the ratio of rotational kinetic energy divided by the absolute value of the gravitational energy,shows no trend with R and has a mean value of about0.03with a large scatter.It is also found that cores tend to have gradients that are not in the same direction as gradients found on larger scales in the immediate surroundings(Barranco&Goodman1998),an effect which again suggests the presence of turbulence.In this paper,following previous suggestions(Goldsmith&Arquilla1985;Goodman et al.1993;Dubinski et al.1995)regarding the connection between turbulence and rotation,we investigate a possible origin of rotation in turbulent cores and investigate the relationship between their line-of-sight velocity maps and their intrinsic rotational properties.Unfortunately,a complete and comprehensive theory of turbulence does still not exist.We therefore adopt the standard simple approach to describe the velocity field inside such cores by a Gaussian randomfield.This model assumes random phase correlations between the different modes.In order to analyze a large statistical sample we also neglect the coupling between the density and velocityfield,which is justified as theflow in observed molecular cloud cores is mildly subsonic. In subsequent papers we plan to include this coupling and to analyze in detail how the rotational properties change during the evolution and collapse of turbulent cores with initial Gaussian randomfields.Here,we try to answer the question whether uniform rotation is a reasonable assumption for such cores,i.e.whether the velocity gradients,determined from line-of-sight velocity maps,in combination with the assumption of rigid body rotation,provide a good estimate of the intrinsic specific angular momenta of turbulent cores.We show that even if the motions in cores are completely random,in many cases systematic velocity gradients in the line-of-sight components of the velocity are present with values that are in good agreement with the observations,that the cores can have net intrinsic angular momenta,and that the line-of-sight velocity gradients provide on average a good estimate of their distribution of specific angular momenta.In§2we describe how random velocity distributions can be derived that are consistent with observed line width–size relations.§3outlines how the projected angular velocityΩis determined from line-of-sight velocity maps.§4describes the results of a set of4000different realizations of the turbulent velocityfield and shows that the model can explain the typical values ofΩ,j,andβobserved in molecular cores.That the model also explains the trends with core size is shown in§5.§6explores the amount of intrinsic specific angular momentum of turbulent cores and the relationship between the intrinsic angular momentum and the projected velocity gradient.Conclusions are presented in§7.2.Construction of ModelsThe velocityfield v( x)can be characterized by its Fourier modes1v( x)=Gaussian randomfield with a Kolmogorov spectrum P(k)∝k−11/3.The relation between the turbulent spectrum and the line width-size relation has been discussed by Gammie&Ostriker(1996)and Myers &Gammie(1999);the latter authors also suggest random relative phases for the spectral components. Assuming an isotropic velocityfield,the Fourier components ˆv( k)are completely specified by the power spectrum P(k)= ˆv2(k) where k=| k|.The power spectrum will depend on the physical properties of the velocityfield which characterizes molecular clouds and has to be determined from the rson (1981)showed that the observed internal velocity dispersionσof a molecular cloud region is well correlated with its length scaleλ,following approximately a Kolmogorov lawσ(λ)∼λq.(2)with q≈ter work found that line width scales with clump size roughly according toσ∼λ0.5 (Leung,Kutner,&Mead1982;Scoville,Sanders,&Clemens1986;Solomon et al.1987).Additional studies (Fuller&Myers1992;Caselli&Myers1995;Myers&Fuller1992)measured slopes in the range0.25to 0.75.In a more recent investigation,Goodman et al.(1998)find that the power-law slope q depends somewhat onλwith virtually constant line widths(q=0)forλ<0.1pc and q=0.5for larger cores. Given equation(2),the power spectrum must also follow a power-lawP(k)∝k n,(3)if q>0.Its slope depends on the observed value of q,and the relation between q and n can be determined throughfiltering the velocityfield by passing over it a volume of characteristic sizeλandfiltering out waves with k<1/λ.This leads to a varianceσ2(λ)= v2( x) λ∼− ∞1/λP(k)k2dk∼λ−(n+3)(4) Note that the integral in equation(4)converges only if n<−paring equation(4)with equation(2), we can determine n from the observed line width-size relationship:n=−3−2q.(5) Typical molecular cloud cores with q≈0.5will be characterized by a power-law index n≈−4(seealso Myers&Gammie1999).In the following analysis we will explore the turbulent origin of rotation of molecular cores with a velocity power spectrum−4≤n≤−3,which seems to cover most of the observed range.The energy spectrum E(k)which corresponds to a velocity power spectrum P(k)∝k n depends on the dimensionality d of theflow and is given by(Myers&Gammie1999)E(k)∝k n+d−1.With d=3and n≈−4the corresponding energy spectrum is E(k)∝k−2.The velocityfield is calculated numerically on a Cartesian3-dimensional grid with N grid cells in each direction(Cen1992).Due to the limited resolution we only include modes withλ>2R/N.Thisis no severe restriction if N is large enough(N≥16)as waves with small wavelengths do not contribute to global rotational properties of the cores,which are preferentially determined by waves ofλ∼R.The results presented below use N=64with a cutoffat a wavelength ofλ<R/32.Test calculations with larger N=256and correspondingly smaller cutoffwavelengths show that N=64gives adequate resolution.After generating the3-dimensional velocityfield v using equation(1)we subtract the center–of–mass velocity. We adopt a coordinate system where(x,z)defines the plane of the sky and the y direction is along the line of sight.Adopting a density distributionρ( x),we now can generate two-dimensional maps,with N×N pixels,of density weighted averaged line-of-sight velocities V LS(x,z)which can be analysed and compared with the spectral line maps of observed molecular cloud cores:V LS(x,z)= ρ( l)v y( l)d lR max 2 .(7)where r is the distance from the center,and R max is the outer radius of the core,at which the density is assumed to be a factor20smaller than the central valueρc.Additional test calculations with a constant density show that the results do not depend critically on the specific choice of the density distribution. Observed cores are typically analysed within a radius R where the surface density is above half the maximum value.Here we scale all physical quantities to a typical molecular core with a radius R=0.1pc.For a core with a density distribution given by equation(7),R≈0.5R max.The data presented by Goodman et al.(1993,their table1)indicate that these cores have a wide range of masses.A rough average value is M≈5M⊙,which we adopt as the typical core mass.Their typical1-dimensional velocity dispersions areσ1d≈0.13km s−1(Goodman et al.1998);σ1d determines the amplitude A of the power spectrum P(k)=A×k n.3.Determination of the projected angular velocity and the specific angular momentumIn order to compare our models with observations,we analyze the line-of-sight velocity maps V LS (see eq.[6])using the least-squares method proposed by Goodman et al.(1993),which minimizes thedifference between the observed line-of-sight velocity map and the map expected for a rigidly rotating core. To provide an approximate match to the observations,we include only the inner regions of the cores,where the surface density is above the half-maximum value.In the case of rigid body rotation the line–of–sight velocity is given byV LS=V0+ωz x−ωx z(8)whereωz andωx are the z and x coordinates of the three-dimensional angular velocity vector,and V0is the velocity of the center of mass.This equation assumes that the rotation axis goes through the center of the core,which is the origin of the coordinate system.Note that we cannot obtain any information aboutωy from the velocity map.To determineωx andωz we minimize the errorǫ:ǫ= i(V0+ωz x i−ωx z i−V LS,i)2(9) where we sum over all pixels i lying within the inner region defined above.Here x i and z i are the x and z coordinates of the i th pixel,and V LS,i is the measured line-of-sight velocity in that pixel.We then solve the following set of equations:∂ǫ∂ωz =∂ǫK×K K×K i=1q i,where q i is its valuein the i-th pixel and K=N/2,and noting that x = z = xz =0,wefindV0= V LS =0z·V LSωx=−x2It can easily be shown that this solution minimizes the error,namely that the second derivatives are all positive.Givenωx andωz,which again are mean quantities averaged over the K×K surface,we define the projectedΩ=(ω2x+ω2z)1/2and we determine the angle of the projected rotation axis which is defined by tanα=ωz/ωx.As an additional rotational property of the core we determine its total specific angular momentumj= m v× x / m,(12) where m is the mass of a cell,and the sum goes over all cells of the three-dimensional grid which are located within the projected half-maximum region which is used to determine the projectedΩ.4.The projected rotational properties of turbulent coresAlthough the velocityfields drawn from the same P(k)are statistically equivalent,each realization results from a different set of random numbers and therefore is unique.As a result we expect that the projected and intrinsic rotational properties of the cores may differ significantly from one case to the next and will also change as a function of the index n.Examples are shown in Figure1,which illustrates3different line–of–sight velocity maps for each of the cases n=−4,−3,and−2(from top to bottom).The frames in thefirst column correspond to an example with relatively high j and highΩ,the second,to low j and highΩ,and the third,to both low j andΩ.One can clearly see that with increasing n the power on small scales increases,leading to more substructure and less systematic motion.In the remainder of the paper,we consider only the values n=−3,−4,which correspond to the range of observed q values(eq.[2]) in cores(0to0.5,respectively).The left panels of Figure1show examples of a systematic velocity gradient which can easily be interpreted as a rotation.Even for n=−3(second row of Fig.1)wefind cases with relatively well-defined velocity gradients.That there indeed exists a global projected velocity gradient that could be interpreted as rigid body rotation is illustrated in Figure2,which shows the line-of-sight component of the velocity averaged over slits parallel to the projected rotation axis as a function of distance from the axis forfive cases for n=−4,similar to that of the upper left panel of Figure1.The origin of the velocity gradients are dominant long wavelength modes with small phase shifts with respect to the core center,like v(x)=v0sin(πx/R max).In the inner regions of the projected velocity maps such a wave would indicate a rigid body rotation withΩ≈πv0/R max.The dashed lines in Figure2show the outer(not observed)parts of the cores where|v|reaches a maximum and decreases again.The probability for observing a certain value of a velocity gradient can be determined as the frequency with which such values would be found given a large number of projected velocity maps,constructed with different sets of random numbers and projection angles.The left panels in Figure3show the distributions ofΩ(upper panel),j(middle panel),andβ(lower panel),for both n=−4and n=−3,for a set of 4000random realizations in each case.Following Goodman et al.(1993)the parameterβand the specific internal angular momentum j are determined fromΩ,adopting rigid body rotation and a constant core density:j=0.4ΩR2Ω2R3β=realizations.It shows that from a typical observational sample of50cores,the average rotational properties can be determined with an accuracy of order10%.In summary,our simulations lead to the following characteristic rotational quantities for turbulent cores with n in the range−3to−4:Ω≈0.5–2.0km s−1pc−1,j≈0.5–2.5×1021cm2s−1,andβ≈0.01–0.05,with a large spread in all quantities.These values are in very good agreement with the observations (Goodman et al.,1993)which for cores with radii of0.1pc predictΩ≈1.3km s−1pc−1,β≈0.03and j≈1.2×1021cm2s−1.5.Scaling RelationsTurbulent cores,where the relevant units are the radius R,mass M,and velocity dispersionσ,have a well-defined relationship between j,Ω,β,and size:Ω∝σ/Rj∝σR(14)β∝(Ω2R3)/M∝σ2R/M.Thefirst of these relations follows from the method of determiningΩ(eq.[11])and the other two follow from equation(13)with the assumption of uniform rotation.Adopting the standard line width–size relation σ∝R0.5,wefindΩ∝R−0.5and j∝R1.5.The scaling relation forβdepends on the gravitational energy of the core,so an additional mass–radius relation is needed.Observations indicate that the velocity dispersion σ2∝M/R,leading to M∝R2,and to aβwhich is independent of radius.A similar derivation of the scaling relations has been presented by Goodman et al.(1993).Using these relations and the values forΩ, j andβas derived for0.1pc cores,we now can predict the average values of rotational properties of cores with different sizes.Figure4shows that the calculated average rotational core properties as function of radius in the range−4≤n≤−3as well as the predicted spread inβ,are in very good agreement with the observational data.In fact,in the size range above0.1pc,n=−4agrees much better than n=−3, consistent with the line width–size relation.6.The correlation between projected velocity gradient and specific angular momentumThe previous section showed that a Gaussian random velocityfield with a power spectrum that is in agreement with the line width–size relationship is a possible explanation of the rotational properties of molecular cloud cores,as inferred from line-of-sight velocity ing this model,we now investigate the relationship between the observed projected velocity gradientΩand the intrinsic angular momentum j of the cores.It is generally assumed thatΩprovides a good estimate of j.This would certainly be expected in the case of solid body rotation.There,the main uncertainty is the angle i between the line-of-sight direction and the rotation axis.For random orientations,the average value of sin2i=2/3,and the mean specific angular momentum can be determined accurately for a sample of cores of a given size.However,if cores are characterized by Gaussian randomfields the situation is much more complex and the assumption of rigid body rotation is not valid.Now the line-of-sight velocityfield does not provide a good estimate of the amplitudes and phases of the various velocity modes in the perpendicular directions. This is demonstrated in Figure5,which plotsΩversus j for a large sample of cores,generated with a power-spectrum P(k)∝k−4.Ωdoes not correlate with j.It might atfirst seem surprising that cores with small specific angular momentum can show large projected velocity gradients.To illustrate this effect let us consider a very simple velocityfield with a dominant long-wavelength mode in the x-and y-direction and with zero phase shift with respect to the center:v=v0 sin(πx R max) e x .(15) R max is the radius of the core and e x and e y are the unit vectors in the x and y directions,respectively. The caseη=−1corresponds to a vortex centered at the origin,while the caseη=+1places the origin at the“saddle point”between four vortex cells.Suppose that the line–of–sight direction is along the y-axis. AsΩis determined from the velocityfield inside a radius r≤R max/2,where sin(πx/R max)≈πx/R max, the measured velocity gradient will beΩ≈πv0/R max,independent ofη.The left panel of Figure6shows the velocityfield in the case ofη=−1.The core clearly contains a net angular momentum j around the z-axis andΩprovides a good estimate of j.However,forη=1(right panel of Fig.6),the net angular momentum is j=0whereas the value ofΩhas not changed.In summary,turbulent cores are in general not rigid body rotators.Although they could contain a netangular momentum,as shown in the previous sections,their complex velocityfield makes it impossible to determine the intrinsic angular momentum of a core,given its line-of-sight velocity map.This effect results partly from the fact that compressional velocity components introduce line-of-sight velocity gradients that are not related to rotation.The situation is however much more promising if one considers the angular momentum distribution of a large sample of cores that are all described by the same power spectrum P(k).As P does not depend on the direction of k,a set of maps of the line-of-sight velocity contains much more information regarding the internal kinematical properties of the cores.This is shown in Figure7which compares the distribution of specific angular momenta N(j pred)as inferred from the line-of-sight velocity gradientΩ(dashed lines) with the intrinsic distribution of specific angular momenta N(j)(solid lines)of cores with exponential(Fig. 7a)or constant(Fig.7b)density profiles,and with P(k)∝k−4.The values of j pred have been calculated fromΩusing the equation j pred=pΩR2with p=0.14for the exponential density sphere and p=0.4 for the constant density distribution.The intrinsic specific angular momentum j,and from this N(j),is determined using the full information of the3-dimensional velocityfield(eq.[12]),summed over the “observed”inner region.The predicted distribution is in excellent agreement with the real distribution if p is chosen carefully taking into account the underlying density profile.For the constant density case the required value of p=0.4is actually consistent with the real value of the moment of inertia.In the centrally condensed core,however,a value smaller than the actual moment of inertia(p=0.26)is required tofit the actual j-distribution.The distribution of j pred is slightly wider because this value is determined from random projections.Note that the sin i-correction is not required in this case.7.ConclusionsRandom Gaussian velocityfields with power spectra P(k)∝k−3to k−4can reproduce both the observed line width–size relationship and the observed projected rotational properties of molecular cloud cores.They therefore can be used in order to investigate their intrinsic velocityfields in detail or to generate initial conditions for simulations of core collapse and single star or binary formation.We have shown that, due to the dominant large-wavelength modes,these cores contain a non-zero specific angular momentum of order J/M=7×1020×(R/0.1pc)1.5cm2s−1.As a result of the random nature of the velocityfield, cores which are statistically identical,that is which are described by the same power spectrum,showa large spread in their rotational properties,which is in qualitative agreement with the large spread inobserved binary periods(Duquennoy&Mayor1991).However,the median j for pre-main-sequence and main-sequence binaries is about an order of magnitude less(Simon1992)than the value we derive for the cores.The line–of–sight velocity gradient does in general not provide a good estimate of the specific angular momentum of a given core.However,on a statistical basis,the distribution of projected velocity gradients Ωcan reproduce very well the distribution of the specific angular momenta j,assuming j=pΩR2,where p has to be chosen properly through a Monte Carlo study as presented in this paper.In general,p seems to be smaller than the actual value for the moment of inertia in centrally condensed cores.As a result of this effect,the specific angular momenta of cores are overestimated by roughly a factor of3if equation(13)is used.It is somewhat surprising that the shape of the angular momentum distribution as inferred from the line-of-sight velocity gradients using the simple formula of rigid body rotation is in such a good agreement with that of the intrinsic angular momentum distribution of turbulent cores.One possible explanation might be that thefluctuation spectrum is dominated by the large-scale eddies for the values of n that we consider.The effect of projection would normally result in an expectation value of j pred smaller than the actual j.This effect may be compensated through the effects of compressional modes that would contribute to the measured velocity gradient and could explain the similar shape and width of the two distributions. More detailed analysis is necessary to explain this result and to explain the relationship between the intrinsic moment of inertia and the value of p required tofit the intrinsic angular momentum distribution from the distribution of line-of-sight velocity gradients.In this paper we assumed that the velocityfield is uncorrelated with the spectral line emission and adopted a simple spherically symmetric density profile.In reality the velocityfield will affect the density distribution and vice versa.In the case of supersonic turbulence the initially Gaussian velocityfield will evolve into a system of shocks.Numerical models(e.g.Mac Low et al.1998,Ostriker et al.1999) demonstrate that in this case the initial velocityfield does indeed not provide a good estimate of the typical dynamical state of an evolved turbulent cloud.However,for the scales which are investigated in the present paper,cloud regions are mildly subsonic and no strong shocks are expected to form.One therefore might not expect a strong evolution into a dynamical state which is very different with respect to the initial power spectrum.The interaction and dynamical evolution of the velocity and densityfield in turbulent cores and itseffect on line-of-sight velocity maps as well as the core collapse and fragmentation will be investigated in detail in subsequent papers.This work was supported in part through National Science Foundation grant AST-9618548,in part through the Deutsche Forschungsgemeinschaft(DFG),and in part through a special NASA astrophysics theory program which supports a joint Center for Star Formation Studies at NASA/Ames Research Center, UC Berkeley,and UC Santa Cruz.We acknowledge helpful conversations with Richard Klein,Robert Fisher,and Chris McKee at a conference in July,1999,where we learned of their work on the collapse of turbulent molecular clouds.We also would like to thank L.Blitz,A.Goodman,and P.Myers for interesting discussions and the referee,Ralf Klessen,for many important comments.AB thanks the staffof Lick Observatory for the hospitality during his visits and PB thanks the staffof the Max-Planck-Institut f¨u r Astronomie for the hospitality during his visits.REFERENCESAndr´e,P.,Ward-Thompson,D.,&Motte,F.1996,A&A,314,625Arons,J.,&Max,C.E.1975,ApJ,196,L77Barranco,J.A.,&Goodman,A.A.1998,ApJ,504,207Bodenheimer,P.,Burkert,A.,Klein,R.I.,&Boss,A.P.2000,in Protostars and Planets IV,ed.V.Mannings,A.P.Boss,&S.S.Russell(Tucson:Univ.Arizona Press),in pressCaselli,P.,&Myers,P.C.1995,ApJ,446,665Cen,R.1992,ApJS,78,341Dubinski,J.,Narayan,R.,&Phillips,G.1995,ApJ,448,226Duquennoy,A.,&Mayor,M.1991,A&A,248,485Fuller,G.A.,&Myers,P.C.1992,ApJ,384,523Gammie,C.F.,&Ostriker,E.C.1996,ApJ,466,814Goldsmith,P.F.,&Arquilla,R.1985,in Protostars and Planets II,ed.D.C.Black&M.S.Matthews (Tucson:Univ.Arizona Press),137Goodman,A.,Benson,P.,Fuller,G.,&Myers,P.1993,ApJ,406,528Goodman,A.,Barranco,J.A.,Wilner,D.J.,&Heyer,M.H.1998,ApJ,504,223Klessen,R.S.2000,ApJ,in pressLarson,R.B.1981,MNRAS,194,809Leung,C.M.,Kutner,M.L.,&Mead,K.N.1982,ApJ,262,583Mac Low,M.-M.,Klessen,R.S.,Burkert,A.,&Smith,M.D.1998,Phys.Rev.Lett.,80,2754Menten,K.M.,Walmsley,C.M.,Kr¨u gel,E.,&Ungerechts,H.1984,A&A,137,108Myers,P.C.,&Benson,P.1983,ApJ,266,309。