作文范文之雅思小作文table
雅思表格作文
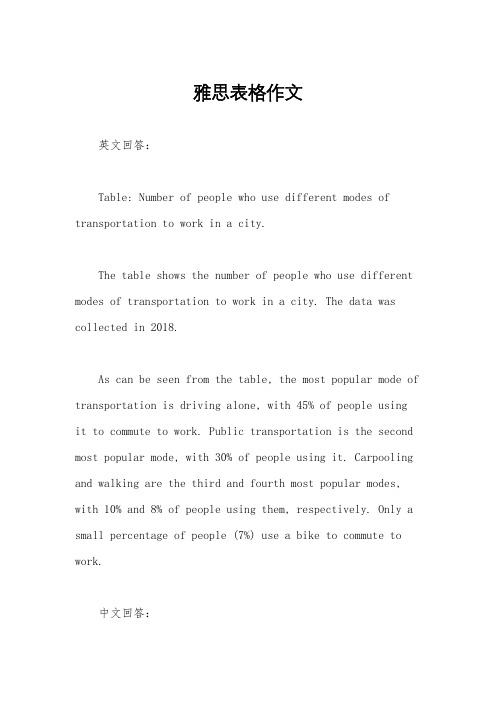
雅思表格作文英文回答:Table: Number of people who use different modes of transportation to work in a city.The table shows the number of people who use different modes of transportation to work in a city. The data was collected in 2018.As can be seen from the table, the most popular mode of transportation is driving alone, with 45% of people usingit to commute to work. Public transportation is the second most popular mode, with 30% of people using it. Carpooling and walking are the third and fourth most popular modes, with 10% and 8% of people using them, respectively. Only a small percentage of people (7%) use a bike to commute to work.中文回答:表格,在城市中使用不同交通方式上班的人数。
该表格显示了在城市中使用不同交通方式上班的人数。
数据是在2018年收集的。
从表格中可以看出,最受欢迎的交通方式是独自驾车,有45%的人使用它上下班。
公共交通是第二受欢迎的交通方式,有30%的人使用它。
拼车和步行是第三和第四受欢迎的交通方式,分别有10%和8%的人使用。
只有很少一部分人(7%)使用自行车上班。
雅思描述表格的英语作文模板
雅思描述表格的英语作文模板IELTS Table Description Essay Template.Introduction.In this essay, I will analyse the data presented in the given table, which illustrates [briefly describe the topic or subject matter of the table]. The table provides valuable insights into [mention the main aspect or trend highlighted by the table]. By examining the data, we can gain a deeper understanding of [elaborate on the importance of the topic].Overview of the Table.Before delving into the details, it is important to note the overall pattern or trend emerging from the table. [Describe the overall trend or pattern, such as an increase or decrease in a particular metric]. This overall trend suggests that [briefly explain what this trend mightindicate or imply].Detailed Analysis.Now let's delve into the specific details of the table. The table is organised into [mention the main categories or columns in the table]. Each category provides valuable information about [explain the relevance of each category to the overall topic].In the [first category], we can see that [describe the data in this category, mentioning any significant changes or patterns]. This data suggests that [explain what these changes or patterns might mean in the context of theoverall topic]. For example, [provide a specific example to illustrate your point].Moving on to the [second category], we observe that [describe the data in this category]. This trend contrasts with what we saw in the previous category, indicating that [explain the difference and its implications].The [third category] reveals an interesting pattern: [describe the pattern]. This pattern could be attributed to [suggest possible reasons or factors that might have influenced this pattern].Comparison and Contrast.When comparing the different categories in the table, it becomes evident that [mention any significant differences or similarities]. For instance, while [first category] showed a steady increase, [second category] experienced a sharp decline. This contrast highlights the complexity of [the overall topic] and suggests that [explain the implications of these differences].Conclusion.In conclusion, the data presented in the table provides a comprehensive overview of [summarise the main findings or trends]. The analysis reveals that [restate the overall trend or pattern] and this, in turn, implies that [explain the broader significance of these findings]. The table强调了数据的重要性,并提醒我们关注[提及与主题相关的关键方面或问题],这对于我们理解和应对[与主题相关的现实问题]具有重要意义。
雅思写作小作文表格题参考范文

雅思写作小作文表格题参考范文表格题的写作大家接触的比较少,可能写不好,但是一定要多练习。
因为这可是雅思小作文的常考类型之一。
下面,小编为大家提供两篇雅思写作小作文表格题参考范文,希望对大家有用。
雅思写作小作文表格题参考范文一话题:The table below shows the amount of waste production (in millions of tonnes) in six different countries over a twenty-year period.参考范文:The chart compares the amounts of waste that were produced in sixcountries in the years 1980, 1990 and 2000.In each of these years, the US produced more waste than Ireland, Japan, Korea, Poland and Portugal combined. It is also noticeable that Korea was the only country that managed to reduce its waste output by the year 2000.Between 1980 and 2000, waste production in the US rose from 131 to 192 million tonnes, and rising trends were also seen in Japan, Poland and Portugal. Japan’s waste output increased from 28 to 53 million tonnes, while Poland and Portugal saw waste totals increase from 4 to 6.6 and from 2 to 5 million tonnes respectively.The trends for Ireland and Korea were noticeably different from those described above. In Ireland, waste production increased more than eightfold, from only 0.6 million tonnes in 1980 to 5 million tonnes in 2000. Korea, by contrast, cut its waste output by 12 million tonnes between 1990 and 2000.雅思写作小作文表格题参考范文二话题:The table below shows changes in the numbers of residents cycling to work in different areas of the UK between 2001 and 2011.参考范文:The table compares the numbers of people who cycled to work in twelve areas of the UK in the years 2001 and 2011.Overall, the number of UK commuters who travelled to work by bicycle rose considerably over the 10-year period. Inner London had by far the highest number of cycling commuters in both years.In 2001, well over 43 thousand residents of inner London commuted by bicycle, and this figure rose to more than 106 thousand in 2011, an increase of 144%. By contrast, although outer London had the second highest number of cycling commuters in each year, the percentage change, at only 45%, was the lowest of the twelve areas shown in the table.Brighton and Hove saw the second biggest increase (109%) in the number of residents cycling to work, but Bristol was the UK’s second city in terms of total numbers of cycling commuters, with 8,108 in 2001 and 15,768 in 2011. Figures for the other eight areas were below the 10 thousand mark in both years.。
雅思写作小作文范文 雅思写作表格题table 耐用消费品情况.doc

雅思写作小作文范文雅思写作表格题table 耐用消费品情况今天我们雅思写作小作文范文的文章来研究下表格题table。
该图表给出了1972年到1983年之间,英国居民使用各种电器的数据。
具体条目包括中央暖气,电视,食品,吸尘器,冰箱,洗碗机,洗衣机,电话等。
其中出现的数据众多,我们可以根据多和少,或者增长和降低来分类,并且挑选最高点和最低点来进行重点说明。
小编搜集了一篇相关的高分范文,以供大家参考。
雅思写作小作文题目The table below shows the consumer durables (telephone, refrigerator, etc.) owned in Britain from 1972 to 1983.Summarise the information by selecting and reporting the main features, and make comparisons where relevant.雅思写作小作文范文The given table compares eight different consumer products possessed by the British between 1972 and 1983. As a whole, television was the most common item they were using during this period, while dishwasher, which was introduced in 1978, was the least popular durable product in the UK.上述表格比较了1972年到1983年之间英国居民所拥有的8种消费产品。
整体来看,电视机是他们在此期间最经常使用的物品。
而1978年才引入的洗碗机,是英国最不受欢迎的消费耐用品。
雅思写作小作文范文 雅思写作表格题table 六个城市的地铁信息.doc

雅思写作小作文范文雅思写作表格题table 六个城市的地铁信息今天我们雅思写作小作文范文的相关文章来研究下表格。
所谓表格,即table,是用表格的形式来展示数据的一种方式。
同样是雅思写作小作文很常见的一种题型。
我们以六个城市的地铁信息为主题,给大家准备了一篇考官范文,以供大家学习和参考。
The table shows data about the underground rail networks in six major cities.表格显示了六个主要城市中地铁网络的相关数据。
The table compares the six networks in terms of their age, size and the number of people who use them each year. It is clear that the three oldest underground systems are larger and serve significantly more passengers than the newer systems.表格在年限、大小以及每年使用的人数上对六个地铁网络进行了比较。
很显然,三个年限较久的地铁系统与新的系统相比规模较大,并且服务更多的乘客。
The London underground is the oldest system, having opened in 1863. It is also the largest system, with 394 kilometers of route. The second largest system, in Paris, is only about half the size of the London underground, with 199 kilometers of the route. However, it serves more people per year. While only third in terms of size, the Tokyo system is easily the most used, with 1927 million passengers per year.伦敦地铁是最古老的系统,开始于1863年。
雅思小作文 table
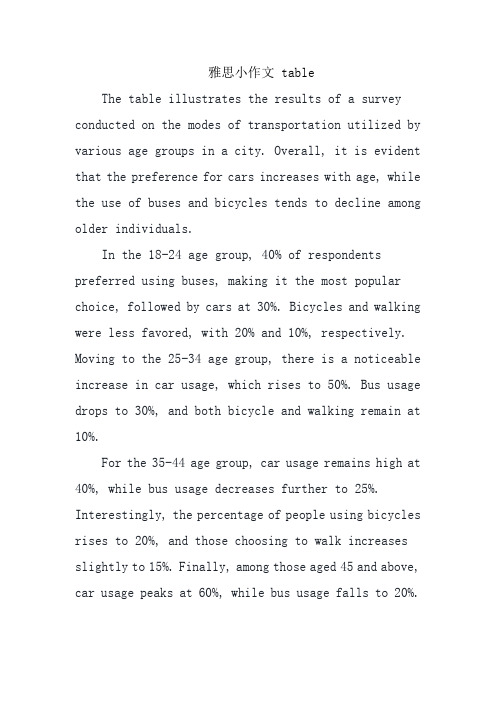
雅思小作文 tableThe table illustrates the results of a survey conducted on the modes of transportation utilized by various age groups in a city. Overall, it is evident that the preference for cars increases with age, while the use of buses and bicycles tends to decline among older individuals.In the 18-24 age group, 40% of respondents preferred using buses, making it the most popular choice, followed by cars at 30%. Bicycles and walking were less favored, with 20% and 10%, respectively. Moving to the 25-34 age group, there is a noticeable increase in car usage, which rises to 50%. Bus usage drops to 30%, and both bicycle and walking remain at 10%.For the 35-44 age group, car usage remains high at 40%, while bus usage decreases further to 25%. Interestingly, the percentage of people using bicycles rises to 20%, and those choosing to walk increases slightly to 15%. Finally, among those aged 45 and above, car usage peaks at 60%, while bus usage falls to 20%.The figures for bicycles and walking remain low at 10% each.In conclusion, the table indicates a clear trend: younger individuals tend to utilize public transportation more, whereas older groups favor cars as their primary mode of transport.中文翻译:该表格展示了对城市中不同年龄组的交通方式使用情况进行调查的结果。
雅思表格table写作模板

雅思表格table写作模板table表格图是雅思小作文考试中最主要的提醒之一,也是大家在备考的必须要准备的图形。
那么我们该怎么写呢?下面小编就为大家整理了雅思表格table写作模板,希望能给大家一些帮助和借鉴。
雅思图表写作模板-统计表table雅思小作文表格图写作技巧1. Paraphrasing the introduction.转述开头段。
2. Writing an overview.写出概述。
3. Make sure which tense and what grammar will be used?确定本篇小作文的时态。
4. What information stands out?找出图中数据极值(最大,最小)5. Grouping the information.信息分组。
7分以上范文1.The table below gives information about languages with the most native speakers.Languages with the most native speakersThe table illustrates the number of native speakers of six languages as well as the number of speakers of these languages as an additional language. It is noticeable that the number of speakers of Mandarin Chinese is strikingly higher than the other languages.People who speak Mandarin largely speak it as a first language (900 million). In comparison to this only 190 million people speak Mandarin Chinese as an additional language. What is remarkable about English speakers is that the number of speakers of English as an additional language is higher than that of native speakers of English (603 and 339 million respectively).While the total number of Hindi speakers (490 million) is roughly equal to that of Spanish speakers (420 million); when itcomes to speaking these languages as an additional language the number for Hindi is much higher (120 million) than that for Spanish (70 million).Native speakers of Arabic and Portuguese are similar in number with 206 million and 203 million respectively. However, the number of Arabic speakers as an additional language (24 million) is almost 2.5 times larger than speakers of Portuguese as an additional language.雅思写作表格图模板分享题目一:The table below shows the monthly expenditure of an average Australian family in 1991 and 2001. Summarize the information by selecting and reporting the main features, and make comparisons where relevant.下表显示了1991年和2001年澳大利亚普通家庭的月支出。
雅思写作小作文范文 雅思写作表格题table 骑行上班人数.doc

雅思写作小作文范文雅思写作表格题table 骑行上班人数今天我们雅思写作小作文范文的文章来研究下表格题table。
这张表格是关于2001年和2011年两个年份中英国骑自行车上班的人的数量。
其中包含伦敦、谢菲尔德、卡迪夫、利兹等12个城市和地区。
除了两年里骑行的具体人数,它还提供了变化的比例。
可以说数字非常之多。
小编搜集了一篇相应的考官范文,大家可以参考下考官是如何选取和比较数字的。
雅思写作小作文题目The table below shows changes in the numbers of residents cycling to work in different areas of the UK between 2001 and 2011.Summarise the information by selecting and reporting the main features, and make comparisons where relevant.雅思写作小作文范文The table compares the numbers of people who cycled to work in twelve areas of the UK in the years 2001 and 2011.这张表格比较了英国12个地区在2001年和2011年骑自行车上班的人的数量。
Overall, the number of UK commuters who traveled to work by bicycle rose considerably over the 10-year period. Inner London had by far the highest number of cycling commuters in both years.整体而言,英国骑自行车上班的通勤者的数量在这10年期间显著上升。
- 1、下载文档前请自行甄别文档内容的完整性,平台不提供额外的编辑、内容补充、找答案等附加服务。
- 2、"仅部分预览"的文档,不可在线预览部分如存在完整性等问题,可反馈申请退款(可完整预览的文档不适用该条件!)。
- 3、如文档侵犯您的权益,请联系客服反馈,我们会尽快为您处理(人工客服工作时间:9:00-18:30)。
作文范文之雅思小作文table雅思小作文table【篇一:雅思小作文表格图实例分析】雅思小作文表格图实例分析朗阁海外考试研究中心表格图是雅思小作文的常考图形之一,也是烤鸭们在备考时必须要准备的一类题型。
那么烤鸭们具体应该如何准备表格图呢?下面,朗阁海外考试研究中心的专家将以一道具体的实例,就这一题型的解题思路和步骤做出详尽的分析和解答。
the table below shows personal savings as a percentage of personal income for selected countries in 1989, 1999 and 2009. personal savings as a percentage of personal income一、审题,决定大体写作方式首先,读题目,了解到这幅表格图是关于“几个国家的人民个人收入中存款的百分比”以及三个时间点(据此,正文部分描述存款率是时态基调为过去时)。
表格上方的title和题目表述一样,没有额外信息,因此,读一遍即可。
然后,审具体表格,决定大致写作方向和方式,即分段方式。
表格的审图需要注意以下几个方面:横轴,纵轴和总体数据特征。
此图中的横纵轴分别是时间和7个研究对象——7个国家。
横纵轴中间有一栏为时间,那说明,此图原则上应该按曲线图原理来写——即,描述7个国家存款率上升或下降趋势;但是,经过下一步对表格中数据总体特征的总结发现:7个国家的存款率在这一段时间内总体呈现下降趋势。
这一发现说明,如果继续按照曲线图原理描述,文章会非常单调,而且对比的空间也不大;相反,同一年份里,几个国家之间的差距很大。
因此,正文部分应该按时间分成三个段落,对比同一时间内,7个国家之间的存款率的高低。
最后,审题的最后一关是总结表格中数据的明显特征。
正文主要是从时间角度,纵向对比几个国家。
但是,我们同时也需要反方向观察和对比,也就是,几个国家内部不同时间内存款率的起伏。
我们发现,正如以上提到的一样,7个国家的存款率在这一段时间内总体呈现下降趋势。
二、文章各部分的写作分析小作文的基本结构包括三部分:开头段,正文和结尾段。
首先,开头段落的写作方式相对比较简单——介绍接下来即将描述的是什么内容,即,改写题目。
具体可以通过近义词,修改句子结构,加信息等方法实现,如:the table shows the proportion of personal income put aside as savings in seven different countries in 1989, 1999 and 2009.正文第一段描述1989年7个国家的存款率情况。
italy的最高,应作为第一个介绍对象单独说明。
mexico的最低,也应该提及。
剩下的五个城市的数据无需一一提及,可挑选一两个相对较重要的数据做代表,通过“followed by...”等表示排序的句型进行介绍。
同时,一定注意句子与句子之间的连贯性。
如:according to the table, in 1989, italy had the highest savings rate of 29.5%, followed by france with 18.7% and japan with 17.6%. however, mexico had thelowest rate—only 5.6%.正文第二段对比第二个年份1999年几个国家的存款率。
最先描述的数据可以是这一年最大的数据,也可以为了和1989年对比先介绍89年排名第一的国家。
碰巧,此图中italy既是99年最大值也是89年最大值,所以,先介绍意大利。
同上,最低和中间数据的代表也应提及。
应该注意的是,此时,99年的数据,尤其是和89年比变化大的,应该适当和89年进行比较。
如:by 1999, italy was still the leading country, though its saving rate had dropped to 17.6%. germany was next with 13.8%(same as that in 1989) , and the rates in france and japan were close behind. in mexico, the savings rate had almost doubled to11.5%. by contrast, the uk and the usa had the lowest rates, with 8.2% and 5.5% respectively.正文第三段写作方式同正文第二段,重点纵向对比国家间比例,同时注意和前一年数据的比较。
比方说:in 2009, the savings rates leveled out considerably across the seven countries, with france and japan leading with 13.6%, followed by germany, italy and the uk at around 11%. personal savings in north america dropped sharply, with the usa at 4% and mexico at a very low 1.9%.最后,结尾段总结该表格的明显特征,即7个国家的存款率在这一段时间内总体呈现下降趋势。
overall, the proportion of income as savings in these countries, generally speaking, declined over this thirty-year period.三、检查落笔成文后,如时间允许的话,还可以进行快速的检查,查看是否有重要数据的遗漏、时态错误、单词错误拼写等小问题,尤其是平时练习中经常犯的错误。
总而言之,表格图的写作并非难事,考生们只需要按照上例顺序,了解图形特征,掌握表格类型,积累表达手段,注意连贯性和表达准确性,相信一篇出色的表格图作文应该是不成问题的。
最后,朗阁海外考试研究中心祝广大考生考出雅思好成绩。
【篇二:table小作文】the table shows that sales data gathered by an university bookshop for february,1998.there are two types men usually buy books from the bookshop. they are non-book club members and book club members. the non-book clubs member figures are consist of sales to college staff, college students and members of the public. college staff purchased 332 magaazines,44 fiction and 29 non-fiction books and 31 fiction books. more college students bought 1249 magazines ,194non-fiction books and 31 fiction books. more college students were sold to the college students. no fiction books were sold to members of public and they bought 122 non-fiction books and 82 magazines.book club members buy 76 fictions,942 non-fictions and 33 magazines. contrast to the non-book club members ,book club members bought few magazines and purchased the more fictions and non-fictions.overall the book club members bought the few books than the non-book club members.【篇三:雅思图表题作文套用模板大全】雅思图表作文模板句para1. this is a table / chart / (line线状bar柱状pie饼状)graph which demonstrate / illustrate / reveal /depict /privide information about............. para2. (1)obvious /apparent from the graph is that ...rank the first/highest,while/whereas ....turn out to be the lowest(2)it is exhibited/shown in the table that.....(3)it can be seen from the table that.....para3.(1)饼.柱图a,which accounts for...%,ranks the first;then next isb with...%;followed by c,constituting...%;finally it comes d.e.f at...%...%and...%respectively(2)特殊变化(不变,增长或下降多的)①it is worth mentioning that....②it must be pointed out that....③more striking/suprising is that....para4.to conclude /in conclusion/overallpara5. this is a graph which illustrates...这个图表向我们展示了...para6 .this table shows the changing proportion of a b from...to...该表格描述了...年到...年间a与b的比例关系。