2019年雅思写作小作文表格图解析及范文:英国人骑车
2019年雅思写作Task 1:IELTS Graphs-A common mistake
2019年雅思写作Task 1:IELTS Graphs-Acommon mistake雅思写作中,大家不注意时经常会犯各种小错误,今天我们就来看一下有哪些小错误我们能够避免呢?仔细看下面的图表以及他们的标题,图标的下方是描述图表的句子。
找找看,这些句子有哪些错误?From 1975 to 2000, hamburgers increased dramatically from 10 to 100 times per year. At the same time, fish and chipsfell significantly to just under 40.While buses fell from just over 25% to around 16% in 2000, cars increased dramatically to over 35%. Meanwhile, bikesfell over this time frame.大家有没有发现这两句话错误的地方?在第一句中,hamburgers是不能主动增加的,fish and chips也是不能主动减少的。
第二句也是同样的道理,car不能主动增加, a bus and a bike也是不能主动减少的。
那么我们应该怎样描述呢?当然是在前面加上consumption(消费)啦,hamburgers or fish and chips的销量能够上升或下降。
同样的,第二句我们能够在buses,car,bike前面加上use(使用),这样句子就说得通了。
想要写出准确的句子有很多方法,其中最重要的就是检查句子的主语是否准确。
From 1975 to 2000, the consumption of hamburgers increased dramatically from 10 to 100 times per year. At the same time, the number of times that fish and chips were eaten fell significantly to just under 40.While bus usage fell from just over 25% to around 16% in 2000, cars as a mode of travelincreased dramatically to over 35%. Meanwhile, the use of bikes fell over this time frame.Check your subject写作之前,我们应该先对图表实行总结,然后找出句子的主语,即我们需要比较什么。
小作文考官范文-表格-骑车上班
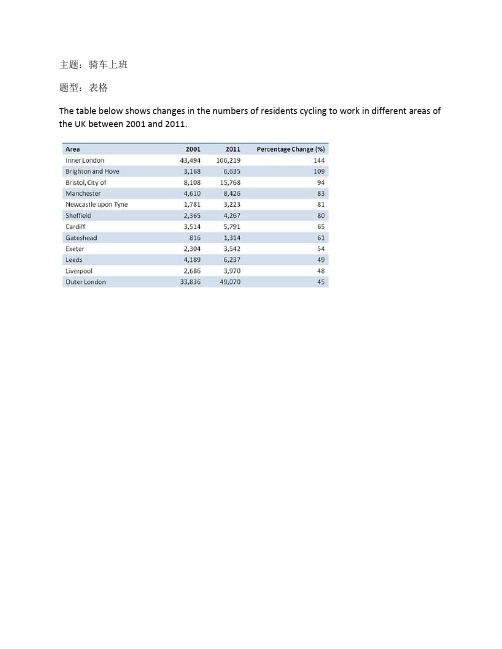
主题:骑车上班题型:表格The table below shows changes in the numbers of residents cycling to work in different areas of the UK between 2001 and 2011.满分范文:The table compares the numbers of people who cycled to work in twelve areas of the UK in the years 2001 and 2011.In 2001, well over 43 thousand residents of inner London commuted by bicycle, and this figure rose to more than 106 thousand in 2011, an increase of 144%. By contrast, although outer London had the second highest number of cycling commuters in each year, the percentage change, at only 45%, was the lowest of the twelve areas shown in the table.Brighton and Hove saw the second biggest increase (109%) in the number of residents cycling to work, but Bristol was the UK’s second city in terms of total numbers of cycling commuters, with 8,108 in 2001 and 15,768 in 2011. Figures for the other eight areas were below the 10 thousand mark in bothOverall, the number of UK commuters who travelled to work by bicycle rose considerably over the 10-year period. Inner London had by far the highest number of cycling commuters in both years.。
雅思A类小作文范文:交通出行方式对比数据
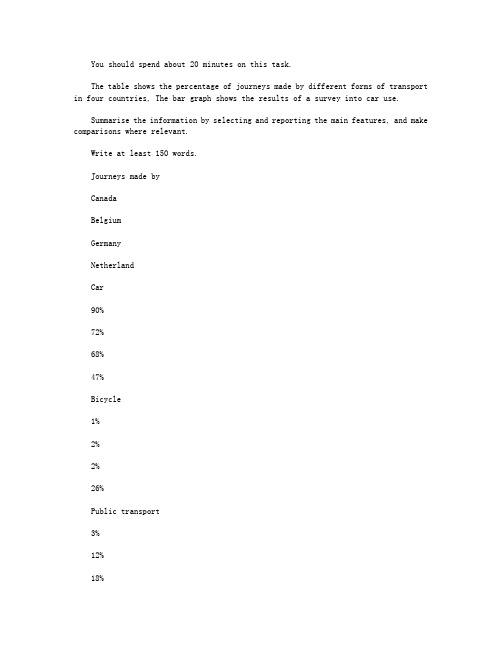
You should spend about 20 minutes on this task.The table shows the percentage of journeys made by different forms of transport in four countries, The bar graph shows the results of a survey into car use.Summarise the information by selecting and reporting the main features, and make comparisons where relevant.Write at least 150 words.Journeys made byCanadaBelgiumGermanyNetherlandCar90%72%68%47%Bicycle1%2%2%26%Public transport3%12%18%8%On foot5%11%11%18%Other1%3%1%1%Most cited reasons people travel to work by car (Canada)?The table compares modes of transport used in four countries:?Canada, Belgium, Germany and the Netherlands. Percentage of journeys made by car, bicycle, public transport and on foot are given. The bar chart shows the results of a survey into reasons people in the?Canada travel to work by car.该表比较了四个国家的运输方式:加拿大、比利时、德国和荷兰。
雅思写作小作文范文
雅思写作小作文范文在雅思写作考试中,小作文通常是图表题型,包括柱状图、饼状图、线图、表格等。
今天我们就以柱状图为例,来看一篇范文。
柱状图描述了2005年和2015年某城市居民出行方式的变化情况。
2005年,私家车出行的比例最高,达到了40%,其次是公共交通工具,占比30%,步行和骑自行车的比例分别为20%和10%。
而到了2015年,私家车出行的比例上升到了50%,公共交通工具下降到了25%,步行和骑自行车的比例分别为15%和10%。
根据上述柱状图所展示的数据,我们可以得出以下结论。
首先,私家车出行的比例明显增加,这可能是由于城市居民收入水平的提高,更多的人选择购买私家车。
其次,公共交通工具的比例有所下降,这可能是由于私家车的增加导致了居民对公共交通工具的需求减少。
最后,步行和骑自行车的比例变化不大,这表明这两种出行方式在这个城市仍然有一定的市场份额。
针对这些变化,我们可以提出一些可能的原因和建议。
首先,私家车出行的增加可能会导致交通拥堵和环境污染的加剧,因此政府可以加大对公共交通工具的投入,提高其服务质量,鼓励居民使用公共交通工具。
其次,对于步行和骑自行车的出行方式,政府可以建设更多的人行道和自行车道,提供更加便利和安全的出行环境,鼓励更多的人选择这两种环保的出行方式。
总的来说,柱状图所展示的数据反映了城市居民出行方式的变化趋势,我们需要从政府、居民和环境保护等多个角度来思考如何应对这些变化,以实现城市交通的可持续发展和居民生活质量的提高。
通过以上范文,我们可以看到,对于柱状图这一类型的小作文,我们可以采用总分总的写作结构,先对图表所展示的数据进行总体描述,然后分析数据变化的原因和可能的影响,最后给出建议或展望。
在写作过程中,要尽可能使用准确、生动、简洁的语言,保持逻辑的连贯性和文章的整体流畅性。
希望以上范文对大家在雅思写作备考中有所帮助。
雅思写作小作文范文 雅思写作折线图(线状图) 英国孩子运动.doc
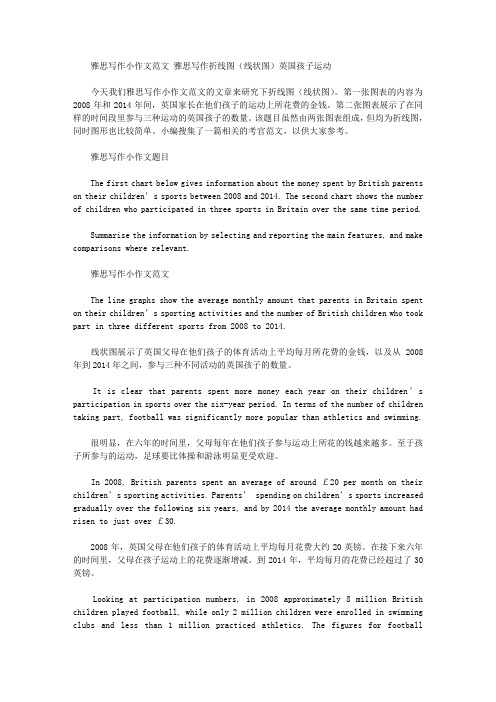
雅思写作小作文范文雅思写作折线图(线状图)英国孩子运动今天我们雅思写作小作文范文的文章来研究下折线图(线状图)。
第一张图表的内容为2008年和2014年间,英国家长在他们孩子的运动上所花费的金钱。
第二张图表展示了在同样的时间段里参与三种运动的英国孩子的数量。
该题目虽然由两张图表组成,但均为折线图,同时图形也比较简单。
小编搜集了一篇相关的考官范文,以供大家参考。
雅思写作小作文题目The first chart below gives information about the money spent by British parents on their children’s sports between 2008 and 2014. The second chart shows the number of children who participated in three sports in Britain over the same time period.Summarise the information by selecting and reporting the main features, and make comparisons where relevant.雅思写作小作文范文The line graphs show the average monthly amount that parents in Britain spent on their children’s sporting activities and the number of British children who took part in three different sports from 2008 to 2014.线状图展示了英国父母在他们孩子的体育活动上平均每月所花费的金钱,以及从2008年到2014年之间,参与三种不同活动的英国孩子的数量。
图表作文写作范例
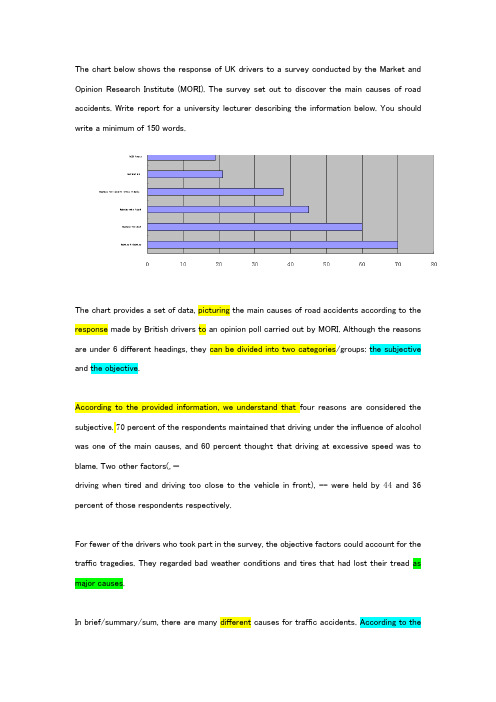
The chart below shows the response of UK drivers to a survey conducted by the Market and Opinion Research Institute (MORI). The survey set out to discover the main causes of road accidents. Write report for a university lecturer describing the information below. You should write a minimum of 150 words.The chart provides a set of data, picturing the main causes of road accidents according to the response made by British drivers to an opinion poll carried out by MORI. Although the reasons are under 6 different headings, they can be divided into two categories/groups: the subjective and the objective.According to the provided information, we understand that four reasons are considered the subjective. 70 percent of the respondents maintained that driving under the influence of alcohol was one of the main causes, and 60 percent though t that driving at excessive speed was to blame. Two other factors(, —driving when tired and driving too close to the vehicle in front), -- were held by 44 and 36 percent of those respondents respectively.For fewer of the drivers who took part in the survey, the objective factors could account for the traffic tragedies. They regarded bad weather conditions and tires that had lost their tread as major causes.In brief/summary/sum, there are many different causes for traffic accidents. According to thestatistical information, it is apparent/clear/obvious that the subjective factors overwhelm/were more significant than the objective in causing road tragedies.The pie chart below shows the average way in which foreign students learning English in London spend their money over the course of a week. Write report for a university lecturer describing the information below. You should write a minimum of 150 words.courses in London spent their money during a week. According to the statistical information, the cost is unevenly distributed among the six items.According to the information, we can understand that the cost of living (rent and food) accounted for 33% of the total money. School tuition cost students almost the same amount of money. It is another significant single cost, occupying 30%. The rest 37% of the whole sum covers the cost on 4 items, with 20% for entertainment, 7% for clothing, 5% for studySchool fees 30% Rent and food 33% Underground 5% Study material 5% Clothes 7%directly pertainning to study.The diagram below shows what happens to pollutants from farming and industry once in a river system.Summarise the information by selecting and reporting the main features, and make comparisons where relevant. Write at least 150 words.The diagram above aims to demonstrate how the two pollutants ,Nigtrogen generated from farming fertilizers, as well as heavy metals emitted from industry , interacts with a river system respectively.It is conspicuously pictured above that nitrogen, pollutants produced from fertilizers--the blue--dotted ones in the picture-- is inclined to be less densely sustained in the water, than the black-dotted heavy metals unleashed by industrial production, namely, the latter being maintained in the river in a quite longer duration. than the former.Something else which should not be neglected is that: Nitrogen from polluting fertilizers is shown absorbed by river plants living on the river bed in a process called Nitrogen Fixations, while those heaven metals originated from industry are embraced with two possibilities, some of which might find its placefrom the river bed, the rest of which may travel into the ocean carried by the water.Drawing on the above discussions, it can be safely inferred that the pollutants released from industry, heavy metals, tend to exert a longer impact on the environment than that of fertilizers.The diagram above demonstrates how the two pollutants ,Nigtrogen generated from farming fertilizers, as well as heavy metals emitted from industry , interacts with a river system.It is obviously pictured that nitrogen originating from fertilizers--the blue-dotted ones in the picture-- is much less densely sustained in the water, than the black-dotted heavy metals unleashed by industrial production, namely, the latter being maintained in the river in a quite longer duration than the former.Something else which should not be neglected is that: Nitrogen from polluting fertilizers is shown absorbed by river plants on the river bed in a process called Nitrogen Fixations, while those heaven metals originated from industry are embraced with two possibilities, some of which might find its place from the river bed, the rest of which may travel into the ocean carried by the water.Drawing on the above discussions, it can be safely inferred that the pollutants released from industry, heavy metals, tend to exert a longer impact on the environment than that of fertilizers.Given is a diagram illustrating the interaction between two types of pollutants---namely fertilizers from farming and heavy metals produced by industry---and the ecosystem of a fast flowing river. The fertilizers are denoted by blue spots, while the heavy metals are marked as black spots.From the information supplied, it is evident that fertilizers are more readily removed from the water through natural processes than heavy metals, and that the latter tend to remain in a river system for much longer periods of time. In the lower section of the diagram, plants growing on theriver bed are shown to absorb fertilizers from the water through a process known as nitrogen fixation. By contrast, heavy metals are not filtered from the river system in this way and instead either settle on the bottom or are emptied into the sea.Thus, it is reasonable to surmise that the effect of heavy metals on the environment is longer lasting than that of fertilizers.。
雅思A类小作文范文:交通出行方式对比数据
You should spend about 20 minutes on this task.The table shows the percentage of journeys made by different forms of transport in four countries, The bar graph shows the results of a survey into car use.Summarise the information by selecting and reporting the main features, and make comparisons where relevant.Write at least 150 words.Journeys made byCanadaBelgiumGermanyNetherlandCar90%72%68%47%Bicycle1%2%2%26%Public transport3%12%18%8%On foot5%11%11%18%Other1%3%1%1%Most cited reasons people travel to work by car (Canada)?The table compares modes of transport used in four countries:?Canada, Belgium, Germany and the Netherlands. Percentage of journeys made by car, bicycle, public transport and on foot are given. The bar chart shows the results of a survey into reasons people in the?Canada travel to work by car.该表比较了四个国家的运输方式:加拿大、比利时、德国和荷兰。
雅思作文英国骑车上班

雅思作文英国骑车上班Cycling to work has become increasingly popular in the UK in recent years. More and more people are choosing to ride their bikes to work for a variety of reasons.One of the main reasons for the rise in cycling commuters is the environmental benefits. Cycling is a green and sustainable mode of transportation that helps reduce carbon emissions and air pollution. By choosing to cycle to work, individuals are making a positive impact on the environment and contributing to a cleaner and healthier planet.In addition to environmental benefits, cycling to work also has numerous personal advantages. It is a great way to incorporate physical activity into daily routine, promoting a healthy lifestyle and improving overall fitness. Cycling can also help reduce stress and increase mental wellbeing, as it provides an opportunity to enjoy the fresh air and scenery during the commute.Moreover, cycling to work can be a cost-effective option for many people. With rising fuel prices andparking fees, cycling is a budget-friendly alternative that can save money on transportation expenses. It also eliminates the need for expensive gym memberships or fitness classes, as cycling itself is a form of exercise.Overall, cycling to work in the UK is a trend that is gaining momentum due to its positive impact on the environment, health, and finances. It is a practical and sustainable mode of transportation that offers a wide range of benefits to individuals and society as a whole.中文翻译:在近年来,骑自行车上班在英国变得越来越流行。
- 1、下载文档前请自行甄别文档内容的完整性,平台不提供额外的编辑、内容补充、找答案等附加服务。
- 2、"仅部分预览"的文档,不可在线预览部分如存在完整性等问题,可反馈申请退款(可完整预览的文档不适用该条件!)。
- 3、如文档侵犯您的权益,请联系客服反馈,我们会尽快为您处理(人工客服工作时间:9:00-18:30)。
2019年雅思写作小作文表格图解析及范文:英国人骑
车
The table below shows changes in the numbers of residents cycling to work in different areas of the UK between 2001 and 2011.
范文:
The table compares the numbers of people who cycled to work in twelve areas of the UK in the years 2001 and 2011.
Overall, the number of UK commuters who travelled to work by bicycle rose considerably over the 10-year period. Inner London had by far the highest number of cycling commuters in both years.
In 2001, well over 43 thousand residents of inner London commuted by bicycle, and this figure rose to more than 106 thousand in 2011, an increase of 144%. By contrast, although outer London had the second highest number of cycling commuters in each year, the percentage change, at only 45%, was the lowest of the twelve areas shown in the table.
Brighton and Hove saw the second biggest increase (109%) in the number of residents cycling to work, but Bristol was the UK’s second city in terms of total numbers of cycling commuters, with 8,108 in 2001 and 15,768 in 2011. Figures for the other eight areas were below the 10 thousand mark in both years.
(172 words, band 9)。