基于ENVI的SAR数据处理流程介绍
ENVI Sarscape入门教程V1.1

sar图像处理流程

sar图像处理流程英文回答:### SAR Image Processing Workflow.Synthetic Aperture Radar (SAR) is a remote sensing technique that utilizes the Doppler effect to generatehigh-resolution images of the Earth's surface. The SAR image processing workflow involves several key steps:1. Data Acquisition: SAR data is acquired by airborne or satellite-based platforms equipped with SAR sensors. These sensors emit microwave pulses and record the echoes reflected from the target scene.2. Radiometric Calibration: The raw SAR data undergoes radiometric calibration to correct for sensor gain and noise variations. This process converts the raw data into reflectance values that represent the scattering properties of the target.3. Geometric Correction: Geometric distortions introduced during data acquisition are rectified through geometric correction. This step corrects for platform motion, sensor geometry, and Earth curvature, resulting in a geometrically accurate image.4. Speckle Reduction: Speckle noise is an inherent characteristic of SAR images. It arises from the coherent nature of the SAR signal and can obscure image features. Speckle reduction techniques, such as filtering and multi-look processing, are employed to suppress speckle noise and enhance image quality.5. Feature Extraction: Once the SAR image is processed and cleaned, feature extraction algorithms can be applied to extract relevant information from the image. Common features extracted from SAR images include texture, shape, and intensity.6. Image Interpretation: The processed SAR image and extracted features are analyzed and interpreted to derivemeaningful information about the target scene. This step involves identifying objects, classifying land cover types, and extracting geophysical parameters.中文回答:### SAR图像处理流程。
(完整版)03-SAR数据基本处理

– 距离引起的损失(R3): 接收功率要由传播过程中从远到近的距离 变化校正
辐射定标——结果
• 一般采用以下命名
– Beta Nought (ß°) 雷达亮度(反射率)系数,在斜距方向每单位面 积的反射率单位是无量纲的。这种归一化的优点是不需要入射角 (如散射面积A)
– Sigma Nought (so), 后向散射系数,就是通常说的散射体反射回来 的雷达强度,单位是dB,Sigma nought的定义是假设入射到水平面, 其差异与入射角、波长、极化、散射体的物理性质有关
– Gamma (g) ,用入射角归一化的后向散射系数
辐射归一化
• 严格的定标之后,可识别在距离方向的后向散射系数。因 为地物反射的能量取决于入射角,实际上,获取数据的幅 宽越大,在距离向的后向散射系数的变化越大,这种变化 和散射体的物理特性有关,是不能被校正的,只能通过一 些相对的方法来弥补,如标准化
SAR基本处理技术
技术支持邮箱:ENVI-IDL@ 技术支持热线:400-819-2881-7 /enviidl
主要内容
1. 数据导入 2. 单景雷达影像处理 3. 多时相雷达影像处理
1.数据导入
数据导入
• 目的:生成SARscape识别的数据格式 • 支持SAR数据, 光学数据,高程数据
– 局部入射角校正
– 叠掩/阴影处理
左-后向散射系数,中-局部入射角地图,右-叠掩/阴影地图
练习:地理编码和辐射定标
• 工具:/SARscape/Basic/Intensity Processing/Geocoding/Geocoding and Radiometric Calibration
SAR数据介绍范文

SAR数据介绍范文合成孔径雷达(Synthetic Aperture Radar,SAR)是一种主动传感器技术,利用雷达原理来观测地面、海洋或其他目标的技术手段。
相比于光学或红外传感器,SAR技术在夜间和云雾天气下观测的能力更强,并且具有较高的分辨率和穿透能力。
在本文中,将对SAR数据的概念、特点、应用以及数据处理方法进行介绍。
SAR数据是通过合成孔径雷达观测目标后得到的原始数据。
SAR系统通过将多个雷达波束沿航迹方向合成,模拟一个大孔径雷达,从而获得高分辨率的成像能力。
SAR数据的特点是具有波束合成、多源观测、观测遥感等多种技术手段,能够实现全天候、全天时、全地域的无死角观测,并且可以提供多项地理信息。
SAR数据在地理信息领域有着广泛的应用。
首先,SAR数据广泛应用于地表覆盖分类与检测。
由于SAR传感器的波长较长,可以穿透植被,因此在植被覆盖较高或多云的区域中也可以进行有效的地表分类与检测。
其次,SAR数据还可以用于地形测量与高程提取。
SAR通过测量地表与传感器之间的距离来获取地形信息,可以精确地提取地表高程。
此外,SAR数据还可以用于水资源与冰雪监测、城市变化检测、海洋环境监测等领域。
SAR数据处理是将原始SAR数据转化为可供分析和应用的地理信息的过程。
SAR数据处理包括数据校正、数据配准、数据过滤、数据分析等步骤。
首先,数据校正是将原始SAR数据进行辐射校正、几何校正、常规校正等,以消除数据中的噪声和变形。
其次,数据配准是将不同时间或不同波长的SAR数据进行配准,以建立时间序列或多源数据的一致性。
然后,数据过滤是通过滤波或去噪的方式去除原始数据中的杂波和噪声。
最后,数据分析是利用处理后的SAR数据进行特征提取、分类分析或监测分析,以得到有用的地理信息。
在SAR数据处理中,还有一些常用的技术和方法。
首先,极化散射是利用不同极化条件下目标的散射特性进行分类与检测的方法。
极化散射可以通过SAR数据的幅度和相位的变化来获得。
基于ENVI的极化SAR数据处理流程介绍
ENVI Tutorial: Polarimetric SAR Processing andAnalysisTable of ContentsO VERVIEW OF T HIS T UTORIAL (2)Background: SIR-C/SAR (2)P REPARE SIR-C D ATA (3)Optional: Read a SIR-C CEOS Data Tape (3)Optional: Multilook SIR-C Data (3)S YNTHESIZE I MAGES (4)Default Polarization Combinations (4)Other Polarization Combinations (4)Display Images (5)Define ROIs for Polarization Signatures (6)Extract Polarization Signatures (6)Adaptive Filters (8)Slant-to-Ground Range Transformation (9)Preview CEOS Header (9)Resample Image (9)Texture Analysis (10)Create Color-coded Texture Map (10)Image-Map Output (11)Overview of This TutorialThis tutorial demonstrates the use of ENVI’s tools for analyzing polarimetric synthetic aperture radar (SAR) data. You will multilook Spaceborne Imaging Radar-C (SIR-C) from Death Valley, California; synthesize images, define ROIs for (and extract) polarization signatures, use adaptive filters, perform slant-to-ground range transformation, use texture analysis, and create an output image-map.Files Used in This TutorialENVI Tutorial Data DVD: envidata\ndv_sircFile Descriptionndv_l.cdp L-band SIR-C subset in ENVI compressed data product (.cdp) formatpol_sig.roi Region of interest (ROI) fileBackground: SIR-C/SARSIR-C is a polarimetric SAR instrument that uses two microwave wavelengths: L-band (24 cm) and C-band (6 cm). The SIR-C radar system was flown as a science experiment on the Space Shuttle Endeavor in April (SRL-1) and October 1994 (SRL-2), collecting high-quality SAR data over many sites around the world. (A second radar system, XSAR, was also flown on this mission, but these data are neither discussed nor processed here.) Additional information about SIR-C is available on the NASA/JPL Imaging Radar Home Page at /.Prepare SIR-C DataThe data used in this tutorial are a subset of L-band Single Look Complex (SLC) SIR-C data that cover the northern part of Death Valley, including Stovepipe Wells, a site of active sand dunes and extensive alluvial fans at the base of mountains. These data were preprocessed by reading and subsetting from tape and multilooking (averaging) to 13 m square pixels. The data are provided in ENVI compressed data product (.cdp) format. This non-image format is similar to the tape format and cannot be viewed until images are synthesized for specific polarizations.The first two functions described in this example—reading the data tape and multilooking—were already applied to the SIR-C data. The steps are provided here only for completeness if you want to learn more about the processes. Skip to the Synthesizing Images section if you are not interested in data preparation.Optional: Read a SIR-C CEOS Data Tape1.From the ENVI main menu bar, select File→Tape Utilities→Read Known Tape Formats→SIR-C CEOS.The SIRC Format - Load Tape dialog appears.2.Enter the tape device name and accept the default record size of 65,536. Click OK. The tape is scanned todetermine what SIR-C files it contains. A dialog appears to let you select the desired datasets. By default, ENVI reads all of the data files on the tape.3.If you do not want to read all of the data files, click Clear, then select the check box next to each desired file.Click OK.4.You can independently subset and multilook the selected data files as they are being read from tape. However,you should perform multilooking on disk (unless you have insufficient disk space) as this function is extremely slow from tape.5.Select a filename, then click Spatial Subset or Multi-Look to enter parameters for the data file. Enter anoutput filename. Each input file must have an output filename. By convention, the output filenames should take the form filename_c.cdp and filename_l.cdp for the C- and L-bands, respectively. The SIR-C data areread from the tape, and one compressed scattering matrix output file is created for selected each dataset.Optional: Multilook SIR-C DataMultilooking is a method for reducing speckle noise in SAR data and for changing the size of a SAR file. You can multilook SIR-C data to a specified number of looks, number of lines and samples, or azimuth and range resolutions. The SIR-C file used in this tutorial was a single-look dataset with a range resolution of 13 m and an azimuth size of 5 m. Multilooking has already been performed in the azimuth direction to make 13 m square pixel sizes. Instructions on multilooking are included here only for completeness.1.From the ENVI main menu bar, select Radar→Polarimetric Tools→Multilook Compressed Data→SIR-C Multilook. An Input Data Product Files dialog appears.2.Click Open File and select an input file. ENVI detects whether the file contains L- or C- band data and displaysthe filename in the appropriate field of the dialog. Click OK.3.Select the file to multilook by selecting the check box next to the name. You can select multiple files.4.Enter any one of three values—number of looks, number of pixels, or pixel size—and the other two are calculatedautomatically. Integer and floating-point number of looks are supported.5.Enter the desired Samples (range) and Lines (azimuth) values.6.Enter a base filename and click OK.Synthesize ImagesThe SIR-C quad-polarization data provided with this tutorial and available on tape from JPL are in a non-image, compressed format. Accordingly, images of the SIR-C data must be mathematically synthesized from the compressed scattering matrix data. You can synthesize images with any transmit and receive polarization combinations you want.1.From the ENVI main menu bar, select Radar→Polarimetric Tools→Synthesize SIR-C Data. An InputProduct Data Files dialog appears.2.Click Open File. A file selection dialog appears.3.Navigate to envidata\ndv_sirc and select ndv_l.cdp. Click Open. When the filename appears in theSelected Files L: field, click OK. The Synthesize Parameters dialog appears.Default Polarization CombinationsFour standard transmit/receive polarization combinations—HH, VV, HV, and TP—are listed in the Select Bands to Synthesize list of the Synthesize Parameters dialog. By default, all of these bands are selected to be synthesized.1.Enter ndv_l.syn in the Enter Output Filename field.2.Click the Output Data Type drop-down list and select Byte. This scales the output data to byte values. (If youwill be performing quantitative analysis, the output should remain in floating-point format.) Click OK. Afterprocessing is complete, four bands corresponding to the four polarization combinations are added to the Available Bands List.Other Polarization CombinationsThe transmit and receive ellipticity and orientation angles determine the polarization of the radar wave used to synthesize an image. The ellipticity angle falls between -45 and 45 degrees and determines the “fatness” of the ellipse. The orientation angle is measured with respect to horizontal and ranges from 0 to 180 degrees. You can synthesize images of non-default polarization combinations by entering the desired parameters as follows.1.From the ENVI main menu bar, select Radar→Polarimetric Tools→Synthesize SIR-C Data. The filendv_l.cdp should still appear in the Selected Files field. Click OK. The Synthesize Parameters dialog appears.2.Enter -45 in both the Transmit Ellip and Receive Ellip fields and 135 in the Transmit Orien and ReceiveOrien fields.3.Click Add Combination. This will produce a right-hand circular polarization image.4.Enter 0 in both the Transmit Ellip and Receive Ellip fields and 30 in the Transmit Orien and Receive Orienfields.5.Click Add Combination. This will produce a linear polarization with an orientation angle of 30 degrees.6.Click Clear under the list of polarization combinations to turn off synthesis of the standard polarization bands,which have already been generated.7.Select the Yes radio button for Output in dB? This will produce images that are in decibels with values typicallybetween –50 and 0.8.In the Enter Output Filename field, enter ndv_l2.syn and click OK. After processing is complete, two bandscorresponding to the polarization combinations are added to the Available Bands List.Display Images1.In the Available Bands List, select [L-TP] under ndv_l.syn and click Load Band. The SIR-C, L-band, total-power image appears in a new display group.2.From the Display group menu bar, select Enhance→Interactive Stretching. A histogram plot windowappears, which shows the current stretch (between the vertical dotted lines on the input histogram) and thecorresponding DN values in the text fields.3.Drag the dotted vertical lines to change the stretch, or enter the desired DN values into the appropriate fields.4.Enter 5 in the left Stretch field and 95 in the right field.5.From the histogram menu bar, select Stretch Type→Gaussian. Click Apply. A Gaussian stretch is appliedwith a 5% low and high cutoff.6.Generate and compare linear and square-root stretches.7.To display a color composite, select the RGB Color radio button in the Available Bands List. Select[L-HH], [L-VV], and [L-HV] in sequential order under ndv_l.syn.8.Click Display #1 and select New Display. Click Load RGB to display the HH band in red, VV in green, and HVin blue. The color variations in the images are caused by variations in the radar reflectivity of the surfaces. The bright areas in the sand dunes are caused by scattering of the radar waves by vegetation (mesquite bushes). The alluvial fans show variations in surface texture due to age and composition of the rock materials.9.Adjust the stretch as desired (Gaussian and square-root stretches work well on all three bands).10.Close the histogram plot window and Display #2 when you are finished. Keep Display #1 open for later exercises.Define ROIs for Polarization SignaturesYou can extract polarization signatures from a SIR-C compressed scattering matrix for a region of interest (ROI) or a single pixel in a polarimetric radar image. Define ROIs by selecting pixels or by drawing lines or polygons within an image.1.From the Display group menu bar, select Overlay→Region of Interest. An ROI Tool dialog appears.2.Four ROIs were previously defined and saved for use in extracting polarization signatures for this tutorial. Fromthe ROI Tool dialog menu bar, select File→Restore ROIs. A file selection dialog appears.3.Select pol_sig.roi. A dialog box appears, stating that the regions were restored. Click OK.4.Regions named veg, fan, sand, and desert pvt appear in the table in the ROI Tool and are drawn in the displaygroup.5.To draw your own ROI, select ROI_Type→Polygon, Polyline, or Point from the ROI Tool menu bar.6.Click New Region, enter a name, and choose a color.Draw polygons by clicking the left mouse button in the display group to select the endpoints of linesegments, or by holding down the left mouse button and moving the cursor for continuous drawing. Clickthe right mouse button once to close the polygon and a second time to accept the polygon.Draw polylines in the same manner as polygons. Click the left mouse button to define the line endpointsand click the right button to end the polyline and a second time to accept the polyline.Point mode is used to select individual pixels. Click the left mouse button to add the pixel currently underthe cursor to the ROI.You can select multiple polygons, lines, and pixels for each ROI.7.Repeat Step 6 to draw a second ROI. You can save the ROIs to a file and restore them later by selecting File →Save ROI from the ROI Tool dialog menu bar.Extract Polarization SignaturesPolarization signatures are 3D representations of the complete radar scattering characteristics of the surface for a pixel or average of pixels. They show the backscatter response at all combinations of transmit and receive polarizations and are represented as either co-polarized or cross-polarized. Co-polarized signatures have the same transmit and receive polarizations. Cross-polarized signatures have orthogonal transmit and receive polarizations. Polarization signatures are extracted from the compressed scattering matrix data using the ROIs for pixel locations. Polarization signatures are displayed in viewer dialogs, as shown on the next page. To extract your own polarization signatures, perform the following steps.1.From the ENVI main menu bar, select Radar→Polarimetric Tools→Extract Polarization Signatures→SIR-C. The filename ndv_l.cdp should appear in the Input Data Product Files dialog. If not, click Open File and select this file. Click OK. The Polsig Parameters dialog appears.2.Select the four ROIs (veg, fan, sand, and desert pvt) by clicking Select All Items.3.Select the Memory radio button and click OK. Four Polarization Signature Viewer dialogs appear, one for eachROI. The polarization signatures are displayed as 3D wire mesh surface plots and as 2D gray scale images. The X and Y axes represent ellipticity and orientation angles, respectively. You can selectively plot the vertical axis as intensity, normalized intensity, or dB by selecting Polsig_Data from the Polarization Signature Viewer dialog menu bar.4.Polarization signature statistics appear at the bottom of each Polarization Signature Viewer dialog. Notice therange of intensity values for the different surfaces. The smoother surfaces (sand and desert pvt) have low Z values. The rough surfaces (fan and veg) have higher Z values. The minimum intensity indicates the pedestal height of the polarization signature. The rougher surfaces have more multiple scattering and therefore higher pedestal heights than the smoother surfaces. The shape of the signature also indicates the scatteringcharacteristics. Signatures with a peak in the middle show a Bragg-type (resonance) scattering mechanism.5.In any given Polarization Signature Viewer dialog, change the Z-axis by selecting Polsig_Data→Normalizedfrom the Polarization Signature Viewer dialog menu bar. This normalizes the signature by dividing by itsmaximum; the signature is plotted between 0 and 1. This representation shows the difference in pedestal heights and shapes better, but it removes the absolute intensity differences.Alternately, select Polsig_Data → Co-Pol and Cross-Pol to toggle between co-polarized and cross-polarized signatures.e the left mouse button to drag a 2D cursor on the polarization signature image on the right side of the plot.Note the corresponding 3D cursor in the polarization plot.7.Click-and-drag any axis to rotate the polarization signature.8.You can optionally output the signatures to a file or printer by selecting File→Save Plot As or File→Printfrom the Polarization Signature Viewer dialog menu bar.9.Close the Polarization Signature Viewer and ROI Tool dialogs when you are finished.Adaptive FiltersAdaptive filters are used to reduce the speckle noise in a radar image while preserving the texture information. Statistics are calculated for each kernel and used as input into the filter, allowing the filter to adapt to different textures within the image.1.From the ENVI main menu bar, select Radar→Adaptive Filters→Gamma. A Gamma Filter Input File dialogappears with a list of open files. You can apply a filter to an entire file or to an individual band.2.In the Gamma Filter Input File dialog, click the Select by toggle button to choose Band.3.Select [L-HH] under ndv_l.syn and click OK. The Gamma Filter Parameters dialog appears.4.Accept the default values, and select the Memory radio button. Click OK.5.In the Available Bands List, click Display #1 and select New Display. Select the Gray Scale radio button,select the new band name (Gamma), and click Load Band.6.From the Display group menu bar, select Enhance→[Image] Square Root.7.In the Available Bands List, click Display #2 and select Display #1. Select [L-HH] under ndv_l.syn, andclick Load Band.8.From the Display #1 menu bar, select Enhance→[Image] Square Root.9.From any Display group menu bar, select Tools→Link→ Link Displays. The Link Displays dialog appears.Click OK to link the gamma-filtered L-HH image (Display #2) with the original L-HH image (Display #1).10.Click in an Image window to toggle between the two images, using the dynamic overlay feature. The figure belowshows a portion of the original image (left) and the gamma-filtered image (right).11.Close Display #2 when you are finished. Leave Display #1 (ndv_l.syn) open for the next exercise.Slant-to-Ground Range TransformationA radar system looks to the side and records the locations of objects using the distance from the sensor to the object along the line of sight, rather than along the surface. An image collected using this geometry is referred to as a slant range image. Slant range radar data have a systematic geometric distortion in the range direction. The true, or ground range, pixel sizes vary across the range direction because of the changing incident angles. This makes the image appear compressed in the near range, relative to what it would look like if all of the pixels covered the same area on the ground. Slant-to-ground range correction for SIR-C is performed on synthesized images. In other words, the correction is not performed on the entire SIR-C compressed data product file. However, this file does store the required information in the CEOS header about the sensor orientation.Preview CEOS Header1.From the ENVI main menu bar, select Radar→Open/Prepare Radar File→View Generic CEOS Header. Afile selection dialog appears. You must select the original unsynthesized data file from which to extract thenecessary information.2.Select ndv_l.cdp and click Open. A CEOS Header Report dialog appears. Scroll down and note that the linespacing (azimuth direction) is 5.2 m, while the pixel spacing (slant range direction) is 13.32 m. Close the CEOS Header Report dialog when you are finished reviewing it.Next, you will use the Slant-to-Ground-Range function to resample the image to square 13.32 m pixels, thusremoving slant range geometric distortion.Resample Image3.From the ENVI main menu bar, select Radar→Slant to Ground Range→SIR-C. A file selection dialogappears.4.Select ndv_l.cdp and click Open. The Slant Range Correction Input File dialog appears.5.Select ndv_l.syn and click OK. The Slant to Ground Range Correction Dialog appears. ENVI automaticallypopulates the Instrument height (km), Near range distance (km), and Slant range pixel size (m) fields withinformation from the CEOS header.6.Enter 13.32 in the Output pixel size (m) field to generate square ground-range pixels.7.From the Resampling Method drop-down list, select Bilinear.8.In the Enter Output Filename field, enter ndv_gr.img. Click OK. The input image is resampled to square13.32 m pixels. Four new bands appear in the Available Bands List. Band 1 of the resampled image correspondsto the L-HH band of the original, slant-range image (ndv_l.syn), Band 2 corresponds to L-VV, etc.9.In the Available Bands List, click Display #1 and select New Display.10.Select a band from the resampled image and click Load Band. The resampled image appears in Display #2.Make sure Display #1 (ndv_l.syn) shows the corresponding polarization band.pare the two images.12.When you are finished comparing images, close Display #2. Keep Display #1 (ndv_l.syn) open for the nextexercise.Texture AnalysisTexture is a measure of the spatial variation in the gray levels in the image, as a function of scale. ENVI calculates texture based on a processing window size you specify. The texture measures demonstrated in this tutorial are Occurrence Measures, including data range, mean, variance, entropy, and skewness. These terms are explained in ENVI Help. Texture is best calculated for radar data with no resampling or filtering applied.1.From the ENVI main menu bar, select Radar→Texture Filters→Occurrence Measures. A Texture InputFile dialog appears.2.Click the Select By toggle button to choose Band. Select [L-HH] under ndv_l.syn and click OK. An OccurrenceTexture Parameters dialog appears.3.Deselect all of the Textures to Compute options except for Data Range.4.Set the Processing Window: Rows and Cols to 7 and 7.5.In the Enter Output Filename field, enter ndv_hh.tex and click OK.Create Color-coded Texture Map6.In the Available Bands List, click Display #1 and select New Display.7.Select Data Range under ndv_hh.tex and click Load Band.8.From the Display #2 menu bar, select Enhance→[Image] Square Root.9.From any Display group menu bar, select Tools→Link→ Link Displays. The Link Displays dialog appears.Click OK to link the original image (Display #1) with the colored texture image (Display #2).10.Click in an Image window to toggle between the two images.11.Double-click inside an Image window to display the Cursor Location/Value tool. Examine the data values in thetextured image, and compare these to the original image.12.From the Display #2 menu bar, select Tools→Color Mapping→Density Slice. A Density Slice Band Choicedialog appears.13.Select the Data Range band and click OK. A Density Slice dialog appears.14.Accept the default ranges by clicking Apply.15.Try creating your own density-sliced image and view the results.16.Keep Display #2 open for the next exercise.Image-Map OutputIn this exercise, you will create a map of your color-coded textured image and add a border and map key.1.From the Display #2 menu bar, select Overlay→Annotation. An Annotation dialog appears.2.From the Annotation dialog menu bar, select Options→Set Display Borders.3.In the Display Borders dialog, enter 100 in the upper field, and leave the remaining fields 0.4.Click Border Color and select Items 1:20→White. Click OK. This adds a 100-pixel white border at the top ofthe image.5.Move the Image box in the Scroll window to the top of the image containing the border.6.Enter a map title in the empty field in the Annotation dialog. Set the Size value to 16. Click the Color box onceto select black.7.Click in the Image window to show the map title, then move it inside the white border to the far left. Right-clickto lock the map title in place. You can place multiple text items on the image in this manner, and you can change their font size, type, color, and thickness as desired.8.From the Annotation dialog menu bar, select Object→Color Ramp.9.Enter Min and Max values of 0 and 255 respectively, set Inc to 4, and set the font Size to 14 to annotate thecolor ramp.10.Click in the Image window to show the map key, move it inside the white border to the far right, then right-clickto lock it in place. The following figure shows a sample map; your results may be different.11.Save the image to a PostScript file by selecting File→Save Image As→Postscript File from the Display #2menu bar. An Output Display to PostScript File dialog appears.12.Leave the default values, and enter an output filename or accept the default name of ndv_hh.ps. Click OK.Or, output the map directly to your printer by selecting File → Print from the Display #2 menu bar.13.When you are finished, select File→Exit from the ENVI main menu bar.。
基于ENVI的TM与SAR数据融合处理流程介绍
ENVI Tutorial:Landsat TM and SAR DataFusionTable of ContentsO VERVIEW OF T HIS T UTORIAL (2)D ATA F USION (3)Preparing Images (3)R OME,I TALY,D ATA F USION E XAMPLE (4)Read and Display Images (4)Register the TM image to the ERS-2 image (4)Perform HSI Transform to Fuse Data (5)Display and Compare Results (5)Overview of This TutorialThis tutorial is designed to demonstrate selected ENVI data fusion capabilities. You will co-register Landsat Thematic Mapper (TM) data and ERS-2 synthetic aperture radar (SAR) data of Rome, Italy using image-to-image registration. You will fuse the two datasets using a hue-saturation-intensity (HSI) color transform, and you will compare the fused data to the individual datasets.ERS-2 and Landsat images used in this tutorial are provided courtesy of the European Space Agency (ESA) and Eurimage (used with permission) and may not be redistributed without explicit permission from these organizations.For additional data fusion details, please see ENVI Help.Files Used in This TutorialENVI Resource DVD: envidata/rometm_ersFile Descriptionrome_tm (.hdr) Landsat TM data of Rome, Italyrome_ers2 (.hdr) ERS-2 SAR data of Rome Italyromr_tm.pts Ground control points (GCPs) for image-to-imageregistrationData FusionData fusion is the process of combining multiple image layers into a single composite image. It is commonly used to enhance the spatial resolution of multispectral datasets using high spatial resolution panchromatic or single-band SAR data.The following sections demonstrate the preparation required to fuse image datasets in ENVI, and how to perform data fusion.Preparing ImagesTo perform data fusion in ENVI, the files must either be georeferenced (in which case spatial resampling is performed on the fly), or, if not georeferenced, cover the same geographic area, have the same pixel size, have the same image size, and have the same orientation. The files used in this exercise are not georeferenced. Therefore, the low spatial resolution images must be resampled to have the same pixel size as the high spatial resolution image (using nearest-neighbor resampling).Rome, Italy, Data Fusion ExampleRead and Display Images1.From the ENVI main menu bar, select File→ Open Image File. Navigate to envidata\rometm_ers andselect rome_ers2. Click Open. This file contains ERS-2 SAR data.2.In the Available Bands List, select the Gray Scale radio button. Select Band 1 under rome_ers2 and click LoadBand.3.From the ENVI main menu bar, select File→Open Image File. Select rome_tm. Click Open. This file containsLandsat TM data.4.In the Available Bands List, click Display #1 and select New Display.5.Select the RGB Color radio button. Select Band 4, Band 3, and Band 2 in sequential order. Click Load RGB todisplay rome_tm as a false-color composite into Display #2.Following is a comparison of the Landsat TM false-color composite (left) and the ERS-2 SAR gray scale image(right):Register the TM image to the ERS-2 image1.From the ENVI main menu bar, select Map →Registration→Select GCPs: Image-to-Image. An Image toImage Registration dialog appears.2.Under Base Image, select Display #1 (ERS-2 data). Under Warp Image, select Display #2 (TM data). ClickOK. A Ground Control Points Selection dialog appears.3.From the Ground Control Points Selection dialog menu bar, select File→Restore GCPs from ASCII. A fileselection dialog appears.4.Select rome_tm.pts and click Open.5.Pre-selected GCPs are loaded into both the TM and ERS-2 display groups. Review the positions of these points inboth images for accuracy, and observe the total RMS error listed at the bottom of the Ground Control PointsSelection dialog.6.Click Show List. In the Image to Image GCP List that appears, scroll to the right and review the RMS values foreach GCP. These GCPs are sufficient for a quick registration and for this exercise; however, adding more GCPs will improve the match between images. See the tutorial Image Georeferencing and Registration for additional details about performing image-to-image registration. From the Ground Control Points Selection dialog menu bar, select File→Cancel.7.From the Ground Control Points Selection dialog menu bar, select Options→Warp File. A file selection dialogappears. Select rome_tm and click OK to warp all seven TM bands to match the ERS-2 data. A RegistrationParameters dialog appears.8.Enter the following values for Output Image Extent:Upper Left X: 1Upper Left Y: 1Output Samples: 5134Output Lines: 55499.Accept the default values for the remaining fields. In the Enter Output Filename field, enter register_tm.Click OK to perform the image-to-image registration.10.In the Available Bands List, click Display #2 and select New Display.11.In the Available Bands List, select the RGB Color radio button. Select Warp bands 4, 3, and 2 underregister_tm and click Load RGB to display the registered TM image as a false-color composite in Display #3.Perform HSI Transform to Fuse Data1.From the ENVI main menu bar, select Transform→Image Sharpening→HSV. A Select Input RGB dialogappears.2.Select Display #3 (which contains register_tm) and click OK. A High Resolution Input File appears.3.Select Band 1 under rome_ers2 and click OK. An HSV Sharpening Parameters dialog appears.4.In the Enter Output Filename field, enter rome_fused.img and click OK.Display and Compare Results1.In the Available Bands List, select the RGB Color radio button. Click Display #2.2.Select the HSV Sharp R, G, and B bands under rome_fused.img in sequential order. Click Load RGB to loadthe HSV-sharpened, fused, color image into Display #2, replacing the original TM image.Following is a subset of the fused image:3.From a Display group menu bar, select Tools→Link→Link Displays. A Link Displays dialog appears.4.Click OK to link Display #1 (original ERS-2 image), Display #2 (fused image), and Display #3 (registered TMimage). Compare these three images.5.Try fusing other color composites with the ERS-2 data as above and compare the results.6.When you are finished, exit ENVI.。
envi遥感预处理步骤

ENVI遥感预处理步骤通常包括以下几个主要步骤:
1. 数据导入:将遥感数据导入ENVI软件中。这可以包括多光谱影像、高光谱影像、雷达 数据等不同类型的遥感数据。
2. 大气校正:对于可见光和近红外波段的数据,大气校正是必要的。它通过去除大气散射 和吸收效应,使得数据更加准确和可比较。常用的大气校正方法包括大气点校正(ATCOR) 、大气校正模型(ACORN)等。
8. 数据校验和验证:对预处理后的数据进行质量检查和验证,确保数据的准确性和可靠性。
以上是ENVI遥感预处理的一般步骤,具体的步骤和方法可能会根据不同的研究目的和数据类 型而有所不同。
ቤተ መጻሕፍቲ ባይዱ
5. 去噪处理:去噪处理是为了去除遥感数据中的噪声和杂波,以提高图像质量和准确性。 常用的去噪方法包括滤波、小波变换等。
envi遥感预处理步骤
6. 数据裁剪和子集提取:根据研究需求,对遥感数据进行裁剪和子集提取,以提取感兴趣区 域的数据,减少数据处理的复杂性。
7. 影像增强:影像增强是为了改善遥感图像的视觉效果和信息提取能力。常用的增强方法包 括直方图均衡化、拉伸、滤波、波段组合等。
envi遥感预处理步骤
3. 辐射校正:辐射校正是为了将原始遥感数据转换为反射率或辐射亮度,以消除不同时间 、不同地点的数据之间的辐射差异。这可以通过校正系数、大气透过率和太阳辐射等参数来 实现。
4. 几何校正:几何校正是为了将遥感数据与地理坐标系统对齐,以便进行地理空间分析。 这包括图像配准、地面控制点的选择、投影转换等步骤。
一种基于遥感数据与多时相sar影像的林地生态监测方法与流程

一种基于遥感数据与多时相sar影像的林地生态监测方法与流程基于遥感数据与多时相SAR影像的林地生态监测方法与流程如下:1. 数据收集:收集林地生态监测所需的遥感数据和多时相SAR影像。
遥感数据可以包括卫星图像、航空影像或无人机影像,而多时相SAR影像则可通过雷达卫星获取。
2. 影像预处理:对收集到的遥感数据和多时相SAR影像进行预处理,包括辐射定标、大气校正、几何校正等,以确保数据质量。
3. 特征提取:利用遥感数据和多时相SAR影像提取林地生态监测所需的特征。
如植被指数、覆盖度、植被高度等。
4. 数据融合:将提取到的特征进行数据融合,以得到更全面、准确的林地生态信息。
融合方法可以包括像素级融合、特征级融合等。
5. 林地变化检测:利用融合后的数据进行林地变化检测。
可以应用时序分析、差异图像比较等方法,检测林地的生长、衰退、破坏等变化。
6. 生态参数估计:通过林地生态监测数据,估计林地的生态参数,如生物量、碳储量、物种多样性等。
可以建立统计模型或机器学习模型进行估计。
7. 结果分析与展示:对监测结果进行分析和展示,利用地理信息系统(GIS)分析工具,绘制监测结果的空间分布图、统计图等。
8. 定期监测:建立定期监测机制,定期更新和收集遥感数据和多时相SAR影像,以监测林地生态的长期变化和动态演变。
9. 验证与验证:对监测结果进行验证和验证,与地面调查数据进行对比,评估监测结果的准确性和可信度。
10. 决策支持:利用监测结果为林地生态管理和保护提供决策支持,优化林地利用方案,制定生态保护政策等。
以上是一种基于遥感数据与多时相SAR影像的林地生态监测方法与流程,旨在利用遥感技术的优势,提供全面、准确的林地生态信息,为林地保护、管理和决策提供科学依据。
实际操作中,可以根据具体需求和条件进行适当调整和改进。
ENVI对SAR大数据地预处理过程(详细版)
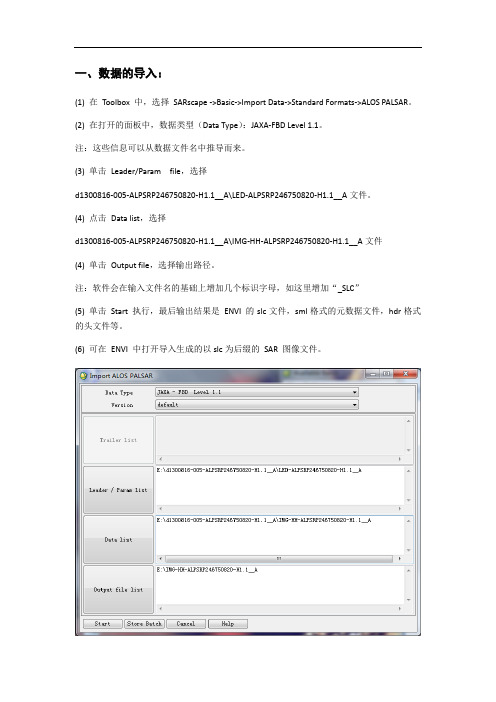
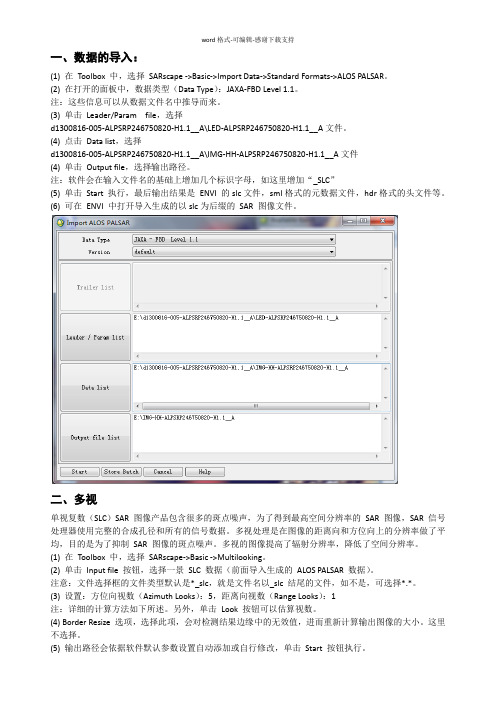
一、数据的导入:(1) 在Toolbox 中,选择SARscape ->Basic->Import Data->Standard Formats->ALOS PALSAR。
(2) 在打开的面板中,数据类型(Data Type):JAXA-FBD Level 1.1。
注:这些信息可以从数据文件名中推导而来。
(3) 单击Leader/Param file,选择d1300816-005-ALPSRP246750820-H1.1__A\LED-ALPSRP246750820-H1.1__A文件。
(4) 点击Data list,选择d1300816-005-ALPSRP246750820-H1.1__A\IMG-HH-ALPSRP246750820-H1.1__A文件(4) 单击Output file,选择输出路径。
注:软件会在输入文件名的基础上增加几个标识字母,如这里增加“_SLC”(5) 单击Start 执行,最后输出结果是ENVI 的slc文件,sml格式的元数据文件,hdr格式的头文件等。
(6) 可在ENVI 中打开导入生成的以slc为后缀的SAR 图像文件。
二、多视单视复数(SLC)SAR 图像产品包含很多的斑点噪声,为了得到最高空间分辨率的SAR图像,SAR 信号处理器使用完整的合成孔径和所有的信号数据。
多视处理是在图像的距离向和方位向上的分辨率做了平均,目的是为了抑制SAR 图像的斑点噪声。
多视的图像提高了辐射分辨率,降低了空间分辨率。
(1) 在Toolbox 中,选择SARscape->Basic ->Multilooking。
(2) 单击Input file 按钮,选择一景SLC 数据(前面导入生成的ALOS PALSAR 数据)。
注意:文件选择框的文件类型默认是*_slc,就是文件名以_slc 结尾的文件,如不是,可选择*.*。
(3) 设置:方位向视数(Azimuth Looks):5,距离向视数(Range Looks):1注:详细的计算方法如下所述。
SAR遥感数据处理与应用技术研究
SAR遥感数据处理与应用技术研究遥感数据处理与应用技术是当前遥感领域研究的热门方向之一。
特别是对于SAR(合成孔径雷达)遥感数据处理与应用技术的研究,具有重要的意义和广阔的应用前景。
本文将介绍SAR遥感数据处理与应用技术的相关内容,包括数据处理方法、应用领域和研究进展。
一、SAR遥感数据处理方法SAR遥感数据的特点决定了其需要特定的处理方法。
SAR数据具有高分辨率、全天候、全天时观测的特点,但也存在噪声、多路径效应和复杂散射等问题。
为了充分利用SAR数据的信息,需要对其进行相应的处理。
常用的SAR遥感数据处理方法包括图像预处理、滤波处理、散射机制分析和干涉处理等。
图像预处理是SAR数据处理的基础,包括图像去斑点、辐射校正、几何校正等。
滤波处理是为了降低噪声、平滑图像并提取目标信息。
常用的滤波方法有均值滤波、中值滤波、小波滤波等。
散射机制分析是对SAR图像的反射机制进行分析,以了解目标的散射特性。
干涉处理是通过比较两次或多次SAR图像之间的相位差,推测地物的高度和变化。
二、SAR遥感数据应用技术SAR遥感数据的应用技术广泛涉及地质勘探、农林业监测、自然灾害监测等多个领域。
以下将分别介绍几个典型的应用领域。
1. 地质勘探SAR遥感数据在地质勘探中具有独特的优势。
利用SAR数据,可以实现地下结构的观测和勘探,识别地下矿产资源等。
通过SAR数据处理和解译,可以提取地下结构的地形特征和散射特性,进而推测地下物质的性质和分布。
这对于矿产资源勘探和地质灾害预警等具有重要意义。
2. 农林业监测SAR遥感数据在农林业监测中的应用已经得到广泛认可。
利用SAR数据,可以实现对农作物、森林等地表覆盖的监测与评估。
通过SAR数据处理和解译,可以提取农作物的生长状态、森林的生长情况等信息。
这对于农业灾害监测、粮食安全评估和森林资源管理等提供了有力的支持。
3. 自然灾害监测SAR遥感数据在自然灾害监测中发挥着重要的作用。
利用SAR数据,可以实现对地震、滑坡、火灾等自然灾害的监测和预警。
解决ENVI SARscape里面SAR数据地理编码添加DEM数据的问题
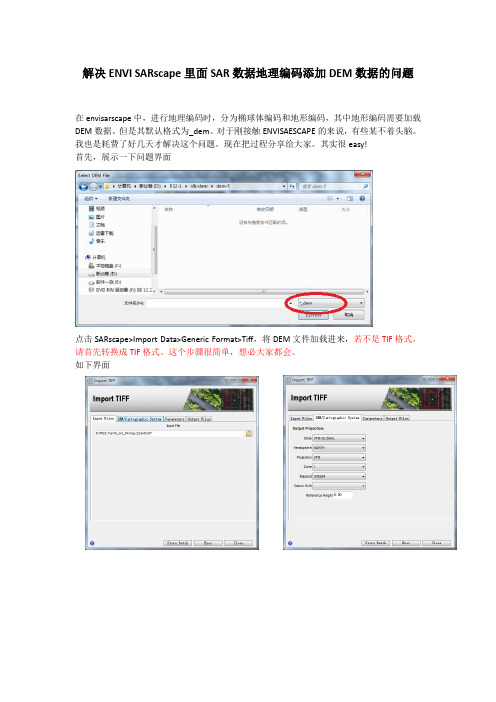
解决ENVI SARscape里面SAR数据地理编码添加DEM数据的问题
在envisarscape中,进行地理编码时,分为椭球体编码和地形编码,其中地形编码需要加载DEM数据。
但是其默认格式为_dem。
对于刚接触ENVISAESCAPE的来说,有些某不着头脑。
我也是耗费了好几天才解决这个问题。
现在把过程分享给大家。
其实很easy!
首先,展示一下问题界面
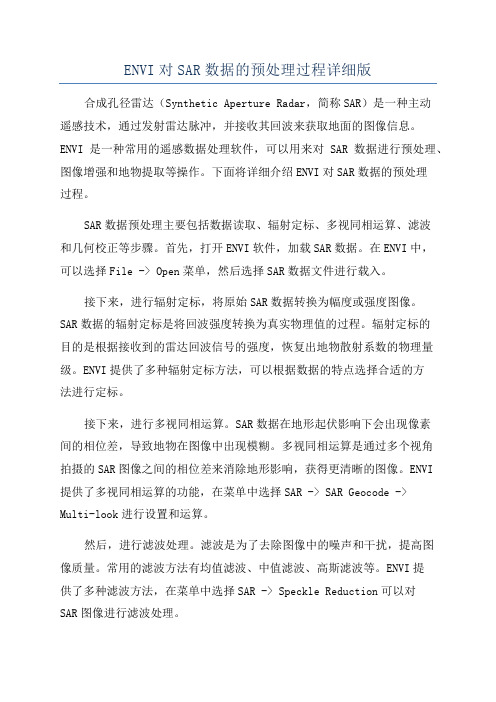
点击SARscape>Import Data>Generic Format>Tiff,将DEM文件加载进来,若不是TIF格式,请首先转换成TIF格式。
这个步骤很简单,想必大家都会。
如下界面
And then
这时候,再在SARscape>Basic>Intensity>Geocoding>Geocoding and Radiometric Calibration中,进行地理编码。
这个时候的文件夹里就能看到_dem的文件了。
其实很简单,就是要把DEM转成SARscape可以接受的格式。
sar影像处理轨道纠正处理

SAR(Synthetic Aperture Radar,合成孔径雷达)影像处理中的轨道纠正是一个关键步骤,用于校正由于卫星轨道不完美引起的影像畸变。
这个过程旨在使SAR影像在地球上的位置准确,以便进一步的应用,比如地图制图、地表变化检测、环境监测等。
以下是一般的轨道纠正处理步骤:1. **卫星轨道数据获取:** 首先需要获取卫星的轨道数据,包括卫星的位置、速度、姿态等信息。
这些数据通常由卫星运营商提供,也可以从其他资源获得。
2. **SAR数据预处理:** 在进行轨道纠正之前,需要对原始SAR数据进行一些预处理步骤,包括校正辐射斜距、去除大气和干涉等。
3. **地球表面坐标转换:** 使用卫星轨道数据和地球的椭球模型,将SAR数据中的像素坐标(通常是距离和方位)转换为地球表面上的地理坐标(通常是经度和纬度)。
4. **轨道校正:** 轨道校正是校正卫星在拍摄SAR影像时的轨道不稳定性引起的像素位置偏移。
这可以通过调整像素的位置来实现,使其在地球表面上的位置准确。
5. **多视差校正(如果需要):** 如果采用多视差SAR系统,还需要进行多视差校正,以校正不同视差通道之间的相位偏移。
6. **地形校正(如果需要):** 在某些应用中,还需要进行地形校正,以考虑地形对SAR数据的影响。
7. **输出地理参考影像:** 处理完成后,输出地理参考的SAR影像,其中每个像素都与地球上的特定地理位置对应。
轨道纠正是SAR影像处理的重要一步,它确保了SAR影像在地理空间中的准确性和一致性。
这对于许多应用,如地质勘探、军事情报、灾害监测等,都至关重要。
这个过程通常需要专业的SAR影像处理软件和专业知识来执行。
ENVI对SAR数据的预处理过程详细版
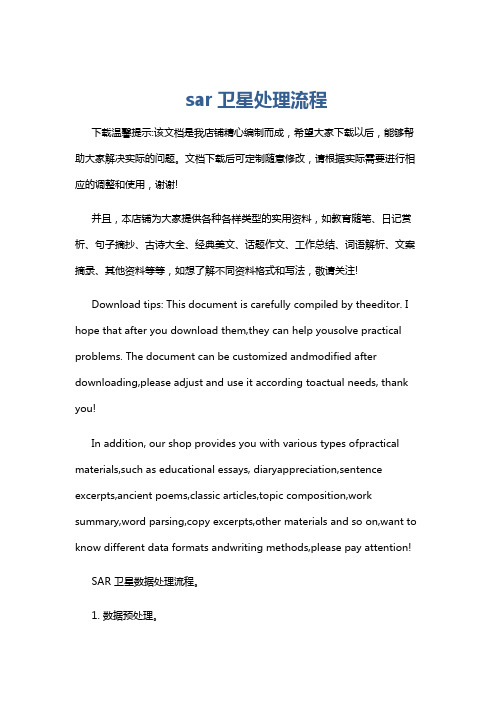
ENVI对SAR数据的预处理过程详细版合成孔径雷达(Synthetic Aperture Radar,简称SAR)是一种主动遥感技术,通过发射雷达脉冲,并接收其回波来获取地面的图像信息。
ENVI是一种常用的遥感数据处理软件,可以用来对SAR数据进行预处理、图像增强和地物提取等操作。
下面将详细介绍ENVI对SAR数据的预处理过程。
SAR数据预处理主要包括数据读取、辐射定标、多视同相运算、滤波和几何校正等步骤。
首先,打开ENVI软件,加载SAR数据。
在ENVI中,可以选择File -> Open菜单,然后选择SAR数据文件进行载入。
接下来,进行辐射定标,将原始SAR数据转换为幅度或强度图像。
SAR数据的辐射定标是将回波强度转换为真实物理值的过程。
辐射定标的目的是根据接收到的雷达回波信号的强度,恢复出地物散射系数的物理量级。
ENVI提供了多种辐射定标方法,可以根据数据的特点选择合适的方法进行定标。
接下来,进行多视同相运算。
SAR数据在地形起伏影响下会出现像素间的相位差,导致地物在图像中出现模糊。
多视同相运算是通过多个视角拍摄的SAR图像之间的相位差来消除地形影响,获得更清晰的图像。
ENVI提供了多视同相运算的功能,在菜单中选择SAR -> SAR Geocode ->Multi-look进行设置和运算。
然后,进行滤波处理。
滤波是为了去除图像中的噪声和干扰,提高图像质量。
常用的滤波方法有均值滤波、中值滤波、高斯滤波等。
ENVI提供了多种滤波方法,在菜单中选择SAR -> Speckle Reduction可以对SAR图像进行滤波处理。
最后,进行几何校正。
几何校正是将SAR图像与地理坐标系统对齐,使其与其他地理信息数据进行叠加和分析。
ENVI提供了几何校正的功能,在菜单中选择SAR -> SAR Geocode -> Geocoding进行设置和处理。
在进行SAR数据预处理时,还需要注意一些事项。
ENVI Sarscape入门教程V1.1

sar卫星处理流程
sar卫星处理流程下载温馨提示:该文档是我店铺精心编制而成,希望大家下载以后,能够帮助大家解决实际的问题。
文档下载后可定制随意修改,请根据实际需要进行相应的调整和使用,谢谢!并且,本店铺为大家提供各种各样类型的实用资料,如教育随笔、日记赏析、句子摘抄、古诗大全、经典美文、话题作文、工作总结、词语解析、文案摘录、其他资料等等,如想了解不同资料格式和写法,敬请关注!Download tips: This document is carefully compiled by theeditor. I hope that after you download them,they can help yousolve practical problems. The document can be customized andmodified after downloading,please adjust and use it according toactual needs, thank you!In addition, our shop provides you with various types ofpractical materials,such as educational essays, diaryappreciation,sentence excerpts,ancient poems,classic articles,topic composition,work summary,word parsing,copy excerpts,other materials and so on,want to know different data formats andwriting methods,please pay attention!SAR 卫星数据处理流程。
1. 数据预处理。
校正天线增益和散射截面。
SAR图像sarscape详细处理过程
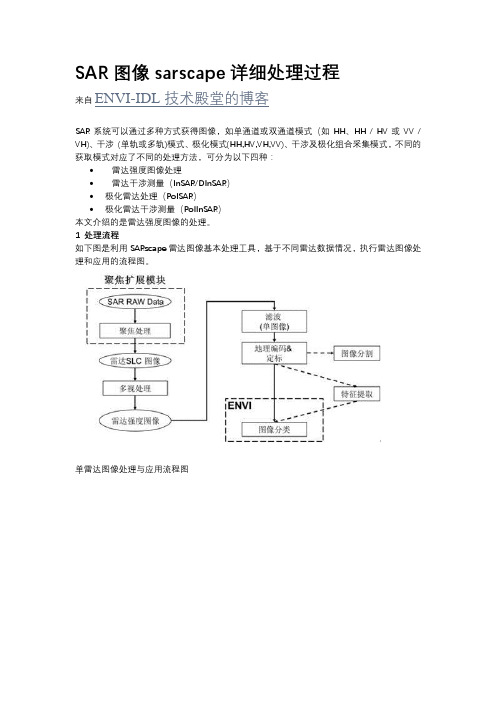
SAR图像sarscape详细处理过程来自ENVI-IDL技术殿堂的博客SAR系统可以通过多种方式获得图像,如单通道或双通道模式(如HH、HH / HV或VV / VH)、干涉(单轨或多轨)模式、极化模式(HH,HV,VH,VV)、干涉及极化组合采集模式,不同的获取模式对应了不同的处理方法,可分为以下四种:•雷达强度图像处理•雷达干涉测量(InSAR/DInSAR)•极化雷达处理(PolSAR)•极化雷达干涉测量(PoIInSAR)本文介绍的是雷达强度图像的处理。
1 处理流程如下图是利用SARscape雷达图像基本处理工具,基于不同雷达数据情况,执行雷达图像处理和应用的流程图。
单雷达图像处理与应用流程图单一传感器,单一模式,多时相雷达图像处理与应用流程图单/多传感器,多模式,多时相雷达图像处理与应用流程图2 处理流程关键技术下面介绍流程中相关技术。
(1) 聚焦处理对雷达系统的RAW数据中每个点的反射绿利用经过优化的调焦算法实现数据快速聚焦处理,直接输出单视复数产品数据(SLC数据)。
(2) 多视处理为了得到最高空间分辨率的SAR图像,SAR信号处理器使用完整的合成孔径和所有的信号数据,如单视复数(SLC)SAR图像产品,使得SAR图像包含很多的斑点噪声。
多视处理的目的是为了抑制SAR图像的斑点噪声。
Multilooking工具支持距离向多视和方位向多视,处理得到的多视强度图像是距离向和/或方位向像元分辨率的平均值。
为了提高多视图像的辐射分辨率,降低了空间分辨率。
Multilooking工具支持SLC强度数据或距离向强度数据的输入。
对SLC图像(*_slc)多视处理的结果(右边*_pwr)(3) 图像配准提供Coregistration工具,使用交叉相关技术实现覆盖同一地区的多幅雷达影像的自动配准,以达到亚像素配准精度,整个过程采用全自动的方式。
(4) 滤波Filtering工具提供一系列滤波用于去除雷达图像的斑点噪声,可用于单波段雷达图像和多时相雷达图像。
02_SAR数据基本处理
没限制; • 短基线(SBAS)渐进式处理,提高处理效率。
SARscape国内外主要用户
支持多源雷达系统
– ERS-1/2 – JERS-1 – RADARSAT-1 – RADARSAT-2 – ENVISAT ASAR – ALOS PALSAR – TerraSAR-X – TanDEM-X(+bistatic) – COSMO-SkyMed – OrbiSAR-1 (X、P-band) – E-SAR – RISAT-1 – STANAG 7023 – RAMSES – TELAER – GLAS/IceSat DEM
JSC KrasnoyarskGeofizika, Russia KEOC, Korea KKC - Kokusai Kogyo Co.,Ltd, Japan Kongsberg Satellite Services AS,
Norway LLC VNIIGAZ, Russia Lockheed Martin, USA MDA, USA & Canada OHB System GmbH, Germany PASCO Cooperation, Japan Peking University, China Pöyry Environment Oy, Finland Raytheon, USA Russian Academy of Sciences, Russia SaTReCi, Korea Statoil Hydro, Norway SWF Studio, Italy TELESPAZIO, Italy TOTAL, France USGS, USA ……
ENVI对SAR数据的预处理过程(详细版)
一、数据的导入:(1) 在Toolbox 中,选择SARscape ->Basic->Import Data->Standard Formats->ALOS PALSAR。
(2) 在打开的面板中,数据类型(Data Type):JAXA-FBD Level 1.1。
注:这些信息可以从数据文件名中推导而来。
(3) 单击Leader/Param file,选择d1300816-005-ALPSRP246750820-H1.1__A\LED-ALPSRP246750820-H1.1__A文件。
(4) 点击Data list,选择d1300816-005-ALPSRP246750820-H1.1__A\IMG-HH-ALPSRP246750820-H1.1__A文件(4) 单击Output file,选择输出路径。
注:软件会在输入文件名的基础上增加几个标识字母,如这里增加“_SLC”(5) 单击Start 执行,最后输出结果是ENVI 的slc文件,sml格式的元数据文件,hdr格式的头文件等。
(6) 可在ENVI 中打开导入生成的以slc为后缀的SAR 图像文件。
二、多视单视复数(SLC)SAR 图像产品包含很多的斑点噪声,为了得到最高空间分辨率的SAR图像,SAR 信号处理器使用完整的合成孔径和所有的信号数据。
多视处理是在图像的距离向和方位向上的分辨率做了平均,目的是为了抑制SAR 图像的斑点噪声。
多视的图像提高了辐射分辨率,降低了空间分辨率。
(1) 在Toolbox 中,选择SARscape->Basic ->Multilooking。
(2) 单击Input file 按钮,选择一景SLC 数据(前面导入生成的ALOS PALSAR 数据)。
注意:文件选择框的文件类型默认是*_slc,就是文件名以_slc 结尾的文件,如不是,可选择*.*。
(3) 设置:方位向视数(Azimuth Looks):5,距离向视数(Range Looks):1注:详细的计算方法如下所述。
- 1、下载文档前请自行甄别文档内容的完整性,平台不提供额外的编辑、内容补充、找答案等附加服务。
- 2、"仅部分预览"的文档,不可在线预览部分如存在完整性等问题,可反馈申请退款(可完整预览的文档不适用该条件!)。
- 3、如文档侵犯您的权益,请联系客服反馈,我们会尽快为您处理(人工客服工作时间:9:00-18:30)。
ENVI Tutorial:Basic SAR Processing andAnalysisTable of ContentsO VERVIEW OF T HIS T UTORIAL (2)Background (2)S INGLE-B AND SAR P ROCESSING (3)Read and Display RADARSAT CEOS Data (3)Review CEOS Header (3)Apply Square-Root Contrast Stretch (4)Remove Speckle using Adaptive Filters (5)Density Slice (6)Edge Enhancement (7)Data Fusion (8)Image-Map Output (9)Overview of This TutorialThis tutorial is designed to give you a working knowledge of ENVI’s basic tools for processing single-band synthetic aperture radar (SAR) data such as RADARSAT, ERS-1, and JERS-1.Files Used in This TutorialENVI Resource DVD: envidata\rsat_subFile Descriptionlea_01.001 RADARSAT leader filebonnrsat.img (.hdr) RADARSAT image subsetrsi_f1.img (.hdr) Frost filter resultdslice.dsr Density slice filersi_f2.img (.hdr) Laplacian filter resultrsi_f3.img (.hdr) Laplacian filter result with 90% add-backrsi_fus.img (.hdr) Simulated fused TM and RADARSATrsi_map.jpg RADARSAT map composition exampleBackgroundUse the Radar menu in ENVI to access standard and advanced tools for analysis of detected radar images and advanced SAR systems such as NASA/Jet Propulsion Laboratory's (JPL's) fully polarimetric AIRSAR and SIR-C systems. ENVI can process ERS-1, JERS-1, RADARSAT, SIR-C, X-SAR, and AIRSAR data and any other detected SAR dataset. In addition, ENVI is designed to handle radar data distributed in the CEOS format.Most standard ENVI processing functions are inherently radar-capable, including all display capabilities, stretching, color manipulations, classification, registration, filters, geometric rectification, and so on. Additional specialized tools are provided for analyzing polarimetric radar data. A typical processing flow may include reviewing the CEOS header, reading the CEOS data, displaying and contrast stretching, removing speckle using an adaptive filter, density slicing, edge enhancement, data fusion, and map composition.Single-Band SAR ProcessingThis section describes a typical single-band SAR processing scenario from data input through processing and analysis, to publication-quality or map output. You will use a subsetted RADARSAT 1 Path Image, Fine Beam 2, from December 17, 1995, Bonn, Germany.Read and Display RADARSAT CEOS DataENVI provides the tools to read generic CEOS data tapes and RADARSAT data from both tape and CD-ROM. To read data from tape, select File → Tape Utilities → Read Known Tape Formats → RADARSAT CEOS. To read original RADARSAT data from disk or CD, select Radar → Open/Prepare Radar File → RADARSAT. For this tutorial, a RADARSAT image subset has already been extracted.1.From the ENVI main menu bar, select File→Open Image File. A file selection dialog appears.2.Navigate to envidata\rsat_sub and select bonnrsat.img. Click Open.3.In the Available Bands List, select the Gray Scale radio button and click Load Band. The following figure showsthe subsetted RADARSAT image of Bonn, Germany, with a 2% linear stretch applied. These data were acquired during the RADARSAT commissioning phase and should not be used for scientific analysis or interpretation. Data are copyright, RADARSAT, 1995.Review CEOS HeaderMany SAR datasets are distributed in CEOS format. ENVI provides generic tools to read CEOS headers and display CEOS header information on the screen. ENVI also has tools specifically designed to read RADARSAT CEOS headers, which contain additional information.1.From the ENVI main menu bar, select Radar→Open/Prepare Radar File→View RADARSAT Header. Afile selection dialog appears.2.Select the RADARSAT leader file lea_01.001. A CEOS Header Report dialog appears.3.Browse the information in the CEOS Header Report, then close the dialog when you are finished.Apply Square-Root Contrast StretchRadar data typically cover a large range of data values. As seen above, default linear stretches do not perform a very good job of enhancing the contrast in most radar images. ENVI’s square-root stretch spreads out radar data over a given range of gray scales better than other types of stretches, resulting in an improved display of radar images.1.From the Display group menu bar, select Enhance→[Image] Square Root. The stretch is applied based onthe statistics of the data in the Image window. The following figure shows a square-root stretch of the BonnRADARSAT image. Compare to the linear contrast stretch above.2.In the Available Bands List, click Display #1 and select New Display. Click Load Band again to display theimage with the default 2% linear stretch.3.From a Display group menu bar, select Tools→Link→Link Displays. Click OK to link the square-root imagewith the 2% linear stretch image. Click in an Image window to toggle between the two images.Remove Speckle using Adaptive FiltersAdaptive filters remove radar speckle from images without seriously affecting the spatial characteristics of the data. The Frost-filtered image shown below is a considerable improvement over the unfiltered data. The Frost filter, an exponentially damped, circularly symmetric filter that uses local statistics, is used to reduce speckle while preserving edges in the data. The pixel being filtered is replaced with a value calculated based on the distance from the filter center, the damping factor, and the local variance.1.From the ENVI main menu bar, select Radar→Adaptive Filters→Frost. A Frost Filter Input File dialogappears.2.Select bonnrsat.img and click OK. A Frost Filter Parameters dialog appears.e the default Filter Size (3x3) and Damping Factor (1.0). Enter an output filename and click OK.4.In the Available Bands List, select the new Frost-filtered image and click Load Band. Or, load the pre-generatedfile rsi_f1.img to a new display group and apply a square-root stretch.5.From a Display group menu bar, select Tools→Link→Link Displays. Click OK to link the Frost-filtered imagewith the 2% linear stretch image. Click in an Image window to toggle between the two images.Density SliceDensity slicing visually enhances radar differences based on image brightness. The density-sliced image below has four levels, with higher radar backscatter in the warmer colors.1.From the Display group menu bar associated with the Frost-filtered image, select Tools→Color Mapping→Density Slice. A Density Slice Band Choice dialog appears.2.Select the name of your Frost-filtered image and click OK. A Density Slice dialog appears.3.From the Density Slice dialog menu bar, select File→Restore Ranges. A file selection dialog appears.4.Select dslice.dsr and click Open.5.Click Apply in the Density Slice dialog. Use image-linking and dynamic overlays to compare the density-slicedimage to the gray scale images.6.When you are finished, close the Density Slice dialog.Edge EnhancementA Laplacian filter is a convolution filter that enhances edges in SAR and other data types. A 5 x 5 filter has the following kernel:0 0 -1 0 00 -1 -2 -1 0-1 -2 16 -2 -10 -1 -2 -1 00 0 -1 0 01.From the ENVI main menu bar, select Filter→Convolutions and Morphology.2.From the the Convolutions and Morphology Tool dialog menu bar, select Convolutions→Laplacian.3.Set the Kernel Size field to 5.4.Click Quick Apply. An input band selection dialog appears. Select bonnrsat.img and click OK. Or, view thepre-generated file rsi_f2.dat. Applying the kernel in this manner strongly enhances the edges while losing most of the radiometric information in the image.5.Repeat Steps 1-4, but set the Image Add Back field to 90.6.Click Quick Apply. Or, view the pre-generated file rsi_f3.dat. The following figure shows Laplacian filterresults (left) and 90% Add Back results (right):e image linking and dynamic overlays to compare these results with the original gray scale images.8.When you are finished, close the Convolutions and Morphology Tool dialog.9.From the ENVI main menu bar, select File→Exit.Data FusionSAR data complement other types of data by providing spatial information that other data do not contain. Conversely, SAR data do not have the composition expressed in multispectral, optical data. Therefore, a combined SAR/optical data analysis is usually required.You can use an intensity-hue-saturation (IHS) transform to combine a multispectral, color-composite image with a monochromatic SAR-sharpening band. ENVI provides a simple tool to conduct data merging using IHS.See the Landsat TM and SAR Data Fusion tutorial for more information, and view the pre-generated, fused TM/SAR file rsi_fus.img.Image-Map OutputOutput from ENVI image processing usually consists of a map-oriented, scaled image-map for presentation or visual analysis and interpretation. Radar data can be used in a map composition, just like any other dataset. See the Map Registration and Map Composition tutorials for more information.。