图像采集卡英文文献
基于 SAA7130HL 的视频采集卡设计

基于SAA7130HL的视频采集卡设计宗靖国,向健勇,王新怀(西安电子科技大学技术物理学院光电图像处理研究室,陕西西安 710071)摘 要介绍了PHILIPS公司的第五代“精显芯片”SAA7130 HL的主要功能及性能特点,提出了一种基于SAA7130的视频采集卡设计方案,并详细说明了该采集卡的硬件框图和软件程序设计。
实际的测试和使用证明了该采集卡的稳定性和可靠性。
关键词SAA7130HL;视频采集卡;I2C总线;WDM驱动程序中图分类号 TN919.8在实时图像采集系统中,由于图像数据量庞大,在使用计算机采集数据时,传统的方法,像使用串口、并口或ISA卡等方式传送数据不能适应高速大容量数据吞吐的需要,而需要一种高速率传输的总线以适应系统设计的需要。
PCI总线因其众多的功能、强大的兼容性、传输的高速率很好地解决了计算机系统的总线传输问题。
近年来,图像处理技术迅猛发展,对图像采集设备要求也越来越高。
当前有关图像采集的设备,主要包括两大类:一类是视频采集卡,主要用于监控系统。
常用的接口芯片有AMCC S5933,PLX9054,常用的一体化芯片有BT878和PHILIPS 的 SAA7130/7134。
BT878是早期的视频芯片,PHILIPS SAA7130/7134属于最新一代的视频芯片,最高分辨率可以达到768×576,图像质量较高。
另一类是数码摄像产品,内带存储设备,可随身携带。
1 SAA7130HL的主要特点SAA7130是一款将视频采集功能集成于一体的芯片。
它在单片上集成了视频数字化、解码、PCI 接口电路。
还提供了通用I/O(GPIO)接口组,支持各种扩展应用。
SAA7130HL是符合PCI标准协议高度集成化、低功耗的一款芯片,专门针对模拟电视信号和数字视频信号。
支持多种数字视频格式,以总线主方式写的形式通过PCI总线传输进计算机。
它通过9位的ADC采样后进入标准译码器,通过梳状滤波器和高性能计数器进行二维的色度/亮度分离,包括可变化的水平和垂直上下扫描范围和亮度,对比度和饱和度控制电路。
基于USB接口的数据采集卡的设计论文(硬件部分)

南昌工程学院毕业设计(论文)信息工程学院系(院)电子信息工程专业毕业设计(论文)题目基于USB接口的数据采集卡的设计(硬件)学生姓名杨宏华班级06电子信息工程(1)班学号2006100126指导教师完成日期2010 年 6 月19 日基于USB接口的数据采集卡的设计(硬件)The data acquisition cardbased on USB interface (hardware)总计毕业设计(论文)30 页表格0 个插图15 幅南昌工程学院本科毕业设计论文摘要随着科技的发展和社会各个行业对点子设备集成化的需求,越来越多的电子设备将直接与计算机通信,与计算机系统融为一体,以实现各种实时的只能控制与监测。
列如在瞬态信号测量、图像处理等一些高速、高精度的测量中,需要进行高速数据采集。
但是现在通用的高速数据采集卡一般多是PCI 卡或ISA 卡,存在安装麻烦,价格昂贵,受计算机插槽数量、地址、中断资源限制,可扩展性差,在一些电磁干扰性强的测试现场,无法专门对其做电磁屏蔽,导致采集的数据失真等缺点。
因此通用串行总线USB 是为解决传统总线不足的首选。
该总线接口具有安装方便、高带宽、易于扩展等优点,已逐渐成为现代数据传输的发展趋势。
随着USB技术的成熟,USB传输已经上升到3.0协议,最大速度已经达到每秒4.8Gb,跟其他接口设备的传输速度相比好不逊色。
基于USB 的高速数据采集卡充分利用USB 总线的上述优点,有效解决了传统高速数据采集卡的缺陷。
在本次设计中使用PUIUSBD12 USB接口芯片,选择ADC0809芯片作为模数转换器,使用AT89S52单片机作为控制器。
为了USB接口设计调试时方便,加上了RS232串行接口,用来监测PC机与数据采集卡之间的通信过程。
关键词: USB接口、数据采集卡、PUIUSBD12、模数转换器AbstractAbstractWith technological development and social sectors to all other devices, more and more compositive demand of electronic devices communicate directly with computers and computer system to the implementation of real-time can only control and monitoring. the column as in a transient signal measure, image processing some high speed, high precision measurement of data collection. the need for rapid. But now common data collection of cards are usually ISA and PCI card or present the installation of trouble, and expensive, is computer slot number, address and interrupt resource constraints, scalability and electromagnetic interference in the nature of the test site, not special to do the electromagnetic shielding and to collect data such shortcomings. the general level of the serial bus USB is traditional for the first bus limited. Interfaces have the installation of the bus conveniently, high bandwidth and expand the advantages and has gradually become the trend of modern data transmission. the USB technology,USB transport has increased by 3.0 protocol, the maximum rate has reached 4.8GB per second, the interface device speed, no less than good. based on the USB of data collection card full use of USB strengths of the bus, the effective solution to the traditional high data collection of defects.In this design uses PUIUSBD12 USB interfaces, select ADC0809 chips as the module, for use as a controller AT89S52 monolithic integrated circuits design usb interfaces. in order to debug, and with RS232 serial interface to monitor the pc and data gathering card communication process.Key words: Usb interfaces;data acquisition;PUIUSBD12;ADC南昌工程学院本科毕业设计(论文)目录摘要 (I)Abstract (II)第一章引言 (1)1.1 当今国内数据采集卡的研究现状............................ 错误!未定义书签。
机器视觉在焊点检测中的应用

1.引言
如今伴随数字产品已在人们生活中的大量使用,半导体设备制造业得到迅猛的发展,键合机就是半导体封装其中很重要的一个工序,而焊线后检测(PBI:Post Bond Inspect)又是键合机提高机器性能,拓展机器功能的一个重要课题。
结果证明,PBI算法可以快速判定在指定位置是否存在球,也可以精准的计算球的位置和半径。
4.2PBI算法的应用展望
根据检测出来球的状态,位置和半径这些详细的信息,我们可以打开思路,在工业上会有非常多的具体的应用。本文只是浅谈几项该技术的具体应用。
1).PBI算法一开始被提出来就是为了实现断线检测而开始被大家去研究的,断线检测就是机器取代替人工去找出没焊上线的次品芯片,相当于一个自动质检的过程(很重要,能省很多人力)。有了完善的算法之后,我们可以通过图像处理在理想位置附近寻找球的存在与否来判定焊线状况,很大程度上完善了机器的功能和提高了设备的效益。
4.PBI(焊线检测)的测验结果和应用展望
4.1PBI算法的测验结果
将PBI算法应用在设备上,通过大量的测试,得到了很好的实验结果。
以下是部分实验结果:
图4-1各种焊点正常下的PBI处理结果
图4-2各种焊点不正常的PBI处理结果
从图中我们可以知道,针对焊点正常的情况,不计环境的差异性,光路的差异性,球形的差异性,都可以用该算法,正确的找到球的位置和半径;而针对各种焊点不正常的情况,均没有误找的发生。
腐蚀的作用是消除物体消除物体边界点,使目标缩小,可以消除小于结构元素的噪声点;膨胀的作用是将与物体接触的所有背景点合并到物体中,使目标增大,,可添补目标中的空洞。
PCI-6024E数据采集卡英语

Low-Cost E Series Multifunction DAQ –12 or 16-Bit, 200 kS/s, 16 Analog InputsNI E Series – Low-Cost•16 analog inputs at up to 200 kS/s, 12 or 16-bit resolution•Up to 2 analog outputs at 10 kS/s, 12 or 16-bit resolution•8 digital I/O lines (TTL/CMOS); two 24-bit counter/timers •Digital triggering•4 analog input signal ranges •NI-DAQ driver that simplifies configuration and measurementsFamilies•NI 6036E •NI 6034E •NI 6025E •NI 6024E •NI 6023EOperating Systems•Windows 2000/NT/XP•Real-time performance with LabVIEW •Others such as Linux ®and Mac OS XRecommended Software•LabVIEW•LabWindows/CVI •Measurement Studio •VI LoggerOther Compatible Software•Visual Basic, C/C++, and C#Driver Software (included)•NI-DAQ 7Overview and ApplicationsNational Instruments low-cost E Series multifunction data acquisitiondevices provide full functionality at a price to meet the needs of the budget-conscious user.They are ideal for applications ranging fromcontinuous high-speed data logging to control applications to high-voltage signal or sensor measurements when used with NI signal conditioning.Synchronize the operations of multiple devices using the RTSI bus or PXI trigger bus to easily integrate other hardware such as motion control and machine vision to create an entire measurement and control system.Highly Accurate Hardware DesignNI low-cost E Series DAQ devices include the following features and technologies:Temperature Drift Protection Circuitry – Designed with components that minimize the effect of temperature changes on measurements to less than 0.0010% of reading/°C.Resolution-Improvement Technologies –Carefully designed noise floor maximizes the resolution.Onboard Self-Calibration –Precise voltage reference included for calibration and measurement accuracy. Self-calibration is completely software controlled, with no potentiometers to adjust.NI DAQ-STC – Timing and control ASIC designed to provide more flexibility,lower power consumption, and a higher immunity to noise and jitter than off-the-shelf counter/timer chips.NI MITE –ASIC designed to optimize data transfer for multiplesimultaneous operations using bus mastering with one DMA channel,interrupts, or programmed I/O.NI PGIA –Measurement and instrument class amplifier that guarantees settling times at all gains. Typical commercial off-the-shelf amplifier components do not meet the settling time requirements for high-gain measurement applications.PFI Lines –Eight programmable function input (PFI) lines that you can use for software-controlled routing of interboard and intraboard digital and timing signals.RTSI or PXI Trigger Bus –Bus used to share timing and control signals between two or more PCI or PXI devices to synchronize operations.RSE Mode –In addition to differential and nonreferenced single-ended modes, NI low-cost E Series devices offer the referenced single-ended (RSE) mode for use with floating-signal sources in applications with channel counts higher than eight.Onboard Temperature Sensor –Included for monitoring the operating temperature of the device to ensure that it is operating within the specified range.High-Performance,Easy-to-Use Driver SoftwareNI-DAQ is the robust driver software that makes it easy to access the functionality of your data acquisition hardware, whether you are a beginning or advanced user. Helpful features include:Automatic Code Generation –DAQ Assistant is an interactive guide that steps you through configuring, testing, and programming measurement tasks and generates the necessary code automatically for NI LabVIEW, LabWindows/CVI, or Measurement Studio.Cleaner Code Development –Basic and advanced software functions have been combined into one easy-to-use yet powerful set to help you build cleaner code and move from basic to advanced applications without replacing functions.High-Performance Driver Engine –Software-timed single-point input (typically used in control loops) with NI-DAQ achieves rates of up to 50 kHz. NI-DAQ also delivers maximum I/O system throughput with a multithreaded driver.Test Panels – With NI-DAQ, you can test all of your device functionality before you begin development.Scaled Channels –Easily scale your voltage data into the proper engineering units using the NI-DAQ Measurement Ready virtual channels by choosing from a list of common sensors and signals or creating your own custom scale.LabVIEW Integration –All NI-DAQ functions create the waveform data type, which carries acquired data and timing information directly into more than 400 LabVIEW built-in analysis routines for display of results in engineering units on a graph.For information on applicable hardware for NI-DAQ 7,visit /dataacquisition.Visit /oem for quantity discount information.Recommended Accessories Array Signal conditioning is required for sensor measurements or voltageinputs greater than 10 V. National Instruments SCXI is a versatile,high-performance signal conditioning platform, intended forhigh-channel-count applications. NI SCC products provide portable,flexible signal conditioning options on a per-channel basis. Both signalconditioning platforms are designed to increase the performance andreliability of your DAQ system, and are up to 10 times more accuratethan terminal blocks (please visit /sigcon for more details).Refer to the table below for more information:Ordering InformationPCINI PCI-6036E..........................................................................778465-01NI PCI-6034E..........................................................................778075-01NI PCI-6025E..........................................................................777744-01NI PCI-6024E..........................................................................777743-01NI PCI-6023E..........................................................................777742-01PCMCIANI DAQCard-6036E................................................................778561-01NI DAQCard-6024E................................................................778269-01PXINI PXI-6025E..........................................................................777798-01Includes NI-DAQ driver software.BUY NOW!For complete product specifications, pricing, and accessory information,call (800) 813 3693 (U.S.) or go to /dataacquisition.NI Services and SupportNI has the services and support to meet your needs around the globe and through the application life cycle – from planning and development through deployment and ongoing maintenance. We offer services and service levels to meet customer requirements in research,design, validation, and manufacturing. Visit /services .Training and CertificationNI training is the fastest, most certain route to productivity with our products. NI training can shorten your learning curve, save development time, and reduce maintenance costs over the application life cycle. We schedule instructor-led courses in cities worldwide, or we can hold a course at your facility. We also offer a professional certification program that identifies individuals who have high levels of skill and knowledge on using NI products. Visit /training .Professional ServicesOur Professional Services Team is comprised of NI applications engineers,NI Consulting Services, and a worldwide National Instruments Alliance Partner program of more than 600 independent consultants andintegrators. Services range from start-up assistance to turnkey system integration. Visit /alliance .OEM SupportWe offer design-in consulting and product integration assistance if you want to use our products for OEM applications. For information about special pricing and services for OEM customers, visit /oem .Local Sales and Technical SupportIn offices worldwide, our staff is local to the country, giving you access to engineers who speak your language. NI delivers industry-leading technical support through online knowledge bases, our applications engineers, and access to 14,000 measurement and automationprofessionals within NI Developer Exchange forums. Find immediate answers to your questions at /support .We also offer service programs that provide automatic upgrades to your application development environment and higher levels of technical support. Visit /ssp .Hardware ServicesNI Factory Installation ServicesNI Factory Installation Services (FIS) is the fastest and easiest way to use your PXI or PXI/SCXI combination systems right out of the box.Trained NI technicians install the software and hardware and configure the system to your specifications. NI extends the standard warranty by one year on hardware components (controllers, chassis, modules)purchased with FIS. To use FIS, simply configure your system online with /pxiadvisor .Calibration ServicesNI recognizes the need to maintain properly calibrated devices for high-accuracy measurements. We provide manual calibration procedures, services to recalibrate your products, and automated calibration software specifically designed for use by metrology laboratories. Visit /calibration .Repair and Extended WarrantyNI provides complete repair services for our products. Express repair and advance replacement services are also available. We offerextended warranties to help you meet project life-cycle requirements. Visit /services.National Instruments • info@ •(800) 813 3693*342570A-01*342570A-012006-6457-301-101-D。
数据采集系统中英文对照外文翻译文献
中英文对照外文翻译(文档含英文原文和中文翻译)Data Acquisition SystemsData acquisition systems are used to acquire process operating data and store it on,secondary storage devices for later analysis. Many or the data acquisition systems acquire this data at very high speeds and very little computer time is left to carry out any necessary, or desirable, data manipulations or reduction. All the data are stored on secondary storage devices and manipulated subsequently to derive the variables ofin-terest. It is very often necessary to design special purpose data acquisition systems and interfaces to acquire the high speed process data. This special purpose design can be an expensive proposition.Powerful mini- and mainframe computers are used to combine the data acquisition with other functions such as comparisons between the actual output and the desirable output values, and to then decide on the control action which must be taken to ensure that the output variables lie within preset limits. The computing power required will depend upon the type of process control system implemented. Software requirements for carrying out proportional, ratio or three term control of process variables are relatively trivial, and microcomputers can be used to implement such process control systems. It would not be possible to use many of the currently available microcomputers for the implementation of high speed adaptive control systems which require the use of suitable process models and considerable online manipulation of data.Microcomputer based data loggers are used to carry out intermediate functions such as data acquisition at comparatively low speeds, simple mathematical manipulations of raw data and some forms of data reduction. The first generation of data loggers, without any programmable computing facilities, was used simply for slow speed data acquisition from up to one hundred channels. All the acquired data could be punched out on paper tape or printed for subsequent analysis. Such hardwired data loggers are being replaced by the new generation of data loggers which incorporate microcomputers and can be programmed by the user. They offer an extremely good method of collecting the process data, using standardized interfaces, and subsequently performing the necessary manipulations to provide the information of interest to the process operator. The data acquired can be analyzed to establish correlations, if any, between process variables and to develop mathematical models necessary for adaptive and optimal process control.The data acquisition function carried out by data loggers varies from one to 9 in system to another. Simple data logging systems acquire data from a few channels while complex systems can receive data from hundreds, or even thousands, of input channels distributed around one or more processes. The rudimentary data loggers scan the selected number of channels, connected to sensors or transducers, in a sequential manner and the data are recorded in a digital format. A data logger can be dedicated in the sense that it can only collect data from particular types of sensors and transducers. It is best to use a nondedicated data logger since any transducer or sensor can be connected to the channels via suitable interface circuitry. This facility requires the use of appropriate signal conditioning modules.Microcomputer controlled data acquisition facilitates the scanning of a large number of sensors. The scanning rate depends upon the signal dynamics which means that some channels must be scanned at very high speeds in order to avoid aliasing errors while there is very little loss of information by scanning other channels at slower speeds. In some data logging applications the faster channels require sampling at speeds of up to 100 times per second while slow channels can be sampled once every five minutes. The conventional hardwired, non-programmable data loggers sample all the channels in a sequential manner and the sampling frequency of all the channels must be the same. This procedure results in the accumulation of very large amounts of data, some of which is unnecessary, and also slows down the overall effective sampling frequency. Microcomputer based data loggers can be used to scan some fast channels at a higher frequency than other slow speed channels.The vast majority of the user programmable data loggers can be used to scan up to 1000 analog and 1000 digital input channels. A small number of data loggers, with a higher degree of sophistication, are suitable for acquiring data from up to 15, 000 analog and digital channels. The data from digital channels can be in the form of Transistor- Transistor Logic or contact closure signals. Analog data must be converted into digital format before it is recorded and requires the use of suitable analog to digital converters (ADC).The characteristics of the ADC will define the resolution that can be achieved and the rate at which the various channels can be sampled. An in-crease in the number of bits used in the ADC improves the resolution capability. Successive approximation ADC's arefaster than integrating ADC's. Many microcomputer controlled data loggers include a facility to program the channel scanning rates. Typical scanning rates vary from 2 channels per second to 10, 000 channels per second.Most data loggers have a resolution capability of ±0.01% or better, It is also pos-sible to achieve a resolution of 1 micro-volt. The resolution capability, in absolute terms, also depends upon the range of input signals, Standard input signal ranges are 0-10 volt, 0-50 volt and 0-100 volt. The lowest measurable signal varies form 1 t, volt to 50, volt. A higher degree of recording accuracy can be achieved by using modules which accept data in small, selectable ranges. An alternative is the auto ranging facil-ity available on some data loggers.The accuracy with which the data are acquired and logged-on the appropriate storage device is extremely important. It is therefore necessary that the data acquisi-tion module should be able to reject common mode noise and common mode voltage. Typical common mode noise rejection capabilities lie in the range 110 dB to 150 dB. A decibel (dB) is a tern which defines the ratio of the power levels of two signals. Thus if the reference and actual signals have power levels of N, and Na respectively, they will have a ratio of n decibels, wheren=10 Log10(Na /Nr)Protection against maximum common mode voltages of 200 to 500 volt is available on typical microcomputer based data loggers.The voltage input to an individual data logger channel is measured, scaled and linearised before any further data manipulations or comparisons are carried out.In many situations, it becomes necessary to alter the frequency at which particu-lar channels are sampled depending upon the values of data signals received from a particular input sensor. Thus a channel might normally be sampled once every 10 minutes. If, however, the sensor signals approach the alarm limit, then it is obviously desirable to sample that channel once every minute or even faster so that the operators can be informed, thereby avoiding any catastrophes. Microcomputer controlledintel-ligent data loggers may be programmed to alter the sampling frequencies depending upon the values of process signals. Other data loggers include self-scanning modules which can initiate sampling.The conventional hardwired data loggers, without any programming facilities, simply record the instantaneous values of transducer outputs at a regular samplingin-terval. This raw data often means very little to the typical user. To be meaningful, this data must be linearised and scaled, using a calibration curve, in order to determine the real value of the variable in appropriate engineering units. Prior to the availability of programmable data loggers, this function was usually carried out in the off-line mode on a mini- or mainframe computer. The raw data values had to be punched out on pa-per tape, in binary or octal code, to be input subsequently to the computer used for analysis purposes and converted to the engineering units. Paper tape punches are slow speed mechanical devices which reduce the speed at which channels can be scanned. An alternative was to print out the raw data values which further reduced the data scanning rate. It was not possible to carry out any limit comparisons or provide any alarm information. Every single value acquired by the data logger had to be recorded eventhough it might not serve any useful purpose during subsequent analysis; many data values only need recording when they lie outside the pre-set low and high limits.If the analog data must be transmitted over any distance, differences in ground potential between the signal source and final location can add noise in the interface design. In order to separate common-mode interference form the signal to be recorded or processed, devices designed for this purpose, such as instrumentation amplifiers, may be used. An instrumentation amplifier is characterized by good common-mode- rejection capability, a high input impedance, low drift, adjustable gain, and greater cost than operational amplifiers. They range from monolithic ICs to potted modules, and larger rack-mounted modules with manual scaling and null adjustments. When a very high common-mode voltage is present or the need for extremely-lowcom-mon-mode leakage current exists(as in many medical-electronics applications),an isolation amplifier is required. Isolation amplifiers may use optical or transformer isolation.Analog function circuits are special-purpose circuits that are used for a variety of signal conditioning operations on signals which are in analog form. When their accu-racy is adequate, they can relieve the microprocessor of time-consuming software and computations. Among the typical operations performed are multiplications, division, powers, roots, nonlinear functions such as for linearizing transducers, rimsmeasure-ments, computing vector sums, integration and differentiation, andcurrent-to-voltage or voltage- to-current conversion. Many of these operations can be purchased in available devices as multiplier/dividers, log/antilog amplifiers, and others.When data from a number of independent signal sources must be processed by the same microcomputer or communications channel, a multiplexer is used to channel the input signals into the A/D converter.Multiplexers are also used in reverse, as when a converter must distribute analog information to many different channels. The multiplexer is fed by a D/A converter which continually refreshes the output channels with new information.In many systems, the analog signal varies during the time that the converter takes to digitize an input signal. The changes in this signal level during the conversion process can result in errors since the conversion period can be completed some time after the conversion command. The final value never represents the data at the instant when the conversion command is transmitted. Sample-hold circuits are used to make an acquisition of the varying analog signal and to hold this signal for the duration of the conversion process. Sample-hold circuits are common in multichannel distribution systems where they allow each channel to receive and hold the signal level.In order to get the data in digital form as rapidly and as accurately as possible, we must use an analog/digital (A/D) converter, which might be a shaft encoder, a small module with digital outputs, or a high-resolution, high-speed panel instrument. These devices, which range form IC chips to rack-mounted instruments, convert ana-log input data, usually voltage, into an equivalent digital form. The characteristics of A/D converters include absolute and relative accuracy, linearity, monotonic, resolu-tion, conversion speed, and stability. A choice of input ranges, output codes, and other features are available. The successive-approximation technique is popular for a large number ofapplications, with the most popular alternatives being the counter-comparator types, and dual-ramp approaches. The dual-ramp has been widely-used in digital voltmeters.D/A converters convert a digital format into an equivalent analog representation. The basic converter consists of a circuit of weighted resistance values or ratios, each controlled by a particular level or weight of digital input data, which develops the output voltage or current in accordance with the digital input code. A special class of D/A converter exists which have the capability of handling variable reference sources. These devices are the multiplying DACs. Their output value is the product of the number represented by the digital input code and the analog reference voltage, which may vary form full scale to zero, and in some cases, to negative values.Component Selection CriteriaIn the past decade, data-acquisition hardware has changed radically due to ad-vances in semiconductors, and prices have come down too; what have not changed, however, are the fundamental system problems confronting the designer. Signals may be obscured by noise, rfi,ground loops, power-line pickup, and transients coupled into signal lines from machinery. Separating the signals from these effects becomes a matter for concern.Data-acquisition systems may be separated into two basic categories:(1)those suited to favorable environments like laboratories -and(2)those required for hostile environments such as factories, vehicles, and military installations. The latter group includes industrial process control systems where temperature information may be gathered by sensors on tanks, boilers, wats, or pipelines that may be spread over miles of facilities. That data may then be sent to a central processor to provide real-time process control. The digital control of steel mills, automated chemical production, and machine tools is carried out in this kind of hostile environment. The vulnerability of the data signals leads to the requirement for isolation and other techniques.At the other end of the spectrum-laboratory applications, such as test systems for gathering information on gas chromatographs, mass spectrometers, and other sophis-ticated instruments-the designer's problems are concerned with the performing of sen-sitive measurements under favorable conditions rather than with the problem ofpro-tecting the integrity of collected data under hostile conditions.Systems in hostile environments might require components for wide tempera-tures, shielding, common-mode noise reduction, conversion at an early stage, redun-dant circuits for critical measurements, and preprocessing of the digital data to test its reliability. Laboratory systems, on the other hand, will have narrower temperature ranges and less ambient noise. But the higher accuracies require sensitive devices, and a major effort may be necessary for the required signal /noise ratios.The choice of configuration and components in data-acquisition design depends on consideration of a number of factors:1. Resolution and accuracy required in final format.2. Number of analog sensors to be monitored.3. Sampling rate desired.4. Signal-conditioning requirement due to environment and accuracy.5. Cost trade-offs.Some of the choices for a basic data-acquisition configuration include:1 .Single-channel techniques.A. Direct conversion.B. Preamplification and direct conversion.C. Sample-hold and conversion.D. Preamplification, sample-hold, and conversion.E. Preamplification, signal-conditioning, and direct conversion.F. Preamplification, signal-conditioning, sample-hold, and conversion.2. Multichannel techniques.A. Multiplexing the outputs of single-channel converters.B. Multiplexing the outputs of sample-holds.C. Multiplexing the inputs of sample-holds.D. Multiplexing low-level data.E. More than one tier of multiplexers.Signal-conditioning may include:1. Radiometric conversion techniques.B. Range biasing.D. Logarithmic compression.A. Analog filtering.B. Integrating converters.C. Digital data processing.We shall consider these techniques later, but first we will examine some of the components used in these data-acquisition system configurations.MultiplexersWhen more than one channel requires analog-to-digital conversion, it is neces-sary to use time-division multiplexing in order to connect the analog inputs to a single converter, or to provide a converter for each input and then combine the converter outputs by digital multiplexing.Analog MultiplexersAnalog multiplexer circuits allow the timesharing of analog-to-digital converters between a numbers of analog information channels. An analog multiplexer consists of a group of switches arranged with inputs connected to the individual analog channels and outputs connected in common(as shown in Fig. 1).The switches may be ad-dressed by a digital input code.Many alternative analog switches are available in electromechanical and solid-state forms. Electromechanical switch types include relays, stepper switches,cross-bar switches, mercury-wetted switches, and dry-reed relay switches. The best switching speed is provided by reed relays(about 1 ms).The mechanical switches provide high do isolation resistance, low contact resistance, and the capacity to handle voltages up to 1 KV, and they are usually inexpensive. Multiplexers using mechanical switches are suited to low-speed applications as well as those having high resolution requirements. They interface well with the slower A/D converters, like the integrating dual-slope types. Mechanical switches have a finite life, however, usually expressed innumber of operations. A reed relay might have a life of 109 operations, which wouldallow a 3-year life at 10 operations/second.Solid-state switch devices are capable of operation at 30 ns, and they have a life which exceeds most equipment requirements. Field-effect transistors(FETs)are used in most multiplexers. They have superseded bipolar transistors which can introduce large voltage offsets when used as switches.FET devices have a leakage from drain to source in the off state and a leakage from gate or substrate to drain and source in both the on and off states. Gate leakage in MOS devices is small compared to other sources of leakage. When the device has a Zener-diode-protected gate, an additional leakage path exists between the gate and source.Enhancement-mode MOS-FETs have the advantage that the switch turns off when power is removed from the MUX. Junction-FET multiplexers always turn on with the power off.A more recent development, the CMOS-complementary MOS-switch has the advantage of being able to multiplex voltages up to and including the supply voltages. A±10-V signal can be handled with a ±10-V supply.Trade-off Considerations for the DesignerAnalog multiplexing has been the favored technique for achieving lowest system cost. The decreasing cost of A/D converters and the availability of low-cost, digital integrated circuits specifically designed for multiplexing provide an alternative with advantages for some applications. A decision on the technique to use for a givensys-tem will hinge on trade-offs between the following factors:1. Resolution. The cost of A/D converters rises steeply as the resolution increases due to the cost of precision elements. At the 8-bit level, the per-channel cost of an analog multiplexer may be a considerable proportion of the cost of a converter. At resolutions above 12 bits, the reverse is true, and analog multiplexing tends to be more economical.2. Number of channels. This controls the size of the multiplexer required and the amount of wiring and interconnections. Digital multiplexing onto a common data bus reduces wiring to a minimum in many cases. Analog multiplexing is suited for 8 to 256 channels; beyond this number, the technique is unwieldy and analog errors be-come difficult to minimize. Analog and digital multiplexing is often combined in very large systems.3. Speed of measurement, or throughput. High-speed A/D converters can add a considerable cost to the system. If analog multiplexing demands a high-speedcon-verter to achieve the desired sample rate, a slower converter for each channel with digital multiplexing can be less costly.4. Signal level and conditioning. Wide dynamic ranges between channels can be difficult with analog multiplexing. Signals less than 1V generally require differential low-level analog multiplexing which is expensive, with programmable-gain amplifiers after the MUX operation. The alternative of fixed-gain converters on each channel, with signal-conditioning designed for the channel requirement, with digital multi-plexing may be more efficient.5. Physical location of measurement points. Analog multiplexing is suitedfor making measurements at distances up to a few hundred feet from the converter, since analog lines may suffer from losses, transmission-line reflections, and interference. Lines may range from twisted wire pairs to multiconductor shielded cable, depending on signal levels, distance, and noise environments. Digital multiplexing is operable to thousands of miles, with the proper transmission equipment, for digital transmission systems can offer the powerful noise-rejection characteristics that are required for29 Data Acquisition Systems long-distance transmission.Digital MultiplexingFor systems with small numbers of channels, medium-scale integrated digital multiplexers are available in TTL and MOS logic families. The 74151 is a typical example. Eight of these integrated circuits can be used to multiplex eight A/D con-verters of 8-bit resolution onto a common data bus.This digital multiplexing example offers little advantages in wiring economy, but it is lowest in cost, and the high switching speed allows operation at sampling rates much faster than analog multiplexers. The A/D converters are required only to keep up with the channel sample rate, and not with the commutating rate. When large numbers of A/D converters are multiplexed, the data-bus technique reduces system interconnections. This alone may in many cases justify multiple A/D converters. Data can be bussed onto the lines in bit-parallel or bit-serial format, as many converters have both serial and parallel outputs. A variety of devices can be used to drive the bus, from open collector and tristate TTL gates to line drivers and optoelectronic isolators. Channel-selection decoders can be built from 1-of-16 decoders to the required size. This technique also allows additional reliability in that a failure of one A/D does not affect the other channels. An important requirement is that the multiplexer operate without introducing unacceptable errors at the sample-rate speed. For a digital MUX system, one can determine the speed from propagation delays and the time required to charge the bus capacitance.Analog multiplexers can be more difficult to characterize. Their speed is a func-tion not only of internal parameters but also external parameters such as channel, source impedance, stray capacitance and the number of channels, and the circuit lay-out. The user must be aware of the limiting parameters in the system to judge their ef-fect on performance.The nonideal transmission and open-circuit characteristics of analog multiplexers can introduce static and dynamic errors into the signal path. These errors include leakage through switches, coupling of control signals into the analog path, and inter-actions with sources and following amplifiers. Moreover, the circuit layout can com-pound these effects.Since analog multiplexers may be connected directly to sources which may have little overload capacity or poor settling after overloads, the switches should have a break-before-make action to prevent the possibility of shorting channels together. It may be necessary to avoid shorted channels when power is removed and a chan-nels-off with power-down characteristic is desirable. In addition to the chan-nel-addressing lines, which are normally binary-coded, it is useful to have inhibited or enable lines to turn all switches off regardless of the channel being addressed. This simplifies the external logic necessary to cascade multiplexers and can also be useful in certain modes of channeladdressing. Another requirement for both analog and digital multiplexers is the tolerance of line transients and overload conditions, and the ability to absorb the transient energy and recover without damage.数据采集系统数据采集系统是用来获取数据处理和存储在二级存储设备,为后来的分析。
FPGA CPLD与USB技术的无损图像采集卡
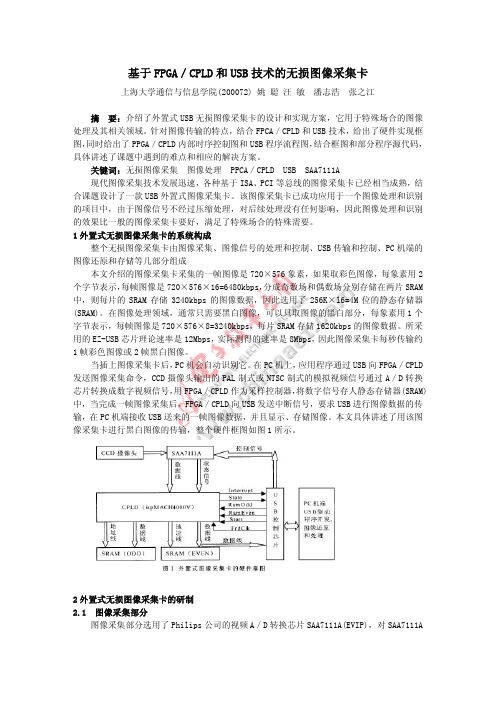
基于FPGA/CPLD和USB技术的无损图像采集卡上海大学通信与信息学院(200072) 姚 聪 汪 敏 潘志浩 张之江摘 要:介绍了外置式USB无损图像采集卡的设计和实现方案,它用于特殊场合的图像处理及其相关领域。
针对图像传输的特点,结合FPCA/CPLD和USB技术,给出了硬件实现框图,同时给出了PPGA/CPLD内部时序控制图和USB程序流程图,结合框图和部分程序源代码,具体讲述了课题中遇到的难点和相应的解决方案。
关键词:无损图像采集 图像处理 PPCA/CPLD USB SAA7111A现代图像采集技术发展迅速,各种基于ISA、PCI等总线的图像采集卡已经相当成熟,结合课题设计了一款USB外置式图像采集卡。
该图像采集卡已成功应用于一个图像处理和识别的项目中,由于图像信号不经过压缩处理,对后续处理没有任何影响,因此图像处理和识别 的效果比一般的图像采集卡要好,满足了特殊场合的特殊需要。
1外置式无损图像采集卡的系统构成整个无损图像采集卡由图像采集、图像信号的处理和控制、USB传输和控制、PC机端的图像还原和存储等几部分组成本文介绍的图像采集卡采集的一帧图像是720×576象素,如果取彩色图像,每象素用2个字节表示,每帧图像是720×576×16=6480kbps,分成奇数场和偶数场分别存储在两片SRAM 中,则每片的SRAM存储3240kbps的图像数据,因此选用了256K×l6=4M位的静态存储器(SRAM)。
在图像处理领域,通常只需要黑白图像,可以只取图像的黑白部分,每象素用1个字节表示,每帧图像是720×576×8=3240kbps,每片SRAM存储1620kbps的图像数据。
所采用的EZ-USB芯片理论速率是12Mbps,实际测得的速率是8Mbps,因此图像采集卡每秒传输约1帧彩色图像或2帧黑白图像。
当插上图像采集卡后,PC机会自动识别它。
机器视觉文献综述
一、机器视觉与图像采集的研究的意义“作为一项关键性的自动化技术,机器视觉在发展中国家中对经济的现代化非常重要。
为了在世界市场中进行竞争,发展中经济不能无限期的依赖于廉价劳动力。
“ AIA市场分析员Kellett说。
同样地,现代化必须实现高效率、高生产率以及高质量。
这也是机器视觉的作用所在,”对机器视觉长期需求这样的趋势是发展中国家实现经济现代化的基础。
因此,机器视觉对于世界经济的发展将越来越重要。
”二、机器视觉与图像采集的研究的现状国外机器视觉发展的起点难以准确考证,其大致的发展历程是:在机器视觉发展的历程中,有3个明显的标志点,一是机器视觉最先的应用来自“机器人”的研制,也就是说,机器视觉首先是在机器人的研究中发展起来的;二是20世纪70年代CCD图像传感器的出现,CCD摄像机替代硅靶摄像是机器视觉发展历程中的一个重要转折点;三是20世纪80年代CPU、DSP等图像处理硬件技术的飞速进步,为机器视觉飞速发展提供了基础条件。
国内机器视觉发展的大致历程:中国正在成为世界机器视觉发展最活跃的地区之一,其中最主要的原因是中国已经成为全球的加工中心,许许多多先进生产线己经或正在迁移至中国,伴随这些先进生产线的迁移,许多具有国际先进水平的机器视觉系统也进入中国。
对这些机器视觉系统的维护和提升而产生的市场需求也将国际机器视觉企业吸引而至,国内的机器视觉企业在与国际机器视觉企业的学习与竞争中不断成长。
三、机器视觉与图像采集技术在各个领域的应用视觉技术的最大优点是与被观测对象无接触,因此,对观测与被观测者都不会产生任何损伤,十分安全可靠,这是其它感觉方式无法比拟的. 理论上,人眼观察不到的范围机器视觉也可以观察,例如红外线、微波、超声波等,而机器视觉则可以利用这方面的传感器件形成红外线、微波、超声波等图像. 另外,人无法长时间地观察对象,机器视觉则无时间限制,而且具有很高的分辨精度和速度. 所以,机器视觉应用领域十分广泛,可分为工业、科学研究、军事和民用4 大领域.3. 1 工业领域工业领域是机器视觉应用中比重最大的领域,按照功能又可以分成4 类:产品质量检测、产品分类、产品包装、机器人定位. 其应用行业包括印刷包装、汽车工业、半导体材料/ 元器件/ 连接器生产、药品/ 食品生产、烟草行业、纺织行业等.下面以纺织行业为例具体阐述机器视觉在工业领域的应用[9 ] .在纺织企业中,视觉检测是工业应用中质量控制的主要组成部分,用机器视觉代替人的视觉可以克服人工检测所造成的各种误差,大大提高检测精度和效率. 正是由于视觉系统的高效率和非接触性,机器视觉在纺织检测中的应用越来越广泛[10 - 12 ] ,在许多方面已取得了成效.机器视觉可用于检测与纺织材料表面有关的性能指标见表4. 目前主要的研究内容可分为3 大类: 纤维、纱线、织物. 由于织物疵点检测(在线检测) 需要很高的计算速度,因此,设备费用比较昂贵. 目前国内在线检测的应用比较少,主要应用是离线检主要的检测有纺织布料识别与质量评定、织物表面绒毛鉴定、织物的反射特性、合成纱线横截面分析、纱线结构分析等. 此外还可用于织物组织设计、花型纹板、棉粒检测、分析纱线表面摩擦。
Decklink Optical Fiber采集卡
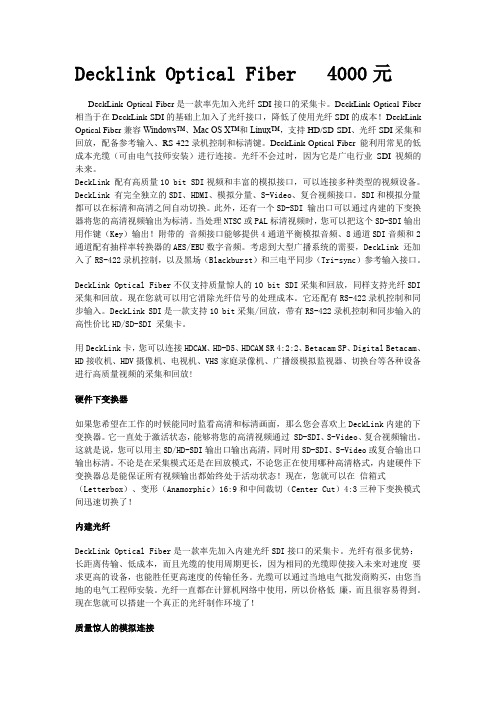
Decklink Optical Fiber 4000元DeckLink Optical Fiber是一款率先加入光纤SDI接口的采集卡。
DeckLink Optical Fiber 相当于在DeckLink SDI的基础上加入了光纤接口,降低了使用光纤SDI的成本!DeckLink Optical Fiber兼容Windows™、Mac OS X™和Linux™,支持HD/SD-SDI、光纤SDI采集和回放,配备参考输入、RS-422录机控制和标清键。
DeckLink Optical Fiber 能利用常见的低成本光缆(可由电气技师安装)进行连接。
光纤不会过时,因为它是广电行业SDI视频的未来。
DeckLink 配有高质量10 bit SDI视频和丰富的模拟接口,可以连接多种类型的视频设备。
DeckLink 有完全独立的SDI、HDMI、模拟分量、S-Video、复合视频接口。
SDI和模拟分量都可以在标清和高清之间自动切换。
此外,还有一个SD-SDI 输出口可以通过内建的下变换器将您的高清视频输出为标清。
当处理NTSC或PAL标清视频时,您可以把这个SD-SDI输出用作键(Key)输出!附带的音频接口能够提供4通道平衡模拟音频、8通道SDI音频和2通道配有抽样率转换器的AES/EBU数字音频。
考虑到大型广播系统的需要,DeckLink 还加入了RS-422录机控制,以及黑场(Blackburst)和三电平同步(Tri-sync)参考输入接口。
DeckLink Optical Fiber不仅支持质量惊人的10 bit SDI采集和回放,同样支持光纤SDI 采集和回放。
现在您就可以用它消除光纤信号的处理成本。
它还配有RS-422录机控制和同步输入。
DeckLink SDI是一款支持10 bit采集/回放,带有RS-422录机控制和同步输入的高性价比HD/SD-SDI 采集卡。
用DeckLink卡,您可以连接HDCAM、HD-D5、HDCAM SR 4:2:2、Betacam SP、Digital Betacam、HD接收机、HDV摄像机、电视机、VHS家庭录像机、广播级模拟监视器、切换台等各种设备进行高质量视频的采集和回放!硬件下变换器如果您希望在工作的时候能同时监看高清和标清画面,那么您会喜欢上DeckLink内建的下变换器。
基于图像采集卡的密立根油滴实验改进方法
摘
要 :对传统 的密粒根油滴仪进行改进 ,引入 图像 采集卡将油滴 图像 捕捉 到计算机 中,通过编程控制 ,
实现对 实验 图像 的动 态捕捉 和 实验数据 的 自动测量 .采用改进型作 图法进行数据优化 ,测得油 滴的带电量为
为 [: ]
需要 花 费大量 时问L. 同时传 统 的密立 根 油滴 实验 3 J 使 用 的监视 器仍 为老 式 C T显 示器 , R 图像亮度 及 对
比度较 差 ,维修 成本 高 ,实验 的重 复性 较差 ,数 据 不能 实时计 算 等缺 陷 .基 于此 ,本 文对 传统 的密 立
间 ; 代 表 油滴 在静 电场 中匀速 上升 , 所用 时 间 . 通
过 对 多 个 油滴 带 电量 的测 量 ,并进 行 数 据优 化 处 理 ,从 而 验证 电荷 的不连 续 性 ,并测 量 电子 的 电
荷 值 e.
此 直观 而准 确地 测量 了电子 电荷 .实验证 实 了物
质 世界 中电荷 的不连 续性 ,为 人类研 究物 质 结构 奠 定 了坚实 的基 础l. l J 2 1 年广 东 省第十 二届 物理 实验 设计 大赛 0 1 参 赛基 础题 为微 电量 的测 量 ,针对 密立 根油 滴实 验 进 行测量 技 术 的改进或 数据 分析 方法 的优 化 .本文对 传 统 的密 立根 油滴 实验 进行 改进 ,并
斜率 .
处理 区可 以实 时计算 出油滴 的带 电量 ,最后 还可 将 测 量 的数 据进 行保 存 打 印等 辅助 功 能.
将本 实验 数据代 入 公式 ( ),由表 1的每颗 1
数据采集外文文献翻译中英文
数据采集外文文献翻译(含:英文原文及中文译文)文献出处:Txomin Nieva. DATA ACQUISITION SYSTEMS [J]. Computers in Industry, 2013, 4(2):215-237.英文原文DATA ACQUISITION SYSTEMSTxomin NievaData acquisition systems, as the name implies, are products and/or processes used to collect information to document or analyze some phenomenon. In the simplest form, a technician logging the temperature of an oven on a piece of paper is performing data acquisition. As technology has progressed, this type of process has been simplified and made more accurate, versatile, and reliable through electronic equipment. Equipment ranges from simple recorders to sophisticated computer systems. Data acquisition products serve as a focal point in a system, tying together a wide variety of products, such as sensors that indicate temperature, flow, level, or pressure. Some common data acquisition terms are shown below.Data collection technology has made great progress in the past 30 to 40 years. For example, 40 years ago, in a well-known college laboratory, the device used to track temperature rises in bronze made of helium was composed of thermocouples, relays, interrogators, a bundle of papers, anda pencil.Today's university students are likely to automatically process and analyze data on PCs. There are many ways you can choose to collect data. The choice of which method to use depends on many factors, including the complexity of the task, the speed and accuracy you need, the evidence you want, and more. Whether simple or complex, the data acquisition system can operate and play its role.The old way of using pencils and papers is still feasible for some situations, and it is cheap, easy to obtain, quick and easy to start. All you need is to capture multiple channels of digital information (DMM) and start recording data by hand.Unfortunately, this method is prone to errors, slower acquisition of data, and requires too much human analysis. In addition, it can only collect data in a single channel; but when you use a multi-channel DMM, the system will soon become very bulky and clumsy. Accuracy depends on the level of the writer, and you may need to scale it yourself. For example, if the DMM is not equipped with a sensor that handles temperature, the old one needs to start looking for a proportion. Given these limitations, it is an acceptable method only if you need to implement a rapid experiment.Modern versions of the strip chart recorder allow you to retrieve data from multiple inputs. They provide long-term paper records of databecause the data is in graphic format and they are easy to collect data on site. Once a bar chart recorder has been set up, most recorders have enough internal intelligence to operate without an operator or computer. The disadvantages are the lack of flexibility and the relative low precision, often limited to a percentage point. You can clearly feel that there is only a small change with the pen. In the long-term monitoring of the multi-channel, the recorders can play a very good role, in addition, their value is limited. For example, they cannot interact with other devices. Other concerns are the maintenance of pens and paper, the supply of paper and the storage of data. The most important is the abuse and waste of paper. However, recorders are fairly easy to set up and operate, providing a permanent record of data for quick and easy analysis.Some benchtop DMMs offer selectable scanning capabilities. The back of the instrument has a slot to receive a scanner card that can be multiplexed for more inputs, typically 8 to 10 channels of mux. This is inherently limited in the front panel of the instrument. Its flexibility is also limited because it cannot exceed the number of available channels. External PCs usually handle data acquisition and analysis.The PC plug-in card is a single-board measurement system that uses the ISA or PCI bus to expand the slot in the PC. They often have a reading rate of up to 1000 per second. 8 to 16 channels are common, and the collected data is stored directly in the computer and then analyzed.Because the card is essentially a part of the computer, it is easy to establish the test. PC-cards are also relatively inexpensive, partly because they have since been hosted by PCs to provide energy, mechanical accessories, and user interfaces. Data collection optionsOn the downside, the PC plug-in cards often have a 12-word capacity, so you can't detect small changes in the input signal. In addition, the electronic environment within the PC is often susceptible to noise, high clock rates, and bus noise. The electronic contacts limit the accuracy of the PC card. These plug-in cards also measure a range of voltages. To measure other input signals, such as voltage, temperature, and resistance, you may need some external signal monitoring devices. Other considerations include complex calibrations and overall system costs, especially if you need to purchase additional signal monitoring devices or adapt the PC card to the card. Take this into account. If your needs change within the capabilities and limitations of the card, the PC plug-in card provides an attractive method for data collection.Data electronic recorders are typical stand-alone instruments that, once equipped with them, enable the measurement, recording, and display of data without the involvement of an operator or computer. They can handle multiple signal inputs, sometimes up to 120 channels. Accuracy rivals unrivalled desktop DMMs because it operates within a 22 word, 0.004 percent accuracy range. Some data electronic automatic recordershave the ability to measure proportionally, the inspection result is not limited by the user's definition, and the output is a control signal.One of the advantages of using data electronic loggers is their internal monitoring signals. Most can directly measure several different input signals without the need for additional signal monitoring devices. One channel can monitor thermocouples, RTDs, and voltages.Thermocouples provide valuable compensation for accurate temperature measurements. They are typically equipped with multi-channel cards. Built-in intelligent electronic data recorder helps you set the measurement period and specify the parameters for each channel. Once you set it all up, the data electronic recorder will behave like an unbeatable device. The data they store is distributed in memory and can hold 500,000 or more readings.Connecting to a PC makes it easy to transfer data to a computer for further analysis. Most data electronic recorders can be designed to be flexible and simple to configure and operate, and most provide remote location operation options via battery packs or other methods. Thanks to the A/D conversion technology, certain data electronic recorders have a lower reading rate, especially when compared with PC plug-in cards. However, a reading rate of 250 per second is relatively rare. Keep in mind that many of the phenomena that are being measured are physical in nature, such as temperature, pressure, and flow, and there are generallyfewer changes. In addition, because of the monitoring accuracy of the data electron loggers, a large amount of average reading is not necessary, just as they are often stuck on PC plug-in cards.Front-end data acquisition is often done as a module and is typically connected to a PC or controller. They are used in automated tests to collect data, control and cycle detection signals for other test equipment. Send signal test equipment spare parts. The efficiency of the front-end operation is very high, and can match the speed and accuracy with the best stand-alone instrument. Front-end data acquisition works in many models, including VXI versions such as the Agilent E1419A multi-function measurement and VXI control model, as well as a proprietary card elevator. Although the cost of front-end units has been reduced, these systems can be very expensive unless you need to provide high levels of operation, and finding their prices is prohibited. On the other hand, they do provide considerable flexibility and measurement capabilities.Good, low-cost electronic data loggers have the right number of channels (20-60 channels) and scan rates are relatively low but are common enough for most engineers. Some of the key applications include:•product features•Hot die cutting of electronic products•Test of the environmentEnvironmental monitoring•Composition characteristics•Battery testBuilding and computer capacity monitoringA new system designThe conceptual model of a universal system can be applied to the analysis phase of a specific system to better understand the problem and to specify the best solution more easily based on the specific requirements of a particular system. The conceptual model of a universal system can also be used as a starting point for designing a specific system. Therefore, using a general-purpose conceptual model will save time and reduce the cost of specific system development. To test this hypothesis, we developed DAS for railway equipment based on our generic DAS concept model. In this section, we summarize the main results and conclusions of this DAS development.We analyzed the device model package. The result of this analysis is a partial conceptual model of a system consisting of a three-tier device model. We analyzed the equipment project package in the equipment environment. Based on this analysis, we have listed a three-level item hierarchy in the conceptual model of the system. Equipment projects are specialized for individual equipment projects.We analyzed the equipment model monitoring standard package in the equipment context. One of the requirements of this system is the ability to use a predefined set of data to record specific status monitoring reports. We analyzed the equipment project monitoring standard package in the equipment environment. The requirements of the system are: (i) the ability to record condition monitoring reports and event monitoring reports corresponding to the items, which can be triggered by time triggering conditions or event triggering conditions; (ii) the definition of private and public monitoring standards; (iii) Ability to define custom and predefined train data sets. Therefore, we have introduced the "monitoring standards for equipment projects", "public standards", "special standards", "equipment monitoring standards", "equipment condition monitoring standards", "equipment project status monitoring standards and equipment project event monitoring standards, respectively Training item triggering conditions, training item time triggering conditions and training item event triggering conditions are device equipment trigger conditions, equipment item time trigger conditions and device project event trigger condition specialization; and training item data sets, training custom data Sets and trains predefined data sets, which are device project data sets, custom data sets, and specialized sets of predefined data sets.Finally, we analyzed the observations and monitoring reports in the equipment environment. The system's requirement is to recordmeasurements and category observations. In addition, status and incident monitoring reports can be recorded. Therefore, we introduce the concept of observation, measurement, classification observation and monitoring report into the conceptual model of the system.Our generic DAS concept model plays an important role in the design of DAS equipment. We use this model to better organize the data that will be used by system components. Conceptual models also make it easier to design certain components in the system. Therefore, we have an implementation in which a large number of design classes represent the concepts specified in our generic DAS conceptual model. Through an industrial example, the development of this particular DAS demonstrates the usefulness of a generic system conceptual model for developing a particular system.中文译文数据采集系统Txomin Nieva数据采集系统, 正如名字所暗示的, 是一种用来采集信息成文件或分析一些现象的产品或过程。
外文参考文献译文及原文AOI系统在SMT生产线上的应用
目录AOI系统在SMT生产线上的应用 (1)1主导思想: (1)2 实施策略 (2)3 AOI技术新突破: (4)4设备介绍 (7)5 结束语 (8)AOI system application in the SMT production line (8)1 the main idea (9)2 Implementation Strategy (10)3 AOI technology breakthroughs (13)4 Equipment (17)5 Conclusion (19)AOI系统在SMT生产线上的应用AOI技术(自动光学检测)以前主要用于PCB制造行业中。
但随着元件小型化及对生产效率提高的不断追求,AOI技术已深入到SMT生产线的各个领域,如印刷前PCB 检验、印刷质量检验、贴片质量检验、焊接质量检验等等。
各工序AOI的出现几乎完全替代人工操作,提高了产品质量和生产效率。
1主导思想:有两种检查主导思想:缺陷防止或缺陷发现。
适当的方法应该是缺陷的防止,因为其重点是在过程控制和通过实施改正行动来消除缺陷。
在这样一个方法中,AOI机器或者放在SMT生产线的锡膏印刷机之后,或者放在元件贴装之后。
操作者把检查机器放在SMT线的后方,在回流焊接炉之后。
这是制造工艺中的最后步骤,以保证产品质量。
AOI系统应该在生产线哪个位置,第一个选择是将AOI系统放在锡膏印刷正后面。
因为许多缺陷与锡膏量和印刷品质有关。
这样一个系统应该监测什么呢?只有锡膏的X-Y尺寸,包括误印或锡膏体积(X-Y-Z),锡膏体积测量将比X-Y测量慢,但可提供更有用的数据。
这个在某些应用中比其它应用更为关键。
例如,对于陶瓷排列包装,锡膏体积对达到所希望的焊点品质非常关键。
第二个选择是把AOI系统直接放在射片机之后。
这里,可检查误放或放错的小元件,包括电阻和电容,以及BGA和密间距元件的锡膏品质与体积,这些元件是用生产线内射片机之后的不同贴片机贴装的。
理工类文献综述(范文)

基于机器视觉技术的农产品检测摘要:随着计算机技术尤其是多媒体技术以及数字图像的处理与分析理论及其配套技术的不断发展和完善,机器视觉技术在农产品检测已经得到了广泛的应用。
该文阐述了机器视觉的原理、组成以及机器视觉技术在农产品品质检测与分级、农产品收获及其自动化以及农作物的生长状况监测三个方面的应用,重点介绍了基于机器视觉的农产品品质检测与分级。
指出了机器视觉技术在其应用中存在的问题及不足,并指出了机器视觉技术在农业工程领域在今后的发展趋势及前景。
关键词:机器视觉;农产品检测与分级;数字图像;自动收获0 引言机器视觉是利用图像传感器获取对象的图像,并将其转化成数据矩阵的形式,借助计算机的分析,最终来完成一个相当于视觉的任务。
机器视觉不仅是人眼的延伸, 更重要的是具有人脑的部分功能, 其在农产品品质检测上的应用正是满足了这些应变的要求。
随着图像处理技术的专业化与计算机硬件成本的下降和速度的提高, 在农产品品质自动识别领域应用机器视觉技术已变得越来越具有吸引力,70 年代末以来国际上许多研究人员已为开发用于农产品品质自动识别和分级的机器视觉系统倾注了大量的心血(应义斌等,2000)。
80年代中期,全球掀起了机器视觉的研究热潮(颜发根等,2004),机器视觉技术得到广泛的应用。
机器视觉技术在农业上的研究与应用始于20世纪70年代末期,主要用于果蔬的品质检测和分级(熊利荣等,2004)。
目前,机器视觉已经延伸到农产品收获自动化和农作物生长监测等方面的应用(傅宇,2006)。
包括农作物生长状况监测、自动收获、品质检测及分级等。
该文通过分析大量文献,综述了机器视觉技术在农业工程领域中的应用研究进展,重点分析了机器视觉技术在农产品品质检测与分级方面的应用,并且分析了其在应用中存在的问题和不足,并指出了今后的应用研究方向。
1 机器视觉技术1.1 概述美国制造工程协会(SME,Society of Manufacturing Engineers) 机器视觉分会和美国机器人工业协会(RIA,Robotic Industries Association)的自动化视觉分会对机器视觉下的定义为:“机器视觉是通过光学的装置和非接触的传感器自动地接受和处理一个真实物体的图像,通过分析图像获得所需信息或用于控制机器运动的装置”(曹国斌等,2008)。
图像采集卡的基础知识介绍
LVAL
行同步信号。当FVAL为高电平时, LVAL高电平表明相 机正输出一个有效的像元行。
数字信号——CameraLink
13对线(其中有 6线对数据线),使得接插件的尺寸更 加的小巧。允许相机设计的体积更小。 更高的传输速率。采用Channel Link芯片组( 支持速率达 2.3Gb/s )满足对数据传输速率越来越高的要求。 集成有串口通讯协议。
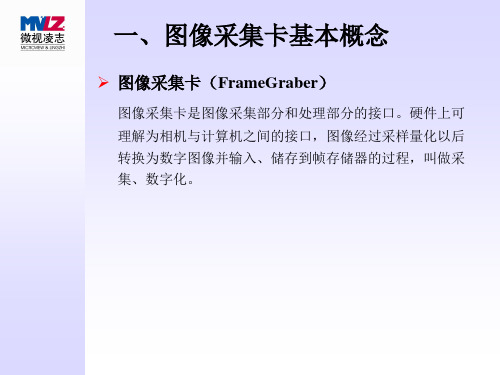
一、图像采集卡基本概念
分辨率
采集卡能支持的最大点阵反映了其分辨率的性能,即所能
支持的相机最大分辨率。
传输通道数(Channel)
采集卡同时对多个相机进行A/D转换的能力。如:2通道、
4通道。
一、图像采集卡基本概念
Matrox 的 Odyssey XA:独立四通道
一、图像采集卡基本概念
Matrox 的 MeteorII/Multi-Channel:三通道
数字信号——CameraLink
Base 8-bit x 1-3 10-bit x 1-2 12-bit x 1-2 14-bit x 1 16-bit x 1 24-bit RGB 8-bit x 4 Medium – – – – – – Full – – – – – – –
Matrox 的 Odyssey XCL
二、图像采集卡原理及过程
视野(FOV)或视场是相机及光学系统“看”到的真实 世界的具体部分。 CCD芯片将光能转化为电能。 相机将此信息以模拟信号的格式输出至图像采集卡。
A/D—转换器将模拟信号转换成8位(或多位)的数字信 号。每个像素独立地把光强以灰度值(Gray Level)的形 式表达。这些光强值从CCD芯片的矩阵中被转移存储在 内存的矩阵数据结构中。
基于机器视觉的工业机器人定位系统

基于机器视觉的工业机器人定位系统廖万辉 李琳(华南理工大学机械与汽车工程学院机器人研究室,广州,510640)【摘 要】建立了一个主动机器视觉定位系统,用于工业机器人对零件工位的精确定位。
采用基于区域的匹配和形状特征识别相结合的图像处理方法,该方法经过阈值和形状判据,识别出物体特征。
经实验验证,该方法能够快速准确地得到物体的边界和质心,进行数据识别和计算,再结合机器人运动学原理控制机器人实时运动以消除此误差,满足工业机器人自定位的要求。
【关键词】工业机器人;机器视觉;图像识别;定位Stereo Vision for Tracking and Location System Working on Industrial RobotLiao Wanhui and Li Lin(Robotics Research Laboratory, School of mechanic and auto engineering,South China University of Technology, China, 510640)Abstract: An active stereo vision for tracking and location system is built to work on industrial robot. A method combines area-based matching and the object’s shape to recognize object is proposed. It recognizes based on shape and segmentation. Test result showed that this method can correctly and quickly work out the boundary and centroid of object, the robot then moved to reduce the disparity as soon as possible based on the robot kinematics. It can achieve high rates of tracking and locating.Key words: Industrial robot;Stereo vision;Imaging recognition;Locating文献标识码:B 中图分类号:TP241.引言目前工业机器人仅能在严格定义的结构化环境中执行预定指令动作,缺乏对环境的感知与应变能力,这极大地限制了机器人的应用。
基于LabView的AOI视觉检测系统分析

基于 LabView 的 AOI 视觉检测系统分析摘要:自动光学(Automatic Optical Inspection,AOI)视觉检测系统以其工具简单化、功能模块化、数据可视化、操作简单化、检测智能化等特点得到广泛应用,成为生产制造领域产品检测重要手段,在促进企业产品生产质量与生产管理水平提升上发挥着至关重要的作用。
本研究利用LabVIEW开发平台,设计研发出一种可用于产品质量自动化检测的AOI视觉检测系统,对其工作原理、主要功能、软硬件设计等进行了简要介绍。
以期为相关研究提供理论指导。
关键词:LabView;自动光学检测;视觉监测系统引言:计算机视觉技术的发展,推动了视觉检测技术的产生,可以说,前者是后者产生的基础,其检测原理是通过对光学成像技术的利用,首先对被检测产品数字图像的准确获取,之后,通过计算机对其加以分析和处理后,即可达成检验产品质量的目的。
由于这项技术具有非常高的先进性,故受到了相关领域的高度关注。
因此,将LabView作为基础,对AOI视觉检测系统进行分析,具有十分重要的意义。
1系统工作原理分析本文所研究的AOI视觉检测系统,其组成部分包括PC机、工业镜头、光源、相机和机械手等。
其中,TCP/IP协议是各部门实现通讯连接的主要协议。
视觉检测系统的工作原理如下所述:首先利用相机对图像进行采集,然后向PC机传输图像信号。
PC机会将图像信号进行转化,之后,其就会变为数字图像。
计算机程序会将图像作为依据,对目标所处的场景位置进行计算,在完成计算后,控制程序就会生成控制指令,并借助以太网向机械手控制系统发布,最后由机械手响应命令,并通过解释控制指令的方式,控制伺服电机进行抓取操作。
视觉检测步骤如下所述:第一,结合上文可知,视觉检测的首要步骤是图像获取,通俗而言,就是在系统中导入识别对象,并予以显示。
在实际处理过程中,可借助系统内部的功能模块,为图像提供临时空间,并以此为跳板将其导入到计算机之中,为下一步骤的进行,奠定坚实的基础。
图像采集卡介绍及分类
图像采集卡介绍及分类1 按图像采集卡的主要特性可作如下分类(1) Microvision彩色图像采集卡与黑白图像采集卡根据系统中摄像机的不同,图像采集卡也相应地分为彩色图像采集卡和黑白图像采集卡。
但是,彩色图像采集卡也可以采集同灰度级别的黑白图像。
(2) Microvision模拟图像采集卡与数字图像采集卡目前现场广泛应用的摄像机是模拟信号摄像机,与此相应所采用的图像采集卡也是模拟图像采集卡。
模拟图像采集卡上设有A/D转换芯片,其对输入信号以4:2:2格式进行采样,然后进行量化,一般对YUV(也即对RGB)各8位量化,则传入的视频信号转换为数字图像信号。
与数字摄像机配套使用的图像采集卡,可称为数字图像采集卡。
(3) Microvision面扫描图像采集卡和线扫描图像采集卡与面扫描相机配套的采集卡是面扫描图像采集卡,其一般不支持线扫描相机。
配合线扫描相机使用的是线扫描图像采集卡。
支持线扫描相机的图像采集卡往往也支持面扫描相机。
2 Microvision板卡的基本技术参数图像采集卡的技术参数主要有以下几方面:(1) Microvision图像传输格式Microvision图像采集卡需要支持系统中摄像机所采用的输出信号格式。
大多数摄像机采用RS422或EIA644(LVDS)作为输出信号格式。
在数字相机中,IEEE1394,USB2.0和CameraLink几种图像传输形式则得到了广泛应用。
(2)图像格式(像素格式)Microvision黑白图像:通常情况下,图像灰度等级可分为256级,即以8位表示。
在对图像灰度有更精确要求时,可用10位,12位等来表示。
彩色图像:彩色图像可由RGB(YUV)3种色彩组合而成,根据其亮度级别的不同有8-8-8,10-10-10等格式。
(3)传输通道数当摄像机以较高速率拍摄高分辨率图像时,会产生很高的输出速率,这一般需要多路信号同时输出,图像采集卡应能支持多路输入。
一般情况下,有1路,2路,4路,8路输入等。
图像采集卡的基础知识介绍
四、板卡分类
依据输入信号类型可以分为:
模拟图像采集卡
数字图像采集卡
模拟图像采集卡 Morphis
数字图像采集卡 Solios-XCL
四、板卡分类
依据功能可以区分为:
单纯功能的图像采集卡
集成图像处理功能的采集卡
图像采集处理卡 Matrox的 Odyssey XCL
五、板卡硬件发展趋势
传统图像采集卡(A/D转换)最终将被淘汰; CameraLink、Firewire(1394)、LVDS等数字接口采集卡已被 广泛使用; 智能相机(Smart Camera)会应用于工业现场控制与嵌入式系 统;
一、图像采集卡基本概念
采样频率(时钟、点频)MHz
采样频率反映了采集卡处理图像的速度和能力。在进行图
像采集时,需要注意采集卡的采样频率是否满足要求。 Pixels Clock = Htotal * Vtotal * 帧(场)频
行频(KHz):每秒钟扫描多少行; 场(帧)频(Hz,fps):每秒钟扫描多少行场(帧)。
灯源控制功能 (Strobe) 基本I/O功能 (I/O) 相机复位功能 (Asynchronous Reset) 时序输出功能 (Timing Out) 串口通讯功能 (RS232) 电源输出功能 (Power out)
一、图像采集卡基本概念
Matrox 的 Odyssey XA
一、图像采集卡基本概念
三、视觉系统图像表达
由于windows目前的限制,能够显示的灰度最多为256个,
显示10bit或更高的灰度图像可以通过:
软件LUT的方式,和医疗影像中的窗宽窗位的概念类似
基于STM32的数据采集系统英文文献【范本模板】

Design of the Data Acquisition System Based on STM32ABSTRACTEarly detection of failures in machinery equipments is one of the most important concerns to industry. In order to monitor effective of rotating machinery,we development a micro—controller uC/OS—II system of signal acquisition system based on STM32 in this paper. we have given the whole design scheme of system and the multi—channel vibration signal in axis X,Y and Z of the rotary shaft can be acquired rapidly and display in real—time。
Our system has the character of simple structure,low power consumption,miniaturization.Keywords:STM32;data acquisition; embedded system;uC/OS—II;1.1. IntroductionThe real-time acquisition of vibration in rotating machinery can effectively predict,assess and diagnose equipment operation state, the industry gets vibration data acquisition Rapidly and analysis in real—time can monitor the rotating machinery state and guarantee the safe running of the equipment。
- 1、下载文档前请自行甄别文档内容的完整性,平台不提供额外的编辑、内容补充、找答案等附加服务。
- 2、"仅部分预览"的文档,不可在线预览部分如存在完整性等问题,可反馈申请退款(可完整预览的文档不适用该条件!)。
- 3、如文档侵犯您的权益,请联系客服反馈,我们会尽快为您处理(人工客服工作时间:9:00-18:30)。
英文文献:(4000+)基于相似性的可视化的图像采集G.P.阮M.吴霞感官智能信息系统,阿姆斯特丹大学,Kruislaan403,1098SJ荷兰阿姆斯特丹电子邮件:fgiangnp,worringg@science.uva.nl摘要在很多文献中,很少有内容是基于利用可视化作为探索工具集合的多媒体的检索系统,。
然而,在搜寻影像时没有实例,需要探索数据设置。
截至目前,大多数可用的系统只显示图像的二维网格形式的随机集合。
最近,先进的基于相似技术已被开发用于浏览。
然而,他们没有分析可视化视觉大片集合时出现的问题。
在本文中,我们明确提出这些问题。
开始之前,我们建立了三个总体要求:概述,可见性和数据结构保存。
解决方案是为每一个需求提出了建议。
最后,系统被提出并给出了实验结果,以证明我们的理论和方法。
1引言多媒体技术的发展和廉价的数码相机,可用性图像和视频集规模大幅增长。
为了管理,探索并通过搜索并且收藏,可视化系统是必不可少的。
许多工程已促成了这一有趣的领域[ 18 ] 。
在基于内容检索的这一主要问题是系统的自动标注功能之间的语义鸿沟和在集合的概念上的存取条件与用户的要求。
提高了系统的性能可从系统的角度,或从用户侧和从这些的组合中进行。
在任何方式的集合中可视化是一个重要的元素,因为它是建立在用户之间的联系的最好方式和系统。
在文献中,很少有基于内容的多媒体检索系统利用可视化作为探索的工具集合。
然而,在搜寻影像时没有从实例入手,设置需要探索数据。
截至目前,大多数可用的系统只显示图像的二维网格形式的随机集合。
并且浏览是依赖于图像之间的关系。
因此,应根据相似性。
对于描述,查询,搜索等基本特征或例子是最适当的方式就是可视化浏览。
最近,更多先进的技术已被开发用于浏览基于相似性。
然而,他们没有分析可视化可视化集合时出现的特殊问题。
例如,作为图像集的大小需要的空间是非常大的,从集合随机选择一组图片不能被认为是一个正确的做法。
用户使用此选项设置,只能得到数据库里面的能是什么的感觉。
在另一方面,显示(即无论大小或分辨率)的限制,不允许任何系统,以显示整个集合。
此外,显示所有图像时甚至不给用户提供更多的信息,而且还容易让图像迷失在拥挤的网络图像中。
有些系统取得了一个电子,通过展示剩余来缓解这种限制。
并整个收集到用户中作为一个点集。
然后,每个图像由显示器上的一个点来表示,并且一旦用户选择了一点,他们将得到的实像的可视化。
但是从实际的角度看来,这种做法是不容易的,因为用户在看一千多个点。
此外,每一个图像都是一个可视对象,因此其总含量多少应对用户是可见的。
在本文中,我们提出的所有问题都得到明确。
本文的结构如下。
在第2节中,我们分析出一些要求用于可视化大图像集合。
然后在第3节,为每一个需求得出解决方案。
最后,第4所示的实验结果与真实的数据。
2问题分析在本节中,我们更详细地分析一个可视化视觉大片集合时出现的问题。
从为了一个共同的可视化系统存在的一般要求是去NED。
在可视化的大集合的RST的问题是,由于其在尺寸和分辨率的限制,以显示他们的设备的有限显示尺寸,这就是所谓的可视空间。
同时,该大小集合通常比可视空间的所能承受的能力小大要大得多。
其次,由于图像是视觉对象的任何可视化工具的最终目的是要显示图像的内容。
由于空间限制,只有一小部分的图像可以在同一时间被显示。
随机选择这些图像的肯定不是一个好方法,因为它是不能够显示整个集合的分布。
为了克服这个问题,所选择的集合应该能够代表整个集合或者至少给用户一组,他感兴趣的概述。
这个问题已经被研究出,在这里笔者指出,在设计信息可视化系统中概述是最重要的标准。
因此,在RST标准的最佳可视化工具是概述的要求。
在收集影像的过程中通常又把他们当作同日或由相互关系的同一作者,或者共享相同的视觉特征。
这意味着,每个图像被表示为特征向量。
为实例中,如果每个图像的RGB直方图与32bins为每个颜色通道提取,特征向量是一个96维的向量。
因此,整个收集建立了一个高维特征空间。
通常情况下,特征的维数比3大很多,人类视觉尺寸的最大数目内是能够捕捉。
一个映射算法在特征空间的可视化空间中是必要的。
一些知名映射技术比如:PCA (主成分分析),MDS (多维缩放),或更近的方法ISOMAP (等距),SNE (随机邻居嵌入),液液萃取(本地线性嵌入)。
例如,作者用PCA进行数据映射到二维,同时在ISOMAP中被使用。
然而,数据驱动的距离和一般屏幕之间的距离精确匹配是不可能的。
此外,在特征空间,图片收藏往往遵循一定的非线性结构。
例如,给定的视频序列,该组的序列的帧将具有直链结构,如果相机捕捉车沿街,或环状结构移动,正如视频捕捉器在一个时钟或一小时的指针移动。
因此,将数据映射投入到可视化空间时,集合的结构,应予以保留。
这就是第二个要求,所谓的结构保护要求。
最后,在显示一组图像时,即使系统使用缩略图,以更小的尺寸相比原来的图像往往会有部分或完全地彼此重叠。
图像之间的重叠到现在还没有被认为是正常,即使它可以在可视化工具的质量上做很大改变。
如有一个例子,从用户的角度来看,在当它们被其他图像重叠,可能丢失图像的可能性很大,从而抑制了用户和系统之间的通信。
在这里必须强调指出,图像是视觉对象,因此它们之间的重叠应减少越多越好。
这是另一项要求,我们称之为可视性的要求。
综上所述,我们有三个总体要求:概述,结构保存和可视度。
但是,这里应该指出的是,三个要求是不完全相互独立的。
特别是,为了增加可见性,图象应彼此散开。
此外,更多的图像被选择为代表,因为在可视化的限制中得到更好的概述,但能见度空间有所降低。
图1示出的要求之间的关系。
因此,需要有一个均衡功能间的要求。
这意味着我们要保持原有的关系以及提高知名度和一个很好的概述,连同能见度保持。
在下面的章节中,我们将介绍每个方法要求。
然后为每个解决方案我们定义一个成本函数。
从那里,提出了均衡功能以达到最佳视觉效果。
3方法3.1从高维到2维空间假设每个图像被表示为特征空间中的一个点的映射,并且需要这些点映射到可视化空间。
用于这一目的的许多方法是存在的。
对于整个数据的一个很好的概述,以及保持映射后的数据的真实结构,我们需要一个算法,保留所有的数据之间的关系积分。
像PCA和MDS常见的技术是专为线性流形嵌入。
更近期的技术采取的数据集的非线性结构考虑在内。
例如,ISOMAP 与RST重新计算在高维空间中任意两个点的最短路径的长度的点之间的相似性,然后应用在MDS上,计算新的距离。
LLE适用在保持数据集的局部几何于本地的邻居旨。
SNE 是在这两种方法某种程度上的中间。
此方法计算该两点考虑彼此在高邻居和较低的概率维度,然后尝试两个概率分布间的匹配。
因此,它适用于局部几何结构保存,但也保持遥远点在可视化的高维空间的遥远空间。
因为它的优势的,在本文中,我们采用了SNE算法。
此外,为了克服该问题的直线距离计算,在ISOMAP算法的距离和计算步骤相结合,来提取基于图形的距离的组合称为ISOSNE 。
在原ISOMAP,有三个主要步骤。
首先,算法生成的邻域图采用k-近邻或近邻每一个点。
如果存在的所有点之间的边缘,该距离它们之间被设定为两个相应的对象之间的相异度值。
第二步使用Dijkstra的算法。
每对点之间第二最短路径,它们之间的距离,然后忠告定义为在总和所有链接从一个点到另一个的边缘。
之后的距离重新计算,MDS应用到新的距离矩阵。
图2示出的ISOMAP方法的优点的示例。
假设一个图像采集如下,对于一个正常的距离计算(左GURE),S-曲线在3维空间。
例如欧几里得距离,该数据的非线性歧所示右图像将被忽略。
这意味着,远离彼此并沿着所述歧管可以产生短的距离。
在对图像进行去NES距离下面的ISOMAP算出歧管的结构,这是在此歧管的两点之间的真实距离。
在ISOSNE,对于任何给定的数据集,类似于在ISOMAP的前两个步骤,我们重新计算的距离图像之间。
最后,用SNE计算,然后应用到新的距离矩阵。
该SNE的工作原理描述如下。
给定一个相异矩阵D ={dij},用于在原始空间中的每个对象中的算法计算概率的一个点,P = {pij}:与PII= 0。
假设每个图像被表示为一个点。
在可视化空间中,SNE初始化所有点随机位置。
I =1。
感应概率Q = {qij}然后计算每对点:最后,使用两个概率分布P和Q之间的的距离,该SNE旨在最小化下面的函数:我们尝试用一些ISOSNE合成非线性歧管套,以及真实数据集来证明了该算法的性能。
显示了测试的一些合成的数据的结果。
该ISOMAP往往会因此保持全局数据,在某些情况下未能在确保局部结构保存。
因此,该SNE本身使用点之间的直线距离,失去了数据的真实结构。
ISOMAP的组合和SNE采用了两种方法的优点并提供了最好的结果。
我们还尝试用LLE,但它不会产生令人满意的结果。
对于实际数据,图像集取自不同的宏的视频序列。
图映射的视频示出的结果由Lab颜色直方图(96维),以可视化空间中表示帧。
图4a是示例性一个用照相机拍摄车的移动沿着一条街道线性结构中,视频序列则具有线性结构。
图4b所示的重复结构,其中视频捕捉两个人之间的对话。
RST显示了两个人交谈,然后从一个人的摄像机移动到其他整个场景,并应再次显示整个场景。
显然,测绘成果确实保持原来的结构。
3.2概述如上所讨论的,显示的所有图像的用户是不恰当的,因为可视化的空间是有限的,用户将迷失在拥挤的网络图像中。
因此,我们需要选择一组图片作为代表显示给用户。
为此,我们采用K-means算法,聚类的数据集。
为了保持数据的结构,点之间的距离是使用基于图形的距离计算。
有了这个,k-means与我们的要求相适应。
假设我们集合分成k个簇。
K-均值为RST与随机位置对于k初始化中心点。
每个中心点是在数据集中的现有点之一。
一旦中心点去NED,然后我们第二点属于同一群集。
每个集群mi,为下一次迭代的新中心点mi (T +1)被计算为重复该过程,直到得到最大数目为止。
以下,我们展示的一个例子使用K-均值和改进的k-means初始距离。
给定的数据具有螺旋形式。
作为结构,该数据是使用ISOMAP保藏,改进的聚类也如下数据结构,因此,执行得比原来的好。
聚类的评价当然依赖于簇的给定数量,以及如何使中心点覆盖整个数据集。
对于以后的目的,我们需要一个标准化的评价功能,因此我们使用了作案版休伯特统计量作为聚类的措施。
它由下式给出:3.3能见度到目前为止,我们只考虑点集。
当各点表示为一个图像,我们需要服从可视性的要求。
在本节中,我们将展示如何给图像显示可视性的。
重叠依赖于显示的图像的数量,以及它们之间的关系。
在接近可视化空间表示的图像的相似性比较大。
这是因为结果从高维到2维空间(第3.1节)的映射。