图像处理-毕设论文外文翻译(翻译+原文)
图像处理中值滤波器中英文对照外文翻译文献
中英文资料对照外文翻译一、英文原文A NEW CONTENT BASED MEDIAN FILTERABSTRACTIn this paper the hardware implementation of a contentbased median filter suitabl e for real-time impulse noise suppression is presented. The function of the proposed ci rcuitry is adaptive; it detects the existence of impulse noise in an image neighborhood and applies the median filter operator only when necessary. In this way, the blurring o f the imagein process is avoided and the integrity of edge and detail information is pre served. The proposed digital hardware structure is capable of processing gray-scale im ages of 8-bit resolution and is fully pipelined, whereas parallel processing is used to m inimize computational time. The architecturepresented was implemented in FPGA an d it can be used in industrial imaging applications, where fast processing is of the utm ost importance. The typical system clock frequency is 55 MHz.1. INTRODUCTIONTwo applications of great importance in the area of image processing are noise filtering and image enhancement [1].These tasks are an essential part of any image pro cessor,whether the final image is utilized for visual interpretation or for automatic an alysis. The aim of noise filtering is to eliminate noise and its effects on the original im age, while corrupting the image as little as possible. To this end, nonlinear techniques (like the median and, in general, order statistics filters) have been found to provide mo re satisfactory results in comparison to linear methods. Impulse noise exists in many p ractical applications and can be generated by various sources, including a number of man made phenomena, such as unprotected switches, industrial machines and car ign ition systems. Images are often corrupted by impulse noise due to a noisy sensor or ch annel transmission errors. The most common method used for impulse noise suppressi on n forgray-scale and color images is the median filter (MF) [2].The basic drawback o f the application of the MF is the blurringof the image in process. In the general case,t he filter is applied uniformly across an image, modifying pixels that arenot contamina ted by noise. In this way, the effective elimination of impulse noise is often at the exp ense of an overalldegradation of the image and blurred or distorted features[3].In this paper an intelligent hardware structure of a content based median filter (CBMF) suita ble for impulse noise suppression is presented. The function of the proposed circuit is to detect the existence of noise in the image window and apply the corresponding MFonly when necessary. The noise detection procedure is based on the content of the im age and computes the differences between the central pixel and thesurrounding pixels of a neighborhood. The main advantage of this adaptive approach is that image blurrin g is avoided and the integrity of edge and detail information are preserved[4,5]. The pro posed digital hardware structure is capable of processing gray-scale images of 8-bitres olution and performs both positive and negative impulse noise removal. The architectt ure chosen is based on a sequence of four basic functional pipelined stages, and parall el processing is used within each stage. A moving window of a 3×3 and 5×5-pixel im age neighborhood can be selected. However, the system can be easily expanded to acc ommodate windows of larger sizes. The proposed structure was implemented using fi eld programmable gate arrays (FPGA). The digital circuit was designed, compiled and successfully simulated using the MAX+PLUS II Programmable Logic Development S ystem by Altera Corporation. The EPF10K200SFC484-1 FPGA device of the FLEX1 0KE device family was utilized for the realization of the system. The typical clock fre quency is 55 MHz and the system can be used for real-time imaging applications whe re fast processing is required [6]. As an example,the time required to perform filtering of a gray-scale image of 260×244 pixels is approximately 10.6 msec.2. ADAPTIVE FILTERING PROCEDUREThe output of a median filter at a point x of an image f depends on the values of t he image points in the neighborhood of x. This neighborhood is determined by a wind ow W that is located at point x of f including n points x1, x2, …, xn of f, with n=2k+1. The proposed adaptive content based median filter can be utilized for impulse noisesu p pression in gray-scale images. A block diagram of the adaptive filtering procedure is depicted in Fig. 1. The noise detection procedure for both positive and negative noise is as follows:(i) We consider a neighborhood window W that is located at point x of the image f. Th e differences between the central pixel at point x and the pixel values of the n-1surr ounding points of the neighborhood (excluding thevalue of the central pixel) are co mputed.(ii) The sum of the absolute values of these differences is computed, denoted as fabs(x ). This value provides ameasure of closeness between the central pixel and its su rrounding pixels.(iii) The value fabs(x) is compared to fthreshold(x), which is anappropriately selected positive integer threshold value and can be modified. The central pixel is conside red to be noise when the value fabs(x) is greater than thethreshold value fthresho d(x).(iv) When the central pixel is considered to be noise it is substituted by the median val ue of the image neighborhood,denoted as fk+1, which is the normal operationof the median filter. In the opposite case, the value of the central pixel is not altered and the procedure is repeated for the next neighborhood window.From the noised etection scheme described, it should be mentioned that the noise detection level procedure can be controlled and a range of pixel values (and not only the fixedvalues of 0 and 255, salt and pepper noise) is considered asimpulse noise.In Fig. 2 the results of the application of the median filter and the CBMF in the gray-sca le image “Peppers” are depicted.More specifically, in Fig. 2(a) the original,uncor rupted image“Peppers” is depicted. In Fig. 2(b) the original imagedegraded by 5% both positive and negative impulse noise isillustrated. In Figs 2(c) and 2(d) the resultant images of the application of median filter and CBMF for a 3×3-pixel win dow are shown, respectively. Finally, the resultant images of the application of m edian filter and CBMF for a 5×5-pixelwindow are presented in Figs 2(e) and 2(f). It can be noticed that the application of the CBMF preserves much better edges a nddetails of the images, in comparison to the median filter.A number of different objective measures can be utilized forthe evaluation of these results. The most wi dely used measures are the Mean Square Error (MSE) and the Normalized Mean Square Error (NMSE) [1]. The results of the estimation of these measures for the two filters are depicted in Table I.For the estimation of these measures, the result ant images of the filters are compared to the original, uncorrupted image.From T able I it can be noticed that the MSE and NMSE estimatedfor the application of t he CBMF are considerably smaller than those estimated for the median filter, in all the cases.Table I. Similarity measures.3. HARDWARE ARCHITECTUREThe structure of the adaptive filter comprises four basic functional units, the mo ving window unit , the median computation unit , the arithmetic operations unit , and th e output selection unit . The input data of the system are the gray-scale values of the pi xels of the image neighborhood and the noise threshold value. For the computation of the filter output a3×3 or 5×5-pixel image neighborhood can be selected. Image input d ata is serially imported into the first stage. In this way,the total number of the inputpin s are 24 (21 inputs for the input data and 3 inputs for the clock and the control signalsr equired). The output data of the system are the resultant gray-scale values computed f or the operation selected (8pins).The moving window unit is the internal memory of the system,used for storing th e input values of the pixels and for realizing the moving window operation. The pixel values of the input image, denoted as “IMAGE_INPUT[7..0]”, areimported into this u nit in serial. For the representation of thethreshold value used for the detection of a no Filter Impulse noise 5% mse Nmse(×10-2) 3×3 5×5 3×3 5×5Median CBMF 57.554 35.287 130.496 84.788 0.317 0.194 0.718 0.467ise pixel 13 bits are required. For the moving window operation a 3×3 (5×5)-pixel sep entine type memory is used, consisting of 9 (25)registers. In this way,when the windoP1 P2 P3w is moved into the next image neighborhood only 3 or 5 pixel values stored in the memory are altered. The “en5×5” control signal is used for the selection of the size of th e image window, when“en5×5” is equal to “0” (“1”) a 3×3 (5×5)-pixel neighborhood is selected. It should be mentioned that the modules of the circuit used for the 3×3-pix el window are utilized for the 5×5-pixel window as well. For these modules, 2-to-1mu ltiplexers are utilized to select the appropriate pixel values,where necessary. The mod ules that are utilized only in the case of the 5×5-pixel neighborhood are enabled by th e“en5×5” control signal. The outputs of this unit are rows ofpixel values (3 or 5, respe ctively), which are the inputs to the median computation unit.The task of the median c omputation unit is to compute themedian value of the image neighborhood in order to substitutethe central pixel value, if necessary. For this purpose a25-input sorter is utili zeed. The structure of the sorter has been proposed by Batcher and is based on the use of CS blocks. ACS block is a max/min module; its first output is the maximumof the i nputs and its second output the minimum. The implementation of a CS block includes a comparator and two 2-to-1 multiplexers. The outputs values of the sorter, denoted a s “OUT_0[7..0]”…. “OUT_24[7..0]”, produce a “sorted list” of the 25 initial pixel val ues. A 2-to-1 multiplexer isused for the selection of the median value for a 3×3 or 5×5-pixel neighborhood.The function of the arithmetic operations unit is to computethe value fabs(x), whi ch is compared to the noise threshold value in the final stage of the adaptive filter.The in puts of this unit are the surrounding pixel values and the central pixelof the neighb orhood. For the implementation of the mathematical expression of fabs(x), the circuit of this unit contains a number of adder modules. Note that registers have been used to achieve a pipelined operation. An additional 2-to-1 multiplexer is utilized for the selec tion of the appropriate output value, depending on the “en5×5” control signal. From th e implementation point of view, the use of arithmetic blocks makes this stage hardwar e demanding.The output selection unit is used for the selection of the appropriateoutput value of the performed noise suppression operation. For this selection, the corresponding no ise threshold value calculated for the image neighborhood,“NOISE_THRES HOLD[1 2..0]”,is employed. This value is compared to fabs(x) and the result of the comparison Classifies the central pixel either as impulse noise or not. If thevalue fabs(x) is greater than the threshold value fthreshold(x) the central pixel is positive or negative impulse noise and has to be eliminated. For this reason, the output of the comparison is used as the selection signal of a 2-to-1 multiplexer whose inputs are the central pixel and the c orresponding median value for the image neighborhood. The output of the multiplexer is the output of this stage and the final output of the circuit of the adaptive filter.The st ructure of the CBMF, the computation procedure and the design of the four aforeme n tioned units are illustrated in Fig. 3.ImagewindoeFigure 1: Block diagram of the filtering methodFigure 2: Results of the application of the CBMF: (a) Original image, (b) noise corrupted image (c) Restored image by a 3x3 MF, (d) Restored image by a 3x3 CBMF, (e) Restored image by a 5x5 MF and (f) Restored image by a 5x5 CBMF.4. IMPLEMENTATION ISSUESThe proposed structure was implemented in FPGA,which offer an attractive com bination of low cost, high performance and apparent flexibility, using the software pa ckage+PLUS II of Altera Corporation. The FPGA used is the EPF10K200SFC484-1 d evice of the FLEX10KE device family,a device family suitable for designs that requir e high densities and high I/O count. The 99% of the logic cells(9965/9984 logic cells) of the device was utilized to implement the circuit . The typical operating clock frequ ency of the system is 55 MHz. As a comparison, the time required to perform filtering of a gray-scale image of 260×244 pixelsusing Matlab® software on a Pentium 4/2.4 G Hz computer system is approximately 7.2 sec, whereas the corresponding time using h ardware is approximately 10.6 msec.The modification of the system to accommodate windows oflarger sizes can be done in a straightforward way, requiring onlya small nu mber of changes. More specifically, in the first unit the size of the serpentine memory P4P5P6P7P8P9SubtractorarryMedianfilteradder comparatormuitiplexerf abc(x)valueand the corresponding number of multiplexers increase following a square law. In the second unit, the sorter module should be modified,and in the third unit the number of the adder devicesincreases following a square law. In the last unit no changes are requ ired.5. CONCLUSIONSThis paper presents a new hardware structure of a content based median filter, ca pable of performing adaptive impulse noise removal for gray-scale images. The noise detection procedure takes into account the differences between the central pixel and th e surrounding pixels of a neighborhood.The proposed digital circuit is capable ofproce ssing grayscale images of 8-bit resolution, with 3×3 or 5×5-pixel neighborhoods as op tions for the computation of the filter output. However, the design of the circuit is dire ctly expandableto accommodate larger size image windows. The adaptive filter was d eigned and implemented in FPGA. The typical clock frequency is 55 MHz and the sys tem is suitable forreal-time imaging applications.REFERENCES[1] W. K. Pratt, Digital Image Processing. New York: Wiley,1991.[2] G. R. Arce, N. C. Gallagher and T. Nodes, “Median filters:Theory and applicat ions,” in Advances in ComputerVision and Image Processing, Greenwich, CT: JAI, 1986.[3] T. A. Nodes and N. C. Gallagher, Jr., “The output distributionof median type filte rs,” IEEE Transactions onCommunications, vol. COM-32, pp. 532-541, May1984.[4] T. Sun and Y. Neuvo, “Detail-preserving median basedfilters in imageprocessing,” Pattern Recognition Letters,vol. 15, pp. 341-347, Apr. 1994.[5] E. Abreau, M. Lightstone, S. K. Mitra, and K. Arakawa,“A new efficient approachfor the removal of impulsenoise from highly corrupted images,” IEEE Transa ctionson Image Processing, vol. 5, pp. 1012-1025, June 1996.[6] E. R. Dougherty and P. Laplante, Introduction to Real-Time Imaging, Bellingham:SPIE/IEEE Press, 1995.二、英文翻译基于中值滤波的新的内容摘要在本设计中的提出了基于中值滤波的硬件实现用来抑制脉冲噪声的干扰。
人脸识别 面部 数字图像处理相关 中英对照 外文文献翻译 毕业设计论文 高质量人工翻译 原文带出处

人脸识别相关文献翻译,纯手工翻译,带原文出处(原文及译文)如下翻译原文来自Thomas David Heseltine BSc. Hons. The University of YorkDepartment of Computer ScienceFor the Qualification of PhD. — September 2005 -《Face Recognition: Two-Dimensional and Three-Dimensional Techniques》4 Two-dimensional Face Recognition4.1 Feature LocalizationBefore discussing the methods of comparing two facial images we now take a brief look at some at the preliminary processes of facial feature alignment. This process typically consists of two stages: face detection and eye localisation. Depending on the application, if the position of the face within the image is known beforehand (fbr a cooperative subject in a door access system fbr example) then the face detection stage can often be skipped, as the region of interest is already known. Therefore, we discuss eye localisation here, with a brief discussion of face detection in the literature review(section 3.1.1).The eye localisation method is used to align the 2D face images of the various test sets used throughout this section. However, to ensure that all results presented are representative of the face recognition accuracy and not a product of the performance of the eye localisation routine, all image alignments are manually checked and any errors corrected, prior to testing and evaluation.We detect the position of the eyes within an image using a simple template based method. A training set of manually pre-aligned images of feces is taken, and each image cropped to an area around both eyes. The average image is calculated and used as a template.Figure 4-1 - The average eyes. Used as a template for eye detection.Both eyes are included in a single template, rather than individually searching for each eye in turn, as the characteristic symmetry of the eyes either side of the nose, provides a useful feature that helps distinguish between the eyes and other false positives that may be picked up in the background. Although this method is highly susceptible to scale(i.e. subject distance from the camera) and also introduces the assumption that eyes in the image appear near horizontal. Some preliminary experimentation also reveals that it is advantageous to include the area of skin justbeneath the eyes. The reason being that in some cases the eyebrows can closely match the template, particularly if there are shadows in the eye-sockets, but the area of skin below the eyes helps to distinguish the eyes from eyebrows (the area just below the eyebrows contain eyes, whereas the area below the eyes contains only plain skin).A window is passed over the test images and the absolute difference taken to that of the average eye image shown above. The area of the image with the lowest difference is taken as the region of interest containing the eyes. Applying the same procedure using a smaller template of the individual left and right eyes then refines each eye position.This basic template-based method of eye localisation, although providing fairly preciselocalisations, often fails to locate the eyes completely. However, we are able to improve performance by including a weighting scheme.Eye localisation is performed on the set of training images, which is then separated into two sets: those in which eye detection was successful; and those in which eye detection failed. Taking the set of successful localisations we compute the average distance from the eye template (Figure 4-2 top). Note that the image is quite dark, indicating that the detected eyes correlate closely to the eye template, as we would expect. However, bright points do occur near the whites of the eye, suggesting that this area is often inconsistent, varying greatly from the average eye template.Figure 4-2 一Distance to the eye template for successful detections (top) indicating variance due to noise and failed detections (bottom) showing credible variance due to miss-detected features.In the lower image (Figure 4-2 bottom), we have taken the set of failed localisations(images of the forehead, nose, cheeks, background etc. falsely detected by the localisation routine) and once again computed the average distance from the eye template. The bright pupils surrounded by darker areas indicate that a failed match is often due to the high correlation of the nose and cheekbone regions overwhelming the poorly correlated pupils. Wanting to emphasise the difference of the pupil regions for these failed matches and minimise the variance of the whites of the eyes for successful matches, we divide the lower image values by the upper image to produce a weights vector as shown in Figure 4-3. When applied to the difference image before summing a total error, this weighting scheme provides a much improved detection rate.Figure 4-3 - Eye template weights used to give higher priority to those pixels that best represent the eyes.4.2 The Direct Correlation ApproachWe begin our investigation into face recognition with perhaps the simplest approach,known as the direct correlation method (also referred to as template matching by Brunelli and Poggio [29 ]) involving the direct comparison of pixel intensity values taken from facial images. We use the term "Direct Conelation, to encompass all techniques in which face images are compared directly, without any form of image space analysis, weighting schemes or feature extraction, regardless of the distance metric used. Therefore, we do not infer that Pearson's correlation is applied as the similarity function (although such an approach would obviously come under our definition of direct correlation). We typically use the Euclidean distance as our metric in these investigations (inversely related to Pearson's correlation and can be considered as a scale and translation sensitive form of image correlation), as this persists with the contrast made between image space and subspace approaches in later sections.Firstly, all facial images must be aligned such that the eye centres are located at two specified pixel coordinates and the image cropped to remove any background information. These images are stored as greyscale bitmaps of 65 by 82 pixels and prior to recognition converted into a vector of 5330 elements (each element containing the corresponding pixel intensity value). Each corresponding vector can be thought of as describing a point within a 5330 dimensional image space. This simple principle can easily be extended to much larger images: a 256 by 256 pixel image occupies a single point in 65,536-dimensional image space and again, similar images occupy close points within that space. Likewise, similar faces are located close together within the image space, while dissimilar faces are spaced far apart. Calculating the Euclidean distance d, between two facial image vectors (often referred to as the query image q, and gallery image g), we get an indication of similarity. A threshold is then applied to make the final verification decision.d . q - g ( threshold accept ) (d threshold ⇒ reject ). Equ. 4-14.2.1 Verification TestsThe primary concern in any face recognition system is its ability to correctly verify a claimed identity or determine a person's most likely identity from a set of potential matches in a database. In order to assess a given system's ability to perform these tasks, a variety of evaluation methodologies have arisen. Some of these analysis methods simulate a specific mode of operation (i.e. secure site access or surveillance), while others provide a more mathematicaldescription of data distribution in some classification space. In addition, the results generated from each analysis method may be presented in a variety of formats. Throughout the experimentations in this thesis, we primarily use the verification test as our method of analysis and comparison, although we also use Fisher's Linear Discriminant to analyse individual subspace components in section 7 and the identification test for the final evaluations described in section 8. The verification test measures a system's ability to correctly accept or reject the proposed identity of an individual. At a functional level, this reduces to two images being presented for comparison, fbr which the system must return either an acceptance (the two images are of the same person) or rejection (the two images are of different people). The test is designed to simulate the application area of secure site access. In this scenario, a subject will present some form of identification at a point of entry, perhaps as a swipe card, proximity chip or PIN number. This number is then used to retrieve a stored image from a database of known subjects (often referred to as the target or gallery image) and compared with a live image captured at the point of entry (the query image). Access is then granted depending on the acceptance/rej ection decision.The results of the test are calculated according to how many times the accept/reject decision is made correctly. In order to execute this test we must first define our test set of face images. Although the number of images in the test set does not affect the results produced (as the error rates are specified as percentages of image comparisons), it is important to ensure that the test set is sufficiently large such that statistical anomalies become insignificant (fbr example, a couple of badly aligned images matching well). Also, the type of images (high variation in lighting, partial occlusions etc.) will significantly alter the results of the test. Therefore, in order to compare multiple face recognition systems, they must be applied to the same test set.However, it should also be noted that if the results are to be representative of system performance in a real world situation, then the test data should be captured under precisely the same circumstances as in the application environment.On the other hand, if the purpose of the experimentation is to evaluate and improve a method of face recognition, which may be applied to a range of application environments, then the test data should present the range of difficulties that are to be overcome. This may mean including a greater percentage of6difficult9 images than would be expected in the perceived operating conditions and hence higher error rates in the results produced. Below we provide the algorithm for executing the verification test. The algorithm is applied to a single test set of face images, using a single function call to the face recognition algorithm: CompareF aces(F ace A, FaceB). This call is used to compare two facial images, returning a distance score indicating how dissimilar the two face images are: the lower the score the more similar the two face images. Ideally, images of the same face should produce low scores, while images of different faces should produce high scores.Every image is compared with every other image, no image is compared with itself and nopair is compared more than once (we assume that the relationship is symmetrical). Once two images have been compared, producing a similarity score, the ground-truth is used to determine if the images are of the same person or different people. In practical tests this information is often encapsulated as part of the image filename (by means of a unique person identifier). Scores are then stored in one of two lists: a list containing scores produced by comparing images of different people and a list containing scores produced by comparing images of the same person. The final acceptance/rejection decision is made by application of a threshold. Any incorrect decision is recorded as either a false acceptance or false rejection. The false rejection rate (FRR) is calculated as the percentage of scores from the same people that were classified as rejections. The false acceptance rate (FAR) is calculated as the percentage of scores from different people that were classified as acceptances.For IndexA = 0 to length(TestSet) For IndexB = IndexA+l to length(TestSet) Score = CompareFaces(TestSet[IndexA], TestSet[IndexB]) If IndexA and IndexB are the same person Append Score to AcceptScoresListElseAppend Score to RejectScoresListFor Threshold = Minimum Score to Maximum Score:FalseAcceptCount, FalseRejectCount = 0For each Score in RejectScoresListIf Score <= ThresholdIncrease FalseAcceptCountFor each Score in AcceptScoresListIf Score > ThresholdIncrease FalseRejectCountF alse AcceptRate = FalseAcceptCount / Length(AcceptScoresList)FalseRej ectRate = FalseRejectCount / length(RejectScoresList)Add plot to error curve at (FalseRejectRate, FalseAcceptRate)These two error rates express the inadequacies of the system when operating at aspecific threshold value. Ideally, both these figures should be zero, but in reality reducing either the FAR or FRR (by altering the threshold value) will inevitably resultin increasing the other. Therefore, in order to describe the full operating range of a particular system, we vary the threshold value through the entire range of scores produced. The application of each threshold value produces an additional FAR, FRR pair, which when plotted on a graph produces the error rate curve shown below.False Acceptance Rate / %Figure 4-5 - Example Error Rate Curve produced by the verification test.The equal error rate (EER) can be seen as the point at which FAR is equal to FRR. This EER value is often used as a single figure representing the general recognition performance of a biometric system and allows for easy visual comparison of multiple methods. However, it is important to note that the EER does not indicate the level of error that would be expected in a real world application. It is unlikely that any real system would use a threshold value such that the percentage of false acceptances were equal to the percentage of false rejections. Secure site access systems would typically set the threshold such that false acceptances were significantly lower than false rejections: unwilling to tolerate intruders at the cost of inconvenient access denials.Surveillance systems on the other hand would require low false rejection rates to successfully identify people in a less controlled environment. Therefore we should bear in mind that a system with a lower EER might not necessarily be the better performer towards the extremes of its operating capability.There is a strong connection between the above graph and the receiver operating characteristic (ROC) curves, also used in such experiments. Both graphs are simply two visualisations of the same results, in that the ROC format uses the True Acceptance Rate(TAR), where TAR = 1.0 - FRR in place of the FRR, effectively flipping the graph vertically. Another visualisation of the verification test results is to display both the FRR and FAR as functions of the threshold value. This presentation format provides a reference to determine the threshold value necessary to achieve a specific FRR and FAR. The EER can be seen as the point where the two curves intersect.Figure 4-6 - Example error rate curve as a function of the score threshold The fluctuation of these error curves due to noise and other errors is dependant on the number of face image comparisons made to generate the data. A small dataset that only allows fbr a small number of comparisons will results in a jagged curve, in which large steps correspond to the influence of a single image on a high proportion of the comparisons made. A typical dataset of 720 images (as used in section 4.2.2) provides 258,840 verification operations, hence a drop of 1% EER represents an additional 2588 correct decisions, whereas the quality of a single image could cause the EER to fluctuate by up to 0.28.422 ResultsAs a simple experiment to test the direct correlation method, we apply the technique described above to a test set of 720 images of 60 different people, taken from the AR Face Database [ 39 ]. Every image is compared with every other image in the test set to produce a likeness score, providing 258,840 verification operations from which to calculate false acceptance rates and false rejection rates. The error curve produced is shown in Figure 4-7.Figure 4-7 - Error rate curve produced by the direct correlation method using no image preprocessing.We see that an EER of 25.1% is produced, meaning that at the EER threshold approximately one quarter of all verification operations carried out resulted in an incorrect classification. Thereare a number of well-known reasons for this poor level of accuracy. Tiny changes in lighting, expression or head orientation cause the location in image space to change dramatically. Images in face space are moved far apart due to these image capture conditions, despite being of the same person's face. The distance between images of different people becomes smaller than the area of face space covered by images of the same person and hence false acceptances and false rejections occur frequently. Other disadvantages include the large amount of storage necessaryfor holding many face images and the intensive processing required for each comparison, making this method unsuitable fbr applications applied to a large database. In section 4.3 we explore the eigenface method, which attempts to address some of these issues.4二维人脸识别4.1功能定位在讨论比较两个人脸图像,我们现在就简要介绍的方法一些在人脸特征的初步调整过程。
图像处理外文翻译 (2)
附录一英文原文Illustrator software and Photoshop software difference Photoshop and Illustrator is by Adobe product of our company, but as everyone more familiar Photoshop software, set scanning images, editing modification, image production, advertising creative, image input and output in one of the image processing software, favored by the vast number of graphic design personnel and computer art lovers alike.Photoshop expertise in image processing, and not graphics creation. Its application field, also very extensive, images, graphics, text, video, publishing various aspects have involved. Look from the function, Photoshop can be divided into image editing, image synthesis, school tonal color and special effects production parts. Image editing is image processing based on the image, can do all kinds of transform such as amplifier, reducing, rotation, lean, mirror, clairvoyant, etc. Also can copy, remove stain, repair damaged image, to modify etc. This in wedding photography, portrait processing production is very useful, and remove the part of the portrait, not satisfied with beautification processing, get let a person very satisfactory results.Image synthesis is will a few image through layer operation, tools application of intact, transmit definite synthesis of meaning images, which is a sure way of fine arts design. Photoshop provide drawing tools let foreign image and creative good fusion, the synthesis of possible make the image is perfect.School colour in photoshop with power is one of the functions of deep, the image can be quickly on the color rendition, color slants adjustment and correction, also can be in different colors to switch to meet in different areas such as web image design, printing and multimedia application.Special effects production in photoshop mainly by filter, passage of comprehensive application tools and finish. Including image effects of creative and special effects words such as paintings, making relief, gypsum paintings, drawings, etc commonly used traditional arts skills can be completed by photoshop effects. And all sorts of effects of production aremany words of fine arts designers keen on photoshop reason to study.Users in the use of Photoshop color function, will meet several different color mode: RGB, CMY K, HSB and Lab. RGB and CMYK color mode will let users always remember natural color, users of color and monitors on the printed page color is a totally different approach to create. The monitor is by sending red, green, blue three beams to create color: it is using RGB (red/green/blue) color mode. In order to make a complex color photographs on a continuous colour and lustre effect, printing technology used a cyan, the red, yellow and black ink presentation combinations from and things, reflect or absorb all kinds of light wavelengths. Through overprint) this print (add four color and create color is CMYK (green/magenta/yellow/black) yan color part of a pattern. HSB (colour and lustre/saturation/brightness) color model is based on the way human feelings, so the color will be natural color for customer computer translation of the color create provides an intuitive methods. The Lab color mode provides a create "don't rely on equipment" color method, this also is, no matter use what monitors.Photoshop expertise in image processing, and not graphics creation. It is necessary to distinguish between the two concepts. Image processing of the existing bitmap image processing and use edit some special effects, the key lies in the image processing processing; Graphic creation software is according to their own idea originality, using vector graphics to design graphics, this kind of software main have another famous company Adobe Illustrator and Macromedia company software Freehand.As the world's most famous Adobe Illustrator, feat graphics software is created, not graphic image processing. Adobe Illustrator is published, multimedia and online image industry standard vector illustration software. Whether production printing line draft of the designers and professional Illustrator, production multimedia image of artists, or Internet page or online content producers Illustrator, will find is not only an art products tools. This software for your line of draft to provide unprecedented precision and control, is suitable for the production of any small design to large complex projects.Adobe Illustrator with its powerful function and considerate user interface has occupied most of the global vector editing software share. With incomplete statistics global 37% of stylist is in use Adobe Illustrator art design. Especially the patent PostScript Adobe companybased on the use of technology, has been fully occupied professional Illustrator printed fields. Whether you're line art designers and professional Illustrator, production multimedia image of artists, or Internet page or online content producers, had used after Illustrator, its formidable will find the function and concise interface design style only Freehand to compare. (Macromedia Freehand is launched vector graphics software company, following the Macromedia company after the merger by Adobe Illustrator and will decide to continue the development of the software have been withdrawn from market).Adobe company in 1987 when they launched the Illustrator1.1 version. In the following year, and well platform launched 2.0 version. Illustrator really started in 1988, should say is introduced on the Mac Illustrator 88 version. A year after the upgrade to on the Mac version3.0 in 1991, and spread to Unix platforms. First appeared on the platform in the PC version4.0 version of 1992, this version is also the earliest Japanese transplant version. And in the MAC is used most is5.0/5.5 version, because this version used Dan Clark's do alias (anti-aliasing display) display engine is serrated, make originally had been in graphic display of vector graphics have a qualitative leap. At the same time on the screen making significant reform, style and Photoshop is very similar, so for the Adobe old users fairly easy to use, it is no wonder that did not last long, and soon also popular publishing industry launched Japanese. But not offering PC version. Adobe company immediately Mac and Unix platforms in launched version6.0. And by Illustrator real PC users know is introduced in 1997, while7.0 version of Mac and Windows platforms launch. Because the 7.0 version USES the complete PostScript page description language, make the page text and graphics quality got again leap. The more with her and Photoshop good interchangeability, won a good reputation. The only pity is the support of Chinese 7.0 abysmal. In 1998 the company launched landmark Adobe Illustrator8.0, making version - Illustrator became very perfect drawing software, is relying on powerful strength, Adobe company completely solved of Chinese characters and Japanese language support such double byte, more increased powerful "grid transition" tool (there are corresponding Draw9.0 Corel, but the effect the function of poor), text editing tools etc function, causes its fully occupy the professional vector graphics software's supremacy.Adobe Illustrator biggest characteristics is the use of beisaier curve, make simpleoperation powerful vector graphics possible. Now it has integrated functions such as word processing, coloring, not only in illustrations production, in printing products (such as advertising leaflet, booklet) design manufacture aspect is also widely used, in fact has become desktop publishing or (DTP) industry default standard. Its main competitors are in 2005, but MacromediaFreehand Macromedia had been Adobe company mergers.So-called beisaier curve method, in this software is through "the pen tool" set "anchor point" and "direction line" to realize. The average user in the beginning when use all feel not accustomed to, and requires some practice, but once the master later can follow one's inclinations map out all sorts of line, and intuitive and reliable.It also as Creative Suite of software suit with important constituent, and brother software - bitmap graphics software Photoshop have similar interface, and can share some plug-ins and function, realize seamless connection. At the same time it also can put the files output for Flash format. Therefore, can pass Illustrator let Adobe products and Flash connection.Adobe Illustrator CS5 on May 17, 2010 issue. New Adobe Illustrator CS5 software can realize accurate in perspective drawing, create width variable stroke, use lifelike, make full use of paint brush with new Adobe CS Live online service integration. AI CS5 has full control of the width zoom along path variable, and stroke, arrows, dashing and artistic brushes. Without access to multiple tools and panel, can directly on the sketchpad merger, editing and filling shape. AI CS5 can handle a file of most 100 different size, and according to your sketchpad will organize and check them.Here in Adobe Illustrator CS5, for example, briefly introduce the basic function: Adobe IllustratorQuick background layerWhen using Illustrator after making good design, stored in Photoshop opens, if often pattern is in a transparent layer, and have no background ground floor. Want to produce background bottom, are generally add a layer, and then executed merge down or flatten, with background ground floor. We are now introducing you a quick method: as long as in diagram level on press the upper right version, choose new layer, the arrow in the model selection and bottom ", "background can quickly produce. However, in Photoshop 5 after the movementmerged into one instruction, select menu on the "new layer is incomplete incomplete background bottom" to finish.Remove overmuch type clothWhen you open the file, version 5 will introduce the Illustrator before Illustrator version created files disused zone not need. In order to remove these don't need in the zone, click on All Swatches palette Swatches icon and then Select the Select clause in the popup menu, and Trash Unused. Click on the icon to remove irrelevant type cloth. Sometimes you must repeat selection and delete processes to ensure that clear palette. Note that complex documents will take a relatively long time doing cleanup.Put the fabric to define the general-screeningIn Illustrator5 secondary color and process color has two distinct advantages compared to establish for easy: they provide HuaGan tonal; And when you edit the general-screening prescription, be filled some of special color objects will be automatically updated into to the new color. Because process color won't let you build tonal and provides automatic updates, you may want to put all the fabric is defined as the general-screening. But to confirm Illustrator, when you are in QuarkXPress or when PageMaker quaclrochramatic must keep their into process of color.Preferred using CMYKBecause of Illustrator7 can let you to CMYK, RGB and HSB (hue, saturation, bright) color mode, so you want to establish color the creation of carefully, you can now contains the draft with the combination of these modes created objects. When you do, they may have output various kinds of unexpected things will happen. Printing output file should use CMYK; Only if you don't use screen display manuscript RGB. If your creation draft will also be used for printing and screen display, firstly with CMYK create printing output file, then use to copy it brings As ordered the copy and modify to the appropriate color mode.Information source:" Baidu encyclopedia "附录二中文译文Illustrator软件与Photoshop软件的区别Photoshop与Illustrator都是由Adobe公司出品的,而作为大家都比较熟悉的Photoshop软件,集图像扫描、编辑修改、图像制作、广告创意,图像输入与输出于一体的图形图像处理软件,深受广大平面设计人员和电脑美术爱好者的喜爱。
图像处理类相关英文文献
Journal of VLSI Signal Processing39,295–311,2005c 2005Springer Science+Business Media,Inc.Manufactured in The Netherlands.Parallel-Beam Backprojection:An FPGA Implementation Optimizedfor Medical ImagingMIRIAM LEESER,SRDJAN CORIC,ERIC MILLER AND HAIQIAN YU Department of Electrical and Computer Engineering,Northeastern University,Boston,MA02115,USAMARC TREPANIERMercury Computer Systems,Inc.,Chelmsford,MA01824,USAReceived September2,2003;Revised March23,2004;Accepted May7,2004Abstract.Medical image processing in general and computerized tomography(CT)in particular can benefit greatly from hardware acceleration.This application domain is marked by computationally intensive algorithms requiring the rapid processing of large amounts of data.To date,reconfigurable hardware has not been applied to the important area of image reconstruction.For efficient implementation and maximum speedup,fixed-point implementations are required.The associated quantization errors must be carefully balanced against the requirements of the medical community.Specifically,care must be taken so that very little error is introduced compared tofloating-point implementations and the visual quality of the images is not compromised.In this paper,we present an FPGA implementation of the parallel-beam backprojection algorithm used in CT for which all of these requirements are met.We explore a number of quantization issues arising in backprojection and concentrate on minimizing error while maximizing efficiency.Our implementation shows approximately100times speedup over software versions of the same algorithm running on a1GHz Pentium,and is moreflexible than an ASIC implementation.Our FPGA implementation can easily be adapted to both medical sensors with different dynamic ranges as well as tomographic scanners employed in a wider range of application areas including nondestructive evaluation and baggage inspection in airport terminals.Keywords:backprojection,medical imaging,tomography,FPGA,fixed point arithmetic1.IntroductionReconfigurable hardware offers significant potentialfor the efficient implementation of a wide range ofcomputationally intensive signal and image process-ing algorithms.The advantages of utilizing Field Pro-grammable Gate Arrays(FPGAs)instead of DSPsinclude reductions in the size,weight,performanceand power required to implement the computationalplatform.FPGA implementations are also preferredover ASIC implementations because FPGAs have moreflexibility and lower cost.To date,the full utility ofthis class of hardware has gone largely unexploredand unexploited for many mainstream applications.In this paper,we consider a detailed implementa-tion and comprehensive analysis of one of the mostfundamental tomographic image reconstruction steps,backprojection,on reconfigurable hardware.While weconcentrate our analysis on issues arising in the useof backprojection for medical imaging applications,both the implementation and the analysis we providecan be applied directly or easily extended to a widerange of otherfields where this task needs to be per-formed.This includes remote sensing and surveillanceusing synthetic aperture radar and non-destructiveevaluation.296Leeser et al.Tomography refers to the process that generates a cross-sectional or volumetric image of an object from a series of projections collected by scanning the ob-ject from many different directions[1].Projection data acquisition can utilize X-rays,magnetic resonance,ra-dioisotopes,or ultrasound.The discussion presented here pertains to the case of two-dimensional X-ray ab-sorption tomography.In this type of tomography,pro-jections are obtained by a number of sensors that mea-sure the intensity of X-rays travelling through a slice of the scanned object.The radiation source and the sen-sor array rotate around the object in small increments. One projection is taken for each rotational angle.The image reconstruction process uses these projections to calculate the average X-ray attenuation coefficient in cross-sections of a scanned slice.If different structures inside the object induce different levels of X-ray atten-uation,they are discernible in the reconstructed image. The most commonly used approach for image recon-struction from dense projection data(many projections, many samples per projection)isfiltered backprojection (FBP).Depending on the type of X-ray source,FBP comes in parallel-beam and fan-beam variations[1].In this paper,we focus on parallel-beam backprojection, but methods and results presented here can be extended to the fan-beam case with modifications.FBP is a computationally intensive process.For an image of size n×n being reconstructed with n projec-tions,the complexity of the backprojection algorithm is O(n3).Image reconstruction through backprojection is a highly parallelizable process.Such applications are good candidates for implementation in Field Pro-grammable Gate Array(FPGA)devices since they pro-videfine-grained parallelism and the ability to be cus-tomized to the needs of a particular implementation. We have implemented backprojection by making use of these principles and shown approximately100times speedup over a software implementation on a1GHz Pentium.Our architecture can easily be expanded to newer and larger FPGA devices,further accelerating image generation by extracting more data parallelism.A difficulty of implementing FBP is that producing high-resolution images with good resemblance to in-ternal characteristics of the scanned object requires that both the density of each projection and their total num-ber be large.This represents a considerable challenge for hardware implementations,which attempt to maxi-mize the parallelism in the implementation.Therefore, it can be beneficial to usefixed-point implementations and to optimize the bit-width of a projection sample to the specific needs of the targeted application domain. We show this for medical imaging,which exhibits distinctive properties in terms of requiredfixed-point precision.In addition,medical imaging requires high precision reconstructions since visual quality of images must not be compromised.We have paid special attention to this requirement by carefully analyzing the effects of quan-tization on the quality of reconstructed images.We have found that afixed-point implementation with properly chosen bit-widths can give high quality reconstructions and,at the same time,make hardware implementation fast and area efficient.Our quantization analysis inves-tigates algorithm specific and also general data quanti-zation issues that pertain to input data.Algorithm spe-cific quantization deals with the precision of spatial ad-dress generation including the interpolation factor,and also investigates bit reduction of intermediate results for different rounding schemes.In this paper,we focus on both FPGA implemen-tation performance and medical image quality.In pre-vious work in the area of hardware implementations of tomographic processing algorithms,Wu[2]gives a brief overview of all major subsystems in a com-puted tomography(CT)scanner and proposes loca-tions where ASICs and FPGAs can be utilized.Ac-cording to the author,semi-custom digital ASICs were the most appropriate due to the level of sophistica-tion that FPGA technology had in1991.Agi et al.[3]present thefirst description of a hardware solu-tion for computerized tomography of which we are aware.It is a unified architecture that implements for-ward Radon transform,parallel-and fan-beam back-projection in an ASIC based multi-processor system. Our FPGA implementation focuses on backprojection. Agi et al.[4]present a similar investigation of quanti-zation effects;however their results do not demonstrate the suitability of their implementation for medical ap-plications.Although theirfiltered sinogram data are quantized with12-bit precision,extensive bit trunca-tion on functional unit outputs and low accuracy of the interpolation factor(absolute error of up to2)ren-der this implementation significantly less accurate than ours,which is based on9-bit projections and the max-imal interpolation factor absolute error of2−4.An al-ternative to using specially designed processors for the implementation offiltered backprojection(FBP)is pre-sented in[5].In this work,a fast and direct FBP al-gorithm is implemented using texture-mapping hard-ware.It can perform parallel-beam backprojection of aParallel-Beam Backprojection 297512-by-512-pixel image from 804projections in 2.1sec,while our implementation takes 0.25sec for 1024projections.Luiz et al.[6]investigated residue number systems (RNS)for the implementation of con-volution based backprojection to speedup the process-ing.Unfortunately,extra binary-to-RNS and RNS-to-binary conversions are introduced.Other approaches to accelerating the backprojection algorithm have been investigated [7,8].One approach [7]presents an order O (n 2log n )and merits further study.The suitability to medical image quality and hardware implementation of these approaches[7,8]needs to be demonstrated.There are also a lot of interests in the area of fan-beam and cone-beam reconstruction using hardware implementa-tion.An FPGA-based fan-beam reconstruction module [9]is proposed and simulated using MAX +PLUS2,version 9.1,but no actual FPGA implementation is mentioned.Moreover,the authors did not explore the potential parallelism for different projections as we do,which is essential for speed-up.More data and com-putation is needed for 3D cone-beam FBP.Yu’s PC based system [10]can reconstruct the 5123data from 288∗5122projections in 15.03min,which is not suit-able for real-time.The embedded system described in [11]can do 3D reconstruction in 38.7sec with the fastest time reported in the literature.However,itisFigure 1.(a)Illustration of the coordinate system used in parallel-beam backprojection,and (b)geometric explanation of the incremental spatial address calculation.based on a Mercury RACE ++AdapDev 1120devel-opment workstation and need many modifications for a different platform.Bins et al.[12]have investigated precision vs.error in JPEG compression.The goals of this research are very similar to ours:to implement de-signs in fixed-point in order to maximize parallelism and area utilization.However,JPEG compression is an application that can tolerate a great deal more error than medical imaging.In the next section,we present the backprojection algorithm in more detail.In Section 3we present our quantization studies and analysis of error introduced.Section 4presents the hardware implementation in de-tail.Finally we present results and discuss future di-rections.An earlier version of this research was pre-sented [13].This paper provides a fuller discussion of the project and updated results.2.Parallel-Beam Filtered BackprojectionA parallel-beam CT scanning system uses an array of equally spaced unidirectional sources of focused X-ray beams.Generated radiation not absorbed by the object’s internal structure reaches a collinear array of detectors (Fig.1(a)).Spatial variation of the absorbed298Leeser et al.energy in the two-dimensional plane through the ob-ject is expressed by the attenuation coefficient µ(x ,y ).The logarithm of the measured radiation intensity is proportional to the integral of the attenuation coef-ficient along the straight line traversed by the X-ray beam.A set of values given by all detectors in the array comprises a one-dimensional projection of the attenu-ation coefficient,P (t ,θ),where t is the detector dis-tance from the origin of the array,and θis the angle at which the measurement is taken.A collection of pro-jections for different angles over 180◦can be visualized in the form of an image in which one axis is position t and the other is angle θ.This is called a sinogram or Radon transform of the two-dimensional function µ,and it contains information needed for the reconstruc-tion of an image µ(x ,y ).The Radon transform can be formulated aslog e I 0I d= µ(x ,y )δ(x cos θ+y sin θ−t )dx dy≡P (t ,θ)(1)where I 0is the source intensity,I d is the detected inten-sity,and δ(·)is the Dirac delta function.Equation (1)is actually a line integral along the path of the X-ray beam,which is perpendicular to the t axis (see Fig.1(a))at location t =x cos θ+y sin θ.The Radon transform represents an operator that maps an image µ(x ,y )to a sinogram P (t ,θ).Its inverse mapping,the inverse Radon transform,when applied to a sinogram results in an image.The filtered backprojection (FBP)algo-rithm performs this mapping [1].FBP begins by high-pass filtering all projections be-fore they are fed to hardware using the Ram-Lak or ramp filter,whose frequency response is |f |.The dis-crete formulation of backprojection isµ(x ,y )=πK Ki =1 θi(x cos θi +y sin θi ),(2)where θ(t )is a filtered projection at angle θ,and K is the number of projections taken during CT scanning at angles θi over a 180◦range.The number of val-ues in θ(t )depends on the image size.In the case of n ×n pixel images,N =√n D detectors are re-quired.The ratio D =d /τ,where d is the distance between adjacent pixels and τis the detector spac-ing,is a critical factor for the quality of the recon-structed image and it obviously should satisfy D >1.In our implementation,we utilize values of D ≈1.4and N =1024,which are typical for real systems.Higher values do not significantly increase the image quality.Algorithmically,Eq.(2)is implemented as a triple nested “for”loop.The outermost loop is over pro-jection angle,θ.For each θ,we update every pixel in the image in raster-scan order:starting in the up-per left corner and looping first over columns,c ,and next over rows,r .Thus,from (2),the pixel at loca-tion (r ,c )is incremented by the value of θ(t )where t is a function of r and c .The issue here is that the X-ray going through the currently reconstructed pixel,in general,intersects the detector array between detec-tors.This is solved by linear interpolation.The point of intersection is calculated as an address correspond-ing to detectors numbered from 0to 1023.The frac-tional part of this address is the interpolation factor.The equation that performs linear interpolation is given byint θ(i )=[ θ(i +1)− θ(i )]·I F + θ(i ),(3)where IF denotes the interpolation factor, θ(t )is the 1024element array containing filtered projection data at angle θ,and i is the integer part of the calculated address.The interpolation can be performed before-hand in software,or it can be a part of the backpro-jection hardware itself.We implement interpolation in hardware because it substantially reduces the amount of data that must be transmitted to the reconfigurable hardware board.The key to an efficient implementation of Eq.(2)is shown in Fig.1(b).It shows how a distance d between square areas that correspond to adjacent pixels can be converted to a distance t between locations where X-ray beams that go through the centers of these areas hit the detector array.This is also derived from the equa-tion t =x cos θ+y sin θ.Assuming that pixels are pro-cessed in raster-scan fashion,then t =d cos θfor two adjacent pixels in the same row (x 2=x 1+d )and sim-ilarly t =d sin θfor two adjacent pixels in the same column (y 2=y 1−d ).Our implementation is based on pre-computing and storing these deltas in look-up tables(LUTs).Three LUTs are used corresponding to the nested “for”loop structure of the backprojection algorithm.LUT 1stores the initial address along the detector axis (i.e.along t )for a given θrequired to update the pixel at row 1,column 1.LUT 2stores the increment in t required as we increment across a row.LUT 3stores the increment for columns.Parallel-Beam Backprojection299Figure2.Major simulation steps.3.QuantizationMapping the algorithm directly to hardware will not produce an efficient implementation.Several modifica-tions must be made to obtain a good hardware realiza-tion.The most significant modification is usingfixed-point arithmetic.For hardware implementation,narrow bit widths are preferred for more parallelism which translates to higher overall processing speed.How-ever,medical imaging requires high precision which may require wider bit widths.We did extensive analy-sis to optimize this tradeoff.We quantize all data and all calculations to increase the speed and decrease the re-sources required for implementation.Determining al-lowable quantization is based on a software simulation of the tomographic process.Figure2shows the major blocks of the simulation. An input image isfirst fed to the software implementa-tion of the Radon transform,also known as reprojection [14],which generates the sinogram of1024projections and1024samples per projection.Thefiltering block convolves sinogram data with the impulse response of the rampfilter generating afiltered sinogram,which is then backprojected to give a reconstructed image.All values in the backprojection algorithm are real numbers.These can be implemented as eitherfloating-point orfixed-point values.Floating-point represen-tation gives increased dynamic range,but is signifi-cantly more expensive to implement in reconfigurable hardware,both in terms of area and speed.For these reasons we have chosen to usefixed-point arithmetic. An important issue,especially in medical imaging,is how much numerical accuracy is sacrificed whenfixed-point values are used.Here,we present the methods used tofind appropriate bit-widths for maintaining suf-ficient numerical accuracy.In addition,we investigate possibilities for bit reduction on the outputs of certain functional units in the datapath for different rounding schemes,and what influence that has on the error intro-duced in reconstructed images.Our analysis shows that medical images display distinctive properties with re-spect to how different quantization choices affect their reconstruction.We exploit this and customize quan-tization to bestfit medical images.We compute the quantization error by comparing afixed-point image reconstruction with afloating-point one.Fixed-point variables in our design use a general slope/bias-encoding,meaning that they are represented asV≈V a=SQ+B,(4) where V is an arbitrary real number,V a is itsfixed-point approximation,Q is an integer that encodes V,S is the slope,and B is the bias.Fixed-point versions of the sinogram and thefiltered sinogram use slope/bias scaling where the slope and bias are calculated to give maximal precision.The quantization of these two vari-ables is calculated as:S=max(V)−min(V)max(Q)−min(Q)=max(V)−min(V)2,(5) B=max(V)−S·max(Q)orB=min(V)−S·min(Q),(6) Q=roundV−BS,(7)where ws is the word size in bits of integer Q.Here, max(V)and min(V)are the maximum and mini-mum values that V will take,respectively.max(V) was determined based on analysis of data.Since sinogram data are unsigned numbers,in this case min(V)=min(Q)=B=0.The interpolation factor is an unsigned fractional number and uses radix point-only scaling.Thus,the quantized interpolation factor is calculated as in Eq.(7),with saturation on overflow, with S=2−E where E is the number of fractional bits, and with B=0.For a given sinogram,S and B are constants and they do not show up in the hardware—only the quan-tized value Q is part of the hardware implementation. Note that in Eq.(3),two data samples are subtracted from each other before multiplication with the inter-polation factor takes place.Thus,in general,the bias B is eliminated from the multiplication,which makes quantization offiltered sinogram data with maximal precision scaling easily implementable in hardware.300Leeser etal.Figure 3.Some of the images used as inputs to the simulation process.The next important issue is the metric used for evalu-ating of the error introduced by quantization.Our goal was to find a metric that would accurately describe vi-sual differences between compared images regardless of their dynamic range.If 8-bit and 16-bit versions of a single image are reconstructed so that there is no vis-ible difference between the original and reconstructed images,the proper metric should give a comparable estimate of the error for both bit-widths.The proper metric should also be insensitive to the shift of pixel value range that can emerge for different quantization and rounding schemes.Absolute values of single pix-els do not effect visual image quality as long as their relative value is preserved,because pixel values are mapped to a set of grayscale values.The error metric we use that meets these criteria is the Relative Error (RE):RE = M i =1 (x i −¯x )− y F P i−¯y F P 2M i =1 y F P i−¯y F P ,(8)Here,M is the total number of pixels,x i and y F Pi are the values of the i -th pixel in the quantized and floating-point reconstructions respectively,and ¯x,¯y FP are their means.The mean value is sub-tracted because we only care about the relative pixel values.Figure 3shows some characteristic images from a larger set of 512-by-512-pixel images used as inputs to the simulation process.All images are monochrome 8-bit images,but 16-bit versions are also used in simu-lations.Each image was chosen for a certain reason.For example,the Shepp-Logan phantom is well known and widely used in testing the ability of algorithms to accu-rately reconstruct cross sections of the human head.It is believed that cross-sectional images of the human head are the most sensitive to numerical inaccuracies and the presence of artifacts induced by a reconstruction algo-rithm [1].Other medical images were Female,Head,and Heart obtained from the visible human web site [15].The Random image (a white noise image)should result in the upper bound on bit-widths required for a precise reconstruction.The Artificial image is unique because it contains all values in the 8-bit grayscale range.This image also contains straight edges of rect-angles,which induce more artifacts in the reconstructed image.This is also characteristic of the Head image,which contains a rectangular border around the head slice.Figure 4shows the detailed flowchart of the simu-lated CT process.In addition to the major blocks des-ignated as Reproject,Filter and Backproject,Fig.4also includes the different quantization steps that we have investigated.Each path in this flowchart rep-resents a separate simulation cycle.Cycle 1gives aParallel-Beam Backprojection301Figure 4.Detailed flowchart of the simulation process.floating-point (FP)reconstruction of an input image.All other cycles perform one or more type of quan-tization and their resulting images are compared to the corresponding FP reconstruction by computing the Relative Error.The first quantization step converts FP projection data obtained by the reprojection step to a fixed-point representation.Simulation cycle 2is used to determine how different bit-widths for quantized sino-gram data affect the quality of a reconstructed image.Our research was based on a prototype system that used 12-bit accurate detectors for the acquisition of sino-gram data.Simulations showed that this bit-width is a good choice since worst case introduced error amounts to 0.001%.The second quantization step performsthe Figure 5.Simulation results for the quantization of filtered sinogram data.conversion of filtered sinogram data from FP to fixed-point representation.Simulation cycle 3is used to find the appropriate bit-width of the words representing a filtered sinogram.Figure 5shows the results for this cycle.Since we use linear interpolation of projection values corresponding to adjacent detectors,the interpo-lation factor in Eq.(3)also has to be quantized.Figure 6summarizes results obtained from simulation cycle 4,which is used to evaluate the error induced by this quantization.Figures 5and 6show the Relative Error metric for different word length values and for different simula-tion cycles for a number of input images.Some input images were used in both 8-bit and 16-bit versions.302Leeser etal.Figure 6.Simulation results for the quantization of the interpolation factor.Figure 5corresponds to the quantization of filtered sinogram data (path 3in Fig.4).The conclusion here is that 9-bit quantization is the best choice since it gives considerably smaller error than 8-bit quantiza-tion,which for some images induces visible artifacts.At the same time,10-bit quantization does not give vis-ible improvement.The exceptions are images 2and 3,which require 13bits.From Fig.6(path 4in Fig.4),we conclude that 3bits for the interpolation factor (mean-ing the maximum error for the spatial address is 2−4)Figure 7.Relative error between fixed-point and floating-point reconstruction.is sufficiently accurate.As expected,image 1is more sensitive to the precision of the linear interpolation be-cause of its randomness.Figure 7shows that combining these quantization schemes results in a very small error for image “Head”in Fig.3.We also investigated whether it is feasible to discard some of the least significant bits (LSBs)on outputs of functional units (FUs)in the datapath and still not introduce any visible artifacts.The goal is for the re-constructed pixel values to have the smallest possibleParallel-Beam Backprojection 303bit-widths.This is based on the intuition that bit re-duction done further down the datapath will introduce a smaller amount of error in the result.If the same bit-width were obtained by simply quantizing filtered projection data with fewer bits,the error would be mag-nified by the operations performed in the datapath,es-pecially by the multiplication.Path number 5in Fig.4depicts the simulation cycles that investigates bit reduc-tion at the outputs of three of the FUs.These FUs imple-ment subtraction,multiplication and addition that are all part of the linear interpolation from Eq.(3).When some LSBs are discarded,the remaining part of a binary word can be rounded in different ways.We investigate two different rounding schemes,specifically rounding to nearest and truncation (or rounding to floor).Round-ing to nearest is expected to introduce the smallest er-ror,but requires additional logic resources.Truncation has no resource requirements,but introduces a nega-tive shift of values representing reconstructed pixels.Bit reduction effectively optimizes bit-widths of FUs that are downstream in the data flow.Figure 8shows tradeoffs of bit reduction and the two rounding schemes after multiplication for medi-cal images.It should be noted that sinogram data are quantized to 12bits,filtered sinogram to 9bits,and the interpolation factor is quantized to 3bits (2−4pre-cision).Similar studies were done for the subtraction and addition operations and on a broader set of im-ages.It was determined that medical images suffer the least amount of error introduced by combining quanti-zations and bit reduction.For medical images,in case of rounding to nearest,there is very little difference inthe Figure 8.Bit reduction on the output of the interpolation multiplier.introduced error between 1and 3discarded bits after multiplication and addition.This difference is higher in the case of bit reduction after addition because the multiplication that follows magnifies the error.For all three FUs,when only medical images are considered,there is a fixed relationship between rounding to near-est and truncation.Two least-significant bits discarded with rounding to nearest introduce an error that is lower than or close to the error of 1bit discarded with trun-cation.Although rounding to nearest requires logic re-sources,even when only one LSB is discarded with rounding to nearest after each of three FUs,the overall resource consumption is reduced because of savings provided by smaller FUs and pipeline registers (see Figs.11and 12).Figure 9shows that discarding LSBs introduces additional error on medical images for this combination of quantizations.In our case there was no need for using bit reduction to achieve smaller resource consumption because the targeted FPGA chip (Xilinx Virtex1000)provided sufficient logic resources.There is one more quantization issue we considered.It pertains to data needed for the generation of the ad-dress into a projection array (spatial address addr )and to the interpolation factor.As described in the intro-duction,there are three different sets of data stored in look-up tables (LUTs)that can be quantized.Since pixels are being processed in raster-scan order,the spa-tial address addr is generated by accumulating entries from LUTs 2and 3to the corresponding entry in LUT 1.The 10-bit integer part of the address addr is the index into the projection array θ(·),while its fractional part is the interpolation factor.By using radix point-only。
数字图像处理英文文献翻译参考
…………………………………………………装………………订………………线…………………………………………………………………Hybrid Genetic Algorithm Based Image EnhancementTechnologyMu Dongzhou Department of the Information Engineering XuZhou College of Industrial TechnologyXuZhou, China ****************.cnXu Chao and Ge Hongmei Department of the Information Engineering XuZhou College of Industrial TechnologyXuZhou, China ***************.cn,***************.cnAbstract—in image enhancement, Tubbs proposed a normalized incomplete Beta function to represent several kinds of commonly used non-linear transform functions to do the research on image enhancement. But how to define the coefficients of the Beta function is still a problem. We proposed a Hybrid Genetic Algorithm which combines the Differential Evolution to the Genetic Algorithm in the image enhancement process and utilize the quickly searching ability of the algorithm to carry out the adaptive mutation and searches. Finally we use the Simulation experiment to prove the effectiveness of the method.Keywords- Image enhancement; Hybrid Genetic Algorithm; adaptive enhancementI. INTRODUCTIONIn the image formation, transfer or conversion process, due to other objective factors such as system noise, inadequate or excessive exposure, relative motion and so the impact will get the image often a difference between the original image (referred to as degraded or degraded) Degraded image is usually blurred or after the extraction of information through the machine to reduce or even wrong, it must take some measures for its improvement.Image enhancement technology is proposed in this sense, and the purpose is to improve the image quality. Fuzzy Image Enhancement situation according to the image using a variety of special technical highlights some of the information in the image, reduce or eliminate the irrelevant information, to emphasize the image of the whole or the purpose of local features. Image enhancement method is still no unified theory, image enhancement techniques can be divided into three categories: point operations, and spatial frequency enhancement methods Enhancement Act. This paper presents an automatic adjustment according to the image characteristics of adaptive image enhancement method that called hybrid genetic algorithm. It combines the differential evolution algorithm of adaptive search capabilities, automatically determines the transformation function of the parameter values in order to achieve adaptive image enhancement.…………………………………………………装………………订………………线…………………………………………………………………II. IMAGE ENHANCEMENT TECHNOLOGYImage enhancement refers to some features of the image, such as contour, contrast, emphasis or highlight edges, etc., in order to facilitate detection or further analysis and processing. Enhancements will not increase the information in the image data, but will choose the appropriate features of the expansion of dynamic range, making these features more easily detected or identified, for the detection and treatment follow-up analysis and lay a good foundation.Image enhancement method consists of point operations, spatial filtering, and frequency domain filtering categories. Point operations, including contrast stretching, histogram modeling, and limiting noise and image subtraction techniques. Spatial filter including low-pass filtering, median filtering, high pass filter (image sharpening). Frequency filter including homomorphism filtering, multi-scale multi-resolution image enhancement applied [1].III. DIFFERENTIAL EVOLUTION ALGORITHMDifferential Evolution (DE) was first proposed by Price and Storn, and with other evolutionary algorithms are compared, DE algorithm has a strong spatial search capability, and easy to implement, easy to understand. DE algorithm is a novel search algorithm, it is first in the search space randomly generates the initial population and then calculate the difference between any two members of the vector, and the difference is added to the third member of the vector, by which Method to form a new individual. If you find that the fitness of new individual members better than the original, then replace the original with the formation of individual self.The operation of DE is the same as genetic algorithm, and it conclude mutation, crossover and selection, but the methods are different. We suppose that the group size is P, the vector dimension is D, and we can express the object vector as (1):xi=[xi1,xi2,…,xiD] (i =1,…,P)(1) And the mutation vector can be expressed as (2):()321rrriXXFXV-⨯+=i=1,...,P (2) 1rX,2rX,3rX are three randomly selected individuals from group, and r1≠r2≠r3≠i.F is a range of [0, 2] between the actual type constant factor difference vector is used to control the influence, commonly referred to as scaling factor. Clearly the difference between the vector and the smaller the disturbance also smaller, which means that if groups close to the optimum value, the disturbance will be automatically reduced.DE algorithm selection operation is a "greedy " selection mode, if and only if the new vector ui the fitness of the individual than the target vector is better when the individual xi, ui will be retained to the next group. Otherwise, the target vector xi individuals remain in the original group, once again as the next generation of the parent vector.…………………………………………………装………………订………………线…………………………………………………………………IV. HYBRID GA FOR IMAGE ENHANCEMENT IMAGEenhancement is the foundation to get the fast object detection, so it is necessary to find real-time and good performance algorithm. For the practical requirements of different systems, many algorithms need to determine the parameters and artificial thresholds. Can use a non-complete Beta function, it can completely cover the typical image enhancement transform type, but to determine the Beta function parameters are still many problems to be solved. This section presents a Beta function, since according to the applicable method for image enhancement, adaptive Hybrid genetic algorithm search capabilities, automatically determines the transformation function of the parameter values in order to achieve adaptive image enhancement.The purpose of image enhancement is to improve image quality, which are more prominent features of the specified restore the degraded image details and so on. In the degraded image in a common feature is the contrast lower side usually presents bright, dim or gray concentrated. Low-contrast degraded image can be stretched to achieve a dynamic histogram enhancement, such as gray level change. We use Ixy to illustrate the gray level of point (x, y) which can be expressed by (3).Ixy=f(x, y) (3) where: “f” is a linear or nonline ar function. In general, gray image have four nonlinear translations [6] [7] that can be shown as Figure 1. We use a normalized incomplete Beta function to automatically fit the 4 categories of image enhancement transformation curve. It defines in (4):()()()()10,01,111<<-=---⎰βαβαβαdtttBufu(4) where:()()⎰---=1111,dtttBβαβα(5) For different value of α and β, we can get response curve from (4) and (5).The hybrid GA can make use of the previous section adaptive differential evolution algorithm to search for the best function to determine a value of Beta, and then each pixel grayscale values into the Beta function, the corresponding transformation of Figure 1, resulting in ideal image enhancement. The detail description is follows:Assuming the original image pixel (x, y) of the pixel gray level by the formula (4),denoted byxyi,()Ω∈yx,, here Ω is the image domain. Enhanced image is denoted by Ixy. Firstly, the image gray value normalized into [0, 1] by (6).minmaxminiiiig xyxy--=(6)where:maxi andm ini express the maximum and minimum of image gray relatively.Define the nonlinear transformation function f(u) (0≤u≤1) to transform source image…………………………………………………装………………订………………线…………………………………………………………………Finally, we use the hybrid genetic algorithm to determine the appropriate Beta function f (u) the optimal parameters αand β. Will enhance the image Gxy transformed antinormalized.V. EXPERIMENT AND ANALYSISIn the simulation, we used two different types of gray-scale images degraded; the program performed 50 times, population sizes of 30, evolved 600 times. The results show that the proposed method can very effectively enhance the different types of degraded image.Figure 2, the size of the original image a 320 × 320, it's the contrast to low, and some details of the more obscure, in particular, scarves and other details of the texture is not obvious, visual effects, poor, using the method proposed in this section, to overcome the above some of the issues and get satisfactory image results, as shown in Figure 5 (b) shows, the visual effects have been well improved. From the histogram view, the scope of the distribution of image intensity is more uniform, and the distribution of light and dark gray area is more reasonable. Hybrid genetic algorithm to automatically identify the nonlinear…………………………………………………装………………订………………线…………………………………………………………………transformation of the function curve, and the values obtained before 9.837,5.7912, from the curve can be drawn, it is consistent with Figure 3, c-class, that stretch across the middle region compression transform the region, which were consistent with the histogram, the overall original image low contrast, compression at both ends of the middle region stretching region is consistent with human visual sense, enhanced the effect of significantly improved.Figure 3, the size of the original image a 320 × 256, the overall intensity is low, the use of the method proposed in this section are the images b, we can see the ground, chairs and clothes and other details of the resolution and contrast than the original image has Improved significantly, the original image gray distribution concentrated in the lower region, and the enhanced image of the gray uniform, gray before and after transformation and nonlinear transformation of basic graph 3 (a) the same class, namely, the image Dim region stretching, and the values were 5.9409,9.5704, nonlinear transformation of images degraded type inference is correct, the enhanced visual effect and good robustness enhancement.Difficult to assess the quality of image enhancement, image is still no common evaluation criteria, common peak signal to noise ratio (PSNR) evaluation in terms of line, but the peak signal to noise ratio does not reflect the human visual system error. Therefore, we use marginal protection index and contrast increase index to evaluate the experimental results.Edgel Protection Index (EPI) is defined as follows:…………………………………………………装………………订………………线…………………………………………………………………(7)Contrast Increase Index (CII) is defined as follows:minmaxminmax,GGGGCCCEOD+-==(8)In figure 4, we compared with the Wavelet Transform based algorithm and get the evaluate number in TABLE I.Figure 4 (a, c) show the original image and the differential evolution algorithm for enhanced results can be seen from the enhanced contrast markedly improved, clearer image details, edge feature more prominent. b, c shows the wavelet-based hybrid genetic algorithm-based Comparison of Image Enhancement: wavelet-based enhancement method to enhance image detail out some of the image visual effect is an improvement over the original image, but the enhancement is not obvious; and Hybrid genetic algorithm based on adaptive transform image enhancement effect is very good, image details, texture, clarity is enhanced compared with the results based on wavelet transform has greatly improved the image of the post-analytical processing helpful. Experimental enhancement experiment using wavelet transform "sym4" wavelet, enhanced differential evolution algorithm experiment, the parameters and the values were 5.9409,9.5704. For a 256 × 256 size image transform based on adaptive hybrid genetic algorithm in Matlab 7.0 image enhancement software, the computing time is about 2 seconds, operation is very fast. From TABLE I, objective evaluation criteria can be seen, both the edge of the protection index, or to enhance the contrast index, based on adaptive hybrid genetic algorithm compared to traditional methods based on wavelet transform has a larger increase, which is from This section describes the objective advantages of the method. From above analysis, we can see…………………………………………………装………………订………………线…………………………………………………………………that this method.From above analysis, we can see that this method can be useful and effective.VI. CONCLUSIONIn this paper, to maintain the integrity of the perspective image information, the use of Hybrid genetic algorithm for image enhancement, can be seen from the experimental results, based on the Hybrid genetic algorithm for image enhancement method has obvious effect. Compared with other evolutionary algorithms, hybrid genetic algorithm outstanding performance of the algorithm, it is simple, robust and rapid convergence is almost optimal solution can be found in each run, while the hybrid genetic algorithm is only a few parameters need to be set and the same set of parameters can be used in many different problems. Using the Hybrid genetic algorithm quick search capability for a given test image adaptive mutation, search, to finalize the transformation function from the best parameter values. And the exhaustive method compared to a significant reduction in the time to ask and solve the computing complexity. Therefore, the proposed image enhancement method has some practical value.REFERENCES[1] HE Bin et al., Visual C++ Digital Image Processing [M], Posts & Telecom Press,2001,4:473~477[2] Storn R, Price K. Differential Evolution—a Simple and Efficient Adaptive Scheme forGlobal Optimization over Continuous Space[R]. International Computer Science Institute, Berlaey, 1995.[3] Tubbs J D. A note on parametric image enhancement [J].Pattern Recognition.1997,30(6):617-621.[4] TANG Ming, MA Song De, XIAO Jing. Enhancing Far Infrared Image Sequences withModel Based Adaptive Filtering [J] . CHINESE JOURNAL OF COMPUTERS, 2000, 23(8):893-896.[5] ZHOU Ji Liu, LV Hang, Image Enhancement Based on A New Genetic Algorithm [J].Chinese Journal of Computers, 2001, 24(9):959-964.[6] LI Yun, LIU Xuecheng. On Algorithm of Image Constract Enhancement Based onWavelet Transformation [J]. Computer Applications and Software, 2008,8.[7] XIE Mei-hua, WANG Zheng-ming, The Partial Differential Equation Method for ImageResolution Enhancement [J]. Journal of Remote Sensing, 2005,9(6):673-679.…………………………………………………装………………订………………线…………………………………………………………………基于混合遗传算法的图像增强技术Mu Dongzhou 徐州工业职业技术学院信息工程系 XuZhou, China****************.cnXu Chao and Ge Hongmei 徐州工业职业技术学院信息工程系 XuZhou,********************.cn,***************.cn摘要—在图像增强之中,塔布斯提出了归一化不完全β函数表示常用的几种使用的非线性变换函数对图像进行研究增强。
图像去噪中英文对照外文翻译文献
中英文对照外文翻译文献(文档含英文原文和中文翻译)Complex Ridgelets for Image Denoising 1 IntroductionWavelet transforms have been successfully used in many scientific fields such as image compression, image denoising, signal processing, computer graphics,and pattern recognition, to name only a few.Donoho and his coworkers pioneered a wavelet denoising scheme by using soft thresholding and hard thresholding. This approach appears to be a good choice for a number of applications. This is because a wavelet transform can compact the energy of the image to only a small number of large coefficients and the majority of the wavelet coeficients are very small so that they can be set to zero. The thresholding of the wavelet coeficients can be done at only the detail wavelet decomposition subbands. We keep a few low frequency wavelet subbands untouched so that they are not thresholded. It is well known that Donoho's method offers the advantagesof smoothness and adaptation. However, as Coifmanand Donoho pointed out, this algorithm exhibits visual artifacts: Gibbs phenomena in the neighbourhood of discontinuities. Therefore, they propose in a translation invariant (TI) denoising scheme to suppress such artifacts by averaging over the denoised signals of all circular shifts. The experimental results in confirm that single TI wavelet denoising performs better than the non-TI case. Bui and Chen extended this TI scheme to the multiwavelet case and they found that TI multiwavelet denoising gave better results than TI single wavelet denoising. Cai and Silverman proposed a thresholding scheme by taking the neighbour coeficients into account Their experimental results showed apparent advantages over the traditional term-by-term wavelet denoising.Chen and Bui extended this neighbouring wavelet thresholding idea to the multiwavelet case. They claimed that neighbour multiwavelet denoising outperforms neighbour single wavelet denoising for some standard test signals and real-life images.Chen et al. proposed an image denoising scheme by considering a square neighbourhood in the wavelet domain. Chen et al. also tried to customize the wavelet _lter and the threshold for image denoising. Experimental results show that these two methods produce better denoising results. The ridgelet transform was developed over several years to break the limitations of the wavelet transform. The 2D wavelet transform of images produces large wavelet coeficients at every scale of the decomposition.With so many large coe_cients, the denoising of noisy images faces a lot of diffculties. We know that the ridgelet transform has been successfully used to analyze digital images. Unlike wavelet transforms, the ridgelet transform processes data by first computing integrals over different orientations and locations. A ridgelet is constantalong the lines x1cos_ + x2sin_ = constant. In the direction orthogonal to these ridges it is a wavelet.Ridgelets have been successfully applied in image denoising recently. In this paper, we combine the dual-tree complex wavelet in the ridgelet transform and apply it to image denoising. The approximate shift invariance property of the dual-tree complex wavelet and the good property of the ridgelet make our method a very good method for image denoising.Experimental results show that by using dual-tree complex ridgelets, our algorithms obtain higher Peak Signal to Noise Ratio (PSNR) for all the denoised images withdi_erent noise levels.The organization of this paper is as follows. In Section 2, we explain how to incorporate the dual-treecomplex wavelets into the ridgelet transform for image denoising. Experimental results are conducted in Section 3. Finally we give the conclusion and future work to be done in section 4.2 Image Denoising by using ComplexRidgelets Discrete ridgelet transform provides near-ideal sparsity of representation of both smooth objects and of objects with edges. It is a near-optimal method of denoising for Gaussian noise. The ridgelet transform can compress the energy of the image into a smaller number of ridgelet coe_cients. On the other hand, the wavelet transform produces many large wavelet coe_cients on the edges on every scale of the 2D wavelet decomposition. This means that many wavelet coe_cients are needed in order to reconstruct the edges in the image. We know that approximate Radon transforms for digital data can be based on discrete fast Fouriertransform. The ordinary ridgelet transform can be achieved as follows:1. Compute the 2D FFT of the image.2. Substitute the sampled values of the Fourier transform obtained on the square lattice with sampled values on a polar lattice.3. Compute the 1D inverse FFT on each angular line.4. Perform the 1D scalar wavelet transform on the resulting angular lines in order to obtain the ridgelet coe_cients.It is well known that the ordinary discrete wavelet transform is not shift invariant because of the decimation operation during the transform. A small shift in the input signal can cause very di_erent output wavelet coe_cients. In order to overcome this problem, Kingsbury introduced a new kind of wavelet transform, called the dual-tree complex wavelet transform, that exhibits approximate shift invariant property and improved angular resolution. Since the scalar wavelet is not shift invariant, it is better to apply the dual-tree complex wavelet in the ridgelet transform so that we can have what we call complex ridgelets. This can be doneby replacing the 1D scalar wavelet with the 1D dualtree complex wavelet transform in the last step of the ridgelet transform. In this way, we can combine the good property of the ridgelet transform with the approximate shift invariant property of the dual-tree complex wavelets.The complex ridgelet transform can be applied to the entire image or we can partition the image into a number of overlapping squares and we apply the ridgelet transform to each square. We decompose the original n _ n image into smoothly overlapping blocks of sidelength R pixels so that the overlap between two vertically adjacent blocks is a rectangular array of size R=2 _ R and the overlap between two horizontally adjacent blocks is a rectangular array of size R _ R=2 . For an n _ n image, we count 2n=R such blocks in each direction. This partitioning introduces a redundancy of 4 times. In order to get the denoised complex ridgelet coe_cient, we use the average of the four denoised complex ridgelet coe_cients in the current pixel location.The thresholding for the complex ridgelet transform is similar to the curvelet thresholding [10]. One difference is that we take the magnitude of the complex ridgelet coe_cients when we do the thresholding. Let y_ be the noisy ridgelet coe_cients. We use the following hard thresholding rule for estimating the unknown ridgelet coe_cients. When jy_j > k_~_, we let ^y_ = y_. Otherwise, ^y_ = 0. Here, ~It is approximated by using Monte-Carlo simulations. The constant k used is dependent on the noise . When the noise is less than 30, we use k = 5 for the first decomposition scale and k = 4 for other decomposition scales. When the noise _ is greater than 30, we use k = 6 for the _rst decomposition scale and k = 5 for other decomposition scales.The complex ridgelet image denoising algorithm can be described as follows:1. Partition the image into R*R blocks with two vertically adjacent blocks overlapping R=2*R pixels and two horizontally adjacent blocks overlapping R _ R=2 pixels2. For each block, Apply the proposed complex ridgelets, threshold thecomplex ridgelet coefficients, and perform inverse complex ridgelet transform.3. Take the average of the denoising image pixel values at the same location.We call this algorithm ComRidgeletShrink,while the algorithm using the ordinary ridgelets RidgeletShrink. The computational complexity of ComRidgeletShrink is similar to that of RidgeletShrink by using the scalar wavelets. The only di_erence is that we replaced the 1D wavelet transform with the 1D dual-tree complex wavelet transform. The amount of computation for the 1D dual-tree complex wavelet is twice that of the 1D scalar wavelet transform. However, other steps of the algorithm keep the same amount of computation. Our experimental results show that ComRidgeletShrink outperforms V isuShrink, RidgeletShink, and wiener2 _lter for all testing cases. Under some case, we obtain 0.8dB improvement in Peak Signal to Noise Ratio (PSNR) over RidgeletShrink. The improvement over V isuShink is even bigger for denoising all images. This indicates that ComRidgeletShrink is an excellent choice for denoising natural noisy images.3 Experimental ResultsWe perform our experiments on the well-known image Lena. We get this image from the free software package WaveLab developed by Donoho et al. at Stanford University. Noisy images with di_erent noise levels are generated by adding Gaussian white noise to the original noise-free images. For comparison, we implement VisuShrink, RidgeletShrink, ComRidgeletShrink and wiener2. VisuShrink is the universal soft-thresholding denoising technique. The wiener2 function is available in the MATLAB Image Processing Toolbox, and we use a 5*5 neighborhood of each pixel in the image for it. The wiener2 function applies a Wiener _lter (a type of linear filter) to an image adaptively, tailoring itself to the local image variance. The experimental results in Peak Signal to Noise Ratio (PSNR) are shown in Table 1. We find that the partition block size of 32 * 32 or 64 *64 is our best choice. Table 1 is for denoising image Lena, for di_erent noise levels and afixed partition block size of 32 *32 pixels.The first column in these tables is the PSNR of the original noisy images, while other columns are thePSNR of the denoised images by using di_erent denoising methods. The PSNR is de_ned as PSNR = 10 log10 Pi;j (B(i; j) A(i; j))2 n22552 : where B is the denoised image and A is the noise-free image. From Table 1 we can see that ComRidgeletShrink outperforms VisuShrink, the ordinary RidgeletShrink, and wiener2 for all cases. VisuShrink does not have any denoising power when the noise level is low. Under such a condition, VisuShrink produces even worse results than the original noisy images. However, ComRidgeletShrink performs very well in this case. For some case, ComRidgeletShrink gives us about 0.8 dB improvement over the ordinary RidgeletShink. This indicates that by combining the dual-tree complex wavelet into the ridgelet transform we obtain signi_cant improvement in image denoising. The improvement of ComRidgeletShrink over V isuShrink is even more signi_cant for all noisy levels and testing images. Figure 1 shows the noise free image, the image with noise added, the denoised image with VisuShrink, the denoised image with RidgeletShrink, the denoised image with ComRidgeletShrink, and the denoised image with wiener2 for images Lena, at a partition block size of 32*32 pixels. It can be seen that ComRidgeletShrink produces visually sharper denoised images than V isuShrink, the ordinary RidgeletShrink, and wiener2 filter, in terms of higher quality recovery of edges and linear and curvilinear features.4 Conclusions and Future WorkIn this paper, we study image denoising by using complex ridgelets. Our complex ridgelet transform is obtained by performing 1D dual-tree complex wavelet onto the Radon transform coe_cients. The Radon transform is done by means of the projection-slice theorem. The approximate shift invariant property of the dual-tree complex wavelet transform makes the complex ridgelet transform an excellent choice for image denoising. The complex ridgelet transform provides near-ideal sparsity of representation for both smooth objects and objects with edges. This makes the thresholding of noisy ridgelet coe_cients a near-optimal method of denoising for Gaussian white noise. We test our new denoising method with several standard images with Gaussian white noise added to the images. A very simple hard thresholding of the complex ridgelet coe_cients is used. Experimental results show that complex ridgelets give better denoising resultsthan VisuShrink, wiener2, and the ordinary ridgelets under all experiments. We suggest that ComRidgeletShrink be used for practical image denoising applications. Future work will be done by considering complex ridgelets in curvelet image denoising. Also, complex ridgelets could be applied to extract invariant features for pattern recognition.复杂脊波图像去噪1.介绍小波变换已成功地应用于许多科学领域,如图像压缩,图像去噪,信号处理,计算机图形,IC和模式识别,仅举几例。
图像处理外文翻译

附录A3 Image Enhancement in the Spatial DomainThe principal objective of enhancement is to process an image so that the result is more suitable than the original image for a specific application. The word specific is important, because it establishes at the outset than the techniques discussed in this chapter are very much problem oriented. Thus, for example, a method that is quite useful for enhancing X-ray images may not necessarily be the best approach for enhancing pictures of Mars transmitted by a space probe. Regardless of the method used .However, image enhancement is one of the most interesting and visually appealing areas of image processing.Image enhancement approaches fall into two broad categories: spatial domain methods and frequency domain methods. The term spatial domain refers to the image plane itself, and approaches in this category are based on direct manipulation of pixels in an image. Fourier transform of an image. Spatial methods are covered in this chapter, and frequency domain enhancement is discussed in Chapter 4.Enhancement techniques based on various combinations of methods from these two categories are not unusual. We note also that many of the fundamental techniques introduced in this chapter in the context of enhancement are used in subsequent chapters for a variety of other image processing applications.There is no general theory of image enhancement. When an image is processed for visual interpretation, the viewer is the ultimate judge of how well a particular method works. Visual evaluation of image quality is a highly is highly subjective process, thus making the definition of a “good image” an elusive standard by which to compare algorithm performance. When the problem is one of processing images for machine perception, the evaluation task is somewhat easier. For example, in dealing with a character recognition application, and leaving aside other issues such as computational requirements, the best image processing method would be the one yielding the best machine recognition results. However, even in situations when aclear-cut criterion of performance can be imposed on the problem, a certain amount of trial and error usually is required before a particular image enhancement approach is selected.3.1 BackgroundAs indicated previously, the term spatial domain refers to the aggregate of pixels composing an image. Spatial domain methods are procedures that operate directly on these pixels. Spatial domain processes will be denotes by the expression()[]=(3.1-1)g x y T f x y,(,)where f(x, y) is the input image, g(x, y) is the processed image, and T is an operator on f, defined over some neighborhood of (x, y). In addition, T can operate on a set of input images, such as performing the pixel-by-pixel sum of K images for noise reduction, as discussed in Section 3.4.2.The principal approach in defining a neighborhood about a point (x, y) is to use a square or rectangular subimage area centered at (x, y).The center of the subimage is moved from pixel to starting, say, at the top left corner. The operator T is applied at each location (x, y) to yield the output, g, at that location. The process utilizes only the pixels in the area of the image spanned by the neighborhood. Although other neighborhood shapes, such as approximations to a circle, sometimes are used, square and rectangular arrays are by far the most predominant because of their ease of implementation.The simplest from of T is when the neighborhood is of size 1×1 (that is, a single pixel). In this case, g depends only on the value of f at (x, y), and T becomes a gray-level (also called an intensity or mapping) transformation function of the form=(3.1-2)s T r()where, for simplicity in notation, r and s are variables denoting, respectively, the grey level of f(x, y) and g(x, y)at any point (x, y).Some fairly simple, yet powerful, processing approaches can be formulates with gray-level transformations. Because enhancement at any point in an image depends only on the grey level at that point, techniques in this category often are referred to as point processing.Larger neighborhoods allow considerably more flexibility. The general approach is to use a function of the values of f in a predefined neighborhood of (x, y) to determine the value of g at (x, y). One of the principal approaches in this formulation is based on the use of so-called masks (also referred to as filters, kernels, templates, or windows). Basically, a mask is a small (say, 3×3) 2-Darray, in which the values of the mask coefficients determine the nature of the type of approach often are referred to as mask processing or filtering. These concepts are discussed in Section 3.5.3.2 Some Basic Gray Level TransformationsWe begin the study of image enhancement techniques by discussing gray-level transformation functions. These are among the simplest of all image enhancement techniques. The values of pixels, before and after processing, will be denoted by r and s, respectively. As indicated in the previous section, these values are related by an expression of the from s = T(r), where T is a transformation that maps a pixel value r into a pixel value s. Since we are dealing with digital quantities, values of the transformation function typically are stored in a one-dimensional array and the mappings from r to s are implemented via table lookups. For an 8-bit environment, a lookup table containing the values of T will have 256 entries.As an introduction to gray-level transformations, which shows three basic types of functions used frequently for image enhancement: linear (negative and identity transformations), logarithmic (log and inverse-log transformations), and power-law (nth power and nth root transformations). The identity function is the trivial case in which out put intensities are identical to input intensities. It is included in the graph only for completeness.3.2.1 Image NegativesThe negative of an image with gray levels in the range [0, L-1]is obtained by using the negative transformation show shown, which is given by the expression=--(3.2-1)s L r1Reversing the intensity levels of an image in this manner produces the equivalent of a photographic negative. This type of processing is particularly suited for enhancing white or grey detail embedded in dark regions of an image, especiallywhen the black areas are dominant in size.3.2.2 Log TransformationsThe general from of the log transformation is=+(3.2-2)log(1)s c rWhere c is a constant, and it is assumed that r ≥0 .The shape of the log curve transformation maps a narrow range of low gray-level values in the input image into a wider range of output levels. The opposite is true of higher values of input levels. We would use a transformation of this type to expand the values of dark pixels in an image while compressing the higher-level values. The opposite is true of the inverse log transformation.Any curve having the general shape of the log functions would accomplish this spreading/compressing of gray levels in an image. In fact, the power-law transformations discussed in the next section are much more versatile for this purpose than the log transformation. However, the log function has the important characteristic that it compresses the dynamic range of image characteristics of spectra. It is not unusual to encounter spectrum values that range from 0 to 106 or higher. While processing numbers such as these presents no problems for a computer, image display systems generally will not be able to reproduce faithfully such a wide range of intensity values .The net effect is that a significant degree of detail will be lost in the display of a typical Fourier spectrum.3.2.3 Power-Law TransformationsPower-Law transformations have the basic froms crϒ=(3.2-3) Where c and y are positive constants .Sometimes Eq. (3.2-3) is written as to account for an offset (that is, a measurable output when the input is zero). However, offsets typically are an issue of display calibration and as a result they are normally ignored in Eq. (3.2-3). Plots of s versus r for various values of y are shown in Fig.3.6. As in the case of the log transformation, power-law curves with fractional values of y map a narrow range of dark input values into a wider range of output values, with theopposite being true for higher values of input levels. Unlike the log function, however, we notice here a family of possible transformation curves obtained simply by varying y. As expected, we see in Fig.3.6 that curves generated with values of y>1 have exactly the opposite effect as those generated with values of y<1. Finally, we note that Eq.(3.2-3) reduces to the identity transformation when c = y = 1.A variety of devices used for image capture, printing, and display respond according to as gamma[hence our use of this symbol in Eq.(3.2-3)].The process used to correct this power-law response phenomena is called gamma correction.Gamma correction is important if displaying an image accurately on a computer screen is of concern. Images that are not corrected properly can look either bleached out, or, what is more likely, too dark. Trying to reproduce colors accurately also requires some knowledge of gamma correction because varying the value of gamma correcting changes not only the brightness, but also the ratios of red to green to blue. Gamma correction has become increasingly important in the past few years, as use of digital images for commercial purposes over the Internet has increased. It is not Internet has increased. It is not unusual that images created for a popular Web site will be viewed by millions of people, the majority of whom will have different monitors and/or monitor settings. Some computer systems even have partial gamma correction built in. Also, current image standards do not contain the value of gamma with which an image was created, thus complicating the issue further. Given these constraints, a reasonable approach when storing images in a Web site is to preprocess the images with a gamma that represents in a Web site is to preprocess the images with a gamma that represents an “average” of the types of monitors and computer systems that one expects in the open market at any given point in time.3.2.4 Piecewise-Linear Transformation FunctionsA complementary approach to the methods discussed in the previous three sections is to use piecewise linear functions. The principal advantage of piecewise linear functions over the types of functions we have discussed thus far is that the form of piecewise functions can be arbitrarily complex. In fact, as we will see shortly, a practical implementation of some important transformations can be formulated onlyas piecewise functions. The principal disadvantage of piecewise functions is that their specification requires considerably more user input.Contrast stretchingOne of the simplest piecewise linear functions is a contrast-stretching transformation. Low-contrast images can result from poor illumination, lack of dynamic range in the imaging sensor, or even wrong setting of a lens aperture during image acquisition. The idea behind contrast stretching is to increase the dynamic range of the gray levels in the image being processed.Gray-level slicingHighlighting a specific range of gray levels in an image often is desired. Applications include enhancing features such as masses of water in satellite imagery and enhancing flaws in X-ray images. There are several ways of doing level slicing, but most of them are variations of two basic themes. One approach is to display a high value for all gray levels in the range of interest and a low value for all other gray levels.Bit-plane slicingInstead of highlighting gray-level ranges, highlighting the contribution made to total image appearance by specific bits might be desired. Suppose that each pixel in an image is represented by 8 bits. Imagine that the image is composed of eight 1-bit planes, ranging from bit-plane 0 for the least significant bit to bit-plane 7 for the most significant bit. In terms of 8-bit bytes, plane 0 contains all the lowest order bits in the bytes comprising the pixels in the image and plane 7 contains all the high-order bits.3.3 Histogram ProcessingThe histogram of a digital image with gray levels in the range [0, L-1] is a discrete function , where is the kth gray level and is the number of pixels in the image having gray level . It is common practice to pixels in the image, denoted by n. Thus, a normalized histogram is given by , for , Loosely speaking, gives an estimate of the probability of occurrence of gray level . Note that the sum of all components of a normalized histogram is equal to 1.Histograms are the basis for numerous spatial domain processing techniques.Histogram manipulation can be used effectively for image enhancement, as shown in this section. In addition to providing useful image statistics, we shall see in subsequent chapters that the information inherent in histograms also is quite useful in other image processing applications, such as image compression and segmentation. Histograms are simple to calculate in software and also lend themselves to economic hardware implementations, thus making them a popular tool for real-time image processing.附录B第三章空间域图像增强增强的首要目标是处理图像,使其比原始图像格式和特定应用。
CCD图像图像处理外文文献翻译、中英文翻译、外文翻译
附录附录1翻译部分Raw CCD images are exceptional but not perfect. Due to the digital nature of the data many of the imperfections can be compensated for or calibrated out of the final image through digital image processing.Composition of a Raw CCD Image.A raw CCD image consists of the following signal components:IMAGE SIGNAL - The signal from the source.Electrons are generated from the actual source photons.BIAS SIGNAL - Initial signal already on the CCD before the exposure is taken. This signal is due to biasing the CCD offset slightly above zero A/D counts (ADU).THERMAL SIGNAL - Signal (Dark Current thermal electrons) due to the thermal activity of the semiconductor. Thermal signal is reduced by cooling of the CCD to low temperature.Sources of NoiseCCD images are susceptible to the following sources of noise:PHOTON NOISE - Random fluctuations in the photon signal of the source. The rate at which photons are received is not constant.THERMAL NOISE - Statistical fluctuations in the generation of Thermal signal. The rate at which electrons are produced in the semiconductor substrate due to thermal effects is not constant.READOUT NOISE - Errors in reading the signal; generally dominated by theon-chip amplifier.QUANTIZATION NOISE - Errors introduced in the A/D conversion process.SENSITIVITY VARIATION - Sensitivity variations from photosite to photosite on the CCD detector or across the detector. Modern CCD's are uniform to better than 1%between neighboring photosites and uniform to better than 10% across the entire surface.Noise CorrectionsREDUCING NOISE - Readout Noise and Quantization Noise are limited by the construction of the CCD camera and can not be improved upon by the user. Thermal Noise, however, can be reduced by cooling of the CCD (temperature regulation). The Sensitivity Variations can be removed by proper flat fielding.CORRECTING FOR THE BIAS AND THERMAL SIGNALS - The Bias and Thermal signals can be subtracted out from the Raw Image by taking what is called a Dark Exposure. The dark exposure is a measure of the Bias Signal and Thermal Signal and may simply be subtracted from the Raw Image.FLAT FIELDING -A record of the photosite to photosite sensitivity variations can be obtained by taking an exposure of a uniformly lit 'flat field". These variations can then be divided out of the Raw Image to produce an image essentially free from this source of error. Any length exposure will do, but ideally one which saturates the pixels to the 50% or 75% level is best.The Final Processed ImageThe final Processed Image which removes unwanted signals and reduces noise as best we can is computed as follows:Final Processed Image = (Raw - Dark)/FlatAll of the digital image processing functions described above can be accomplished by using CCDOPS software furnished with each SBIG imaging camera. The steps to accomplish them are described in the Operating Manual furnished with each SBIG imaging camera. At SBIG we offer our technical support to help you with questions on how to improve your images.HOW TO SELECT THE CORRECT CCD IMAGING CAMERA FOR YOUR TELESCOPEWhen new customers contact SBIG we discuss their imaging camera application. We try to get an idea of their interests. We have found this method is an effective way of insuring that our customers get the right imaging camera for their purposes. Someof the questions we ask are as follows:What type of telescope do you presently own? Having this information allows us to match the CCD imaging Camera's parameters, pixel size and field of view to your telescope. We can also help you interface the CCD imaging camera's automatic guiding functions to your telescope.Are you a MAC or PC user? Since our software supports both of these platforms we can insure that you receive the correct software. We can also answer questions about any unique functions in one or the other. We can send you a demonstration copy of the appropriate software for your review.Do you have a telescope drive base with an autoguider port? Do you want to operate from a remote computer? Companies like Software Bisque fully support our products with telescope control and imaging camera software.Do you want to take photographic quality images of deep space objects, image planets, or perform wide field searches for near earth asteroids or supernovas? In learning about your interests we can better guide you to the optimum CCD pixel size and imaging area for the application.Do you want to make photometric measurements of variable stars or determine precise asteroid positions? From this information we can recommend a CCD imaging camera model and explain how to use the specific analysis functions to perform these tasks. We can help you characterize your imaging camera by furnishing additional technical data.Do you want to automatically guide long uninterrupted astrophotographs? As the company with the most experience in CCD autoguiding we can help you install and operate a CCD autoguider on your telescope. The Model STV has a worldwide reputation for accurate guiding on dim guide stars. No matter what type of telescope you own we can help you correctly interface it and get it working properly.SBIG CCD IMAGING CAMERASThe SBIG product line consists of a series of thermoelectrically cooled CCD imaging cameras designed for a wide range of applications ranging from astronomy, tricolor imaging, color photometry, spectroscopy, medical imaging, densitometry, to chemiluminescence and epifluorescence imaging, etc. This catalog includes information on astronomical imaging cameras, scientific imaging cameras,autoguiding, and accessories. We have tried to arrange the catalog so that it is easy to compare products by specifications and performance. The tables in the product section compare some of the basic characteristics on each CCD imaging camera in our product line. You will find a more detailed set of specifications with each individual imaging camera description.HOW TO GET STARTED USING YOUR CCD IMAGING CAMERAIt all starts with the software. If there's any company well known for its outstanding imaging camera software it's SBIG. Our CCDOPS Operating Software is well known for its user oriented camera control features and stability. CCDOPS is available for free download from our web site along with sample images that you can display and analyze using the image processing and analysis functions of the CCDOPS software. You can become thoroughly familiar with how our imaging cameras work and the capabilities of the software before you purchase an imaging camera. We also include CCDSoftV5 and TheSky from Software Bisque with most of our cameras at no additional charge. Macintosh users receive a free copy of EquinoX planetarium and camera control software for the MacOS-X operating system. No other manufacturer offers better software than you get with SBIG cameras. New customers receiving their CCD imaging camera should first read the installation section in their CCDOPS Operating Manual. Once you have read that section you should have no difficulty installing CCDOPS software on your hard drive, connecting the USB cable from the imaging camera to your computer, initiating the imaging camera and within minutes start taking your first CCD images. Many of our customers are amazed at how easy it is to start taking images. Additional information can be found by reading the image processing sections of the CCDOPS and CCDSoftV5 Manuals. This information allows you to progress to more advanced features such as automatic dark frame subtraction of images, focusing the imaging camera, viewing, analyzing and processing the images on the monitor, co-adding images, taking automatic sequences of images, photometric and astrometric measurements, etc.A PERSONAL TOUCH FROM SBIGAt SBIG we have had much success with a program in which we continually review customer's images sent to us on disk or via e-mail. We can often determine the cause of a problem from actual images sent in by a user. We review the images and contacteach customer personally. Images displaying poor telescope tracking, improper imaging camera focus, oversaturated images, etc., are typical initial problems. We will help you quickly learn how to improve your images. You can be assured of personal technical support when you need it. The customer support program has furnished SBIG with a large collection of remarkable images. Many customers have had their images published in SBIG catalogs, ads, and various astronomy magazines. We welcome the chance to review your images and hope you will take advantage of our trained staff to help you improve your images.TRACK AND ACCUMULATE (U.S. Patent # 5,365,269)Using an innovative engineering approach SBIG developed an imaging camera function called Track & Accumulate (TRACCUM) in which multiple images are automatically registered to create a single long exposure. Since the long exposure consists of short images the total combined exposure significantly improves resolution by reducing the cumulative telescope periodic error. In the TRACCUM mode each image is shifted to correct guiding errors and added to the image buffer. In this mode the telescope does not need to be adjusted. The great sensitivity of the CCD virtually guarantees that there will be a usable guide star within the field of view. This feature provides dramatic improvement in resolution by reducing the effect of periodic error and allowing unattended hour long exposures. SBIG has been granted U.S. Patent # 5,365,269 for Track & Accumulate.DUAL CCD SELF-GUIDING (U.S. Patent # 5,525,793)In 1994 with the introduction of Models ST-7 and ST-8 CCD Imaging Cameras which incorporate two separate CCD detectors, SBIG was able to accomplish the goal of introducing a truly self-guided CCD imaging camera. The ability to select guide stars with a separate CCD through the full telescope aperture is equivalent to having a thermoelectrically cooled CCD autoguider in your imaging camera. This feature has been expanded to all dual sensor ST series cameras (ST-7/8/9/10/2000) and all STL series cameras (STL-1001/1301/4020/6303/11000). One CCD is used for guiding and the other for collecting the image. They are mounted in close proximity, both focused at the same plane, allowing the imaging CCD to integrate while the PC uses the guiding CCD to correct the telescope. Using a separate CCD for guiding allows 100% of the primary CCD's active area to be used to collect the image. The telescope correction rate and limiting guide star magnitude can be independentlyselected. Tests at SBIG indicated that 95% of the time a star bright enough for guiding will be found on a TC237 tracking CCD without moving the telescope, using an f/6.3 telescope. The self-guiding function quickly established itself as the easiest and most accurate method for guiding CCD images. Placing both detectors in close proximity at the same focal plane insures the best possible guiding. Many of the long integrated exposures now being published are taken with this self-guiding method, producing very high resolution images of deep space objects. SBIG has been granted U.S. Patent # 5,525,793 for the dual CCD Self-Guiding function.COMPUTER PLATFORMSSBIG has been unique in its support of both PC and Macintosh platforms for our cameras. The imaging cameras in this catalog communicate with the host computer through standard serial or USB ports depending on the specific models. Since there are no external plug-in boards required with our imaging camera systems we encourage users to operate with the new family of high resolution graphics laptop computers. We furnish Operating Software for you to install on your host computer. Once the software is installed and communication with the imaging camera is set up complete control of all of the imaging camera functions is through the host computer keyboard. The recommended minimum requirements for memory and video graphics are as shown below.GENERAL CONCLUSION(1) of this item from the theoretical analysis of the use of CCD technology for real-time non-contact measuring the diameter of the feasibility of measuring it is fast, efficient, accurate, high degree of automation, off-production time and so on.(2) projects to test the use of CCD technology to achieve real-time, online non-contact measurement, developed by the CCD-line non-contact diameter measurement system has a significant technology advanced and practical application of significance. (3) from the theoretical and experimental project on the summary of the utilization of CCD technology developed by SCM PV systems improve the measurement accuracy of several ways: improving crystal, a multi-pixel CCD devices and take full advantage of CCD-like device Face width.译文原料CCD图像是例外,但并非十全十美。
图像处理外文翻译
英文资料翻译Image processing is not a one step process.We are able to distinguish between several steps which must be performed one after the other until we can extract the data of interest from the observed scene.In this way a hierarchical processing scheme is built up as sketched in Fig.The figure gives an overview of the different phases of image processing.Image processing begins with the capture of an image with a suitable,not necessarily optical,acquisition system.In a technical or scientific application,we may choose to select an appropriate imaging system.Furthermore,we can set up the illumination system,choose the best wavelength range,and select other options to capture the object feature of interest in the best way in an image.Once the image is sensed,it must be brought into a form that can be treated with digital computers.This process is called digitization.With the problems of traffic are more and more serious. Thus Intelligent Transport System (ITS) comes out. The subject of the automatic recognition of license plate is one of the most significant subjects that are improved from the connection of computer vision and pattern recognition. The image imputed to the computer is disposed and analyzed in order to localization the position and recognition the characters on the license plate express these characters in text string form The license plate recognition system (LPSR) has important application in ITS. In LPSR, the first step is for locating the license plate in the captured image which is very important for character recognition. The recognition correction rate of license plate is governed by accurate degree of license plate location. In this paper, several of methods in image manipulation are compared and analyzed, then come out the resolutions for localization of the car plate. The experiences show that the good result has been got with these methods. The methods based on edge map and frequency analysis is used in the process of the localization of the license plate, that is to say, extracting the characteristics of the license plate in the car images after being checked up for the edge, and then analyzing and processing until the probably area of license plate is extracted.The automated license plate location is a part of the image processing ,it’s also an important part in the intelligent traffic system.It is the key step in the Vehicle License Plate Recognition(LPR).A method for the recognition of images of different backgrounds and different illuminations is proposed in the paper.the upper and lower borders are determined through the gray variation regulation of the character distribution.The left and right borders are determined through the black-white variation of the pixels in every row.The first steps of digital processing may include a number of different operations and are known as image processing.If the sensor has nonlinear characteristics, these need to be corrected.Likewise,brightness and contrast of the image may require improvement.Commonly,too,coordinate transformations are needed torestore geometrical distortions introduced during image formation.Radiometric and geometric corrections are elementary pixel processing operations.It may be necessary to correct known disturbances in the image,for instance caused by a defocused optics,motion blur,errors in the sensor,or errors in the transmission of image signals.We also deal with reconstruction techniques which are required with many indirect imaging techniques such as tomography that deliver no direct image.A whole chain of processing steps is necessary to analyze and identify objects.First,adequate filtering procedures must be applied in order to distinguish the objects of interest from other objects and the background.Essentially,from an image (or several images),one or more feature images are extracted.The basic tools for this task are averaging and edge detection and the analysis of simple neighborhoods and complex patterns known as texture in image processing.An important feature of an object is also its motion.Techniques to detect and determine motion are necessary.Then the object has to be separated from the background.This means that regions of constant features and discontinuities must be identified.This process leads to a label image.Now that we know the exact geometrical shape of the object,we can extract further information such as the mean gray value,the area,perimeter,and other parameters for the form of the object[3].These parameters can be used to classify objects.This is an important step in many applications of image processing,as the following examples show:In a satellite image showing an agricultural area,we would like to distinguish fields with different fruits and obtain parameters to estimate their ripeness or to detect damage by parasites.There are many medical applications where the essential problem is to detect pathologi-al changes.A classic example is the analysis of aberrations in chromosomes.Character recognition in printed and handwritten text is another example which has been studied since image processing began and still poses significant difficulties.You hopefully do more,namely try to understand the meaning of what you are reading.This is also the final step of image processing,where one aims to understand the observed scene.We perform this task more or less unconsciously whenever we use our visual system.We recognize people,we can easily distinguish between the image of a scientific lab and that of a living room,and we watch the traffic to cross a street safely.We all do this without knowing how the visual system works.For some times now,image processing and computer-graphics have been treated as two different areas.Knowledge in both areas has increased considerably and more complex problems can now be treated.Computer graphics is striving to achieve photorealistic computer-generated images of three-dimensional scenes,while image processing is trying to reconstruct one from an image actually taken with a camera.In this sense,image processing performs the inverse procedure to that of computer graphics.We start with knowledge of the shape and features of an object—at the bottom of Fig. and work upwards until we get a two-dimensional image.To handle image processing or computer graphics,we basically have to work from the sameknowledge.We need to know the interaction between illumination and objects,how a three-dimensional scene is projected onto an image plane,etc.There are still quite a few differences between an image processing and a graphics workstation.But we can envisage that,when the similarities and interrelations between computergraphics and image processing are better understood and the proper hardware is developed,we will see some kind of general-purpose workstation in the future which can handle computer graphics as well as image processing tasks[5].The advent of multimedia,i. e. ,the integration of text,images,sound,and movies,will further accelerate the unification of computer graphics and image processing.In January 1980 Scientific American published a remarkable image called Plume2,the second of eight volcanic eruptions detected on the Jovian moon by the spacecraft V oyager 1 on 5 March 1979.The picture was a landmark image in interplanetary exploration—the first time an erupting volcano had been seen in space.It was also a triumph for image processing.Satellite imagery and images from interplanetary explorers have until fairly recently been the major users of image processing techniques,where a computer image is numerically manipulated to produce some desired effect-such as making a particular aspect or feature in the image more visible.Image processing has its roots in photo reconnaissance in the Second World War where processing operations were optical and interpretation operations were performed by humans who undertook such tasks as quantifying the effect of bombing raids.With the advent of satellite imagery in the late 1960s,much computer-based work began and the color composite satellite images,sometimes startlingly beautiful, have become part of our visual culture and the perception of our planet.Like computer graphics,it was until recently confined to research laboratories which could afford the expensive image processing computers that could cope with the substantial processing overheads required to process large numbers of high-resolution images.With the advent of cheap powerful computers and image collection devices like digital cameras and scanners,we have seen a migration of image processing techniques into the public domain.Classical image processing techniques are routinely employed by graphic designers to manipulate photographic and generated imagery,either to correct defects,change color and so on or creatively to transform the entire look of an image by subjecting it to some operation such as edge enhancement.A recent mainstream application of image processing is the compression of images—either for transmission across the Internet or the compression of moving video images in video telephony and video conferencing.Video telephony is one of the current crossover areas that employ both computer graphics and classical image processing techniques to try to achieve very high compression rates.All this is part of an inexorable trend towards the digital representation of images.Indeed that most powerful image form of the twentieth century—the TV image—is also about to be taken into the digital domain.Image processing is characterized by a large number of algorithms that are specific solutions to specific problems.Some are mathematical or context-independent operations that are applied to each and every pixel.For example,we can use Fourier transforms to perform image filtering operations.Others are“algorithmic”—we may use a complicated recursive strategy to find those pixels that constitute the edges in an image.Image processing operations often form part of a computer vision system.The input image may be filtered to highlight or reveal edges prior to a shape detection usually known as low-level operations.In computer graphics filtering operations are used extensively to avoid abasing or sampling artifacts.中文翻译图像处理不是一步就能完成的过程。
matlab图像处理外文翻译外文文献
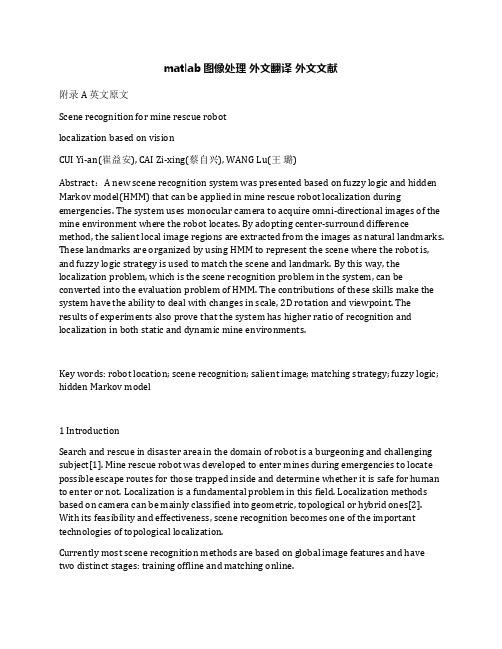
matlab图像处理外文翻译外文文献附录A 英文原文Scene recognition for mine rescue robotlocalization based on visionCUI Yi-an(崔益安), CAI Zi-xing(蔡自兴), WANG Lu(王璐)Abstract:A new scene recognition system was presented based on fuzzy logic and hidden Markov model(HMM) that can be applied in mine rescue robot localization during emergencies. The system uses monocular camera to acquire omni-directional images of the mine environment where the robot locates. By adopting center-surround difference method, the salient local image regions are extracted from the images as natural landmarks. These landmarks are organized by using HMM to represent the scene where the robot is, and fuzzy logic strategy is used to match the scene and landmark. By this way, the localization problem, which is the scene recognition problem in the system, can be converted into the evaluation problem of HMM. The contributions of these skills make the system have the ability to deal with changes in scale, 2D rotation and viewpoint. The results of experiments also prove that the system has higher ratio of recognition and localization in both static and dynamic mine environments.Key words: robot location; scene recognition; salient image; matching strategy; fuzzy logic; hidden Markov model1 IntroductionSearch and rescue in disaster area in the domain of robot is a burgeoning and challenging subject[1]. Mine rescue robot was developed to enter mines during emergencies to locate possible escape routes for those trapped inside and determine whether it is safe for human to enter or not. Localization is a fundamental problem in this field. Localization methods based on camera can be mainly classified into geometric, topological or hybrid ones[2]. With its feasibility and effectiveness, scene recognition becomes one of the important technologies of topological localization.Currently most scene recognition methods are based on global image features and have two distinct stages: training offline and matching online.。
外文翻译----数字图像处理方法的研究(中英文)(1)
The research of digital image processing technique1IntroductionInterest in digital image processing methods stems from two principal application areas:improvement of pictorial information for human interpretation;and processing of image data for storage,transmission,and representation for autonomous machine perception.1.1What Is Digital Image Processing?An image may be defined as a two-dimensional function,f(x,y),where x and y are spatial(plane)coordinates,and the amplitude of f at any pair of coordinates(x,y)is called the intensity or gray level of the image at that point.When x,y,and digital image.The field of digital image processing refers to processing digital images by means of a digital computer.Note that a digital image is composed of a finite number of elements,each of which has a particular location and value.These elements are referred to as picture elements,image elements,pels,and pixels.Pixel is the term most widely used to denote the elements of a digital image.We consider these definitions in more formal terms in Chapter2.Vision is the most advanced of our senses,so it is not surprising that images play the single most important role in human perception.However,unlike human who are limited to the visual band of the electromagnetic(EM)spectrum,imaging machines cover almost the entire EM spectrum,ranging from gamma to radio waves.They can operate on images generated by sources that human are not accustomed to associating with image.These include ultrasound,electron microscopy,and computer-generated images.Thus,digital image processing encompasses a wide and varied field of application.There is no general agreement among authors regarding where image processing stops and other related areas,such as image analysis and computer vision,start. Sometimes a distinction is made by defining image processing as a discipline in which both the input and output of a process are images.We believe this to be a limiting and somewhat artificial boundary.For example,under this definition,even the trivial task of computing the average intensity of an image(which yields a single number)would not be considered an image processing operation.On the other hand, there are fields such as computer vision whose ultimate goal is to use computer to emulate human vision,including learning and being able to make inferences and take actions based on visual inputs.This area itself is a branch of artificial intelligence(AI) whose objective is to emulate human intelligence.This field of AI is in its earliest stages of infancy in terms of development,with progress having been much slower than originally anticipated.The area of image analysis(also called image understanding)is in between image processing and computer vision.There are no clear-cut boundaries in the continuum from image processing at one end to computer vision at the other.However,one useful paradigm is to consider three types of computerized processes is this continuum:low-,mid-,and high-ever processes.Low-level processes involve primitive operation such as image preprocessing to reduce noise,contrast enhancement,and image sharpening.A low-level process is characterized by the fact that both its input and output are images. Mid-level processing on images involves tasks such as segmentation(partitioning an image into regions or objects),description of those objects to reduce them to a form suitable for computer processing,and classification(recognition)of individual object. Amid-level process is characterized by the fact that its inputs generally are images, but its output is attributes extracted from those images(e.g.,edges contours,and the identity of individual object).Finally,higher-level processing involves“making sense”of an ensemble of recognized objects,as in image analysis,and,at the far end of the continuum,performing the cognitive function normally associated with vision. Based on the preceding comments,we see that a logical place of overlap between image processing and image analysis is the area of recognition of individual regions or objects in an image.Thus,what we call in this book digital image processing encompasses processes whose inputs and outputs are images and,in addition, encompasses processes that extract attributes from images,up to and including the recognition of individual objects.As a simple illustration to clarify these concepts, consider the area of automated analysis of text.The processes of acquiring an image of the area containing the text.Preprocessing that images,extracting(segmenting)the individual characters,describing the characters in a form suitable for computer processing,and recognizing those individual characters are in the scope of what we call digital image processing in this book.Making sense of the content of the page may be viewed as being in the domain of image analysis and even computer vision, depending on the level of complexity implied by the statement“making cense.”As will become evident shortly,digital image processing,as we have defined it,is used successfully in a broad rang of areas of exceptional social and economic value.The concepts developed in the following chapters are the foundation for the methods used in those application areas.1.2The Origins of Digital Image ProcessingOne of the first applications of digital images was in the newspaper industry,when pictures were first sent by submarine cable between London and NewYork. Introduction of the Bartlane cable picture transmission system in the early1920s reduced the time required to transport a picture across the Atlantic from more than a week to less than three hours.Specialized printing equipment coded pictures for cable transmission and then reconstructed them at the receiving end.Figure 1.1was transmitted in this way and reproduced on a telegraph printer fitted with typefaces simulating a halftone pattern.Some of the initial problems in improving the visual quality of these early digital pictures were related to the selection of printing procedures and the distribution ofintensity levels.The printing method used to obtain Fig.1.1was abandoned toward the end of1921in favor of a technique based on photographic reproduction made from tapes perforated at the telegraph receiving terminal.Figure1.2shows an images obtained using this method.The improvements over Fig.1.1are evident,both in tonal quality and in resolution.FIGURE1.1A digital picture produced in FIGURE1.2A digital picture 1921from a coded tape by a telegraph printer made in1922from a tape punched With special type faces(McFarlane)after the signals had crossed theAtlantic twice.Some errors areVisible.(McFarlane)The early Bartlane systems were capable of coding images in five distinct level of gray.This capability was increased to15levels in1929.Figure1.3is typical of the images that could be obtained using the15-tone equipment.During this period, introduction of a system for developing a film plate via light beams that were modulated by the coded picture tape improved the reproduction process considerably. Although the examples just cited involve digital images,they are not considered digital image processing results in the context of our definition because computer were not involved in their creation.Thus,the history of digital processing is intimately tied to the development of the digital computer.In fact digital images require so much storage and computational power that progress in the field of digital image processing has been dependent on the development of digital computers of supporting technologies that include data storage,display,and transmission.The idea of a computer goes back to the invention of the abacus in Asia Minor, more than5000years ago.More recently,there were developments in the past two centuries that are the foundation of what we call computer today.However,the basis for what we call a modern digital computer dates back to only the1940s with the introduction by John von Neumann of two key concepts:(1)a memory to hold a stored program and data,and(2)conditional branching.There two ideas are the foundation of a central processing unit(CPU),which is at the heart of computer today. Starting with von Neumann,there were a series of advances that led to computers powerful enough to be used for digital image processing.Briefly,these advances maybe summarized as follow:(1)the invention of the transistor by Bell Laboratories in1948;(2)the development in the1950s and1960s of the high-level programminglanguages COBOL(Common Business-Oriented Language)and FORTRAN (Formula Translator);(3)the invention of the integrated circuit(IC)at Texas Instruments in1958;(4)the development of operating system in the early1960s;(5)the development of the microprocessor(a single chip consisting of the centralprocessing unit,memory,and input and output controls)by Inter in the early 1970s;(6)introduction by IBM of the personal computer in1981;(7)progressive miniaturization of components,starting with large scale integration(LI)in the late1970s,then very large scale integration(VLSI)in the1980s,to the present use of ultra large scale integration(ULSI).Figure1.3In1929from London to Cenerale Pershingthat New York delivers with15level tone equipmentsthrough cable with Foch do not the photograph by decorationConcurrent with these advances were development in the areas of mass storage and display systems,both of which are fundamental requirements for digital image processing.The first computers powerful enough to carry out meaningful image processing tasks appeared in the early1960s.The birth of what we call digital image processing today can be traced to the availability of those machines and the onset of the apace program during that period.It took the combination of those two developments to bring into focus the potential of digital image processing concepts.Work on using computer techniques for improving images from a space probe began at the Jet Propulsion Laboratory(Pasadena,California)in1964when pictures of the moontransmitted by Ranger7were processed by a computer to correct various types of image distortion inherent in the on-board television camera.Figure1.4shows the first image of the moon taken by Ranger7on July31,1964at9:09A.M.Eastern Daylight Time(EDT),about17minutes before impacting the lunar surface(the markers,called reseau mark,are used for geometric corrections,as discussed in Chapter5).This also is the first image of the moon taken by a U.S.spacecraft.The imaging lessons learned with ranger7served as the basis for improved methods used to enhance and restore images from the Surveyor missions to the moon,the Mariner series of flyby mission to Mars,the Apollo manned flights to the moon,and others.In parallel with space application,digital image processing techniques began in the late1960s and early1970s to be used in medical imaging,remote Earth resources observations,and astronomy.The invention in the early1970s of computerized axial tomography(CAT),also called computerized tomography(CT)for short,is one of the most important events in the application of image processing in medical diagnosis. Computerized axial tomography is a process in which a ring of detectors encircles an object(or patient)and an X-ray source,concentric with the detector ring,rotates about the object.The X-rays pass through the object and are collected at the opposite end by the corresponding detectors in the ring.As the source rotates,this procedure is repeated.Tomography consists of algorithms that use the sensed data to construct an image that represents a“slice”through the object.Motion of the object in a direction perpendicular to the ring of detectors produces a set of such slices,which constitute a three-dimensional(3-D)rendition of the inside of the object.Tomography was invented independently by Sir Godfrey N.Hounsfield and Professor Allan M. Cormack,who shared the X-rays were discovered in1895by Wilhelm Conrad Roentgen,for which he received the1901Nobel Prize for Physics.These two inventions,nearly100years apart,led to some of the most active application areas of image processing today.Figure1.4The first picture of the moon by a U.S.Spacecraft.Ranger7took this image on July31,1964at9:09A.M.EDT,about17minutes beforeImpacting the lunar surface.(Courtesy of NASA.)中文翻译数字图像处理方法的研究1绪论数字图像处理方法的研究源于两个主要应用领域:其一是为了便于人们分析而对图像信息进行改进;其二是为了使机器自动理解而对图像数据进行存储、传输及显示。
图像处理中英文对照外文翻译文献

中英文对照外文翻译文献(文档含英文原文和中文翻译)译文:基于局部二值模式多分辨率的灰度和旋转不变性的纹理分类摘要:本文描述了理论上非常简单但非常有效的,基于局部二值模式的、样图的非参数识别和原型分类的,多分辨率的灰度和旋转不变性的纹理分类方法。
此方法是基于结合某种均衡局部二值模式,是局部图像纹理的基本特性,并且已经证明生成的直方图是非常有效的纹理特征。
我们获得一个一般灰度和旋转不变的算子,可表达检测有角空间和空间结构的任意量子化的均衡模式,并提出了结合多种算子的多分辨率分析方法。
根据定义,该算子在图像灰度发生单一变化时具有不变性,所以所提出的方法在灰度发生变化时是非常强健的。
另一个优点是计算简单,算子在小邻域内或同一查找表内只要几个操作就可实现。
在旋转不变性的实际问题中得到了良好的实验结果,与来自其他的旋转角度的样品一起以一个特别的旋转角度试验而且测试得到分类, 证明了基于简单旋转的发生统计学的不变性二值模式的分辨是可以达成。
这些算子表示局部图像纹理的空间结构的又一特色是,由结合所表示的局部图像纹理的差别的旋转不变量不一致方法,其性能可得到进一步的改良。
这些直角的措施共同证明了这是旋转不变性纹理分析的非常有力的工具。
关键词:非参数的,纹理分析,Outex ,Brodatz ,分类,直方图,对比度2 灰度和旋转不变性的局部二值模式我们通过定义单色纹理图像的一个局部邻域的纹理T ,如 P (P>1)个象素点的灰度级联合分布,来描述灰度和旋转不变性算子:01(,,)c P T t g g g -= (1)其中,g c 为局部邻域中心像素点的灰度值,g p (p=0,1…P-1)为半径R(R>0)的圆形邻域内对称的空间象素点集的灰度值。
图1如果g c 的坐标是(0,0),那么g p 的坐标为(cos sin(2/),(2/))R R p P p P ππ-。
图1举例说明了圆形对称邻域集内各种不同的(P,R )。
数字图像处理论文中英文对照资料外文翻译文献
第 1 页中英文对照资料外文翻译文献原 文To image edge examination algorithm researchAbstract :Digital image processing took a relative quite young discipline,is following the computer technology rapid development, day by day obtains th widespread application.The edge took the image one kind of basic characteristic,in the pattern recognition, the image division, the image intensification as well as the image compression and so on in the domain has a more widesp application.Image edge detection method many and varied, in which based on brightness algorithm, is studies the time to be most long, the theory develo the maturest method, it mainly is through some difference operator, calculates its gradient based on image brightness the change, thus examines the edge, mainlyhas Robert, Laplacian, Sobel, Canny, operators and so on LOG 。
毕设论文翻译

一种新的指纹图像增强算法Byung-Gyu Kim, Han-Ju Kim and Dong-Jo Park电机工程系及计算机科学系韩国科学技术院(KAIST)373-1 Guseong-dong, Yuseong-gu, 大田市,大韩民国(南韩)305-701Tel)+82–42–869–3438 Fax) +82–42–869–3410Email ) chitos@mail.kaist.ac.kr, djpark@ee.kaist.ac.kr摘要在本文中,提出了一种基于图像规范化及枷帕滤波的新的指纹图像增强算法。
首先,对基于分块自适应标准化处理的指纹图像提出了改进。
一个输入的图像按照K*L面积范围被分解为几个子块,并对感兴趣的区域(ROL)于指纹图像中获取。
图像规范化的参数根据子块的统计数据被自适应地决定。
通过利用这些参数,分块子图像被标准化从而进行下一个步骤。
其次,一种新的选取2种重要枷帕滤波系数的技术被发明。
这些参数呈波峰方向和波峰频率。
在此学术中,子块图像的峰向是由概率性的方法被决定的而不像其他方法。
通过这个波峰方向,频率也由利用方向性的投射而被选择出来。
所提出的算法性能被进行了NIST指纹图像测试并且在实验中展示了显著的改进效果。
1 简介当今指纹技术被广泛应用于个人验证中的生物特征,大多数自动检定系统是基于指纹细节点模式匹配[1]-[6]。
微小的细节处即是指纹图像中局部间断点所表示的终端和分叉。
为了获取一个给定指纹图像通过直接扫描器或是一个凸起的数位化指纹中的细节,首先要做的便是提取波峰结构图。
高品质的已获得的图像,波峰指纹图像结构并不总是很好定义的。
因此,一些增强预处理过程是很有必要的,可以得到更为可靠的特征提取。
许多种类的指纹图像增强方法已在文献中被提出。
大部分方法都是基于图像二值化,而另一些则却是直接提高图像灰度图像。
在灰度图像的处理方法中,增强算法的主要步骤包括如下:1)标准化。
图形转化网页编辑外文文献翻译、中英文翻译、外文翻译
毕业设计(论文)外文资料翻译题目: ActiveX and VBA Reference院系名称:专业班级:学生姓名:学号:指导教师:教师职称:起止日期:地点:BeginShortcutMenuOSnap 事件用户在图形窗口上按鼠标右键后,以及在快捷菜单以osnap模式出现之前被触发。
See Also | Example用法:object.BeginShortcutMenuGrip(ShortcutMenu)对象:Document 对象对象表达式,其结果为有效的容器对象,此处必须为文档对象(document)。
ShortcutMenu快捷菜单PopupMenu对象:通过操作按钮来输入/输出快捷菜单即将显示说明:这个事件允许你在它显示之前修改快捷菜单。
在修改快捷菜单时,通过事件的按钮编辑PopupMenu对象。
这种相同的PopupMenu对象也因为当前的快捷菜单正在显示而不能够弹出。
使用这个EndShortcutMenu事件利用快捷菜单执行清除工作。
这些事件将被激活,在所有的快捷菜单的要素包括任意ObjectARX命令发生后当模式对话框显示时不会触发任何事件参见:方法,属性,事件:BeginShortcutMenuCommandBeginShortcutMenuDefaultBeginShortcutMenuEditBeginRightClickActiveX 和 VBA开发指导:“使用事件”例程:Private Sub AcadDocument_BeginShortcutMenuOSnap(ShortcutMenu As AutoCAD.IAcadPopupMenu)本例程演示当在osnap模式下时立即截取一个快捷菜单MsgBox “你刚才在osnap模式下激活一个快捷菜单”Deactivate 事件当图形窗口释放时被触发See Also | Example用法:object.Deactivate()对象:Document对象对象表达式,其结果为有效的容器对象,此处必须为文档对象(document)说明:当模式对话框显示时不会触发任何事件参见:方法,属性,事件:ActivateActiveX 和 VBA开发指导:“使用事件”例程:Private Sub AcadDocument_Deactivate()本例程演示截取图形激活事件当图形不集中时这个事件会被激活激活示例程序:打开两个图形窗口并从一个图形窗口切换到另一个图形窗口MsgBox “你刚才激活了一个图形!”End SubEndCommand event在命令执行完成后立即被触发。
数字图像处理英文原版及翻译
数字图象处理英文原版及翻译Digital Image Processing: English Original Version and TranslationIntroduction:Digital Image Processing is a field of study that focuses on the analysis and manipulation of digital images using computer algorithms. It involves various techniques and methods to enhance, modify, and extract information from images. In this document, we will provide an overview of the English original version and translation of digital image processing materials.English Original Version:The English original version of digital image processing is a comprehensive textbook written by Richard E. Woods and Rafael C. Gonzalez. It covers the fundamental concepts and principles of image processing, including image formation, image enhancement, image restoration, image segmentation, and image compression. The book also explores advanced topics such as image recognition, image understanding, and computer vision.The English original version consists of 14 chapters, each focusing on different aspects of digital image processing. It starts with an introduction to the field, explaining the basic concepts and terminology. The subsequent chapters delve into topics such as image transforms, image enhancement in the spatial domain, image enhancement in the frequency domain, image restoration, color image processing, and image compression.The book provides a theoretical foundation for digital image processing and is accompanied by numerous examples and illustrations to aid understanding. It also includes MATLAB codes and exercises to reinforce the concepts discussed in each chapter. The English original version is widely regarded as a comprehensive and authoritative reference in the field of digital image processing.Translation:The translation of the digital image processing textbook into another language is an essential task to make the knowledge and concepts accessible to a wider audience. The translation process involves converting the English original version into the target language while maintaining the accuracy and clarity of the content.To ensure a high-quality translation, it is crucial to select a professional translator with expertise in both the source language (English) and the target language. The translator should have a solid understanding of the subject matter and possess excellent language skills to convey the concepts accurately.During the translation process, the translator carefully reads and comprehends the English original version. They then analyze the text and identify any cultural or linguistic nuances that need to be considered while translating. The translator may consult subject matter experts or reference materials to ensure the accuracy of technical terms and concepts.The translation process involves several stages, including translation, editing, and proofreading. After the initial translation, the editor reviews the translated text to ensure its coherence, accuracy, and adherence to the target language's grammar and style. The proofreader then performs a final check to eliminate any errors or inconsistencies.It is important to note that the translation may require adapting certain examples, illustrations, or exercises to suit the target language and culture. This adaptation ensures that the translated version resonates with the local audience and facilitates better understanding of the concepts.Conclusion:Digital Image Processing: English Original Version and Translation provides a comprehensive overview of the field of digital image processing. The English original version, authored by Richard E. Woods and Rafael C. Gonzalez, serves as a valuable reference for understanding the fundamental concepts and techniques in image processing.The translation process plays a crucial role in making this knowledge accessible to non-English speakers. It involves careful selection of a professional translator, thoroughunderstanding of the subject matter, and meticulous translation, editing, and proofreading stages. The translated version aims to accurately convey the concepts while adapting to the target language and culture.By providing both the English original version and its translation, individuals from different linguistic backgrounds can benefit from the knowledge and advancements in digital image processing, fostering international collaboration and innovation in this field.。
介绍数字图像处理外文翻译
附录1 外文原文Source: "the 21st century literature the applied undergraduate electronic communication series of practical teaching planThe information and communication engineering specialty in English ch02_1. PDF 120-124Ed: HanDing ZhaoJuMin, etcText A: An Introduction to Digital Image Processing1. IntroductionDigital image processing remains a challenging domain of programming for several reasons. First the issue of digital image processing appeared relatively late in computer history. It had to wait for the arrival of the first graphical operating systems to become a true matter. Secondly, digital image processing requires the most careful optimizations especially for real time applications. Comparing image processing and audio processing is a good way to fix ideas. Let us consider the necessary memory bandwidth for examining the pixels of a 320x240, 32 bits bitmap, 30 times a second: 10 Mo/sec. Now with the same quality standard, an audio stereo wave real time processing needs 44100 (samples per second) x 2 (bytes per sample per channel) x 2(channels) = 176Ko/sec, which is 50 times less.Obviously we will not be able to use the same techniques for both audio and image signal processing. Finally, digital image processing is by definition a two dimensions domain; this somehow complicates things when elaborating digital filters.We will explore some of the existing methods used to deal with digital images starting by a very basic approach of color interpretation. As a moreadvanced level of interpretation comes the matrix convolution and digital filters. Finally, we will have an overview of some applications of image processing.The aim of this document is to give the reader a little overview of the existing techniques in digital image processing. We will neither penetrate deep into theory, nor will we in the coding itself; we will more concentrate on the algorithms themselves, the methods. Anyway, this document should be used as a source of ideas only, and not as a source of code. 2. A simple approach to image processing(1) The color data: Vector representation①BitmapsThe original and basic way of representing a digital colored image in a computer's memory is obviously a bitmap. A bitmap is constituted of rows of pixels, contraction of the word s “Picture Element”. Each pixel has a particular value which determines its appearing color. This value is qualified by three numbers giving the decomposition of the color in the three primary colors Red, Green and Blue. Any color visible to human eye can be represented this way. The decomposition of a color in the three primary colors is quantified by a number between 0 and 255. For example, white will be coded as R = 255, G = 255, B = 255; black will be known as (R,G,B)= (0,0,0); and say, bright pink will be : (255,0,255). In other words, an image is an enormous two-dimensional array of color values, pixels, each of them coded on 3 bytes, representing the three primary colors. This allows the image to contain a total of 256×256×256 = 16.8 million different colors. This technique is also known as RGB encoding, and is specifically adapted to human vision. With cameras or other measure instruments we are capable of “seeing”thousands of other “colors”, in which cases the RG B encoding is inappropriate.The range of 0-255 was agreed for two good reasons: The first is that the human eye is not sensible enough to make the difference between more than 256 levels of intensity (1/256 = 0.39%) for a color. That is to say, an image presented to a human observer will not be improved by using more than 256 levels of gray (256shades of gray between black and white). Therefore 256 seems enough quality. The second reason for the value of 255 is obviously that it is convenient for computer storage. Indeed on a byte, which is the computer's memory unit, can be coded up to 256 values.As opposed to the audio signal which is coded in the time domain, the image signal is coded in a two dimensional spatial domain. The raw image data is much more straightforward and easy to analyze than the temporal domain data of the audio signal. This is why we will be able to do lots of stuff and filters for images without transforming the source data, while this would have been totally impossible for audio signal. This first part deals with the simple effects and filters you can compute without transforming the source data, just by analyzing the raw image signal as it is.The standard dimensions, also called resolution, for a bitmap are about 500 rows by 500 columns. This is the resolution encountered in standard analogical television and standard computer applications. You can easily calculate the memory space a bitmap of this size will require. We have 500×500 pixels, each coded on three bytes, this makes 750 Ko. It might not seem enormous compared to the size of hard drives, but if you must deal with an image in real time then processing things get tougher. Indeed rendering images fluidly demands a minimum of 30 images per second, the required bandwidth of 10 Mo/sec is enormous. We will see later that the limitation of data access and transfer in RAM has a crucial importance in image processing, and sometimes it happens to be much more important than limitation of CPU computing, which may seem quite different from what one can be used to in optimization issues. Notice that, with modern compression techniques such as JPEG 2000, the total size of the image can be easily reduced by 50 times without losing a lot of quality, but this is another topic.②Vector representation of colorsAs we have seen, in a bitmap, colors are coded on three bytes representing their decomposition on the three primary colors. It sounds obvious to a mathematician to immediately interpret colors as vectors in athree-dimension space where each axis stands for one of the primary colors. Therefore we will benefit of most of the geometric mathematical concepts to deal with our colors, such as norms, scalar product, projection, rotation or distance. This will be really interesting for some kind of filters we will see soon. Figure 1 illustrates this new interpretation:Figure 1(2) Immediate application to filters① Edge DetectionFrom what we have said before we can quantify the 'difference' between two colors by computing the geometric distance between the vectors representing those two colors. Lets consider two colors C1 = (R1,G1,B1) and C2 = (R2,B2,G2), the distance between the two colors is given by the formula :D(C1, C2) =(R1+This leads us to our first filter: edge detection. The aim of edge detection is to determine the edge of shapes in a picture and to be able to draw a resultbitmap where edges are in white on black background (for example). The idea is very simple; we go through the image pixel by pixel and compare the color of each pixel to its right neighbor, and to its bottom neighbor. If one of these comparison results in a too big difference the pixel studied is part of an edge and should be turned to white, otherwise it is kept in black. The fact that we compare each pixel with its bottom and right neighbor comes from the fact that images are in two dimensions. Indeed if you imagine an image with only alternative horizontal stripes of red and blue, the algorithms wouldn't see the edges of those stripes if it only compared a pixel to its right neighbor. Thus the two comparisons for each pixel are necessary.This algorithm was tested on several source images of different types and it gives fairly good results. It is mainly limited in speed because of frequent memory access. The two square roots can be removed easily by squaring the comparison; however, the color extractions cannot be improved very easily. If we consider that the longest operations are the get pixel function and put pixel functions, we obtain a polynomial complexity of 4*N*M, where N is the number of rows and M the number of columns. This is not reasonably fast enough to be computed in realtime. For a 300×300×32 image I get about 26 transforms per second on an Athlon XP 1600+. Quite slow indeed.Here are the results of the algorithm on an example image:A few words about the results of this algorithm: Notice that the quality of the results depends on the sharpness of the source image. Ifthe source image is very sharp edged, the result will reach perfection. However if you have a very blurry source you might want to make it pass through a sharpness filter first, which we will study later. Another remark, you can also compare each pixel with its second or third nearest neighbors on the right and on the bottom instead of the nearest neighbors. The edges will be thicker but also more exact depending on the source image's sharpness. Finally we will see later on that there is another way to make edge detection with matrix convolution.②Color extractionThe other immediate application of pixel comparison is color extraction.Instead of comparing each pixel with its neighbors, we are going to compare it with a given color C1. This algorithm will try to detect all the objects in the image that are colored with C1. This was quite useful for robotics for example. It enables you to search on streaming images for a particular color. You can then make you robot go get a red ball for example. We will call the reference color, the one we are looking for in the image C0 = (R0,G0,B0).Once again, even if the square root can be easily removed it doesn't really improve the speed of the algorithm. What really slows down the whole loop is the NxM get pixel accesses to memory and put pixel. This determines the complexity of this algorithm: 2xNxM, where N and M are respectively the numbers of rows and columns in the bitmap. The effective speed measured on my computer is about 40 transforms per second on a 300x300x32 source bitmap.3.JPEG image compression theory(一)JPEG compression is divided into four steps to achieve:(1) Color mode conversion and samplingRGB color system is the most common ways that color. JPEG uses a YCbCr colorsystem. Want to use JPEG compression method dealing with the basic full-color images, RGB color mode to first image data is converted to YCbCr color model data. Y representative of brightness, Cb and Cr represents the hue, saturation. By the following calculation to be completed by data conversion. Y = 0.2990R +0.5870 G+0.1140 B Cb =- 0.1687R-0.3313G +0.5000 B +128 Cr = 0.5000R-0.4187G-0.0813B+128 of human eyes on the low-frequency data than high-frequency data with higher The sensitivity, in fact, the human eye to changes in brightness than to color changes should be much more sensitive, ie Y component of the data is more important. Since the Cb and Cr components is relatively unimportant component of the data comparison, you can just take part of the data to deal with. To increase the compression ratio. JPEG usually have two kinds of sampling methods: YUV411 and YUV422, they represent is the meaning of Y, Cb and Cr data sampling ratio of three components.(2)DCT transformationThe full name is the DCT-discrete cosine transform (Discrete Cosine Transform), refers to a group of light intensity data into frequency data, in order that intensity changes of circumstances. If the modification of high-frequency data do, and then back to the original form of data, it is clear there are some differences with the original data, but the human eye is not easy to recognize. Compression, the original image data is divided into 8 * 8 matrix of data units. JPEG entire luminance and chrominance Cb matrix matrix, saturation Cr matrix as a basic unit called the MCU. Each MCU contains a matrix of no more than 10. For example, the ratio of rows and columns Jie Wei 4:2:2 sampling, each MCU will contain four luminance matrix, a matrix and a color saturation matrix. When the image data is divided into an 8 * 8 matrix, you must also be subtracted for each value of 128, and then a generation of formula into the DCT transform can be achieved by DCT transform purposes. The image data value must be reduced by 128, because the formula accepted by the DCT-figure range is between -128 to +127.(3)QuantizationImage data is converted to the frequency factor, you still need to accept a quantitative procedure to enter the coding phase. Quantitative phase requires two 8 * 8 matrix of data, one is to deal specifically with the brightness of the frequency factor, the other is the frequency factor for the color will be the frequency coefficient divided by the value of quantization matrix to obtain the nearest whole number with the quotient, that is completed to quantify. When the frequency coefficients after quantization, will be transformed into the frequency coefficients from the floating-point integer This facilitate the implementation of the final encoding. However, after quantitative phase, all the data to retain only the integer approximation, also once again lost some data content.(4)CodingHuffman encoding without patent issues, to become the most commonly used JPEG encoding, Huffman coding is usually carried out in a complete MCU. Coding, each of the DC value matrix data 63 AC value, will use a different Huffman code tables, while the brightness and chroma also require a different Huffman code tables, it needs a total of four code tables, in order to successfully complete the JPEG coding. DC Code DC is a color difference pulse code modulation using the difference coding method, which is in the same component to obtain an image of each DC value and the difference between the previous DC value to encode. DC pulse code using the main reason for the difference is due to a continuous tone image, the difference mostly smaller than the original value of the number of bits needed to encode the difference will be more than the original value of the number of bits needed to encode the less. For example, a margin of 5, and its binary representation of a value of 101, if the difference is -5, then the first changed to a positive integer 5, and then converted into its 1's complement binary number can be. The so-called one's complement number, that is, if the value is 0 for each Bit, then changed to 1; Bit is 1, it becomes 0. Difference between the five should retain the median 3, the following table that lists the difference between the Bit to be retained and the difference between the number of content controls.In the margin of the margin front-end add some additional value Hoffman code, such as the brightness difference of 5 (101) of the median of three, then the Huffman code value should be 100, the two connected together shall be 100101. The following two tables are the brightness and chroma DC difference encoding table. According to these two forms content, you can add the difference for the DC value Huffman code to complete the DC coding.4. ConclusionsDigital image processing is far from being a simple transpose of audiosignal principles to a two dimensions space. Image signal has its particular properties, and therefore we have to deal with it in a specificway. The Fast Fourier Transform, for example, which was such a practical tool in audio processing, becomes useless in image processing. Oppositely, digital filters are easier to create directly, without any signal transforms, in image processing.Digital image processing has become a vast domain of modern signal technologies. Its applications pass far beyond simple aesthetical considerations, and they include medical imagery, television and multimedia signals, security, portable digital devices, video compression,and even digital movies. We have been flying over some elementarynotions in image processing but there is yet a lot more to explore. Ifyou are beginning in this topic, I hope this paper will have given you thetaste and the motivation to carry on.附录2 外文翻译文献出处:《21 世纪全国应用型本科电子通信系列实用规划教材》之《信息与通信工程专业英语》ch02_1.pdf 120-124页主编:韩定定、赵菊敏等正文:介绍数字图像处理1.导言有几个原因使数字图像处理仍然是一个具有挑战性的领域。
matlab图像处理-外文翻译-外文文献-英文文献-基于视觉的矿井救援
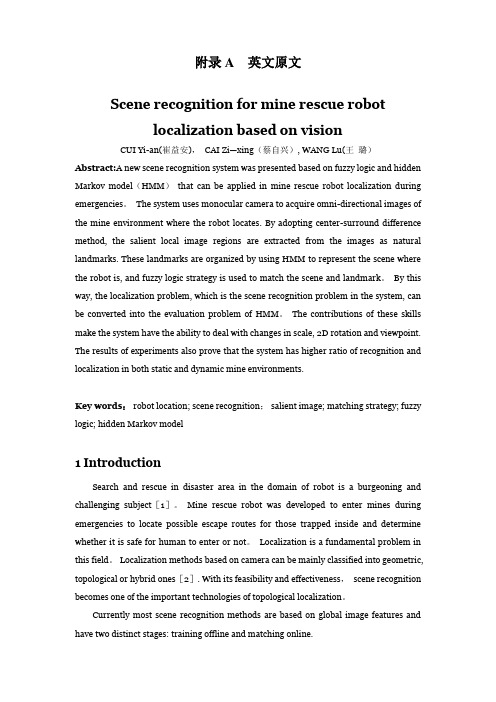
附录A 英文原文Scene recognition for mine rescue robotlocalization based on visionCUI Yi-an(崔益安),CAI Zi—xing(蔡自兴), WANG Lu(王璐)Abstract:A new scene recognition system was presented based on fuzzy logic and hidden Markov model(HMM)that can be applied in mine rescue robot localization during emergencies。
The system uses monocular camera to acquire omni-directional images of the mine environment where the robot locates. By adopting center-surround difference method, the salient local image regions are extracted from the images as natural landmarks. These landmarks are organized by using HMM to represent the scene where the robot is, and fuzzy logic strategy is used to match the scene and landmark。
By this way, the localization problem, which is the scene recognition problem in the system, can be converted into the evaluation problem of HMM。
- 1、下载文档前请自行甄别文档内容的完整性,平台不提供额外的编辑、内容补充、找答案等附加服务。
- 2、"仅部分预览"的文档,不可在线预览部分如存在完整性等问题,可反馈申请退款(可完整预览的文档不适用该条件!)。
- 3、如文档侵犯您的权益,请联系客服反馈,我们会尽快为您处理(人工客服工作时间:9:00-18:30)。
英文资料翻译Image processing is not a one step process.We are able to distinguish between several steps which must be performed one after the other until we can extract the data of interest from the observed scene.In this way a hierarchical processing scheme is built up as sketched in Fig.The figure gives an overview of the different phases of image processing.Image processing begins with the capture of an image with a suitable,not necessarily optical,acquisition system.In a technical or scientific application,we may choose to select an appropriate imaging system.Furthermore,we can set up the illumination system,choose the best wavelength range,and select other options to capture the object feature of interest in the best way in an image.Once the image is sensed,it must be brought into a form that can be treated with digital computers.This process is called digitization.With the problems of traffic are more and more serious. Thus Intelligent Transport System (ITS) comes out. The subject of the automatic recognition of license plate is one of the most significant subjects that are improved from the connection of computer vision and pattern recognition. The image imputed to the computer is disposed and analyzed in order to localization the position and recognition the characters on the license plate express these characters in text string form The license plate recognition system (LPSR) has important application in ITS. In LPSR, the first step is for locating the license plate in the captured image which is very important for character recognition. The recognition correction rate of license plate is governed by accurate degree of license plate location. In this paper, several of methods in image manipulation are compared and analyzed, then come out the resolutions for localization of the car plate. The experiences show that the good result has been got with these methods. The methods based on edge map and frequency analysis is used in the process of the localization of the license plate, that is to say, extracting the characteristics of the license plate in the car images after being checked up forthe edge, and then analyzing and processing until the probably area of license plate is extracted.The automated license plate location is a part of the image processing ,it’s also an important part in the intelligent traffic system.It is the key step in the Vehicle License Plate Recognition(LPR).A method for the recognition of images of different backgrounds and different illuminations is proposed in the paper.the upper and lower borders are determined through the gray variation regulation of the character distribution.The left and right borders are determined through the black-white variation of the pixels in every row.The first steps of digital processing may include a number of different operations and are known as image processing.If the sensor has nonlinear characteristics, these need to be corrected.Likewise,brightness and contrast of the image may require improvement.Commonly,too,coordinate transformations are needed to restore geometrical distortions introduced during image formation.Radiometric and geometric corrections are elementary pixel processing operations.It may be necessary to correct known disturbances in the image,for instance caused by a defocused optics,motion blur,errors in the sensor,or errors in the transmission of image signals.We also deal with reconstruction techniques which are required with many indirect imaging techniques such as tomography that deliver no direct image.A whole chain of processing steps is necessary to analyze and identify objects.First,adequate filtering procedures must be applied in order to distinguish the objects of interest from other objects and the background.Essentially,from an image(or several images),one or more feature images are extracted.The basic tools for this task are averaging and edge detection and the analysis of simple neighborhoods and complex patterns known as texture in image processing.An important feature of an object is also its motion.Techniques to detect and determine motion are necessary.Then the object has to be separated from the background.This means that regions of constant features and discontinuities must be identified.This process leads to alabel image.Now that we know the exact geometrical shape of the object,we can extract further information such as the mean gray value,the area,perimeter,and other parameters for the form of the object[3].These parameters can be used to classify objects.This is an important step in many applications of image processing,as the following examples show:In a satellite image showing an agricultural area,we would like to distinguish fields with different fruits and obtain parameters to estimate their ripeness or to detect damage by parasites.There are many medical applications where the essential problem is to detect pathologi-al changes.A classic example is the analysis of aberrations in chromosomes.Character recognition in printed and handwritten text is another example which has been studied since image processing began and still poses significant difficulties.You hopefully do more,namely try to understand the meaning of what you are reading.This is also the final step of image processing,where one aims to understand the observed scene.We perform this task more or less unconsciously whenever we use our visual system.We recognize people,we can easily distinguish between the image of a scientific lab and that of a living room,and we watch the traffic to cross a street safely.We all do this without knowing how the visual system works.For some times now,image processing and computer-graphics have been treated as two different areas.Knowledge in both areas has increased considerably and more complex problems can now be treated.Computer graphics is striving to achieve photorealistic computer-generated images of three-dimensional scenes,while image processing is trying to reconstruct one from an image actually taken with a camera.In this sense,image processing performs the inverse procedure to that of computer graphics.We start with knowledge of the shape and features of an object—at the bottom of Fig. and work upwards until we get a two-dimensional image.To handle image processing or computer graphics,we basically have to work from the same knowledge.We need to know the interaction between illumination and objects,how a three-dimensional scene is projected onto an image plane,etc.There are still quite a few differences between an image processing and a graphics workstation.But we can envisage that,when the similarities and interrelations between computergraphics and image processing are better understood and the proper hardware is developed,we will see some kind of general-purpose workstation in the future which can handle computer graphics as well as image processing tasks[5].The advent of multimedia,i. e. ,the integration of text,images,sound,and movies,will further accelerate the unification of computer graphics and image processing.In January 1980 Scientific American published a remarkable image called Plume2,the second of eight volcanic eruptions detected on the Jovian moon by the spacecraft Voyager 1 on 5 March 1979.The picture was a landmark image in interplanetary exploration—the first time an erupting volcano had been seen in space.It was also a triumph for image processing.Satellite imagery and images from interplanetary explorers have until fairly recently been the major users of image processing techniques,where a computer image is numerically manipulated to produce some desired effect-such as making a particular aspect or feature in the image more visible.Image processing has its roots in photo reconnaissance in the Second World War where processing operations were optical and interpretation operations were performed by humans who undertook such tasks as quantifying the effect of bombing raids.With the advent of satellite imagery in the late 1960s,much computer-based work began and the color composite satellite images,sometimes startlingly beautiful, have become part of our visual culture and the perception of our planet.Like computer graphics,it was until recently confined to research laboratories which could afford the expensive image processing computers that could cope with the substantial processing overheads required to process large numbers of high-resolution images.With the advent of cheap powerful computers and image collection devices like digital cameras and scanners,we have seen a migration of image processing techniques into the public domain.Classical image processing techniques are routinely employed bygraphic designers to manipulate photographic and generated imagery,either to correct defects,change color and so on or creatively to transform the entire look of an image by subjecting it to some operation such as edge enhancement.A recent mainstream application of image processing is the compression of images—either for transmission across the Internet or the compression of moving video images in video telephony and video conferencing.Video telephony is one of the current crossover areas that employ both computer graphics and classical image processing techniques to try to achieve very high compression rates.All this is part of an inexorable trend towards the digital representation of images.Indeed that most powerful image form of the twentieth century—the TV image—is also about to be taken into the digital domain.Image processing is characterized by a large number of algorithms that are specific solutions to specific problems.Some are mathematical or context-independent operations that are applied to each and every pixel.For example,we can use Fourier transforms to perform image filtering operations.Others are“algorithmic”—we may use a complicated recursive strategy to find those pixels that constitute the edges in an image.Image processing operations often form part of a computer vision system.The input image may be filtered to highlight or reveal edges prior to a shape detection usually known as low-level operations.In computer graphics filtering operations are used extensively to avoid abasing or sampling artifacts.中文翻译图像处理不是一步就能完成的过程。