老外的标准雅思小作文范文(分享)
雅思小作文大全及范文

101.You should spend about 20 minutes on this task.The line graph below gives information about the number of visitors to three London museums between June and September 2013.Summarise the information by selecting and reporting the main features, and make comparisons where relevant.Write at least 150 words.Test TipCheck the horizontal axis to find whether the graph refers to past, present, future or all three.We use the present simple to describe the graph: The graph … , We can see … showsIf the graph refers to past period of time,we use the past simple,andif the graph includes future times,we use will or it is predicted.that Look at the line graph and complete the text with the correct forms of the verbs in brackets and the correct prepositions.The graph shows(show) how many people visited(visit) three London museums in the summer of 2013. Most visitors went(go) to the British museum between June and September. The number fluctuated(fluctuate) between 500 and 750. By contrast, the Science Museum and the Natural History Museum received(receive) fewer visitors. The number of people who visited the Science Museum dropped(drop) gradually from 400 thousand to 300 from June to August then rose(rise) to 450 thousand in September. We can see(see) that the trend for the Natural History Museum was(be) similar. There was a sharp drop in visitors from June to July. The number remained stable(remain stable) in August and then increased(increase) steadily in September.102.You should spend about 20 minutes on this task.The chart below shows the percentage change in the share of international students among university graduates in different Canadian provinces between 2001 and 2006.Summarise the information by selecting and reporting the main features, and make comparisons where relevant.Write at least 150 words.Source:Statistics Canada,Postsecondary Student Information SystemTest TipIn Task 1 of the IELTS Writing modules, you may be asked to describe a graph which shows changes over a period of time. To do this you need to use language expressing change and appropriate tenses. In the exam, make sure you leave time to edit your written answer. You will lose marks if you make too many mistakes in grammar and vocabulary.Model answerThe chart shows changes in the share of international students who graduated from universities in different Canadian provinces over a period of 5years.In 2001, this share had a relatively narrow range, from 3% in Ontario to 7.0% in New Brunswick. Nova Scotia had the second highest proportion at 6.5%.Five years later,the figures for most provinces had risen,with the exception of Alberta.There,the figures fell by 1% to just over 4%. By 2006, some parts of Canada experienced a considerable increase in their share of international graduates.Growth in this share was especially strong in the case of New Brunswick, where the figures rose from 7% to 12%. The largest growth occurred in British Columbia, where it more than doubled to 11%.Over this five-year period,changes in the proportion of international graduates have been very uneven across the provinces of Canada. However, New Brunswick remained the province with the highest percentage overall. (158 words)103.You should spend about 20 minutes on this task.The chart below gives information about the UK's ageing population in 1985 and makes predictions for 2035.Summarise the information by selecting and reporting the main features, and make comparisons where relevant.Write at least 150 words.Source:Office for National Statistics,National Records of Scotland,Northern Ireland Statistics and ResearchAgencyExam TipIn Writing Task 1, it is essential to understand what the graph or chart is representing.Look closely at the information in the instructions as well as all details of the graph or chart.The graph in this task shows the percentage of over 65s in each country of the UK.The following are incorrect statements:•Wales had more over 65s than England. (The graph is in percentages, not numbers)• Northern Ireland had 12% of over 65s in 1985. (The countries do not add up to 100% so Northern Ireland did not have 12% of all over 65s. The graph shows that 12% of thepopulation of Northern Ireland was over 65.)Model answerThe graph shows how the size and distribution of the UK's ageing population is likely to change over a 50-year period.Overall,the proportions are predicted to increase in all UK countries.In 1985, 15 per cent of the UK population was over 65, but by 2035, this will account for 23per cent of the total population.A closer look at the data reveals that the ageing population is expected to rise more in some parts of the UK than in other. In 1985, Wales had the highest percentage of people aged 65 and over, at 16 per cent. The second-largest group could be found in England and the third in Scotland. Northern Ireland had lowest proportion, with 12 per cent aged 65 and over. By 2035,Wales is still going to have by far the greatest percentage of over 65s,with figures likely to reach 26per cent.However,the biggest increases in this age group,relative to the rest of the population,are predicted to occur in Northern Ireland and Scotland. In Northern Ireland, for example,this figure will increase almost double to 23per cent. (189 words)104.You should spend about 20 minutes on this task.The diagrams below give information on transport and car use in Edmonton. Summarise the information by selecting and reporting the main features, and make comparisons where relevant.Write at least 150 words.People’s reasons for using the car in cityCommute to work ShoppingLeisure activities Taking children to school Business 55% 15% 15% 40% 45%Test TipIn IELTS Writing Task 1, when you must describe two figures, ask yourself the following:1)What do both figures relate to?2)What kind of relationship is evident?(a similarity, a difference, a cause and effect relationship or some other type of relationship)3) Which aspects of each figure should be highlighted?4) Should I describe the figures in separate paragraphs, or should I compare different aspects of the figures within a series of paragraph? Model answerThe table shows the reason why people in Edmonton use their cars in the city and the pie chart explains what type of transport people prefer to use most of the time.Looking at the pie chart first,it is clear that the car is the most popular means of transport in this city.45%of the people say that they prefer to commute by car. The second most popular form of transport is the LRT, while busses and taxis are the main means of transport for the rest of the people.The table gives more detailed information about why people use their cars. Surprisingly, 55% of the people need to commute to work by car. Cars are also used a lot for taking children to school or business purposes.Only 15% of drivers are doing their shopping and, similarly, 15% need to travel by car for leisure.Overall, people in Edmonton make good use of alternative methods of transport but there is a heavy dependence on cars for work.(170 words)105.You should spend about 20 minutes on this task.The bar chart below shows shares of expenditures for five major categories in the United States, Canada, the United Kingdom, and Japan in the year 2009.Write a report for a university lecturer describing the information below.Write at least 150 words.Source: U.S. Bureau of Labor StatisticsTest TipIn Writing Task 1, it is a good idea to end your answer by summarizing the main information shown by the diagram. You are not required to explain this information.Read the following sample answer. Complete the answer by filling the gaps with the words in the box.by contrast indicates lowest comparesoverall whereas except higherhighest however largest amongThe bar chart compares how consumers in the United States, Canada, the United Kingdom,and Japan allocated different shares of total spending to categories such as food, housing, and transportation in 2009.We can see that the United States had the highest housing expenditure share, 26% of total expenditures in 2009. The United Kingdom and Japan followed, with 24% and 22%, respectively. Canada had the lowest housing share at 21%. Housing was the largest expenditure component in all countries except Japan.By contrast,Canada had the largest transportation share of all four countries at 20%. The United States and the United Kingdom had the next-highest transportation shares, 17% and 15%, respectively. Japan had the lowest, at 10%.However, in Japan, consumers spent 23% of their total expenditures on food in 2009. The United Kingdom had the second-highest share at 20%. Canada, with 15%, and the United States, with 14% had the lowest food expenditure shares among the countries studied.Overall,the data indicates that housing and health care shares of total expenditures were higher in the United States than in Canada, the United Kingdom, and Japan in 2009, whereas Americans had the lowest clothing share.Canada had the highest clothing and transportation shares,and Japan had the highest food share, among the countries compared.Show Answers - Hide Answers(214 words)106.Vocabulary TipNotice the following rules for the spelling of the words programme and program :programme (UK only) = a show on televisionprogram (US only) = a show on televisionprogram (UK and US) = instructions for a computer (a verb and a noun) You should spend about 20 minutes on this task.The charts give information about two genres of TV programmes watched by men and women and four different age groups in Australia.Summarise the information by selecting and reporting the main features, and make comparisons where relevant.Write at least 150 words.IELTS Tip•With graphs, make sure you understand what each axis is measuring.• With bar and pie charts, there is often a key which tells you what each different bar or area represents.• With tables, read the data across the rows and down the columns to identify the key features.Fill in the gaps in the model answer.The charts give information about the genres of TV programmes that Australian men and women and different age groups watch.It is clear from the charts that women tend to watch more television than man overall, although they watch slightly fewer game shows. The people who watch themost television are in the 45+ age group.Nearly 70% of women watch reality shows, which is almost twice as many as the percentage of men who choose this genre of programme.Nevertheless, most age groups watch more reality shows than game shows revealing that game shows are generally less popular than reality shows.The percentage of people watching reality shows increases steadily from ages 16 to 45 with the lowest / smallest percentage of viewers, at just over 50% of the age group 16-24 and the highest / biggest / largest / greatest percentage, at 68% of the over-45s.However,the pattern is different for game shows.The number of programmes watched by25-to44-year-olds is significantly/considerably lower than the number watched by 16- to 24-year-olds and those over 45. Just over 50%of16-to24-year-olds watch game shows,but this share is not as high as the share of people aged 45 and over watching game shows, at nearly 70%. Only 41% of 35- to 44-year-olds watch game shows, and the share of 24- to 34-year-olds is slightly / even lower at 38%.107.You should spend about 20 minutes on this task.The graph below shows the changes in food consumption by Chinese people between 1985 and 2010.Summarise the information by selecting and reporting the main features, and make comparisons where relevant.Write at least 150 words.Writing TipIt is best to use amount and quantity for uncountable nouns,although both are used for countable nouns as well, particularly quantity.The amount of consumption decreased in the last 25 years.AnswerThe graph shows changes in the amount of fish, salt and meat eaten per person per week in China between 1985 and 2010.From the graph we can see that people in China consumed more fish than either meat or salt throughout the period. In 1985, the consumption of fish stood at 610 grams, then increased to 700 grams in 1990. Although it dipped in 1995, it then rose steadily and reached 850 grams in 2010.In contrast, there was a consistent drop in salt consumption. The amount consumed decreased steadily from almost 500 grams per person to only 200 grams by 2010. The amount of meat consumed weekly started at about 100grams. However, this gradually increased throughout the period. By 2010 it was at the same level as the consumption of salt.Overall,the consumption of fish rose,while the consumption of salt fell. In addition, the consumption of meat, while at a relatively low level, rose significantly during this period.108.You should spend about 20 minutes on this task.The graph below shows the population change between1940and2000in three different counties in the U.S. state of Oregon.Summarise the information by selecting and reporting the main features, and make comparisons where relevant.Write at least 150 words.IELTS TipThe structure of your answer would look like this:Introduction - Explain briefly in your own words what the information shows. Give more detail than the question and make comparisons where appropriate.Main Body - Decide how to organise your paragraphs. For example, in the model answer below, paragraph 2 is about 1940- 1970, paragraph 3 is about 1970-2000 for Columbia and Yamhill, and paragraph 4 is about 1970-2000 for Washington. Use words such as although and however to make contrasts, and words such as likewise to introduce similarities.Always include the actual data you have been given. The final paragraph is not a conclusion in this type of task.Model answerThe graph shows the increase in population of three counties, Columbia, Yamhill and Washington in the U.S. state of Oregon, between 1940 and 2000. In 1940, Columbia had the lowest population of the three counties, at around 25,000. This compared with about 30,000 in Yamhill and approximately 75,000 in Washington.By 1970, Columbia’s population had risen to just under 36,000. Although this appears on the graph to be a gentle increase, it is in fact an increase of approximately 50%. Yamhill’s population also rose by nearly 50% between 1940 and 1970: from 30,000 to just under 45,000. However, the greatest real increase was in Washington, where the population in 1970 had increased by approximately 75,000, to 125,000.The years 1970 to 2000 saw the populations of Columbia and Yamhill increase by approximately the same amounts that they had increased by the thirty years before. In 2000, Columbia’s population – at approximately 76,000 – was triple what it had been in 1940. Likewise, Yamhill’s population, at around 90,000, was almost triple what it was in 1940.Although Washington ’s increase in population between 1940 and 1970 w as large,its increase in the following thirty years was even sharper,rising from about 125,000 in 1970 to more than 240,000 in 2000.(206 words)109.IELTS TipYou will lose marks if you make grammatical errors in your writing, particularly when errors are frequent and effect meaning. Be careful of the following common mistakes when describing numbers.amount and number: amount is used with uncountable nouns; number is used with countable nouns, e.g. The amount of meat consumed in China between 1985 and 2010. NOT .per cent and percentage:per cent is always used with a number;percentage is used on its own without a number,e.g.The percentage of male teachers in the UK. NOT . According to the graph, four per cent of the total household budget went towards transportation . NOT .You should spend about 20 minutes on this task.The graph below shows the amount of money spent on books in Germany,France, Italy and Austria between 1995 and 2005.Write a report for a university lecturer describing the information below.Write at least 150 words.Read the following sample plete the answer by filling the gaps with the words in the box.biggest much sharplessleastmoredramaticallythree timesThe line graph compares the amount of money spent on buying books in Germany, France, Italy and Austria over a period of ten years between 1995 and 2005.In 1995 Austria spent the least amount of money on books, while Italy and France spent about as much as each other. However, by 2001, the gap in spending between these two countries had widened and considerably more money was spent in France than In Italy.As can be seen from the graph, the amount of money spent increased in all four countries but rose the most dramatically in Austria.The period between 2000 and 2005 saw a sharp growth and in 2005 the Austrians spent three times as much money as they did in 1995.However, during this ten-year period, Germany remained the biggest spenders on book, with all three other countries spending much less on them.110.IELTS TipIt is quite common for IELTS Writing Task 1 to involve more than one piece of information relating to the topic. For example, you may get two or three pie charts that you must compare. The pie charts may represent different years and show trends over time.In this case,you will have to describe the changes and similarities/differences between the pie charts. Related Topic: Comparing pie chartsYou should spend about 20 minutes on this task.The three pie charts below show the changes in annual spending by local authorities in Someland in 1980, 1990 and 2000.Summarise the information by selecting and reporting the main features, and make comparisons where relevant.Write at least 150 words.Expenditure by local authorities in SomelandModel answerThe charts show how much local authorities spent on a range of services in Someland in three separate years: 1980, 1990 and 2000.In all three years,the greatest expenditure was on education.But while K-12 education saw a fall from 25% in 1980 to only 18% of spending in 2000, higher education remained the largest proportion, reaching 45% of total spending in 1990 and ending at 40% in 2000.Expenditure on health and human resources had increased to 20% by 1990before decreasing to only 10% by the end of the period. In contrast, the share of transportation saw an opposite trend. This cost decreased to only 6% of total expenditure in 1990 but rose dramatically in 2000 when it represented 22% of the total budget. Similarly, the cost of environmental services saw a rising trend, growing from only 4% to 9% by 2000. Overall,higher education constituted the largest cost to local authorities,and while spending increased for transportation and environmental services, there were corresponding drops in expenditure on health and human resources and K-12 education.(178 words)。
雅思口语参考范文:DoyouthinkwatchingTVisawasteoftime

雅思口语参考范文:DoyouthinkwatchingTVisawasteoftime雅思口语考试话题类型多种多样,掌握每种话题的表达方法,才能以不变应万变,今天小编就来给大家分享一下,雅思口语参考答案:Do you think watching TV is a waste of time,更多雅思口语话题范文,欢迎随时关注店铺。
雅思口语参考答案:Do you think watching TV is a waste of time?【Question】Do you think watching TV is a waste of time?【Answer】No, I do not think that watching TV is a waste of time. Firstly, one can learn a lot from watching TV. Secondly, it is a good way to relax. For example, the soap operas help me to relax, while the documentaries are informative. Lastly, I believe that TV has become the best source of information these days. For example, it is a fast and convenient way to find out the latest news from all over the world.雅思口语Part1答案之Time时间1. Do you usually wear a watch?I know some people say that with mobile phones, the wrist watch is out-dated. I disagree. A quick glimpse at your watch during a meeting or on the production line is a lot better than pulling out your cell phone. I find a watch to still be the most convenient method of time keeping.我知道有一些人说,有了手机,手表就过时了。
雅思作文满分范文(5篇)

雅思作文满分范文(5篇)(经典版)编制人:__________________审核人:__________________审批人:__________________编制单位:__________________编制时间:____年____月____日序言下载提示:该文档是本店铺精心编制而成的,希望大家下载后,能够帮助大家解决实际问题。
文档下载后可定制修改,请根据实际需要进行调整和使用,谢谢!并且,本店铺为大家提供各种类型的经典范文,如工作总结、工作计划、合同协议、条据文书、策划方案、句子大全、作文大全、诗词歌赋、教案资料、其他范文等等,想了解不同范文格式和写法,敬请关注!Download tips: This document is carefully compiled by this editor. I hope that after you download it, it can help you solve practical problems. The document can be customized and modified after downloading, please adjust and use it according to actual needs, thank you!Moreover, our store provides various types of classic sample essays for everyone, such as work summaries, work plans, contract agreements, doctrinal documents, planning plans, complete sentences, complete compositions, poems, songs, teaching materials, and other sample essays. If you want to learn about different sample formats and writing methods, please stay tuned!雅思作文满分范文(5篇)雅思作文满分范文第1篇下面给大家讲解一下小作文的心得和训练方法:小作文(A类)心得:为考的是A类,这里只说A类,留学生的话也建议考A类,平时写报告其实就是在练小作文,尤其是理工科。
雅思经典小作文范文

1. The charts below show the percentage of their food budget the average family spent on restaurant meals in different years. The graph shows the number of meals eaten in fast food restaurants and sit-down restaurants.You should write at least 150 words.Give reasons for your answer and include any relevant examples from your own knowledge or experience.Over the past 30 years, the average family has dramatically increased the number of meals that they eat at restaurants. The percentage of the family's food budget spent on restaurant meals steadily climbed. Just 10 percent of the food budget was spent on restaurant meals in 1970, and 15 percent in 1980. That percentage more than doubled in 1990, to 35 percent, and rose again in 2000 to 50 percent. Where families eat their restaurant meals also changed during that 30-year period. In 1970, families ate the same number of meals at fast food and sit-down restaurants. In 1980, fam¬ilies ate slightly more frequently at sit-down restaurants. However, since 1990, fast food restaurants serve more meals to the families than do the sit-down restaurants. Most of the restaurant meals from 2000 were eaten at fast food restaurants. If this pattern continues, eventually the number of meals that families eat at fast food restaurants could double the number of meals they eat at sit-down restaurants.(164 words)2. You should spend about 20 minutes on this task.The map below is of the town of Garlsdon. A new supermarket (S) is planned for the town. The map shows two possible sites for the supermarket.Summarise the information by selecting and reporting the main features, and make comparisons where relevant.You should write at least 150 wordsmodel answer:The first potential location (S1) is outside the town itself, and is sited just off the main road to the town of Hindon, lying 12 kms to the north-west. This site is in the countryside and so would be able to accommodate a lot of car parking. This would make it accessable to shoppers from both Hindon and Garlsdon who could travel by car. As it is also close to the railway line linking the who towns to Cransdon (25 km to the south-east), a potentially large number of shoppers would also be able to travel by train.In contrast, the suggested location, S2, is right in the town centre, which would be good for local residents. Theorically the store could be accessed by road or rail from the surrounding towns, including Bransdon, but as the central area is a no-traffic zone, cars would be unable to park and access would be difficult.Overall, neither site is appropriate for all the towns, but for customers in Cransdon, Hindon and Garlsdon, the out-of-town site (S1) would probably offer more advantages.(179 words)3. You should spend about 20 minutes on this task.The table below shows CO2 emissions for different forms of transport in the European Union.The Pie Chart shows the percentage of European Union funds being spent on different forms of transport.You should write at least 150 words.model answer:The chart shows CO2 emissions per passenger kilometre for variuos methods of transport in the European Union while the pie chart shows European Union spending on transport. Flying by air produces by far the greatest CO2 emissions, approximately three times as much as passenger cars which are the next largest producers. Very little is spent by the EU on air travel while roads make up more than half of the EU transport budget.Trains produce about three times less CO2 emissions per passenger kilometre than passenger cars and eight times less than air travel. Nearly a third of EU transport funds are spent on railways.Ships are a clean form of transport and produce about the same amount of CO2 per passenger kilometre as trains do. However, only 2 percent of EU funds are spent on ports. A further one percent is spent on inland waterways.Coaches are the cleanest form of transport. Emissions of CO2 per passenger kilometre from coaches are half those of buses. Buses emit less than half as much CO2 per passenger kilometre as cars. The European Union spends 10 percent of its transport budget on public transport, such as buses and coaches. (197 words)4. You should spend about 20 minutes on this task.The table below shows the sales at a small restaurant in a downtown business district.Summarize the information by selecting and reporting the main features, and make comparisons where relevant.You should write at least 150 words.Give reasons for your answer and include any relevant examples from your own knowledge or experience.model answer:The sales at this small restaurant during the week of October 7 to 13th followed a fairly set pattern from Monday to Friday, and then showed notable shift on the weekend. The lunch and dinner sales during the week peaked on Friday and then dipper down as the weekend set in.During the week of October 7-14th, the lunch sales averaged at approximately $2,400. The highest lunch sales occurred on Friday, and the lowest occurred on Sunday. Sunday's lunch sales were approximately $1,000 less than the average lunch sales during the rest of the week.Dinner sales, which generated at least $1,000 to $1,500 more a day than lunch sales, also remained steady during the week. Just like the lunch sales, the dinner sales peak on Friday and dipped down for the weekend.Excluding Wednesday and Thursday, the lunch and dinner sales from October 7-11 rose gradually until the end of the business week. Midweek, on Wednesday and Thursday, the sales were slightly lower than they were on Tuesday.According to the sales report, this restaurant has a steady lunch and dinner crowd. The most profitable day during the second week of October was Friday. Sunday, was the least prof¬itable day, with the full day's sales totaling/totalling less than the Friday dinner sales. These numbers are reflective of a restaurant that is located in a business/financial district where business hours are Monday through Friday.# 40. You should spend about 20 minutes on this task.In June 1996, an experimental flu vaccine was trialled in a large country town on females only.Summarise the information by selecting and reporting the main features, and make comparisons where relevant.You should write at least 150 words.Give reasons for your answer and include any relevant examples from your own knowledge or experience.model answer:The diagrams show data for a flu epidemic which hit a large country town in 1996. Figure 1 gives the number of persons who died; Figure 2 shows the percentage breakdown of females who received a new flu vaccine; and Figure 3 gives the number of cases of flu before and during the epidemic.In Figure 1 it can be seen that the flu was responsible for the deaths of 2 females but no males in the period from March to May. However, from June to August, there were 4 female deaths and 1 male death.According to the pie chart in Figure 2, only those females most at risk were given the new flu vaccine; 28% did not take part in the trial. Of those females who took part, 35% were aged (over 65 years old); 24% were babies or children; and 13% were either hospitalised or receiving other medical attention.From Figure 3 it is clear that the new vaccine had a positive effect on the number of new cases of flu reported in females. There were just over 1000 cases reported in March, climbing rapidly to a peak of 3500 in June. Thereafter, the number of cases dropped slowly to about 2800 in August, before levelling off at 2500 for the rest of the year. For males, the figures were lower but showed a similar trend throughout the epidemic.(232 words)# 38. You should spend about 20 minutes on this task.The chart shows the number of mobile phones and landlines per 100 people in selected countries. Write a report for a university lecturer describing the information given.You should write at least 150 words.model answer:The graph shows the number of mobile phones and landlines per 100 users, for selected countries. Overall, most of the countries included in the graph have more mobile phones subscribers than landlines.Most European countries have high mobile phone use. The biggest users of mobile phones are the Italians, with 88 cell phones per 100 people. For example, Italy has twice as many mobile phones as landlines, with 88 mobiles per hundred people compared to 45 for landlines. Mobile phone use is low in Canada, with fewer than 40 phones per 100 people. Denmark is also unusual because it has slightly more landlines than mobile phones.However, in some countries, the number of landlines is higher than the number of mobile phones. One example is the USA, where the number of mobiles, at 50 per 100 people, is much lower than the number of landlines, at almost 70 per hundred.A similar pattern can be seen in Canada. The highest number of landlines in the graph is in Denmark, with about 90 per 100 people. In contrast, the lowest figures for fixed lines are in Italy and the UK.In conclusion, it seems that mobile phone use is higher in Europe than in North America.#39. You should spend about 20 minutes on this task.The chart below shows estimated world literacy rates by region and by gender for the year 2000.Write a report for a university lecturer describing the information below.You should write at least 150 words.model answer:In this report I will describe a bar chart that shows the estimated world illiteracy rates by gender and region for the year 2000.First I will look at male illiteracy for the 6 areas shown. The lowest rates were in Developed Countries, Latin America/Caribbean and East Asia/Oceania with rates of 1% (approximately), 10% and 8% (approximately) respectively. The rates for the next three areas were much higher and quite similar to each other. Sub-Saharan Africa, the ArabStates and South Asia had rates of approximately 31%, 29% and 34%.Female illiteracy was much higher relatively in each area except LatinAmerica/Caribbean where it was only slightly higher. The lowest rates for female illiteracy were again Developed Countries, Latin America/Caribbean and East Asia/Oceania with rates of approximately 2%, 12% and 20%. Again the rates for the next three areas were much higher and quite similar to each other. Sub-Saharan Africa, the Arab States and South Asia had rates of approximately 48%, 52% and 56%.This ends my report.# 37. You should spend about 20 minutes on this task.The graphs show enrolment in different colleges in the Higher Colleges of Technology in 1999.Write a total of 150 - 200 words about the information in the three graphs. Write a report for a university lecturer describing the information given.You should write at least 150 wordsmodel answer:The charts shows student enrolment by gender and level in different colleges of the Higher Colleges of Technology colleges in the UAE.There are clear differences in male and female enrolment. Females outnumber men in all the colleges, with almost 25% more students in Dubai Women's college than in Dubai Men's. Ras Al-Khaimah Women's College has almost 180 students, compared to only 100 in the Men's college.Females also outnumber males by level, with almost double the number of men at Higher Diploma level (330 compared to 181). Only at Diploma level does thenumber of men slightly exceed that of women.Over half the students are in Certificate level, with less than a quarter at Higher Diploma or Bachelor level.In conclusion, most students in the Higher Colleges are enrolled at Diploma level or below, and the majority of students are women.(143 words)# 36. You should spend about 20 minutes on this task.The line graph below shows the number of annual visits to Australia by overseas residents. The table below gives information on the country of origin where the visitors came from. Write a report for a university lecturer describing the information given.You should write at least 150 words.NUMBER OF VISITORS (million)1975 2005SOUTH KOREAJAPANCHINAUSABRITAINEUROPE 2.93.20.30.40.91.19.112.00.81.12.94.5Total 8.8 30.4model answer:The given line graph illustrates information on the number of overseas visitors traveling to Australia in millions of people. Overall, one notable trend seems to be that Australia has steadily become more popular as a destination spot. For example, there were 20 million more visitors to Australia in 2005 than in 1975. That's a jump from 10 million to 30 million in 20 years.The second table gives statistics showing the countries whose residents went toAustralia between 1975 and 2005. In both years, the largest number of visitors came from Japan, followed by South Korea and Europe. Britain, the United States and China also had many people traveling to Australia in these years. In fact, the number of people visiting Australia grew in every one of these countries. For example, in 2005, 12 million people went there from Japan compared with only 3.2 million in 1975.(147 words)#35. You should spend about 20 minutes on this task.The table below shows the consumer durables (telephone, refrigerator, etc.) owned in Britain from 1972 to 1983.Write a report for a university lecturer describing the information shown below.Consumer1972 1974 1976 1978 1979 1981 1982 1983 durablesPercentage ofhouseholds with:central heating 39 43 48 52 55 59 60 64television 93 95 96 96 97 97 97 98video 18vacuum cleaner 87 89 92 92 93 94 95refrigerator 73 81 88 91 92 93 93 94washing66 68 71 75 74 78 79 80 machinedishwasher 3 3 4 4 5telephone 42 50 54 60 67 75 76 77 model answer:The chart shows that the percentage of British households with a range of consumer durables steadily increased between 1972 and 1983. The greatest increase was in telephone ownership, rising from 42% in 1972 to 77% in 1983. Next came centralheating ownership, rising from 37% of households in 1972 to 64% in 1983. The percentage of households with a refrigerator rose 2 1% over the same period and of those with a washing machine by 14%. Households with vacuum-cleaners. televisions and dishwashers increased by 8%, 5% and 2% respectively. In 1983. the year of their introduction, 18% of households had a video recorder.The significant social changes reflected in the statistics are that over the period the proportion of British houses with central heating rose from one to two thuds, and of those with a phone from under a half to over three-quarters. Together with the big increases in the ownership of washing machines and refrigerators, they are evidence of both rising living standards and the trend to lifestyles basedon comfort and convenience.#34. You should spend about 20 minutes on this task.The table below shows the figures for imprisonment in five countries between 1930 and 1980.Write a report for a university, lecturer describing the information shown below.model answer:The table shows that the figures for imprisonment in the five countries mentioned indicate no overall pattern of increase or decrease. In fact there is considerable fluctuation from country to country.In Great Britain the numbers in prison have increased steadily from 30 000 in 1930 to 80,000 in 1980. On the other hand in Australia, and particularly in New Zealand the numbers fell markedly from 1930 to 1940. Since then they have increased gradually, apart from in 1980 when the numbers in prison in New Zealand fell by about 30,000 from the 1970 total. Canada is the only country in which the numbers in prison have decreased over the period 1930 to 1980, although there have been fluctuations in this trend. The figures for the United States indicate the greatest number of prisoners compared to the other four countries but population size needs to be taken into account in this analysis. The prison population in the United States increased rapidly from 1970 to 1980 and this must be a worrying trend.。
雅思英语范文(推荐5篇)
大家都知道雅思也是考英语,那雅思考试和英语考试有没有区别呢?一起来看看吧!雅思考试和英语考试的区别一、答卷方式高考英语用时120分钟,为笔试。
而雅思考试包括150分钟的笔试和11至14分钟的与考官面对面的口试。
二、语法和词汇来源高考英语要求考生能够适当运用基本的语法知识,掌握3500左右的词汇及相关词组。
而雅思涉及到的词汇在6000以上。
三、考核技能及题型高考英语总分150分,包括30分听力,45分英语知识运用(语法词汇选择和完型填空),40分阅读理解和35分写作。
除了写作为主观性试题以外,其余题型都是客观性的多项选择题(multiplechoicequestions)。
而雅思考试包括听力、阅读、写作和口语四个部分,每个部分满分9分,总分为四项平均分。
其中不仅口语考试是高考英语所没有的,而且笔试部分题型多样。
光听力部分,就有经常考表格题、完成句子题、简短回答题、选择题、地图题、搭配题和图画题等多种题型。
雅思英语范文2今年南京市高考英语第一名仍然出在南京外国语学校,该生名叫xxx,得分为145分。
x xx去年考雅思取得了8分的好成绩,尤为难得的是,她的听力和阅读竟都得了满分9分!英语这么好是怎么学的?xxx说,高三的学习特别紧张,在做枯燥的数理化题目间,听听英语磁带,看看英语杂志是她放松的最佳办法,因为她实在喜欢英语。
而她用来学习英语的时间,则全都是零打碎敲的。
比如在骑车上学的路上,她会听英文原版《老友记》的MP3;吃饭的时候听听英语广播,看看中央电视台9套的动画片。
不知不觉中;xxx提高了自己的听力水平和词汇量,现在连英文摇滚都听得懂了。
增加词汇量,xxx也有自己的办法,看英文原版的《简爱》、《飘》,平时看英文杂志,发现不认识的单词和词汇就查;然后把例句随手写在杂志空白处,效果特好。
不过x xx也有自己的弱项,那就是语法,她笑称自己在英语语法上完全是一个白痴,做题目经常靠语感,幸好老师也没有硬逼着她去做语法题。
2021年7月1日雅思写作考试真题与范文
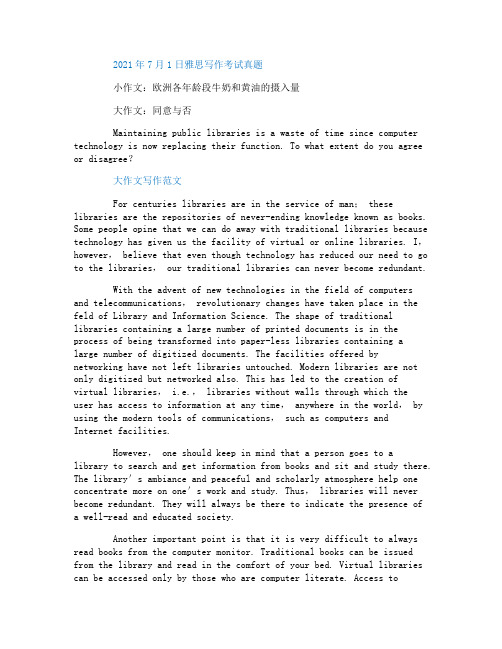
2021年7月1日雅思写作考试真题小作文:欧洲各年龄段牛奶和黄油的摄入量大作文:同意与否Maintaining public libraries is a waste of time since computer technology is now replacing their function. To what extent do you agree or disagree?大作文写作范文For centuries libraries are in the service of man; theselibraries are the repositories of never-ending knowledge known as books. Some people opine that we can do away with traditional libraries because technology has given us the facility of virtual or online libraries. I,however, believe that even though technology has reduced our need to go to the libraries, our traditional libraries can never become redundant.With the advent of new technologies in the field of computersand telecommunications, revolutionary changes have taken place in the feld of Library and Information Science. The shape of traditionallibraries containing a large number of printed documents is in the process of being transformed into paper-less libraries containing alarge number of digitized documents. The facilities offered bynetworking have not left libraries untouched. Modern libraries are not only digitized but networked also. This has led to the creation ofvirtual libraries, i.e., libraries without walls through which theuser has access to information at any time, anywhere in the world, by using the modern tools of communications, such as computers andInternet facilities.However, one should keep in mind that a person goes to alibrary to search and get information from books and sit and study there. The library's ambiance and peaceful and scholarly atmosphere help one concentrate more on one's work and study. Thus, libraries will never become redundant. They will always be there to indicate the presence of a well-read and educated society.Another important point is that it is very difficult to always read books from the computer monitor. Traditional books can be issued from the library and read in the comfort of your bed. Virtual libraries can be accessed only by those who are computer literate. Access tovirtual libraries can be affected by power cuts and network failures. Moreover, in a traditional library, you are guided by the librarians if you need any help in searching for the book.To put it in a nutshell, I pen down saying that advancement should be welcomed in every field, but the importance of the libraries for their fundamental role cannot be put aside. This tendency will add more crowns of success to the importance of libraries.雅思写作细节须知标点书写问题按英文书写规定,标点应紧挨着它的附着意群进行标注,与另一个意群要以一个字符的空格隔开。
IELTS雅思小作文Task1范文6篇

IELTS Task 1范文1.A glance at the graph provided reveals some striking similarities between the Chinese and US birth rates during the period from 1920 to 2000. It is evident that both nations saw considerable fluctuations in fertility, with lows during the 1940s and highs during the 1950s.1920 to15 percent in 1935, China’sThis was followed by a period of exponential growth, with fertility in the countrypercent in 1950.in this figure.The US birth rate, meanwhile, and 13 percentin 1950, followed by a steady fall.It is interesting to note that whileuntil 1950, the gap between the two after this time as fertility in China slid away.2.Given are two figures concerning criminality in Britain. The first provides data on the rates of conviction among men and women of various ages, while the second indicates the gender balance of the UK prison population.the rate of conviction among Britsof both during adolescence the age of about 20. men are far more likely to offend than women.From a negligible 2 percent among 10-year-old boys, the male conviction rateto approximately 20-year-olds. The percentage of0 percent among girls of 10 to some 5 percent for 20-year-olds. The however, see dramatic decreases in criminality among both sexes. A mere 2 percent of crimes are committed by 60-year-old men and 0 percent by women of the same age.As for the proportion of male and female prison inmates, men outnumber women 24 to 1. Some 96 percent of all prisioners are men, while the remainder are female.A glance at the two pie charts provided reveals the relative popularity of various leisure activities among European adults in 1985 and 1995.Of these activities in both years, at 32 percent in 1985 and a slightly lower 30 percent in 1995. Yet, by far the most significant change to take place during this period was the increased popularity of computer games. Not a single respondent to the survey rated playing computer games as their preferred leisure activity in 1985. However, by 1995 this figure stood at 27 percent –the second highest overall. Also more popular in 1995 was talking with friends, at 26 percent compared to 21 percent a decade earlier.In stark contrast, however, all other activities decreased in popularity. Eating out –which was the second most widely enjoyed pastime in 1985,percent of respondents – slipped to a mere 8 percent in 1995. Likewisealso considerable decreases in the popularity ratings of talking withactivities and (as previously mentioned) watching television.4.Given are two figures providing a comparison of internet use in five European countries (namely Switzerland, Germany, France, Spain and the UK) in 1995, 2000 and 2004, as well as the popularity of internet shopping in these countries.It is evident from the information provided that Britain had by far the highest number of internet users in all three years. From 16 million in 1995, the number of British users climbed steadily to 22 million in 2000, before soaring to a staggering 41 million in 2004. Second in terms of internet use was Germany. This country saw a threefold increase during the period in question, from 5 million people in 1995 to 14 million in 2000 and 15 million in 2004. A similar increase took place in France. The two nations with the fewest internet users, meanwhile, were Switzerland and Spain. It is also interesting to note that internet shopping was far more common in the UK than in any other country listed.In fact, the prevalence of internet shopping in Britain was double that of Germany and triple that of Switzerland. France and Spain, meanwhile, had moderate levels of online shopping.A glance at the table provided reveals a number of clear differences between the major metro systems of the world in terms of age, scale and annual carrying capacity.One particularly interesting fact highlighted by the figure is that the more recently established metro systems are considerably shorter than the older ones. Completed in 1863, the London underground is the oldestthe longest, extending for 1100 kilometres.stark contrast, howeverand 2001 respectively– are far shorter. The formerthe latter just 14 kilometre s.With regard to yearly carrying capacity, the metro systems mentioned in the table vary greatly. The Tokyo metro is equipped to carry the largest number of passengers, at 1434 million. With 850 million, meanwhile, the Paris metro has the second largest carrying capacity. The systems with the smallest capacities are those of Kyoto and Washington DC, transporting just 11 million and 70 million people per year respectively.6.Given are two column graphs comparing the rates of secondary and tertiary education among males and females in various different parts of the world.compared with only 20 Asia, meanwhile, have moderate levels of secondary education – between 40 and 50 percent for both sexes.With regard to higher education, the figures are much lower throughout the world. In Europe, some 50 percent of adult females and 45 percent of adult males gain a higher education.Sub-Saharan Africa The figures for Latin America and East Asia are marginally higher thanAlso noteworthy is the fact that receive a secondary education in all regions except East Asia, but less likely to receive a tertiary education in all regions except Europe.。
雅思英文作文范文10篇
雅思英文作文范文1. 教育话题题目:Some people believe that schools should primarily teach students how to become good citizens, while others believe that the main purpose of schools is to prepare students for the workforce. Discuss both views and give your opinion.In today's rapidly changing world, the role of schools is a subject of debate. Some argue that schools should focus on teaching students how to become responsible citizens, while others emphasize the importance of preparing students for the workforce.Proponents of the first view argue that schools play a crucial role in shaping responsible citizens. They believe that schools should instill values such as empathy, tolerance, and civic engagement. By prioritizing citizenship education, schools can contribute to the development of individuals who are not only skilled in their professions but also actively participate in their communities.On the other hand, advocates for the workforce preparation perspective argue that schools must equip students with the skills and knowledge needed for their future careers. In today's competitive job market, practical skills and qualifications are essential for success. Therefore, schools should prioritize subjects that are directly relevant to the workforce.In my opinion, a balanced approach is necessary. Schools should strive to achieve both goals. By providing a well-rounded education that includes citizenship education and workforce preparation, schools can produce well-rounded individuals who are not only skilled professionals but also responsible citizens.2. 社会问题题目:Some people believe that the government should be responsible for providing healthcare for all citizens, while others think that individuals should take responsibility for their healthcare. Discuss both views and give your opinion.The issue of healthcare provision is a topic of ongoing debate. Some argue that the government should be responsible for providing healthcare to all citizens, while others believe that individuals should take responsibility for their healthcare.Supporters of government-funded healthcare argue that it is a fundamental right for all citizens to have access to healthcare services. They contend that a public healthcare system ensures that everyone, regardless of their financial status, can receive medical treatment when needed. This, they argue, promotes equality and social well-being.On the other hand, proponents of individual responsibility for healthcare argue that personal health choices, such as diet and exercise,play a significant role in one's well-being. They believe that individuals should take proactive measures to maintain their health and seek private healthcare options when necessary. This approach, they argue, encourages personal accountability.In my view, a combination of both approaches is ideal. Government-funded healthcare can provide a safety net for those who cannot afford private healthcare, ensuring that basic medical services are accessible to all. However, individuals should also be encouraged to take responsibility for their health through healthy lifestyle choices and preventative measures.3. 环境问题题目:Environmental problems are too big for individual countries and individual persons to address. In today's world, we should focus more on international cooperation. To what extent do you agree or disagree?Environmental issues, such as climate change and pollution, have global implications that extend beyond the borders of individual countries. Some argue that addressing these problems requires a greater emphasis on international cooperation rather than relying solely on individual countries and individuals.I strongly agree with the view that international cooperation is essential to effectively tackle environmental problems. Climate change,for example, is a global issue that requires collective action from nations worldwide. The impact of greenhouse gas emissions, deforestation, and other environmental challenges transcends national boundaries, making it impossible for any single country to address them in isolation.International cooperation can lead to the development of comprehensive strategies and agreements aimed at mitigating environmental problems. The Paris Agreement, for instance, is a testament to the power of global collaboration in addressing climate change.Moreover, international cooperation fosters knowledge sharing and technological advancements. Countries can learn from each other's successes and failures in addressing environmental issues, leading to more effective solutions.In conclusion, the scale and complexity of environmental problems demand international cooperation. While individual countries and individuals have a role to play, it is only through collective global efforts that we can hope to mitigate the impact of these challenges and protect the planet for future generations.4. 科技与社会题目:Some people argue that advances in technology have made our lives more stressful, while others believe that technology has made our lives easier and more convenient. Discuss both views and give your opinion.The impact of technology on our lives is a subject of debate. Some argue that advances in technology have increased stress levels, while others believe that technology has made our lives easier and more convenient.Supporters of the view that technology has increased stress levels point to several factors. They argue that the constant connectivity provided by smartphones and the internet has blurred the boundaries between work and personal life, leading to increased stress. Additionally, the rapid pace of technological change can create anxiety as individuals struggle to keep up with the latest developments.On the other hand, proponents of technology's role in making our lives easier highlight its numerous benefits. They argue that technology has improved communication, access to information, and efficiency in various aspects of life. Tasks that were once time-consuming are now simplified through automation and digital tools.In my opinion, technology has the potential to both increase stress and enhance convenience, depending on how it is used. It is essential forindividuals to strike a balance between leveraging technology for its benefits while also managing its potential negative impacts on stress. Responsible and mindful use of technology can lead to a more convenient and less stressful life.5. 社会变革题目:Some people believe that social media platforms like Facebook and Twitter have a positive impact on society, while others argue that they have a negative influence. Discuss both views and give your opinion.The influence of social media platforms on society is a topic of ongoing debate. Some argue that these platforms have a positive impact, while others contend that they have a negative influence.Supporters of the positive impact of social media argue that these platforms facilitate communication and connectivity among individuals worldwide. They provide a space for people to share information, connect with friends and family, and raise awareness about important social issues. Social media has played a crucial role in organizing movements and campaigns for social change.However, critics argue that social media can have a negative influence on society. They point to issues such as cyberbullying, the spread of misinformation, and the negative impact on mental health. Theaddictive nature of social media and the potential for echo chambers where individuals are exposed only to like-minded opinions are also concerns.In my opinion, social media platforms have the potential for both positive and negative impacts, depending on how they are used. It is essential for individuals to use these platforms responsibly, critically evaluate the information they encounter, and be mindful of their online interactions. When used thoughtfully, social media can be a powerful tool for positive social change and connectivity.6. 社会问题题目:Some people believe that the government should regulate the fast-food industry to prevent health problems, while others think this is the responsibility of individuals. Discuss both views and give your opinion.The regulation of the fast-food industry is a topic of debate. Some argue that the government should intervene to prevent health problems, while others believe that individuals should take responsibility for their dietary choices.Proponents of government regulation contend that the fast-food industry has a significant role in contributing to health problems such as obesity and heart disease. They argue that stricter regulations, such aslimiting advertising to children or mandating clearer nutritional information, can help consumers make informed choices and ultimately lead to better public health outcomes.On the other hand, advocates for individual responsibility argue that adults should have the freedom to make their own dietary choices. They believe that educating individuals about nutrition and encouraging healthier eating habits should be the primary focus, rather than imposing government regulations.In my view, a balanced approach is necessary. While individuals should have the freedom to make their own choices, the fast-food industry does have a responsibility to provide clear and accurate information about the nutritional content of their products. Government regulations can help ensure transparency and protect consumers, especially in cases involving children's advertising.7. 环境问题题目:Some people believe that the best way to solve environmental problems is to increase the cost of fuel for cars and other vehicles. To what extent do you agree or disagree?Addressing environmental problems, particularly related to carbon emissions and air pollution, is a critical concern. Some argue that raisingthe cost of fuel for cars and other vehicles is an effective way to incentivize environmentally friendly behavior.I strongly agree with the view that increasing the cost of fuel can be an effective strategy to combat environmental problems. Higher fuel prices encourage individuals to use public transportation, carpool, or consider alternative transportation options such as electric or hybrid vehicles. This, in turn, reduces the carbon footprint and air pollution associated with traditional gasoline-powered vehicles.Furthermore, the additional revenue generated from higher fuel prices can be reinvested in the development of cleaner and more sustainable transportation infrastructure, such as improved public transit systems and bike lanes.In conclusion, increasing the cost of fuel for cars and other vehicles can serve as a powerful incentive for individuals to adopt more environmentally friendly transportation choices. This measure not only addresses environmental problems but also promotes sustainable and responsible behavior.8. 科技与社会题目:Some people argue that the widespread use of smartphones and social media has led to a decline in face-to-face social interactions. Do you agree or disagree?The impact of smartphones and social media on face-to-face social interactions is a matter of ongoing debate. Some argue that these technologies have led to a decline in such interactions, while others disagree.I agree with the view that the widespread use of smartphones and social media has, to some extent, led to a decline in face-to-face social interactions. Many people are now more engaged in their digital lives, constantly checking their phones for messages, updates, and social media notifications. This can reduce the quality and quantity of in-person interactions.Moreover, the convenience of virtual communication can lead to a preference for online interactions over face-to-face conversations. People may choose to communicate via text or social media rather than meeting in person, which can contribute to a decline in direct human contact.However, it's essential to recognize that technology's impact on social interactions is complex and multifaceted. While there are challenges associated with smartphone use, these devices also enable connections with people across long distances and can enhance social interactions in various ways. The key is to strike a balance between digital and in-person communication to maintain healthy social relationships.9. 教育话题题目:Some people believe that students should be given one long vacation each year, while others believe that students should have several short vacations throughout the year. Discuss both views and give your opinion.The structure of school vacations is a topic of discussion. Some argue that students should have one long vacation each year, while others believe that several short vacations throughout the year are more beneficial.Proponents of one long vacation argue that it provides students with an extended period for relaxation and the opportunity to engage in meaningful activities, such as travel or internships. They contend that a lengthy break allows students to recharge and return to school with renewed enthusiasm.On the other hand, advocates for several short vacations believe that shorter breaks distributed throughout the year help maintain continuity in learning. They argue that students are less likely to experience "summer learning loss" and can better retain knowledge when they have regular breaks for rest and rejuvenation.In my opinion, a combination of both approaches can be beneficial. Having one long vacation each year can provide students with an extended break for exploration and relaxation. However, incorporatingshorter breaks throughout the academic year can help students maintain focus and prevent burnout. The key is to strike a balance that ensures students have ample opportunities for both learning and leisure.10. 社会变革题目:Some people argue that advancements in automation and artificial intelligence will lead to widespread job loss and unemployment. Do you agree or disagree?The impact of automation and artificial intelligence on employment is a topic of concern and debate. Some argue that these advancements will result in widespread job loss and unemployment, while others disagree.I believe that while automation and AI will indeed reshape the job market, they may not necessarily lead to widespread job loss and unemployment. Automation has the potential to eliminate certain routine and repetitive tasks, but it also creates opportunities for new types of jobs and industries.For example, as automation takes over routine tasks, it frees up human workers to focus on more creative and complex aspects of their jobs. Additionally, the development and maintenance of automation systems and AI technologies require skilled workers, leading to the creation of jobs in those fields.Moreover, automation and AI have the potential to improve productivity and efficiency in various industries, which can lead to economic growth and the creation of new businesses and jobs.In conclusion, while advancements in automation and artificial intelligence will undoubtedly impact the job market, the overall effect may not necessarily be widespread job loss and unemployment. Adaptation, reskilling, and a focus on emerging industries are essential for individuals and economies to thrive in the changing landscape of work.。
- 1、下载文档前请自行甄别文档内容的完整性,平台不提供额外的编辑、内容补充、找答案等附加服务。
- 2、"仅部分预览"的文档,不可在线预览部分如存在完整性等问题,可反馈申请退款(可完整预览的文档不适用该条件!)。
- 3、如文档侵犯您的权益,请联系客服反馈,我们会尽快为您处理(人工客服工作时间:9:00-18:30)。
老外写的小作文范文,比较直观~~第一篇作文题目第一篇范文参考model answer:The two graphs show that oil was the major energy source in the USA in both 1980 and 1990 and that coal, natural gas and hydroelectric power remained in much the same proportions. On the other hand, there was a dramatic rise in nuclear power, which doubled its percentage over the ten years.Oil supplied the largest percentage of energy, although the percentage decreased from 42% in 1980 to 33% in 1990. Coal in 1990 was the second largest source of energy, increasing its proportion to 27% from 22% in the previous decade. Natural gas, the second largest source in 1980 at 26%, decreased its share very slightly to provide 25% of America’s energy ten years later. There was no change in the percentage supplied by hydroelectric power which remained at 5% of the total energy used. Nuclear power the greatest change: in 1990 it was 10%, twice that of the 1980s.(152 words)第二篇第二篇答案参考model answer:The three graphs of wheat exports each show a quite different pattern between 1985 and 1990. Exports from Australia declined over the five-year period, while the Canadian market fluctuated considerably, and the European Community showed an increase.In 1985, Australia exported about 15 millions of tonnes of wheat and the following year the number increased by one million tonnes to 16 million. After that, however, there was a gradual decline until 1989 and 1990 when it stabilised at about 11 million tonnes. Over the same period, the amount of Canadian exports varied greatly. It started at 19 million tonnes in 1985, reached a peak in 1988 of 24 million, dropped dramatically in 1989 to 14 million tonnes and then climbed back to 19 million in 1990. Seventeen million tonnes were exported from the European Community in 1985, but this decreased to 14 million tonnes in 1986 and then rose to 15 million in 1987 and 1988 before increasing once more to 20 million in 1990.(165 words)第三篇(流程图哦,必看必看)You should spend about 20 minutes on this task.The flowchart illustrates the production of coloured plastic paper clips in a small factory.Write a report for a university tutor describing the production process.第三篇model answerThere are four main stages in the production of plastic paper clips from this small factory. Two of these stages involve actual preparation of the clips, while the other two consist of quality control before the clips are sent out from the factory to the retailers to be sold to the public.To begin with, molten plastic is poured into three different moulds depending on the colour required; the colours are red, blue and yellow. Once these clips emerge from the moulds a quality control machine checks them for strength. Unsatisfactory clips are rejected. In the third stage in the process the clips are stored by hand into two groups, mixed and single colours. When this stage is complete the groups are checked a second time to ensure that the colour mixtures are divided correctly into single colours and mixed colour batches. Finally, the clips are packed and dispatched to the markets.(152 words)第四篇表格题You should spend about 20 minutes on this task.The table below give information about Favorite Pastimes in different countries.Summarise the information by selecting and reporting the main features, and make comparisons where relevant.Write at least 150 words.第四篇参考答案model answer:This table clearly presents and compares favorable pastimes in eight different countries. The pastimes, across the top of the table, are analyzed in relation to each country.As can be seen, about 60% of Canadians, Australians and Americans like watching television. On the other hand, this figure is quite low for China where only 15% of people watch television. Predictably, Americans like music at 23%, whereas only 2 to 5% of people in the other countries feel the same way. 20% of people in England enjoy sleeping as a pastime whereas in Canada and the USA, for example, the figure is only 2%. Interestingly, the Chinese like hobbies the most at 50%, as opposed to only 20% in France. It isn’t surprising that the highest percentage of beach-lovers is in Australia and the USA at 30%.It seems that pastimes of people of different nationalities may be influenced by a number of factors such as the socio-economic situation or the climate. These factors influence cultural differences between different nationalities and make cross-cultural experiences more interesting.(175 words)You should spend about 20 minutes on this task.Write a report for a university lecturer describing the information shown below.You should write at least 150 words.第五篇参考答案In this analysis we will examine three pie charts. The first one is headed ‘World Spending.’ The second is ‘World Population’ and the third is ‘Consumption of Resources.’In the first chart we can see that people spend most of their income (24%) on food. In some countries this percentage would obviously be much higher. Transport and then housing are the next major expenses at 18% and 12% respectively. Only 6% of income is spent on clothing.In the second chart entitled ‘World Population’, it is not surp rising to find that 57% of people live in Asia. In fact China and India are two of the most populated countries in the world and they are both situated on this continent. Europe and the Americans account for nearly 30% of the total, whilst 10% of people live in Africa.Finally, the third chart reveals that the USA and Europe consume a huge 60% of the world’s resource.To sum up, the major expenditure is on food, the population figures are the highest for Asia and the major consumers are the USA and Europe.(182 words)You should spend about 20 minutes on this task.The graph and table below give information about water use worldwide and water consumption in two different countries.Summarise the information by selecting and reporting the main features, and make comparisons where relevant.Write at least 150 words第六篇参考答案model answer:The graph shows how the amount of water used worldwide changed between 1900 and 2000.Throughout the century, the largest quantity of water was used for agricultural Purposes, and this increased dramatically from about 500 km3 to around 3,000 km3 in the year 2000. Water used in the industrial and domestic sectors also increased, but consumption was minimal until mid-century. From 1950 onwards, industrial use grew steadily to just over 1,000 km3, while domestic use rose more slowly to only 300 km3, both far below the levels of consumption by agriculture.The table illustrates the differences in agriculture consumption in some areas of the world by contrasting the amount of irrigated land in Brazil (26,500 km3) with that in the D.R.C. (100 km2). This means that a huge amount of water is used in agriculture in Brazil, and this is reflected in the figures for water consumption per person: 359 m3 compared with only 8 m3 in the Congo. With a population of 176 million, the figures for Brazil indicate how high agriculture water consumption can be in some countries.。