表面磁光克尔实验报告.
kerr
COM 3 COM 4 COM 2 COM 1 YL2250
YL1030 1f 2f 50K Ref. AC SCU-90 DC PEM-90 50K Modulation I/FS50 Femto
45
0
2: 实验装置示意图 IV. A. 光
1:对样品支架进行 5 维调节,使反射光点落在光电探测器上,并使得输出的直 流信号分量达到最大。 2:抑制光弹调制器控制信号,调节检偏器 S 于起偏器 P 垂直消光。 3:启动光弹调制器控制信号,调节光弹调制器角度使消光,此时光弹调制器振 动方向垂直或平行于起偏器偏振方向。 4:转动检偏器 45 度,使体系工作在偏振态分析模式下。 7
X rF
F
a
F
b k Y
1: 极克尔效应中的反射椭偏光及复克尔转角的正方向定义。图中,z 轴正方向、入射光方 向、磁场或磁化强度方向均指纸面内,反射光沿 z 轴负方向。
C.
我们取光沿 -z 方向传播光弹调制器的振动轴沿 x 方向,y 方向由右手螺旋法则 决定。取沿 x 和 y 方向偏振的模为基。我们略去 x 和 y 方向光电场分量的共同相位, 将进入到光弹调制器的光的偏振态记为 (Ex , Ey ),不妨取 Ex 为实数,Ey 一般是复 数。容易看出,光弹调制器和与 x 方向成方向成 45 度角的检偏器对应琼斯矩阵分别 为: 1 0 1/2 1/2 和 iδ 0 e 1/2 1/2 4
(1) (2) (3) (4)
上式中 M 是磁化强度矢量,结合时间和空间对称性可以看出介电常数的对角元和非 对角元分别是磁化强度 M 的偶函数和奇函数。最终我们得到的介电常数张量在直角 2
坐标系下表示为:
ε δ 0
2 ε = பைடு நூலகம்−δ ε 0 = ε0 n iQ 0 0 εz 0
磁光效应实验报告
轴不够重合,检偏棱镜,透镜聚焦位置不好,抑或是测量时噪音过大,影像数据的读取。
四、
参考文献
[1]. Qiu Z Q , Bader S D. Surface magneto-optic Kerreffect [J ] . Journal of Magnetism and Magnetic Materials , 1999 ,200 :664~678. [2]. 赵凯华. 新概念物理教程·光学[M] . 北京:高等教育出版社,2004. [3]. 刘公强,乐志强,沈德芳。磁光学。 上海科学技术出版社,2002. [4]. 廖延彪. 偏振光学[M] . 北京:科学出版社,2005. [5]. 吴思诚 王祖铨. 近代物理实验 高等教育出版社,2005. [6]. M. Faraday, Trans. Roy. Soc. (London) 5 (1846) 592. [7]. J. Kerr, Philos. Mag. 3 (1877) 339. [8]. J. Kerr, Philos. Mag. 5 (1878) 161. [9]. E.R. Moog, S.D. Bader, Superlattices Microstruct. 1 (1985) [10]. 543. [11]. S.D. Bader, E.R. Moog, P. GruK nberg, J. Magn. Magn. [12]. Mater. 53 (1986) L295. [13]. S.D. Bader, J. Magn. Magn. Mater. 100 (1991) 440. [14]. J.C. Maxwell, A Treatise on Electricity and Magnetism, [15]. Vol. II, chap. XXI, Clarendon Press, Oxford, 1873, pp.399-417. [16]. Z.Q. Qiu, S.D. Bader / Journal of Magnetism and Magnetic Materials 200 (1999) 664}678 677
表面磁光柯尔效应原
實驗一 表面磁光柯爾效應原理與操作一、磁光柯爾效應原理在1845年,Michael Faraday首先發現了磁光效應,他發現外加磁場在玻璃樣品上,入射光的偏極化面有旋轉的現象,隨後他在金屬表面上外加磁場做光反射的實驗,但實驗結果不能使人信服,因為當時他的表面不夠平整。
到了1877 年John Kerr 亦發現偏極化光從拋光的電磁鐵磁極反射出來時,亦有極化方向偏轉的情況,即磁光科爾效應﹝Magneto-Optic Kerr Effect﹞。
1985 年Moog 和Bader 進行鐵超薄膜磊晶成長的磁光科爾效應量測實驗,並量得到一個原子層磁性物質的磁滯曲線。
由於此測量方法之靈敏度可達一原子層厚度,配合現在超高真空系統之技術,因此成為表面磁學研究重要的一環。
所謂磁光效應或法拉第效應之原理為:因自身磁化產生異向性的折射率導致了不同的相位,並且吸收了不同的振幅。
不同的相位與振幅造成了橢圓偏振,橢圓長短軸之比例稱為柯爾橢圓率,橢圓長軸與參考軸之夾角稱為柯爾旋轉角。
待測樣品若為透明且等向性的介質置於一強磁場內﹝見圖一﹞圖一則當線性偏極光沿磁場方向穿透此晶體時,其極化方向將旋轉一角度Δψ,此角度Δψ與所加的磁場強度B和介質長度L成正比,寫成:Δψ=B.L.V對於不透光材料﹝即表面磁光效應﹞,當光行進方向的任一分量與磁性材料的磁化量成平行時,其反射﹝或穿透﹞光的偏振方向將與原偏振光的方向產生一相對的旋轉角,即稱科爾旋轉角﹝Kerr rotation angle,θk﹞,如圖二所示﹝如為穿透光則稱為法拉第旋轉角﹞。
假設垂直於材料的磁化方向向上所產生的科爾旋轉角是“+θk",;則磁化方向向下的磁化量所產生的旋轉角將會是“-θk"。
圖二磁光科爾效應的種類:依入射光與磁化量之間角度的不同,可將磁光科爾效應分成三種:(1)極化磁光科爾效應(Polar)、(2)縱向磁光科爾效應(Longitudinal)以及(3)橫向磁光科爾效應(Transverse)如圖三(a)、(b)、(c)、所示。
磁科尔效应实验报告
一、实验目的1. 理解磁光科尔效应的基本原理。
2. 通过实验观察并测量磁光科尔效应的现象。
3. 探讨磁光科尔效应在不同条件下的变化规律。
二、实验原理磁光科尔效应,又称次电光效应(QEO),是指当一束光通过响应于电场的材料时,材料的折射率发生变化的现象。
这种现象与普克尔斯效应不同,其诱导折射率的变化与电场的平方成正比。
磁光科尔效应分为克尔电光效应(直流科尔效应)和光克尔效应(交流科尔效应)两种特殊情况。
三、实验器材1. 磁光克尔效应实验装置2. 可调直流电源3. 可调交流电源4. 光源5. 分束器6. 折射率测量仪7. 计时器8. 记录本四、实验步骤1. 将磁光克尔效应实验装置连接好,确保各部分连接牢固。
2. 打开光源,调整光源强度,使其稳定。
3. 将分束器置于光源和样品之间,调整分束器,使部分光束照射到样品上,另一部分光束作为参考光束。
4. 调整样品,使其位于光路中心。
5. 打开可调直流电源,调整电压,使样品受到直流电场作用。
观察折射率测量仪的示数,记录数据。
6. 关闭直流电源,打开可调交流电源,调整电压和频率,观察折射率测量仪的示数,记录数据。
7. 重复步骤5和6,分别记录不同电压、频率下的折射率变化数据。
8. 分析实验数据,探讨磁光克尔效应的变化规律。
五、实验结果与分析1. 直流电场下,样品的折射率随电压平方增大而增大,符合磁光克尔效应的特点。
2. 交流电场下,样品的折射率随电压平方增大而增大,但随频率变化而变化。
当频率较高时,折射率变化较小;当频率较低时,折射率变化较大。
3. 通过实验数据分析,得出磁光克尔效应的变化规律如下:- 直流电场下,折射率变化与电压平方成正比。
- 交流电场下,折射率变化与电压平方成正比,但随频率变化而变化。
六、实验结论1. 磁光克尔效应实验成功观察到磁光克尔效应现象。
2. 实验结果表明,磁光克尔效应与电压平方成正比,且随频率变化而变化。
3. 该实验验证了磁光克尔效应的基本原理,为磁光克尔效应在光学信息处理、光通信等领域的研究提供了实验依据。
表面磁光科尔效应与超薄膜磁性性质

表面磁光科爾效應與超薄膜磁性性質文/蔡志申摘要表面磁光科爾效應其磁性解析靈敏度達一原子層厚度,且儀器配置合於超高真空系統之工作,為奈米級超薄膜磁性研究之一大利器。
本文以實驗者角度介紹表面磁光科爾效應原理,並簡介超薄膜之磁滯曲線特性、磁異向性、磁性相變與合金之磁性性質。
一、簡介在1845年,Michael Faraday首先發現了磁光效應[1,2],他發現當外加磁場在玻璃樣品上時,透射光的偏極面發生旋轉的效應,隨後他在外加磁場之金屬表面上做光反射的實驗,但由於他所謂的表面並不夠平整,因而實驗結果不能使人信服。
1877年John Kerr在觀察偏極化光從拋光過的電磁鐵磁極反射出來時,發現了磁光科爾效應(magneto-optic Kerr effect)[2,3]。
1985年Moog 和Bader兩位學者進行鐵超薄膜磊晶成長在金單晶(100)面上的磁光科爾效應量測實驗,成功地得到一原子層厚度磁性物質之磁滯曲線,並且提出了以SMOKE來作為表面磁光科爾效應(surface magneto-optic Kerr effect)的縮寫,用以表示應用磁光科爾效應在表面磁學上的研究[4,5]。
由於此方法之磁性解析靈敏度達一原子層厚度,且儀器配置合於超高真空系統之工作,因而成為表面磁學的重要研究方法。
隨著科學技術的發展,應用元件的科技研發方向正快速朝向輕、薄、短、小推展,控制在奈米層次所製造出來的奈米電子元件其元件密度、速度、耗能及成本效益將遠超過現有的半導體技術;在元件製作過程中,能成長高品質的薄膜與精準地控制其物性,才能保證接續之微形蝕刻之成功,因而厚度僅約幾個原子層之超薄膜的相關研究在電子工業元件尺寸奈米化的技術中更顯得重要;由於在磁性感測器、磁光記憶元件、磁性記憶體等之工業應用與磁性自旋電子元件的可能性,帶來了億兆美元的商機,磁性超薄膜的物性研發,不但可帶動相關科學知識之突破,更可有效地提升工業技術,因而世界各科技先進國家無不投入大量資源。
磁光克尔 实验报告
磁光克尔实验报告引言磁光效应是指光波在磁场中传播时发生的旋光现象。
克尔效应是磁光效应的一种特殊现象,指的是在磁场中垂直于磁场方向的光波传播时,会发生旋光现象。
磁光克尔实验是用来研究磁光效应的一种常用实验方法,本实验旨在通过观察和测量克尔角来研究磁光克尔效应,并验证克尔关系式。
实验装置与原理实验装置主要由磁铁、起偏器、检偏器、光源、光阑、样品、读数器等组成。
光源经过起偏器后,成为偏振光,通过光阑后遇到样品,样品中的光将发生旋光,然后再通过检偏器,最后进入读数器进行测量。
克尔角是克尔效应的一个重要参数,定义为磁场方向与光轴方向(矩形截面晶体的主平面内)法线的夹角。
克尔角的大小直接与样品的性质及磁场的强弱有关。
实验步骤1. 将实验装置按照要求搭建好,调整起偏器和检偏器的角度,使其相互垂直。
2. 使用光源照射样品,调整磁铁的电流大小,观察检偏器的显示值,并记录下来。
3. 改变磁场的方向,逐渐增加电流大小,记录下检偏器的显示值。
4. 根据记录的数据绘制出克尔角随磁场强度的变化曲线。
数据处理与分析根据实验记录的数据,我们可以得到克尔角随磁场强度的变化曲线。
根据克尔关系式可以得到:K = V / (L * B)其中,K为克尔角,V为检偏器的显示值,L为样品的长度,B为磁场的强度。
通过绘制曲线,我们可以观察到克尔角随磁场强度的变化趋势。
一般来说,随着磁场强度的增加,克尔角会呈现出先增大后减小的趋势。
这是因为在磁场较弱时,磁光效应相对较小,克尔角较小;随着磁场强度的增加,磁光效应逐渐强化,克尔角也逐渐增大;当磁场达到一定强度后,由于样品本身的特性限制,克尔角开始减小。
结论通过本次实验,我们成功研究了磁光克尔效应,并验证了克尔关系式。
我们观察到克尔角随磁场强度的变化曲线,并根据该曲线得出了克尔角随磁场强度变化的一般规律。
此外,我们还了解到了磁光克尔效应在光学、材料学等领域的重要应用。
总的来说,本实验对我们深入理解磁光效应以及克尔效应的产生机制起到了重要的作用,为进一步研究相关领域的理论和应用提供了实验基础。
磁光效应物理实验报告(3篇)
第1篇一、实验目的1. 理解磁光效应的原理及其在光学领域中的应用;2. 掌握磁光效应实验的基本操作;3. 通过实验,测定磁光效应中的一些关键参数,如磁光克尔效应和法拉第效应;4. 分析实验数据,得出磁光效应的相关规律。
二、实验原理磁光效应是指电磁波在磁场中传播时,其电磁场分布发生变化的现象。
主要包括磁光克尔效应和法拉第效应。
1. 磁光克尔效应:当线偏振光通过具有磁光性质的介质时,其偏振面会旋转一个角度,称为克尔角。
克尔效应的大小与磁场的强度和介质的磁光常数有关。
2. 法拉第效应:当线偏振光通过具有法拉第效应的介质时,其偏振面会旋转一个角度,称为法拉第角。
法拉第效应的大小与磁场的强度、介质的法拉第常数以及光在介质中的传播速度有关。
三、实验仪器与材料1. 磁光克尔效应实验装置:包括线偏振光源、磁光克尔效应样品、检偏器、光电池等;2. 法拉第效应实验装置:包括线偏振光源、法拉第效应样品、检偏器、光电池等;3. 直流稳压电源、磁铁、光具座、光电池读数仪等。
四、实验步骤1. 磁光克尔效应实验:(1)将线偏振光源发出的光通过检偏器,得到线偏振光;(2)将线偏振光照射到磁光克尔效应样品上,调节磁铁的位置,使样品处于磁场中;(3)通过检偏器观察光电池的输出信号,记录克尔角;(4)改变磁场强度,重复上述步骤,得到一系列克尔角数据。
2. 法拉第效应实验:(1)将线偏振光源发出的光通过检偏器,得到线偏振光;(2)将线偏振光照射到法拉第效应样品上,调节磁铁的位置,使样品处于磁场中;(3)通过检偏器观察光电池的输出信号,记录法拉第角;(4)改变磁场强度,重复上述步骤,得到一系列法拉第角数据。
五、实验数据整理与归纳1. 对磁光克尔效应实验数据进行处理,得到克尔角与磁场强度的关系曲线;2. 对法拉第效应实验数据进行处理,得到法拉第角与磁场强度的关系曲线;3. 根据实验数据,分析磁光克尔效应和法拉第效应的规律。
六、实验结果与分析1. 磁光克尔效应实验结果表明,克尔角与磁场强度呈线性关系,符合磁光克尔效应的规律;2. 法拉第效应实验结果表明,法拉第角与磁场强度呈线性关系,符合法拉第效应的规律;3. 通过实验,验证了磁光效应在光学领域中的应用,如光学隔离器、光开关等。
表面磁光克尔效应实验

当两个偏振方向之间有一个小角度时,通过 偏振棱镜2的光线有一个本底光强。反射光偏振面 旋转方向同向时光强增大,反向时光强减小,这 样样品的磁化方向可以通过光强的变化来区分。
表面磁光克尔效应实验扫描图样
克尔信号分析
虽然表面磁光克尔效应的测量结果是克尔 旋转角或者克尔椭偏率,并非直接测量磁 性样品的磁化强度。但是在一阶近似的情 况下,克尔旋转角或者克尔椭偏率均和磁 性样品的磁化强度成正比。表面磁光克尔 效应实际上测量的是磁性样品的磁滞回线, 因此可以获得矫顽力、磁各向异性等方面 的信息。
磁性材料可分为顺磁质、抗磁质、铁磁质等, 磁性材料可分为顺磁质、抗磁质、铁磁质等,它们 的磁化机制各不相同在这里不作详细介绍。 的磁化机制各不相同在这里不作详细介绍。 磁性材料又可分为硬磁材料、软磁材料、 磁性材料又可分为硬磁材料、软磁材料、矩磁材料 等等,它们的磁滞回线是各有特点的 等等,它们的磁滞回线是各有特点的
B
B
B
O
H
H
O
H
硬磁材料 软磁材料 矩磁材料
磁化原理
(1)、一般材料的磁化原理 )、一般材料的磁化原理 B0
(a)无外磁场时
B/
(b)有外磁场时
(2)、铁磁质的磁化原理 )、铁磁质的磁化原理B0Fra bibliotek(a)无外磁场时
(b)有外磁场时
课后问题
如何判断是哪种克尔效应?
如何判断正负克尔效应?正负克尔效应的产 生与什么因素有关?
2.纵向克尔效应:磁化方向在样品膜面内, 并且平行于入射面。纵向克尔信号的强度 一般随光的入射角的减小而减小,在零入 射角时为零。
3.横向克尔效应:磁化方向在样品膜面内, 并且垂至于入射面。横向克尔效应中反射 光的偏振状态没有变化。
磁光克尔效应研究.
磁光克尔效应研究摘要:当光电子技术日益在新兴高科技领域获得广泛应用的同时,以磁光效应原理为背景的磁光器件显示了其独特的性能和广阔的应用前景,引起了人们的浓厚兴趣。
表面磁光克尔效应,作为测量材料磁光特性特别是薄膜材料的物性的一种有效方法,已被广泛应用于磁有序、磁各向异性、多层膜中的层间耦合以及磁性超薄膜的相变行为等问题的研究。
本文简单介绍了什么是磁光克尔效应、磁光克尔效应的发展、以及表面磁光克尔效应作为一种测量方法的原理、实验装置和发展。
关键词:磁光克尔效应;磁光特性;表面磁光克尔效应1.引言1845年,Michael Faraday发现当给玻璃样品加一磁场时,透射光的偏振面将发生旋转,首次发现磁光效应。
随后他在处于外加磁场中的金属表面做反射实验,但由于他所谓的表面不够平整,因而实验结果不能使人信服。
1877年John Kerr在观察偏振光从抛光过的电磁铁磁极反射出来时,发现了磁光克尔效应(magneto-optic Kerr effect)。
1985年Moog和Bade r两位学者对铁超薄膜磊晶成长在金单晶(100)面上的磁光克尔效应做了大量实验,成功得到一原子层厚度磁性物质的磁滞回线,并提出SMOKE作为表面磁光克尔效应(surface magneto-optic Kerr effect)的缩写,用以表示应用磁光克尔效应在表面磁学上的研究。
由于此方法磁性测量灵敏度达一原子层厚度,且此装置可配置于超高真空系统上面工作,所以成为表面磁学的重要研究方法。
2.磁光克尔效应图1 克尔效应示意图一束线偏振光从具有磁矩的介质表面反射时,反射光将是一束椭圆偏振光,而且偏振方向将发生产生旋转。
相对于入射的线偏振光(以椭圆的长轴为标志)的偏振面方向有一定的偏转,偏转的角度为克尔转角,短轴与长轴的比为椭偏率,如图1所示。
复磁光克尔角定义为:,其大小正比于样品的磁化强度。
表1给出了常见的磁性物质在室温下的磁光克尔转角的数值。
表面磁光科尔效应
表面磁光克尔效应(SMOKE)一、磁光效应简介1845年,Michael Faraday首先发现了磁光效应,即当外加磁场在玻璃样品上时,透射光的偏极面发生旋转的效应(法拉第效应);随后他在外加磁场之金属表面上做光反射的实验,但由于他所谓的表面并不够平整,因而实验结果不能使人信服。
1877年John Kerr在观察偏振光从拋光过的电磁铁磁极反射出来时,发现了磁光科尔效应(magneto-optic Kerr effect)。
1985年Moog和Bader 两位学者研究了生长在Au单晶(100)面上的Fe单晶超薄膜的磁光克尔效应测量实验,成功地得到一个原子层厚度磁性物质的磁滞曲线,并且提出了以SMOKE 来作为表面磁光克尔效应(surface magneto-optic Kerr effect)的缩写,用以表示磁光克尔效应在表面磁学上的研究。
这是SMOKE首次被用于研究在Au(0 0 1)表面外延生长的Fe超薄膜的磁学性质。
由于SMOKE所表现出的亚原子单层的磁性探测灵敏度和易于与超高真空系统结合的特点,使它在近些年已经发展成为一种重要的和常规的研究薄膜磁学性质的技术。
它被广泛应用于研究表面超薄膜的磁有序、磁性相变、磁各向异性,以及层间耦合等多种磁学现象。
同时SMOKE在商业上还被应用于商用高密度的磁光存储技术。
SMOKE的优点:和别的磁性测量手段相比,SMOKE具有四个优点:1) SMOKE的灵敏度极高。
国际上现在通用的SMOKE测量装置其探测灵敏度可以达到亚原子层的磁性,这一点使得SMOKE在磁性超薄膜的研究中有着重要地位。
2) SMOKE测量是一种无损伤测量。
探测用的“探针”是可见光束,因此不会对样品造成任何破坏,对于需要做多种测量的实验样品来说,这一点非常有利。
3) SMOKE 可以测量局域磁性。
由于SMOKE测量到的信息来源于被测介质上的光斑照射点,这意味着SMOKE可以对样品上最小的光斑尺寸范围作局域磁性测量。
MOKE磁光克尔实验报告
Magneto-Optical Kerr Effect and magnetic anisotropiesAravind Anjana and Zhou QingyuanPhysics Department,Freie Universit¨a t Berlin UniversityJune9,2021Contents1Abstract1 2Introduction2 3Geometry23.1Magnetic properties of ferromagnetic (2)4Hysteresis loop34.1Magnetic Anisotropy (3)4.2Magnetocrystalline Anisotropy (4)4.3Shape anisotropy (5)5Magnetic Domains5 6Contrast and Kerr rotation5 7Magnetic Field Calibration6 8Setup7 9Data analysis and Formula derivation79.1Calibration of Magneticfield (7)9.2Magnetic anisotropy (8)10Kerr angle910.1Kerr Microscopy (10)11Conclusion11 12In addition12 1AbstractIn this experiment,we use longitudinal Magnetic-Optical Kerr Effect(MOKE)to examine the magnetic properties of a thin Bcc Fe single-crystal,then we measure the hard and easy magnetization axis in thefilm plane to determine the shape and crystal anisotropy.At last,a polar Kerr microscope is used to analyze the domain pattern of a rare-earth iron garnetfilm and to study the response of the domains under external magneticfields.2IntroductionMOKE explains how the material’s surface can rotate the polarization of the light reflected from the material.This effect was observed by John Kerr in1887.Magneto-optical effects happen when the magnetization of the material affects the transmission of polarized light(Faraday Effect)or when the magnetization of the material affects the reflection of polarized light(Kerr Effect)[1].3GeometryKerr effects are classified based on the applied magneto-optic geometry The effects are dependent on the orientation of the magnetization concerning the incident and sample planes[34].•In the polar Kerr effect,the magnetization direction is perpendicular to the plane of thefilm and parallel to the plane of incidence.•In the longitudinal Kerr effect,the magnetization is in the plane and the scattering plane of the light.•In the transverse Kerr effect,there will be no change in the reflected light polarisation as no component of light is propagating along the direction of magnetization.Figure1:The three basic MOKE configurations[2]3.1Magnetic properties of ferromagneticEach electron has a magnetic dipole moment and within the electron shell orbital,the two electrons present have opposite spin dipole moment.Opposite direction dipole moments can conceal each other,which means the total dipole moment of afilled electron equal to zero.Therefore,some elements with partiallyfilled shells can be magnetic[13].Because of the Pauli exclusion principle,two electrons cannot occupied the same orbital.When the orbitals of the unpaired outer valence electrons from adjacent atoms overlap,the distributions of their electric charge in space are farther apart when the electrons have parallel spins than they have opposite spins[13].However,this effect cannot keep all spins align in a certain direction(because of thermalfluctuation,the motion of electron is random).In general,the energy is dependent on the direction of magnetization relative to the crystallographic lattice,which makes magnetic dipole moments to a particular direction.This phenomena is known as magnetic anisotropy(magnetic anisotropy is also from inverse magnetostriction and single-domain magnet)[14].Although as above described,in real magnetic distribution,only in a certain region the magnetic dipole moments point at a same direction.And these regions are called magnetic domains(also known as Weiss domains.fig.2)[15]. The magnetization will change under the appliedfield and also the magnetic domain.As the magneticfield increases, the magnetism will be align with the magneticfield in the end(fig.3).Figure2:Magnetic domain distribution description,right side is H=0and left side is at saturation point[16]Figure3:Magnetization vs.Applied magneticfield.The circle implied magnetic domain changing:start with the zero magnetization,to the end aligned with magneticfield[17].4Hysteresis loopHysteresis loop depicts the relation between the induced magneticflux density(B)and magnetizing force(H) which can show magnetic properties of materials and resembles one cycle of magnetization.The properties of a good permanent magnet are defined in terms of the remanence and coercivity of the magnet materials[31].The magnetism within a material is preserved even after the magnetismfield disappears.This capability of the material is called Remanence.The measurement of the reverse magnetizingfield applied for which the residual magnetism of the material vanishes is called its Coercivity.The magnetizing force is implemented to the sample(first time)which will increaseflux density B along the dashed line till a point where it cannot be increased anymore called the saturation(b).Then the magnetization force is reduced to zero but there is however someflux left in the sample which is called remanence(c).Then the magnetization force applies in the reverse direction to make residual magnetism to zero(d)fig.4.As the magnetization force now increases in the reverse direction,the sample becomes saturated again in the opposite direction(e).If B is reduced and then increased with the direction reversed,the H draws the path in the other direction forming a closed loop.4.1Magnetic AnisotropyMagnetic Anisotropy is how the magnetic properties are influenced by the direction of an appliedfield concerning crystal lattice.It strongly affects the shape of the B-H curve which controls coercivity and remanence.To reach the saturation point,higher or lower magneticfields are needed which is based on the orientation of thefield concerning the crystal lattice.[20].Magnetic Anisotropy has significant functional value as it is utilized in the design of most magnetic materials for commercial plans.For most of the magnetically anisotropic materials,there exist two directions to magnetize the material called Easy axis and Hard axis(fig.5).•Easy axis is the direction within a crystal by which a small magneticfield applied can reach the saturation magnetization.Figure4:Hysteresis loop depicts the relationship between induced magnetic density B and magnetizing force H[3].Figure5:Co20F e20,the schematic picture to show the hard axis and easy axis.•Hard axis is the direction within a crystal by which a large magneticfield is needed to reach saturation magnetization.There are various types of magnetic anisotropy but for our experiment we only focus on crystalline anisotropy and shape anisotropy.4.2Magnetocrystalline AnisotropyCrystalline anisotropy is a ferromagnetic property that depends on grain size and shape.The most obvious method to observe it is by measuring magnetization curves along with different crystal directions.Based on the orientation of the sample in the magneticfield,the magnetization approaches saturation in different magneticfields by which easy axis and hard axis can be observed.Crystalline anisotropy energy can be interpreted by thefirst series expansion of the angle between magnetization direction and the sample axes.In short it is the series of expansion of direction cosines of M s,relative to the crystal axes x=[100],y=[010],and z=[001][10].For cubic systems the expression for this energy is as follows[12]:E cryst=K0+K1(α21α22+α21α23+α22α23)+K2α21α22α23+ (1)K is the crystalline anisotropy constants,We set the z as our rotation axis,soα3=0,then the equation becomesM=K0+K1sin2(φ)cos2(φ).(2) Where E cryst is crystalline anisotropy energy per volume,(φ)is the angle between applied magnetization and crystal axis in cubic structure.Therefore,the Crystalline anisotropy energy is the energy needed to deflect themagnetic moment in a single crystal from the easy to hard direction.4.3Shape anisotropyShape anisotropy is due to the shape of the magnetic sample.This anisotropy is due to the dipole-dipole interactions that occur in ferromagnets.It is defined as the magnetic strayfield energy per volume as a function of the magnetization direction.The charges or poles are generated on the surface of the sample which creates an isolated magneticfield called the demagnetizingfield.It is called the demagnetizingfield because it acts in opposition to the magnetization that produces it.[19]For uniformly magnetized magnetic ellipsoids bodies,the shape anisotropy can be quantificationally described by the demagnetization tensor N which depends only on the shape.[33]Thenwe get[20]E shape=(µ02)H D M S=(µ02)NM2S(3)Where E shape is shape anisotropy energy which can be shown as a function of demagnetization factor(N)and saturation magnetization(M S).The demagnetization factor(N)depends on the magnetization direction.H D=N M S is the demagnetizationfield,which superposes the external magneticfield in an antiparallel orientation.5Magnetic DomainsThe magnetic domain is a region within a magnetic material in which the magnetization is in a uniform direction. This indicates that the specific magnetic moments of the atoms are aligned with one another and they point in the same direction.When it is cooled below a certain temperature called Curie temperature the magnetization of ferromagnetic material immediately splits into several small regions called magnetic domains.The magnetization within each domain points in a uniform direction,but the magnetization of various domains may point in different directions.[23]These domains need to be divided by domain walls where the magnetization orientates coherently from a direction in one domain to that in the next domain Fig2.Generally,it experiences an angular displacement of90°or180°.A domain wall is a progressive reorientation of different moments across afinite distance(N´e el and Bloch walls).[22]The domains of the sample arefilmed by the Kerr Microscopy,so with the help of an external magneticfield the domain orientation and the wall separations width can be changed6Contrast and Kerr rotationLight is a transverse electromagnetic wave that can be molded optically into the plane,circularly or elliptically polarised ually,the plane of polarisation is the plane that includes the electricfield E and the direction of propagation.When the electricfield is polarised in the plane of incidence it is known as p-polarised light.On the other hand when the electricfield is polarised perpendicular to the plane of incidence then it is known as s-polarised light.[27]When plane-polarized light is reflected from a metallic surface,it is said to be elliptically polarised.If the incident light is p or s polarised then the light reflected can still be plane polarised.this is due to the reflecting surface being the plane of symmetry for the system.[26].When p-polarised light is reflected from a magnetic surface the reflected light not only as a p-component but also a small s component.This second electric field component is out of phase with the reflected p-component.Therefore the reflected light becomes elliptically polarised with its axis rotated from the incident polarization plane.This is also the case with s-polarised light (Fig refpolarised).These two effects are said to be Kerr ellipticity and Kerr rotation.[28]The MOKE can be characterized based on its rotation and ellipticity properties.Linearly-polarized light can be decomposed into left and right circularly-polarized components.Each of these components has the same phase velocity and amplitude. When linearly-polarized light interacts with magnetized materials,the polarization state of the light will change in two ways.Thefirst way involves the rotation of the polarization axis,and the second is a change from linearly-polarized to elliptically-polarized light that is characterized by the ellipticity.[32]The changes in polarization are transformed by the analyzer into the light intensity change.The KerrθK cannot be estimated directly.Instead,we measure the contrast c,which is the measure for the signal to noise ratio.The contrast is defined asc(α)=I+−I−I0=2.I+−I−I++I−(4)where I+and I−are the saturation signals at both magneticfield directions and I0is the average intensity.We cannot measure the angle directly,so we use the Malus law that defines as a completely plane-polarized light is incident on the analyzer,the intensity I of the light transmitted by the analyzer is directly proportional to theFigure6:Illustration of p-polarised and s-polarised light.square of the cosine of the angle between the transmission axes of the analyzer and the polarizer.Malus law gives an expression of the contrast in terms of the analyzer positionαand the Kerr rotationθI=I0.cos2θ(5) whereθis the angle between polarizer polarization of the incoming light.This angle can be given asθ=αβwhereαrefers to the angle between an arbitrary axis and the polarizer andβto the same arbitrary axis and the polarization of the incoming light.In our experiment we measured close to the extinction angle,therefore theMalus law can be rewritten as:I±=I0.cos2(α±β−π2)=I0.sin2(α±β)(6)For small angles I±will be approximately equal to I0.(α±β)2.Therefore contrast equation is re-written asc(α)=4αβα2+β2(7)7Magnetic Field CalibrationFor determining the magneticfield,we use Ampere’s lawB·d l=µI.(8)Where,B-magneticfield,l-length in the loop,µ-permeability for material.For solenoid,our loop should be likefigure.[7],The equation is split into two partFigure7:Magneticfield calculation in coilsuch that,B iron·l iron/µiron+B air·l air/µair=NI(9)where N is the number of coils,l is the length of air or solenoid.Here the relative permeability isµiron/µ0=5000,µair/µ0≈1.The length of solenoid is less than0.3meter,thefirst term of LHS is ignored.Then our equationbecomes:B=µ0NIl.(10)µ0≈4π10−7H/m is permeability,N is number of coil windings,l is the length of slit.8SetupThe main components of the Setup areLight Source He Ne Laser(output:0.5mW)Sample FeAnalyzer Polarization FilterRecorder PhotodiodeSignal amplifier A/D converterMagnetic Camp Field Generator Iron RingKerr microscope CCD cameraExternal magnticfield Generation electromagnetTable1:ComponentsIn our experiment,a linearly polarized He-Ne laser is used as light source.The laser beam is reflected from the Fefilm and then passes a polarizationfilter.The intensity of the light is recorded with a photodiode.the Kerr rotation of the Fefilm is small,a direct measurement that is impossible through the analyzer’s single positioning. Kerr rotation is measured by rotating the analyzer and using the intensity contrast depending on the analyzer angle.The photodiode signal is amplified and reported on a computer with an A/D converter.The sample isfixed in a ring shaped iron core,which is covered by a coil.The magneticfield is proportional to the computer-controlled current of the coil and can be calibrated using a Hall-probe.The sample is rotatable and is magnetized along the [100]or the[110]direction of the bcc Fefilm.For visualization of the domains,a Kerr microscope is used.The Kerr microscope is implemented for polar MOKE geometry using a CCD camera.An electromagnet is used for the production of the external magneticfield.Figure8:Experimental setup[21]9Data analysis and Formula derivation9.1Calibration of MagneticfieldThe MOKE experiment is observed when the external magneticfield is applied to the ferromagnetic material and it changes the magnetization.The external magneticfield is induced by the coils by applied voltage.The number of coils is300,slit length is12mm,from the eq.10,for our theoretical approximation:the dependence of magnetic field on the current is B=µ0∗300∗4∗103/12≈31.4mT/A I.The data is collected by the Hall probe,which can measure the magneticfield of the slit(fig.8.The computer will record magneticfield amplitude with changing the coil current.In this part,we missed to record the data,so we will use the theoretical assumption and add a randomfluctuation in range of1mT(fig.9).Figure9:Simulation of relation between magneticfield and current.Blue dots are the data points and red line is fitting resultAnd thefitting result is:B=(31.6±0.4)mT/AI+(0.5+0.0)mT(11)9.2Magnetic anisotropyThe hysteresis loops is the relationship between the sample Fefilm magnetization and the applied magneticfield which are recorded in under different angles in order tofind the easy axis and hard axis(fig.12),however from them we barely could distinguish the hard and easy axis.In general,a ferromagnetic material hysteresis loop should be like above(fig.5).From eq.2,φ[110]of hard axis(bcc Fe)is45◦to easy axis.So the energy difference is∆E=E[110]−E[100]=K0+K1sin2(π4)cos2(π4)−K0=K14.(12)We can get the energy difference via the difference of hysteresis loop integration.neglect thefluctuation on both side.Here need to mention that the saturation magnetization is2.1T/µ,we rescale the20◦and55◦hysteresis loop(we should select65◦,but60,65,70are not acceptable).[1](figure.[10]).The difference between integral ofFigure10:Hysteresis loop for hard and easy axisThe noise is too large,our rescaled data is made by manual adjustment.easy hysteresis loop and hard axis hysteresis loop,multiplyingµis the energy difference,which is just14offirstorder anisotropy constant.The integral we use python to calculate,and ignore the noise on both side,and makean approximation in the bottom of the hysteresis loop.Noticed the unit isT·m2=J/A,µ=1.245∗10−6N/A2,J=N·m,We can get the energy difference∆E=(9.09±0.11)∗103J/m3.Then K1is equal to(3.636±0.044)∗104J/m3. And a reference number of this is4.4∗104J/m3[25],the percentage error to reference value is17.3%.10Kerr angleData is useless to analyse the Kerr angle,so here we only show how to analyse the angle and give an expectation. From eq.4,first we need tofind the saturation magnetization,corresponding to the I+and I−,and in our expectation, the hysteresis loop should be likefig.11.Hence the both signal like linearly dependent,we can use the interceptFigure11:Contrast calculationfirst step:find saturation signals.We use the15◦to simulate the calculation. from thefitting result to get the contrast,which in our case equal to0.0465.We should record data of angles between±5◦to the extinction angle(s-polarized).Depend on this,we simulated the signal to analyse and give an expectation.From[9][10],it shows the Kerr rotation angle almost equal to zero of longitude direction,and also in the literature[21]givesθk 1.By using a proper value4.64∗10−4◦[30],since it is so small(compare to1◦),theeq.7can be further approximated to:c(α)≈4αβα2=4βα(13)Which just became a linear dependence,then we can compare these two approximation.By eq.4and eq.6,we add afluctuation to simulate.(a)Linearfitting(b)Eq.7fittingFigure12:Comparison of differentfitting function of Kerr rotation angleKerr angle(deg)Error(deg)percentage errorLinearfitting0.01250.0068250%Eq.8fitting0.03510.0088719%Table2:Fitting comparsionThefitting result shows in table.[2].We cannot tell which is better.Even we adjust the amplitude offluctuation, the result for error does not change much(linearfitting seems better but with a huge error).In the end,we show that how the result change if we increase the noise in table.3.10.1Kerr MicroscopyKerr microscopy is based on Kerr effect.The polarization of reflection light can be recorded,which can be used to observe the domain changing.First we observe Pt/Co/Pt domain structure,with the magneticfield increased,we can see the bubble region generation(figure.[13]),in the picture,we can see area increased.The grayscale responseFigure13:Under different currentThe shape is like bubble.to the intensity of magnetization.The we can do the integration to the image to get hysteresis loop(figure.[14]). From this hysteresis loop,we can derive that this is a Hard-Ferromagnetic material,the saturation nearly does notFigure14:The integral to the image under different currentchange when varying the magneticfield.Therefore it is suitable for permanent magnets and magnetic recording and memory devices[31].Then we observed the Yttrium iron garnet,which we can see the domain wall clearly(fig.[15]).This shape is like maze.We can see the domain wall.For clarify,the bright area is parallel domain,and the darker area is anti-parallel domain.and this is also a anisotropy reflection.[23].When we reverse the magnetic current from-1to 1A,the pattern just shows reverse transition,from dark to bright for the grayscale(compare to thefirst sample),Figure15:YIG sample under different magneticfieldthe distribution of domain remains.Same procedure for Yttrium iron garnet to get hysteresis loop(figure.[16]).This shape is much different with Pt/Co/Pt,normally defined as soft-ferromagnetic.This is what we use to buildFigure16:YIG hysteresis loopFrom this loop,the domain area is not big,to some degree,the behaviour like linear.transformer and motor cores to minimize the energy dissipation withflippingfields.And also we canfind that thesaturation magnetization is much larger.What we are interested in is the width of these stripes under the remanence.The idea is to measure the widthof this winding region,is the mean of random inscribed circle17.For one pixel is equal to6.9µm,so our parallel domain width is80.6±6.9µm.For anti-parallel direction,it is95.8±6.9µm.11ConclusionIn this experiment,wefirst use the hall probe to calibrate the magneticfield,and get the dependence on current,we simulate the signal and afterfitting it equals to31.6±0.4mT/A*I.For calculating the anisotropy constant.This value can be derived by the energy difference,and K1=36.36±0.44J/m3(fig.10).the reference value is4.4∗104J/m3[25].Kerr rotation angle is measured by contrast from Malus law,which is eqaul to0.0125±0.0068◦or0.0351±0.0088◦for differentfitting respectively(fig.[12]),and reference value is4.64∗10−4◦[30].For the Kerr microscopic,we measure two sample,one is Pt/Co/Pt(fig.13),which domain region like bubble,another is YIG(fig.15),which domain region like maze.When we change the magnetic to reversed direction,there issymmetric property for both samples.The hysteresis loop for each other is quite different,one for hard-ferromagneticmaterial(fig.14),another is soft-ferromagnetic material(fig.16).In the end,we measure the width of domain wall in remanence,it is80.6±6.9µm for parallel domain thickness and95.8±6.9µm for anti-parallel domain thickness. 12In additionApart from the calculation,we will briefly introduce our idea how to measure the thickness,and give the data collected and some simulation result details as supplies material.There is also the fail reason analysis.About domain thickness calculation,wefirst want to get the average value for the whole area.Athough openCV support to change grayscale,it cannot distinguish them.Our initial idea,is set bright area as0,dark area as1; then randomly select position to draw the circle,and increase the radius,is when reach the boundary equal to1 and crossing centering point,we record this value.And else condition just change the center position.In the future, with deep learning development,the program can mark which area is parallel magnetic domain area.It will be easy to calculate the average thickness.The data we got is like lost the signal(fig.18).So we do much of simulation toFigure17:Change grayscale and use inscribed circle to calculate the average length.our data.And about the simulation detail,first about calibration of magneticfield,we use theoretical value0.0314(a)0-45(b)50-85(c)90-130Figure18:Comparison of rotation angleas slope,and add a0.001fluctuation as noise.And for Kerr rotation angle simulation we input the exact eq.4and eq.6with a noise around0.01,and also we set the noise equal in the range of0.001.Andfitting result is table.3. The reason for that is when the angle close to zero,the contrast will change largely,but the angle which we cannot Noise0.010.0010.00001linearfitting Kerr angle0.01250.009940.00965eqfitting Kerr angle0.03500.02740.0266Table3:Noise and Kerr angle relation,the simulation Kerr angle we use0.000464,this is far away from bothfitting measure.As for failure analysis,some signals areflat and with small area likefig.19The photo diode needs to be adjust every time to keep align,and also we need to assume what we will get in the experiment.Therefore,it is indeed a lesson to examine the data each time.(a)No signal or the sensitivity too low(b)Photo diode saturatedFigure19:Failure of dataReferences[1]Magneto-optical Kerr effect in spin split two-dimensional massive Dirac materials G Catarina,N M R Peresand J Fern´a ndez-Rossier[2]Direct imaging of the magnetization reversal in microwires using all-MOKE microscopy A.Stupakiewicz,MTekielak[3]https:///[4]P.N.Argyres,Phys.Rev.97,334(1955).[5]D.Srikala,V.N.Singh,A.Banerjee Effect of induced shape anisotropy on magnetic properties of ferromagneticcobalt nanocubes and B.R.Mehta2[6]E.Kneller,Ferromagnetismus(Springer,Berlin,1962),Chs.7,8,13,19.[7]A.Hubert und R.Sch¨a fer,Magnetic Domains(Springer,Berlin,1998),Chs.3.7.3,5.6.1.[8]A.K.Zvezdin und V.A.Kotov,Modern Magnetooptics and Magnetooptical Materials(Institute of PhysicsPublishing,Bristol,1997),Chs.7.1-3,9.3.[9]S.D.Bader,SMOKE,J.Magn.Magn.Mater.100,440(1991).[10]J.Zak,E.R.Moog,C.Liu,und S.D.Bader,Phys.Rev.B43,6423(1991).[11]M.E.Brubaker,E.R.Moog,C.H.Sowers,J.Zak,and S.D.Bader,J.Magn.Mater.103,L7(1992).TransverseKerr magnetometry for the study of thinfilms presenting perpendicular and in-plane anisotropy[12]Donna Sue Chuang,MIT,(1994)Magnetic anisotropy in ultrathin epitaxialfilms grown on surfaces vicinal toCu(001).[13]/wiki/FerromagnetismOrigin of magnetism[14]Aharoni,Amikam(1996).Introduction to the Theory of Ferromagnetism Clarendon Press.ISBN0-19-851791-2[15]Feynman,Richard P.;Robert B.Leighton;Matthew Sands(1963).The Feynman Lectures on Physics,Vol1.Pasadena:California Inst.of Techology.pp.37.5-37.6ISBN0465024939[16]Ashima A.Optical and electricfield control of magnetism Helmholtz-Zentrum Berlin,2018.01.ResearchGate.[17]Ahmad A.Structural and Magnetic properties of Vannadium Doped M-Type Barium Heexaferrite[18]Katsuaki Suganuma Wide Bandgap Power Semiconductor Packaging:Materials,Components,and Reliability[19]https:///irm/3-magnetic-anisotropy[20]https:///courses/materials-science-and-engineering,Lecture25Hysteresis in Ferromagnetic Mate-rials[21]FU physics department MOKE protocol for advanced lab course[22]https:///Physics/Magnetism/ferromagmaterials.xhtml[23]https:///wiki/Magneticdomain[24]Subhankar,B.Niru,C.Wolfgang,K.Effect of Inter-Partical interactions in Magnetic Nano particle Ensembles,Sensor Letters11(11):1,2013.09.DOI:10.116/sl.2013.3059.[25]Jun,Y.Qiong,W.Hao-liang,L.Xiang-Qun Z.Determination of magnetic anisotropy constants in Fe ultra-thinfilm on vicinal Si(111)by anisotropic magnetoresistance Nature.scientific reports(2148).2013.06.[26]”Hecht Optics-2nd edition”,E.Hecht,A.Zajac,p95(1989).[27]”Electromagneticfields and waves”,P.Lorrain,D.Corson(1970),2nd Edition,pp462.[28]Growth and study of magnetostrictive FeSiBC thinfilms,for device applications,Mannan Ali(1999)[29]T.Yonemoto.T.Miyagawa,Magneto-Optical Kerr Rotation Spectra for Fe and TbFe Films on(Cu/SiO2)Multilayered Films,1992,doi:10.1109/TJMJ.1992.4565350[30]https:///a//mxp/student-projects/2017spring/s17kerreffectResults[31]http://hydrogen.physik.uni-wuppertal.de/hyperphysics/hyperphysics/hbase/solids/hyst.html[32]Shingo Yamamoto and Iwao Matsuda,Measurement of the Resonant Magneto-Optical Kerr Effect Using a FreeElectron Laser[33]Xiaolong Fan,Hengan Zhou,Jinwei Rao,Xiaobing Zhao,Jing Zhao,Fengzhen Zhang Desheng Xue Magneticfield-dependent shape anisotropy in small patternedfilms studied using rotating magnetoresistance[34]https://de.zxc.wiki/wiki/Magnetooptischer Kerr-Effekt。
克尔效应实验报告

近代物理实验报告实验题目:表面磁光克尔效应班级:学号:学生姓名:实验教师:表面磁光克尔效应实验报告一、实验目的(1)了解表面磁光克尔效应的原理和实验方法;(2)掌握表面磁光克尔效应谱的测量和应用。
二、实验装置(1)光学减震台;(2)光路系统,包括入射光路与接收光路;(3)励磁电源主机和可程控电磁铁;(4)前级放大器和直流电源组合器(a.为激光器提供精密稳压电源;b.将光电检测装置接收到的克尔信号作前级放大,并送入系统控制装置中的信号检测装置中;c.将霍尔传感器探测到的信号送入检测装置);(5)信号检测主机;(6)控制系统和计算机。
三、实验原理磁光效应有两种:法拉第效应和克尔效应,1845 年,Michael Faraday 首先发现介质的磁化状态会影响透射光的偏振状态,这就是法拉第效应。
1877 年,John Kerr 发现铁磁体对反射光的偏振状态也会产生影响,这就是克尔效应。
克尔效应在表面磁学中的应用,即为表面磁光克尔效应(surface magneto-optic Kerr effect)。
它是指铁磁性样品(如铁、钴、镍及其合金)的磁化状态对于从其表面反射的光的偏振状态的影响。
当入射光为线偏振光时,样品的磁性会引起反射光偏振面的旋转和椭偏率的变化。
表面磁光克尔效应作为一种探测薄膜磁性的技术始于1985 年。
图1 表面磁光克尔效应原理如图 1 所示,当一束线偏振光入射到样品表面上时,如果样品是各向异性的,那么反射光的偏振方向会发生偏转。
如果此时样品还处于铁磁状态,那么由于铁磁性,还会导致反射光的偏振面相对于入射光的偏振面额外再转过了一个小的角度,这个小角度称为克尔旋转角θk。
同时,一般而言,由于样品对p光和s 光的吸收率是不一样的,即使样品处于非磁状态,反射光的椭偏率也发生变化,而铁磁性会导致椭偏率有一个附加的变化,这个变化称为克尔椭偏率εk由于克尔旋转角θk和克尔椭偏率εk都是磁化。
强度M的函数。
表面磁光克尔效应实验Ver2.0
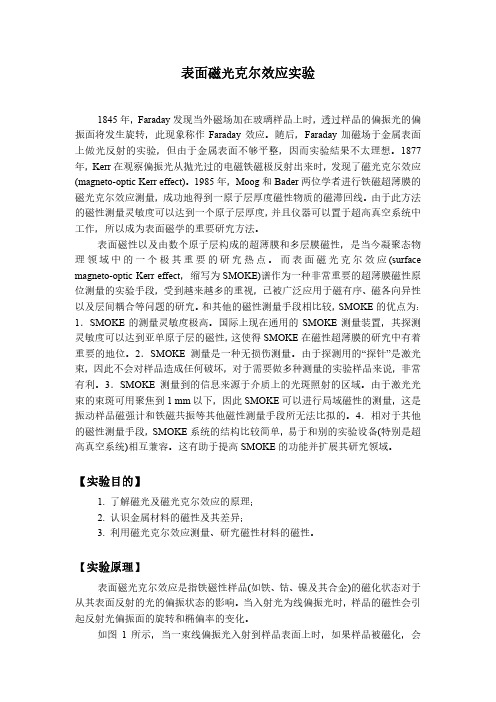
2 2
(4) 整理得到:
I E p ( 2 2 k )
2
(5) 无外加磁场时:
I0 E p 2
2
(6) 所以有:
I I 0 (1 2 k / )
(7) 于是在饱和状态下的克尔旋转角 k 为:
k
I ( M S ) I ( M S )
样品
k
起偏器
检偏器
图1
表面磁光克尔效应原理
根据磁场相对于入射面的相对方位不同,磁光克尔效应可以分为极向克尔 效应、纵向克尔效应和横向克尔效应三种类型。如图 2 所示,当磁化方向垂至于 样品表面时,此时的克尔效应称作极向克尔效应。通常情况下,极向克尔信号的 强度随光的入射角的减小而增大,在零度入射角(垂直入射)时,克尔信号的强度 最大。如图 3 所示,当磁化方向在样品膜面内,并且平行于入射面时,此时的克 尔效应称作纵向克尔效应。纵向克尔信号的强度一般随光的入射角的减小而减 小,在零度入射角时,克尔信号的强度为零。通常情况下,纵向克尔信号中,无 论是克尔旋转角还是克尔椭偏率都要比极向克尔信号小一个数量级。 因此纵向克 尔效应的探测远比极向克尔效应困难。但对于很多薄膜样品,易磁轴往往平行于 样品表面,因而只有在纵向克尔效应配置下样品的磁化强度才容易达到饱和,故 纵向克尔效应对于薄膜样品的磁性研究来说十分重要。如图 4 所示,当磁化方向 在样品膜面内,并且垂至于入射面时,此时的克尔效应称作横向克尔效应。横向 克尔效应中,反射光的偏振状态不发生变化,仅在 p 偏振光(偏振方向平行于入 射面)入射时,反射率有很小的变化。
4 I0
I
4 I0
(8)
I ( M S ) 和 I ( M S ) 分别是正负饱和状态下的光强。从式(8)可以看出,光强
表面磁光效应
五.数据处理与分析
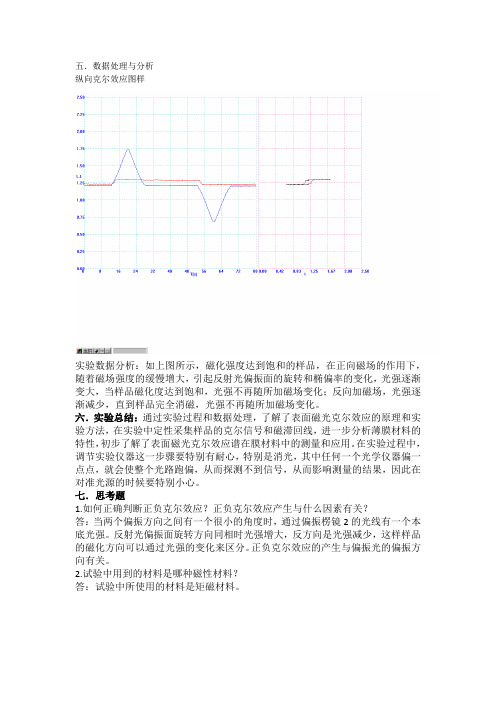
纵向克尔效应图样
实验数据分析:如上图所示,磁化强度达到饱和的样品,在正向磁场的作用下,随着磁场强度的缓慢增大,引起反射光偏振面的旋转和椭偏率的变化,光强逐渐变大,当样品磁化度达到饱和,光强不再随所加磁场变化;反向加磁场,光强逐渐减少,直到样品完全消磁,光强不再随所加磁场变化。
六.实验总结:通过实验过程和数据处理,了解了表面磁光克尔效应的原理和实验方法,在实验中定性采集样品的克尔信号和磁滞回线,进一步分析薄膜材料的特性,初步了解了表面磁光克尔效应谱在膜材料中的测量和应用。
在实验过程中,调节实验仪器这一步骤要特别有耐心,特别是消光,其中任何一个光学仪器偏一点点,就会使整个光路跑偏,从而探测不到信号,从而影响测量的结果,因此在对准光源的时候要特别小心。
七.思考题
1.如何正确判断正负克尔效应?正负克尔效应产生与什么因素有关?
答:当两个偏振方向之间有一个很小的角度时,通过偏振楞镜2的光线有一个本底光强。
反射光偏振面旋转方向同相时光强增大,反方向是光强减少,这样样品的磁化方向可以通过光强的变化来区分。
正负克尔效应的产生与偏振光的偏振方向有关。
2.试验中用到的材料是哪种磁性材料?
答:试验中所使用的材料是矩磁材料。
克尔效应——精选推荐

表面磁光克尔效应实验1877年John Kerr在观测偏振光通过抛光过的电磁铁磁极反射时,发现了偏振面旋转的现象,此现象称磁光克尔效应.1985年Moog和Bader进行铁磁超薄膜的磁光克尔效应测量,首次成功地测得了1个原子层磁性薄膜的磁滞回线,并提议将该技术称为SMOKE ( surface magneto 2optic Kerr effect)从此这种探测薄膜磁性的先进技术开始在科研中得到大量的应用.材料表面磁性以及由数个原子层所构成的超薄膜和多层不同材料膜磁性,是当今凝聚态物理领域中的较为重要的研究热点. SMOKE的磁性解析灵敏度达到1个原子层厚度,并可配置于超高真空系统中进行超薄膜磁性的原位测量,从而成为表面磁学的重要研究方法,已被广泛应用于纳米磁性材料、磁光器件、巨磁阻、磁传感器元件等磁参量测量. 现这一重要的前沿性技术已成为高校近代物理实验中的重要研究性实验.实验原理当线偏振光入射到不透明样品表面时,如果样品是各向异性的,反射光将变成椭圆偏振光且偏振方向会发生偏转.而如果此时样品为铁磁状态,还会导致反射光偏振面相对于入射光的偏振面额外再转过一小角度,这个小角度称为克尔旋转角θK ,即椭圆长轴和参考轴间的夹角, 如图1所示. 同时,一般而言, 由于样品对p偏振光和s偏振光的吸收率不同, 图1 表面磁光克尔效应原理图即使样品处于非磁状态,反射光的椭偏率也要发生变化,而铁磁性会导致椭偏率有一附加的变化,这个变化称为克尔椭偏率εK ,即椭圆长短轴之比.按照磁场相对入射面的配置状态不同, 表面磁光克尔效应可以分为3种:a. 极向克尔效应,其磁化方向垂直于样品表面并且平行于入射面;b. 纵向克尔效应, 其磁化方向在样品膜面内,并且平行于入射面;c. 横向克尔效应,其磁化方向在样品膜面内,并且垂直于入射面.对于磁性薄膜,通常纵向克尔效应较明显.待测物的极向、纵向、横向克尔旋转角的强弱由其磁易向轴的方向决定.以下以极向克尔效应为例详细讨论SMO KE系统,原则上完全适用于纵向克尔效应和横向克尔效应. 激光器发射的激光束通过起偏棱镜后变为线偏振光,然后从样品表面反射,经过检偏棱镜进入探测器. 检偏棱镜的偏振方向要与起偏棱镜设置成偏离消光位置很 ( 如图2 所示) ,这主要是为了区分正负克尔旋转角. 若检偏棱镜方向设置小的角度在消光位置,无论反射光偏振面是顺时针还是逆时针旋转, 反映在光强的变化上都是强度增大. 这样就无法区分偏振面的正负旋转方向, 也就无法判断样品的磁化方向. 当2个偏振方向之间有小角度δ时,通过检偏棱镜的光线有本底光强0I .反射光偏振面旋转方向和δ同向时光强增大,反向时光强减小,这样样品的磁化方向可以通过光强的变化来区分.图2 偏振器件配置方位样品放置在磁场中, 当外加磁场改变样品磁化强度时, 反射光的偏振状态发生改变. 通过检偏棱镜的光强也发生变化. 在一阶近似下光强的变化和被测材料磁感应强度呈线性关系, 探测器探测到光强的变化就可以推测出样品的磁化状态和磁性参量.在图1 的光路中,假设取入射光为P 偏振光,其电场矢量P E 平行于入射面,当光线从磁化了的样品表面反射时,由于克尔效应反射光中含有很小的垂直于P E 的电场分量S E ,如图2 所示,通常P S E E <<. 在一阶近似下有:K K PS i E E εθ+= (1) 通过检偏棱镜的光强为:2|cos sin |δδS P E E I += (2) 将(1) 式代入(2) 式得到:22|cos )(sin |||δεθδK K P i E I ++= (3)通常δ较小,可取,1cos ,sin ≈≈δδδ得到:22|)(||K K P i E I εθδ++= (4)一般情况下,δ虽然很小,但K θδ<<,而K θ和K ε在同一数量级上,略去二阶项后,考虑到探测器测到的是(4) 式实数部分, (4) 式变为:)2(||22K P E I δθδ+= (5) 无外加磁场下:220||δP E I = (6)所以有:⎪⎭⎫ ⎝⎛+=δθKI I 210 (7) 由(7) 式得在样品达磁饱和状态下K θ为:002I I I K -=δθ (8) 实际测量时最好测量磁滞回线中正向饱和时的克尔旋转角+K θ和反向饱和时的克尔旋转角-K θ ,则004)()(4)(01I I I B I B I S S K K K ∆=--+=-=-+δδθθθ (9) (9) 式中, )(S B I +和)(S B I -分别是正负磁饱和状态下的光强. 从式(9)可以看出, 光强的变化ΔI 只与K θ有关,而与K ε无关. 说明在图1 光路中探测到的克尔信号只是克尔旋转角.当要测量克尔椭偏率εK 时,在检偏器前另加1/ 4 波片,它可以产生π/ 2 的相位差,此时检偏器看到的是K K K K i i i εεεθ+-=+)(,而不是K K i εθ+,因此测量到的信号为克尔椭偏率.经过推导可得在磁饱和情况下K ε为004)()(4)(21I I I B I B I S S K K K ∆-=+--=-=+-δδεεε (10)式中+K ε表示正向饱和磁场时测得的椭偏率, -K ε表示负向饱和磁场时测得的椭偏率.【实验装置】自制的表面磁光克尔效应实验系统(图3) 由以下几部分组成:1) 光学减震平台.2) 光路系统,包括输入光路与接收光路. 其起偏和检偏棱镜使用格兰2汤普逊棱镜,光电检测装置由孔状可调光阑、干涉滤色片和硅光电池组成.3) 励磁电源主机和可程控电磁铁. 励磁电源主机可选择磁场自动和手动扫描.4) 前置放大器和直流电源组合装置.a. 将光电检测装置接收到的克尔信号做前置放大,并送入信号检测主机中.b. 将霍尔传感器探测到的磁场强度信号做前置放大并送入检测装置.图3 SMOKE 系统简图c. 为激光器提供精密稳压电源.5) 信号检测主机. 将前置放大器传来的克尔信号及磁场强度信号做二级放大,分别经A/ D 转换后送计算机处理,同时数字电压表显示克尔信号及磁场强度信号. D/ A 提供周期为20 s ,40 s ,80 s 准三角波,作为励磁电流自动扫描信号.6) 控制系统与计算机. 由Visual C ++编写的控制程序通过计算机实现自动控制和测量.根据设置的参量,计算机经D/A 卡控制磁场电源和继电器进行磁场扫描.从样品表面反射的光信号以及霍尔传感器探测到的磁场强度信号分别由A/D 卡采集经运算后作图显示,在屏幕上直接呈现磁滞回线的扫描过程.实验可选用铁磁性金属材料如Fe ,Co,Ni 及坡莫合金等薄膜样品.4 实验内容及实验方法要描绘磁滞回线,需要采集2 组数据. 一组是反映加在样品上磁场强度H 的大小,另一组数据为样品在不同磁场下的磁感应强度B. 本仪器用霍尔传感器探测电磁铁两磁极之间的磁感应强度,以反射光强I 的变化来代表克尔旋转角或克尔椭偏率的变化. 对一般的铁磁性材料,克尔旋转角K θ和椭偏率K ε又正比于材料被磁化时的磁感应强度B ,所以可以通过测量光强的变化,得到磁感应强度B 的相对值. 虽然实验测得的是I ——H 关系曲线,但曲线形状与B ——H 曲线是一致的, 只须用已知B ——H 曲线样品对坐标轴标定,就可以准确得到B ——H 曲线.实验内容如下:1) 磁场强度的校准. 测得的磁场强度必须是样品待测点的磁场强度值,但霍尔传感器的探头并不可能准确放在该位置,因而必须进行校准.校准的方法是将样品移开,把CT5A 特斯拉计的探头放在样品待测点,并与本仪器霍尔传感器在各种励磁电流时读数值进行对比,从而校准磁场强度H 值.2) 格兰——汤普逊棱镜上螺旋测微装置的定标. 起偏棱镜和检偏棱镜同为格兰——汤普逊棱镜,机械调节结构由角度粗调和螺旋测角组成,将测微头的线位移转变为棱镜转动的角位移. 测微头分度值为0.01mm ,转盘分度值为1°,具体测量的精度须通过测微头线位移的角位移定标才能得到.3) 确定格兰2汤普逊棱镜的垂直轴方向和1/4波片的轴向方向. 实验时,要通过调节起偏棱镜使入射光为p 光,即偏振面平行于入射面,而进行椭偏率测量时还要使1/4波片轴向和起偏棱镜方向一致. 所以实验前要通过观察消光现象来确定格兰——汤普逊棱镜垂直轴方向和1/4波片上的轴向方向.4) 光路的调整与系统稳定性的测量.首先按光学实验的常规要求调整好光路,然后将硅基铝膜(玻璃反射镜)样品置于样品台上,观察其SMOKE 曲线是否为直线,以此来判断光路、磁路是否稳定.5) 电磁铁退磁. 若电磁铁存在剩磁,应退磁后再做实验.6) 坡莫合金薄膜的纵向克尔旋转角测定.入射光为p 光,而检偏器首先调整成消光位置,记录此时螺旋测微装置的螺旋刻度读数,然后设置检偏棱镜稍微偏离消光位置,再次记录螺旋刻度读数.根据2 次读数差及格兰——汤普逊棱镜上螺旋测微装置的定标求出δ.在通讯正常的情况下,开始克尔信号的采集.观测坡莫合金薄膜磁滞回线的形成过程,并通过控制软件的“寻找峰值”功能找到两峰值,,即找到了)(S B I +和)(S B I -,则由 2)()(0S S B I B I I -++=,)()(S S B I B I I --+=∆。
表面磁光克尔效应 2
深圳大学实验报告课程名称:近代物理实验实验名称:表面磁光克尔效应学院:物理科学与技术学院组号指导教师:报告人:学号:实验地点:实验时间:实验报告提交时间:五、数据处理5.1、纵向克尔效应:图1、纵向实验图纵向克尔效应是指磁化方向在样品膜面内,并且平行于入射面。
因此信号的强度会随光的入射角的减小而减少。
当信号垂直入射时强度为零。
当样品被纵向磁化时,当外部磁场增强,原本不带磁的样品上的磁场强度也随着增强,则接受的信号会越强。
而当外部磁场消失,样品上的磁场也不会消失,而接受的信号强度会一直保持在最大值。
直到外部加上一个反向磁场时,样品上带的磁场才会消失,而此时的信号会减少到初始状态。
由实验中得出,当磁性样品的磁性增大时,会出现克尔旋转角,从而使激光再次打入探测仪。
因而出现了能量的变化。
图1为测得的信号,虽变化不明显,但是基本上与理论相符。
5.2、极向克尔效应:图2极向实验图图3、极向克尔效应理想图极向克尔效应是指磁化方向垂至于样品表面并且平行于入射面。
极向克尔信号的变化与纵向相反,其强度随光的入射角的减小而增大,若信号垂直入射则其强度最大。
样品上的磁场大小随外加磁场的变化而变化。
当外加磁场增大时,样品被磁化并其磁场强度增大。
而外加磁场消失样品上的磁场也消失了。
图3为极向克尔效应的理想图,而图2为实验图。
从图2发现接受的信号强度随着外加磁场的增大而减小,与理论相反。
极向克尔信号极弱,在调整电路时除了问题,没有找准消光点,而是光强最大点,导致在实验中当磁性样品的磁性增大时,会出现克尔旋转角,信号强度反而减小。
六、实验结论本次实验的操作较为困难,主要是调节仪器光路,不仅需严格的按照光路调节的步骤进行,并且还要非常的仔细,否则会造成信号的衰减。
老师教我们一个小的技巧,就是拿一张白纸来判断激光是否对准各个仪器的中心。
一开始我们在调节仪器光路时很粗心,各个仪器之间没有保持平行,而激光没有对准仪器中心,虽然光线有透过仪器,但那个光线是由仪器内部反射出来的,结果接受的信号及其不精确。
磁光克尔 测试
磁光克尔测试
磁光克尔是一种测试方法,用于检测材料的磁性结构,例如磁铁,磁体或铁磁体。
它利用克尔力将一个外磁场施加于测试样品,从而可以检测出磁性材料内部存在的磁场分布。
这种测试方法最初由爱因斯坦和维尔金斯于1925年发明。
它们发明了一种装置,该装置可以检测出磁体物理学过程中发生的磁场改变,并且检测结果可以用图形表示出来。
现在,磁光克尔检测器已经成为磁性材料,尤其是高磁性材料的研究的重要工具,它可以提供客观的、高精度的测试结果。
二维磁光柯尔效应的测量
谢谢大家!
X=14.5mm
计算得到X=14.5mm 时,shoulder位置在 Z=8.63mm处
同样得到X=19.5mm 时,shoulder位置 在Z=8.40mm处
得到Fe的边界表示为: Z=-0.047X+9.32
沿Cr等高线测量结果
在Cr厚度一定的条件下测量不同Fe厚度下,K1与K2的 值。
K1,2
KV
KS d
[3]
以K1为例,在各种
Cr厚度均显示了对
1/d的良好线性,且
斜率几乎相等。
参考文献
[1],Z.Q.Qiu S.D.Bader Surface magneto-optic kerr effect
[2]、[3],N.A.Morley S.L.Tang et al. , J. Appl. Phys. 97 10H501.
The sign and magnitude of these effects are proportional to M and its direction.
实验光路
Polarizer Laser
sample
H
φ’
Analyzer
δ 【1】
Detector
测量结果示例
矫顽场 Hc
饱和磁化 强度Ms
马达控制程序
实时显示马达位 置
令马达回到起始 时的位置
输入起始时两个方向 上马达位置的读数
输入两个方向上所 需位移大小
马达与kerr测量结合后的程序
马达运行参 数设定区
测量基本参 数设定区
测量结果显示 区
测量及数据处理
以横向扫描7mm,纵向扫描6.6mm,测量步长均为 0.2mm为例。得到1155组数据。
- 1、下载文档前请自行甄别文档内容的完整性,平台不提供额外的编辑、内容补充、找答案等附加服务。
- 2、"仅部分预览"的文档,不可在线预览部分如存在完整性等问题,可反馈申请退款(可完整预览的文档不适用该条件!)。
- 3、如文档侵犯您的权益,请联系客服反馈,我们会尽快为您处理(人工客服工作时间:9:00-18:30)。
1.极向克尔效应:如图 2 所示,磁化方向垂至于样品表面并且平行于入射面。通常情况下,
极向克尔信号的强度随光的入射角的减小而增大,在 0o入射角时(垂直入射)达到最大。
图 2 极向克尔效应
2.纵向克尔效应:如图 3 所示,磁化方向在样品膜面内,并且平行于入射面。纵向克尔信号的强度一般随光的入射角的减小而减小,在 入射角时为零。通常情况下,纵向克尔信号中无论是克尔旋转角还是克尔椭偏率都要比极向克尔信号小一个数量级。图 3 纵向克尔效应
振面旋转方向和δ同向时光强增大,反向时光强减小,这样 品的磁化方向可以通过样光强的变化来区分。在图 2 的光路中,假设取入射光为p偏振(电场矢量Ep平行于入射面),当光线从磁化了的样品表面反射时由于克尔效应,反射光中含有一个很小的垂直于Ep的电场分量 , 通常Es<<Ep。
在一阶近似下有:
Es/Ep=θk+iεk (1)
正是这个原因纵向克尔效应的探测远比极向克尔效应来得困难。但对于很多薄膜样品来说,易磁轴往往平行于样品表面,因而只有在纵向克尔效应配置下样品的磁化强度才容易达到饱和。因此,纵向克尔效应对于薄膜样品的磁性研究来说是十分重要的。
3.横向克尔效应:如图 4 所示,磁化方向在样品膜面内,并且垂至于入射面。横向克尔效应中反射光的偏振状态没有变化。这是因为在这种配置下光电场与磁化强度矢积的方向永远没有与光传播方向相垂直的分量。横向克尔效应中,只有在 偏振光(偏振方向平行于入射面)入射条件下,才有一个很小的反射率的变化。图 4 横向克尔效应
成偏离消光位置一个很小的角度δ,
如图 6 所示。样品放置在磁场中,当外加磁场改变样品磁化强度时,反射光的偏振状态发生改变。通过偏振棱镜 2 的光强也发生变化。在一阶近似下光强的变化和磁化
强度呈线性关系,探测器探测到这个光强的变化就可以推测出样品的磁化状态。
两个偏振棱镜的设置状态主要是为了区分正负克尔旋转角。若两个偏振方向设置在消光位置,无论反射光偏振面是顺时针还是逆时针旋转,反映在光强的变化上都是强度增大。这样无法区分偏振面的正负旋转方向, 也就无法判断样品的磁化方向。当两个偏振方向之间有一个小角度δ时,通过偏振棱镜2 的光线有一个本底光强I0 。 反射光偏图 6 偏振器件配置
得分
教师签名
批改日期
深圳大学实验报告
课程名称:近代物理实验
实验名称:表面磁光克尔效应实验
学院:
组号指导教师:报告Biblioteka :学号:实验地点实验时间:
实验报告提交时间:
一、实验设计方案
1.1、实验目的
(1)了解表面磁光克尔效应的原理和实验方法;
(2)掌握表面磁光克尔效应谱的测量和应用。
1.2、实验原理
磁光效应有两种:法拉第效应和克尔效应,1845 年,Michael Faraday 首先发现介质的磁化状态会影响透射光的偏振状态,这就是法拉第效应。1877 年,John Kerr 发现铁磁体对反射光的偏振状态也会产生影响,这就是克尔效应。克尔效应在表面磁学中的应用,即为表面磁光克尔效应(surface magneto-optic Kerr effect) 。它是指铁磁性样品(如铁、钴、镍及其合金)的磁化状态对于从其表面反射的光的偏振状态的影响。当入射光为线偏振光时,样品的磁性会引起反射光偏振面的旋转和椭偏率的变化。表面磁光克尔效应作为一种探测薄膜磁性的技术始于 1985 年。
如图 1 所示,当一束线偏振光入射到样品表面上时,如果样品是各向异性的,那么反射光的偏
振方向会发生偏转。如果此时样图 1 表面磁光克尔效应原理
品还处于铁磁状态,那么由于铁磁性,还会导致反射光的偏振面相对于入射光的偏振面额外再转过了一个小的角度,这个小角度称为克尔旋转角θk。同时,一般而言,由于样品对p光和s光的吸收率是不一样的,即使样品处于非磁状态,反射光的椭偏率也发生变化, 而铁磁性会导致椭偏率有一个附加的变化,这个变化称为克尔椭偏率εk。由于克尔旋转角θk和克尔椭偏率εk都是磁化强度M的函数。通过探测θk或εk的变化可以推测出磁化强度M的变化。
在超高真空原位测量中,激光在入射到样品之前,和经样品反射之后都需要经过一个视窗。但是视窗的存在产生了双折射,这样就增加了测量系统的本底,降低了测量灵敏度。为了消除视窗的影响,降低本底和提高探测灵敏度,需要在检偏器之前加一个 1/4 波片。仍然假设入射光为 p 偏振,四分之一波片的主轴平行于入射面,如图 7所示
无外加磁场下:I0=∣Ep∣2δ2(6)
所以有:I=I0 (1+ 2θk/δ )(7)
于是在饱和状态下的克尔旋转角θk为:
(8)
I(+M S)和 分别是正负饱和状态下的光强。从式(8)可以看出,光强的变化只与克尔旋转角I(−M S)θk有关,而与εk无关。说明在图 5 这种光路中探测到的克尔信号只是克尔旋转角。
此时在一阶近似下有:
通过棱镜 2 的光强为:
因为δ很小,所以可以取sinδ = δ, cosδ = 1,得到:
因为角度δ取值较小,并且 ,所以:
(9)
在饱和情况下∆εk为:
(10)
此时光强变化对克尔椭偏率敏感而对克尔旋转角不敏感。因此,如果要想在大气中探测磁性薄膜的克尔椭偏率,则也需要在图5的光路中检偏棱镜前插入一个四分之一波片。如图7所示。
通过棱镜 2 的光强为:I=∣Epsinδ+Escosδ∣2(2)
将(1)式代入(2)式得到:I=∣E p∣2∣sinδ+(θk+iεk)cosδ∣2(3)
因为δ很小,所以可以取sinδ = δ, cosδ = 1,得到:
I=∣Ep∣2∣δ+ (θk+iεk)∣2(4)
整理得到:I=∣Ep∣2(δ2 + 2δθk)(5)
以下以极向克尔效应为例详细讨论 SMOKE 系统,原则上完全适用于纵向克尔效应和横向克尔效应。图5为常见的 SMOKE 系统光路图,氦-氖激光器发射一激光束通过偏振棱镜 1后变成线偏振光,然后从样品表面反射,经过偏振棱镜 2 进入探测器。偏振棱镜 2 的偏振方向与偏振棱镜 1 设置图 5 常见 SMOKE 系统的光路图
