曼昆《经济学原理(宏观经济学分册)》(第7版)课后习题详解 第7章~第9章【圣才出品】
曼昆《经济学原理(微观经济学分册)》课后习题详解(第7篇)【圣才出品】
曼昆《经济学原理(微观经济学分册)》课后习题详解(第7篇)【圣才出品】第7篇深⼊研究的论题第21章消费者选择理论⼀、概念题1.预算约束线(budget constraint )答:预算约束线⼜称消费可能线和价格线,指对消费者可以承受(在消费者收⼊和消费者希望购买的物品价格既定时)的消费组合的限制。
预算约束线表⽰消费者⽀付得起的消费组合。
假定以I 表⽰消费者的既定收⼊,以P 1和P 2分别表⽰商品1和商品2的价格,以X 1和X 2分别表⽰商品1和商品2的数量,那么,相应的预算等式为:P 1X 1+P 2X 2=I 。
上式表⽰:消费者的全部收⼊等于他购买商品1和商品2的总⽀出。
⽽且,可以⽤1I P 和2I P 来分别表⽰全部收⼊仅购买商品1或商品2的数量,它们分别表⽰预算约束线的横截距和纵截距。
此外,上式还可以改写成如下形式:12122P I X X P P =?+。
式中的预算约束线⽅程表明,预算约束线的斜率为12P P ?,纵截距为2I P 。
2.⽆差异曲线(indifference curve )答:⽆差异曲线指带给消费者相同满⾜程度的消费组合的⼀条曲线。
它表⽰消费者在⼀定偏好、⼀定技术条件和⼀定资源条件下选择商品时,对不同组合商品的满⾜程度是没有区别的。
与⽆差异曲线相对应的效⽤函数为:U =f (X 1,X 2)。
其中,X 1、X 2分别为商品1和商品2的消费数量;U 是常数,表⽰某个效⽤⽔平。
由于⽆差异曲线表⽰的是序数效⽤,所以,这⾥的U 只需表⽰某⼀个效⽤⽔平,⽽不在乎其具体数值的⼤⼩。
有的西⽅经济学者称这种效⽤⽔平为效⽤指数。
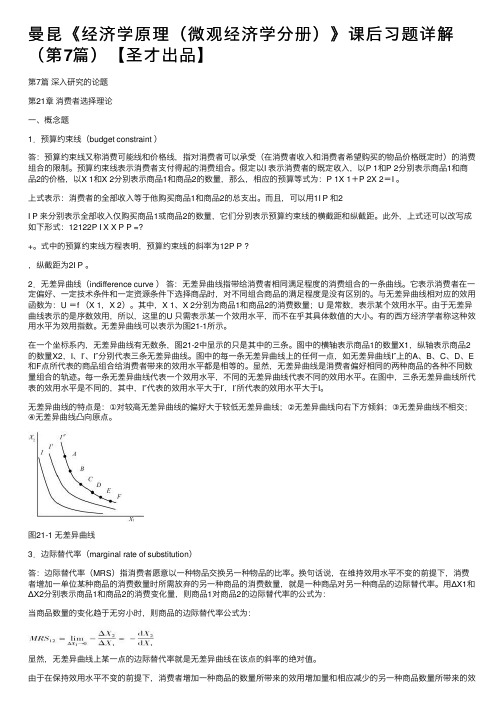
⽆差异曲线可以表⽰为图21-1所⽰。
在⼀个坐标系内,⽆差异曲线有⽆数条,图21-2中显⽰的只是其中的三条。
图中的横轴表⽰商品1的数量X1,纵轴表⽰商品2的数量X2,I、I′、I″分别代表三条⽆差异曲线。
图中的每⼀条⽆差异曲线上的任何⼀点,如⽆差异曲线I″上的A、B、C、D、E 和F点所代表的商品组合给消费者带来的效⽤⽔平都是相等的。
曼昆《宏观经济学》(第6、7版)课后习题详解(第9章 经济波动导论)

第4篇 经济周期理论:短期中的经济第9章 经济波动导论课后习题详解跨考网独家整理最全经济学考研真题,经济学考研课后习题解析资料库,您可以在这里查阅历年经济学考研真题,经济学考研课后习题,经济学考研参考书等内容,更有跨考考研历年辅导的经济学学哥学姐的经济学考研经验,从前辈中获得的经验对初学者来说是宝贵的财富,这或许能帮你少走弯路,躲开一些陷阱。
以下内容为跨考网独家整理,如您还需更多考研资料,可选择经济学一对一在线咨询进行咨询。
一、概念题1.奥肯定律(Okun ’s law )答:奥肯定律是表示失业率与实际国民收入增长率之间关系的经验统计规律,由美国经济学家奥肯在20世纪60年代初提出。
其主要内容是:失业率每高于自然失业率1个百分点,实际GDP 将低于潜在GDP 2个百分点。
奥肯定律的一个重要结论是:实际GDP 必须保持与潜在GDP 同样快的增长,以防止失业率的上升。
如果政府想让失业率下降,那么,该经济社会的实际GDP 的增长必须快于潜在GDP 的增长。
根据奥肯的研究,在美国,失业率每下降1%,实际国民收入增长2%。
但应该指出的是:①奥肯定律表明了失业率与实际国民收入增长率之间是反方向变动的关系;②两者的数量关系1∶2是一个平均数,在不同的时期,这一比率并不完全相同;③这一规律适用于经济没有实现充分就业时的情况。
在经济实现了充分就业时,这一规律所表示的自然失业率与实际国民收入增长率之间的关系要弱得多,一般估算是1∶0.76。
2.领先指标(leading indicators )答:领先指标是指一般先于整体经济变动的变量,可以帮助经济学家预测短期经济波动。
由于经济学家对前导指标可靠意见看法的不一致,导致经济学家给出不同的预测,其中就包括短期经济波动情况的预测。
领先指标的大幅度下降预示经济很可能会衰退,大幅度上升预示经济很可能会繁荣。
3.总需求(aggregate demand )答:总需求是指整个经济社会在任何一个给定的价格水平下对产品和劳务的需求总量。
曼昆经济学原理课后答案第七章消费者、生产者与市场效率
复习题1.解释买者的支付意愿、消费者剩余和需求曲线如何相关。
答:需求曲线反映了买者的支付意愿。
在任何一种数量时,需求曲线给出的价格表示边际买者的支付意愿。
需求曲线以下和价格以上的总面积是一种物品或劳务市场上所有买者消费者剩余的总和。
2.解释卖者的成本、生产者剩余和供给曲线如何相关。
36答:供给曲线的高度与卖者的成本相关。
在任何一种数量时,供给曲线给出的价格表示边际卖者的成本。
价格之下和供给曲线以上的面积衡量市场的生产者剩余。
3.在供求图中,标出市场均衡时的生产者剩余和消费者剩余。
答:APE 的面积代表消费者剩余;PBE 的面积代表生产者剩余。
图7-1 供求图4.什么是效率?它是经济决策者的唯一目标吗?答:效率是指资源配置使社会所有成员得到的总剩余最大化的性质。
除了效率外,经济决策者还应该关心平等。
实际上,市场交易的好处很像在市场参与者之间分割一块蛋糕,经济决策者不仅要关心如何将经济蛋糕做大,即效率;还要考虑如何在市场参与者之间分这块蛋糕,这就涉及公平问题。
5.看不见的手有什么作用?答:每一个市场参与者都会尽力追求自己的利益,看不见的手指引他们在相互竞争中达到一个并非他们本意想要达到的目的,这就是市场均衡点。
在均衡点上,消费者剩余和生产者剩余总和最大化,整个社会福利达到最大。
6.说出两种市场失灵的名称。
解释为什么每一种都可能使市场结果无效率。
答:市场失灵包括市场势力和外部性。
如果某一市场上存在市场势力,即只有极少部分(可能是一个)买者或卖者可以控制市场价格,他们就会使价格趋向于对他们这一小部分人有益的水平。
于是,市场价格和数量背离供求平衡,社会福利达不到最大,市场失去效率。
外部性是某些市场参与者的行为对旁观者福利的影响。
它使市场福利还要取决于买者评价和卖者成本之外的其他因素。
由于买者和卖者在决定消费和生产时并没有考虑这种负作用。
所以,从整个社会角度来看,市场均衡可能是无效率的。
问题与应用1.Melissa用120美元购买了一个iPod,并得到了80美元的消费者剩余。
曼昆经济学原理7-9

总消费者剩余
=$40
•Q
•南昌工程学院 邱家海
消费者剩余与需求曲线
•P •Flea的消费者剩余
如果
P = $220
•Anthony的消费者剩 余
Flea的消费者剩
余 = $300 – 220 =
$80
Anthony的消费
者剩余 =$250 –
220
= $30
•Q 总消费者剩余 = $110
在
Q = 10的支付意
愿
•需求曲线
B. 计算在 P =
如$3果0时价的格消降费到者$20,消
费者剩剩余余会增加多少
……
C. 新进入市场的买者
D. 已进入市场的买者
能以更低的价格购买
•Q
•南昌工程学院 邱家海
•17
主动学习 1
参考答案
•P
A. 在 Q = 10, 边际买 •$
者的支付意愿为 $30.
•南昌工程学院 邱家海
自由市场与政府干预
• 市场均衡是有效率的,任何其他结果的总剩 余都不会高于市场均衡产量的总剩余
• 政府不能通过改变资源的市场配置方法而增 加总剩余
• 自由放任 (法语的意思是“让他们自由行事吧 ”):表达了政府不应该干预市场的主张
给曲线
•每双鞋 •P
的价格
•鞋的供给
如果 P = $40 在Q = 15(千双),
•S
边际卖者的成本
是$30,
她的生产者剩余
•千双
为$10
•Q
•南昌工程学院 邱家海
许多卖者的生产者剩余与光滑的供
给曲线
生产者剩余是价格 •P 以下和供给曲线以
•鞋的供给
曼昆宏观经济学第七版课后答案

曼昆宏观经济学第七版课后答案【篇一:曼昆《宏观经济学》(第6、7版)课后习题详解(第1章宏观经济学科学)】txt>第1篇导言课后习题详解跨考网独家整理最全经济学考研真题,经济学考研课后习题解析资料库,您可以在这里查阅历年经济学考研真题,经济学考研课后习题,经济学考研参考书等内容,更有跨考考研历年辅导的经济学学哥学姐的经济学考研经验,从前辈中获得的经验对初学者来说是宝贵的财富,这或许能帮你少走弯路,躲开一些陷阱。
以下内容为跨考网独家整理,如您还需更多考研资料,可选择经济学一对一在线咨询进行咨询。
一、概念题1.宏观经济学(macroeconomics)答:宏观经济学与微观经济学相对,是一种现代的经济分析方法。
它以国民经济总体作为考察对象,研究经济生活中有关总量的决定与变动,解释失业、通货膨胀、经济增长与波动、国际收支及汇率的决定与变动等经济中的宏观整体问题,所以又称之为总量经济学。
宏观经济学的中心和基础是总需求—总供给模型。
具体来说,宏观经济学主要包括总需求理论、总供给理论、失业与通货膨胀理论、经济增长与经济周期理论、开放经济理论、宏观经济政策等内容。
对宏观经济问题进行分析与研究的历史十分悠久,但现代意义上的宏观经济学直到20世纪30年代才得以形成和发展起来。
现代宏观经济学诞生的标志是凯恩斯于1936年出版的《就业、利息和货币通论》。
宏观经济学在20世纪30年代奠定基础,二战后逐步走向成熟并得到广泛应用,20世纪60年代后的“滞胀”问题使凯恩斯主义的统治地位受到严重挑战并形成了货币主义、供给学派、理性预期等学派对立争论的局面,20世纪90年代新凯恩斯主义的形成又使国家干预思想占据主流。
宏观经济学是当代发展最为迅猛,应用最为广泛,因而也是最为重要的经济学学科。
2.实际gdp(real gdp)答:实际gdp指用以前某一年的价格作为基期的价格计算出来的当年全部最终产品的市场价值。
它衡量在两个不同时期经济中的产品产量变化,以相同的价格或不变金额来计算两个时期所生产的所有产品的价值。
曼昆经济学原理第七章(第七版)综述

引
言
• 7、作为参与市场的买者和卖者,他们在相互交易中得到的 利益,被称为“福利”。 • 8、福利经济学是研究资源配置如何影响经济福利的一门学 问。 • 9、第一章原理六:市场通常是组织经济活动的一种好方法。 本章研究将再次论证此结论的无比正确性。价格是一只看 不见的手,它将指导消费者和生产者共同行动,达成社会 福利最大化的结果。
7.1 消费者剩余
• 7.1.2用需求曲线衡量消费者剩余
• 各位看官原谅,由于内容假设你的朋友正在考虑两家手机服务提供商.A提供商每月 收取固定服务费120美元,无论打多少次电话都是如此.B提 供商不收取固定的服务费,而是每打1分钟电话费1美元.你 的朋友对每个月打电话时间的需求由方程Qd=150-50P给 出,其中P是每分钟电话的价格. a,对每个提供商,你朋友多打1分钟电话的费用是多少? b,根据你对a的回答,你朋友用每个提供商的服务会打多少 分钟电话? c,他每个月给每个提供商付费多少? d,他从每个提供商得到的消费剩余是多少? e,你会推荐选择哪个提供商?为什么?
• A、 由Qd=150-50P,这个方程可以得出以下结论:P哪怕 是无限接近于0,Q也只能无限接近于150,由于打电话的 分钟只能按个位数计算,所以选择A提供商的话最多打149 分钟电话。(可能会有人说,超过或等于150分钟后的每 分钟就是0元啊,还是请回看一下方程式,P不可能为负数, 否则提供商要赔死了,所以方程式已经限定了最多150分 钟的,这时P=0,实际上这时已经是极限值了;综上所述: 选择A提供商,最多打149分钟电话,再多打1分钟的费用 是0美元。选择B提供商,根据方程得出,P=1时,共打100 分钟电话,再多打1分钟的费用仍是1美元。 • B、用A提供商,会打149分钟电话,用B提供商,会打100 分钟电话。 • C、A提供商120美元,B提供商100美元。
经济学原理(曼昆)第七版--第9章--应用:国际贸易--多选题答案

经济学原理(曼昆)第七版--第9章--应用:国际贸易--多选题答案第9章应用:国际贸易快速多选:1.如果一个不允许钢铁进行国际贸易的国家的国内价格低于世界价格,那么:A.该国在生产钢铁中有比较优势,如果开放贸易会成为钢铁出口国。
B.该国在生产钢铁中有比较优势,如果开放贸易会成为钢铁进口国。
C.该国在生产钢铁中没有比较优势,如果开放贸易会成为钢铁出口国。
D.该国在生产钢铁中没有比较优势,如果开放贸易会成为钢铁进口国。
【答案】A【解析】由于该国的国内钢铁价格低于世界价格,说明该国在生产钢铁上具有比较优势,因此该国将成为出口国。
2. 当Ectenia国在咖啡豆方面对世界开放贸易时,国内咖啡豆价格下降。
以下哪一个选项说明了这种情况?A.国内咖啡产量增加,而且Ectenia变成了咖啡进口国。
B.国内咖啡产量增加,而且Ectenia变成了咖啡出口国。
C.国内咖啡产量减少,而且Ectenia变成了咖啡进口国。
D.国内咖啡产量减少,而且Ectenia变成了咖啡出口国。
【答案】C【解析】首先,由国内咖啡豆价格下降知,贸易使得Ectenia过总供给增加(国内市场上,总供给>总需求),则该国为咖啡豆的进口国。
由一国允许贸易并成为一种物品的进口者时,该物品消费者的状况变好了知,该国是咖啡的进口国。
并且,大量进口导致国内咖啡产业受冲击,国内该物品的生产者状况变坏了。
此题也可以用排除法。
3. 当一国开放一种产品的贸易并成为一个进口国时,将带来哪种结果?A. 生产者剩余减少,但消费者剩余和总剩余增加。
B. 生产者剩余减少,消费者剩余增加,而进口对总剩余的影响不确定。
C. 生产者剩余和总剩余都增加,但消费者剩余减少。
D. 生产者剩余、消费者剩余和总剩余都增加。
【答案】A【解析】由书上结果知,当一国开放一种产品的贸易并成为一个进口国时,消费者剩余增加,生产者剩余减少,总剩余增加。
4. 如果进口一种产品的国家征收关税,这就会增加_________。
经济学原理曼昆课后答案chapter7.doc
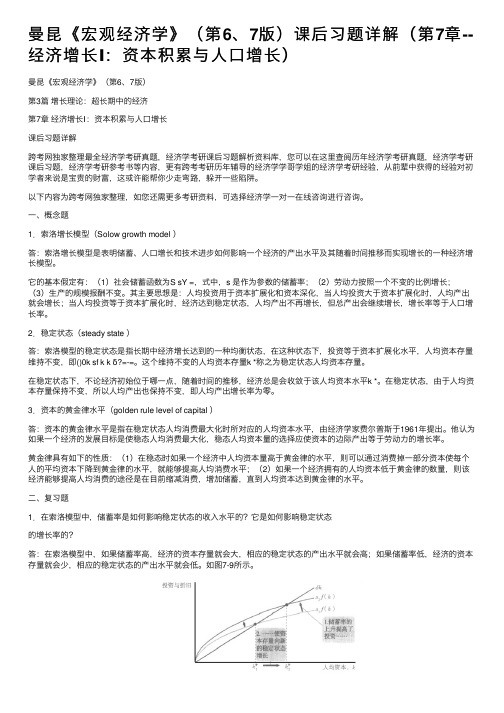
Problems and Applications1.If an early freeze in California sours the lemon crop, the supply curve for lemons shiftsto the left, as shown in Figure 7-5.The result is a rise in the price of lemons and adecline in consumer surplus from A + B + C to just A. So consumer surplus declines by the amount B + C.Figure 7-5In the market for lemonade, the higher cost of lemons reduces the supply of lemonade,as shown in Figure 7-6.The result is a rise in the price of lemonade and a decline inconsumer surplus from D + E + F to just D, a loss of E + F. Note that an event that affectsconsumer surplus in one market often has effects on consumer surplus in other markets.Figure 7-62. A rise in the demand for French bread leads to an increase in producer surplus in themarket for French bread, as shown in Figure 7-7.The shift of the demand curve leads to an increased price, which increases producer surplus from area A to area A + B + C.Figure 7-7The increased quantity of French bread being sold increases the demand for flour, asshown in Figure 7-8.As a result, the price of flour rises, increasing producer surplusfrom area D to D + E + F. Note that an event that affects producer surplus in onemarket leads to effects on producer surplus in related markets.Figure 7-83. a.Bert’ s demand schedule is:Price Quantity DemandedMore than $7 0$5 to $7 1$3 to $5 2$1 to $3 3$1 or less 4Bert’ s demand curve is shown in Figure 7 -9.Figure 7-9b.When the price of a bottle of water is $4, Bert buys two bottles of water.Hisconsumer surplus is shown as area A in the figure.He values his first bottle ofwater at $7, but pays only $4 for it, so has consumer surplus of $3.He valueshis second bottle of water at $5, but pays only $4 for it, so has consumersurplus of $1.Thus Bert’ s total consumer surplus is $3 + $1 = $4, which isthe area of A in the figure.c.When the price of a bottle of water falls from $4 to $2, Bert buys three bottlesof water, an increase of one. His consumer surplus consists of both areas Aand B in the figure, an increase in the amount of area B. He gets consumersurplus of $5 from the first bottle ($7 value minus $2 price), $3 from thesecond bottle ($5 value minus $2 price), and $1 from the third bottle ($3 valueminus $2 price), for a total consumer surplus of $9. Thus consumer surplusrises by $5 (which is the size of area B) when the price of a bottle of water fallsfrom $4 to $2.4. a. Ernie ’ s supply schedule for water is:Price Quantity SuppliedMore than $7 4$5 to $7 3$3 to $5 2$1 to $3 1Less than $1 0Ernie’ s supply curve is shown in Figure 7 -10.Figure 7-10b.When the price of a bottle of water is $4, Ernie sells two bottles of water.Hisproducer surplus is shown as area A in the figure.He receives $4 for his firstbottle of water, but it costs only $1 to produce, so Ernie has producer surplusof $3.He also receives $4 for his second bottle of water, which costs $3 toproduce, so he has producer surplus of$1. Thus Ernie’ s total producersurplus is $3 + $1 = $4, which is the area of A in the figure.c.When the price of a bottle of water rises from $4 to $6, Ernie sells three bottlesof water, an increase of one.His producer surplus consists of both areas Aand B in the figure, an increase by the amount of area B.He gets producersurplus of $5 from the first bottle ($6 price minus $1 cost), $3 from the secondbottle ($6 price minus $3 cost), and $1 from the third bottle ($6 price minus $5price), for a total producer surplus of $9.Thus producer surplus rises by $5(which is the size of area B) when the price of a bottle of water rises from $4to $6.5. a. From Ernie ’ s supply schedule and Bert ’ s demand schedule, the quantitydemanded and supplied are:Price Quantity Supplied Quantity Demanded$ 2 1 34 2 26 3 1Only a price of $4 brings supply and demand into equilibrium, withan equilibrium quantity of 2.b.At a price of $4, consumer surplus is $4 and producer surplus is $4, as shownin problems 3 and 4.Total surplus is $4 + $4 = $8.c.If Ernie produced one fewer bottle, his producer surplus would decline to $3,as shown in problem 4.If Bert consumed one fewer bottle, his consumersurplus would decline to $3, as shown in problem 3. So total surplus would declineto $3 + $3 = $6.d.If Ernie produced one additional bottle of water, his cost would be $5, but theprice is only $4, so his producer surplus would decline by $1.If Bertconsumed one additional bottle of water, his value would be $3, but the priceis $4, so his consumer surplus would decline by $1.So total surplus declinesby $1 + $1 = $2.6. a.The effect of falling production costs in the market for stereos results in a shiftto the right in the supply curve, as shown in Figure 7-11.As a result, theequilibrium price of stereos declines and the equilibrium quantity increases.b.The decline in the price of stereos increases consumer surplus from area A to A+ B + C + D, an increase in the amount B + C + D.Prior to the shift in supply,producer surplus was areas B + E (the area above the supply curve and belowthe price).After the shift in supply, producer surplus is areas E + F + G.Soproducer surplus changes by the amount F + G - B, which may be positive ornegative.The increase in quantity increases producer surplus, while thedecline in the price reduces producer surplus.Since consumer surplus risesby B + C + D and producer surplus rises by F + G - B, total surplus rises by C+ D+F+G.c.If the supply of stereos is very elastic, then the shift of the supply curvebenefits consumers most.To take the most dramatic case, suppose thesupply curve were horizontal, as shown in Figure 7-12.Then there is noproducer surplus at all.Consumers capture all the benefits of fallingproduction costs, with consumer surplus rising from area A to area A + B.Figure 7-11Figure 7-127. Figure 7-13 shows supply and demand curves for haircuts. Supply equals demand ata quantity of three haircuts and a price between $4 and $5. Firms A, C, and D shouldcut the hair of Sally Jessy, Jerry, and Montel. Oprah ’ s willingness to pay is too low and firm B ’ s costs are too high, so they do not participate. The maximum total surplus isthe area between the demand and supply curves, which totals $11 ($8 value minus$2 cost for the first haircut, plus $7 value minus $3 cost for the second, plus $5 valueminus $4 cost for the third).Figure 7-138. a.The effect of falling production costs in the market for computers results in ashift to the right in the supply curve, as shown in Figure 7-14.As a result, theequilibrium price of computers declines and the equilibrium quantity increases.The decline in the price of computers increases consumer surplus from area Ato A + B + C + D, an increase in the amount B + C + D.Figure 7-14Prior to the shift in supply, producer surplus was areas B + E (the area abovethe supply curve and below the price).After the shift in supply, producersurplus is areas E + F + G.So producer surplus changes by the amount F + G- B, which may be positive or negative.The increase in quantity increasesproducer surplus, while the decline in the price reduces producer surplus. Sinceconsumer surplus rises by B + C + D and producer surplus rises by F + G - B,total surplus rises by C + D + F + G.——Figure 7-15b.Since adding machines are substitutes for computers, the decline in the priceof computers means that people substitute computers for adding machines,shifting the demand for adding machines to the left, as shown in Figure 7-15.The result is a decline in both the equilibrium price and equilibrium quantity ofadding machines.Consumer surplus in the adding-machine market changesfrom area A + B to A + C, a net gain of C - B.Producer surplus changes fromarea C + D + E to area E, a net loss of C + D.Adding machine producers aresad about technological advance in computers because their producersurplus declines.c.Since software and computers are complements, the decline in the price andincrease in the quantity of computers means that people’ s demand forsoftware increases, shifting the demand for software to the right, as shown inFigure 7-16. The result is an increase in both the price and quantity of software.Consumer surplus in the software market changes from B + C to A+B, a net increase of A - C. Producer surplus changes from E to C + D + E, anincrease of C + D, so software producers should be happy about the technologicalprogress in computers.d.Yes, this analysis helps explain why Bill Gates is one the world’ s richest msince his company produces a lot of software that’ s a complement withcomputers and there has been tremendous technological advance incomputers.——Figure 7-169. a. Figure 7-17 illustrates the demand for medical care. If each procedure has aprice of $100, quantity demanded will be Q 1 procedures.Figure 7-17b.If consumers pay only $20 per procedure, the quantity demanded will be Q 2procedures.Since the cost to society is $100, the number of proceduresperformed is too large to maximize total surplus.The quantity thatmaximizes total surplus is Q 1 procedures, which is less than Q2.c.The use of medical care is excessive in the sense that consumers getprocedures whose value is less than the cost of producing them.As a result,——the economy’ s total surplus is reduced.d.To prevent this excessive use, the consumer must bear the marginal cost ofthe procedure.But this would require eliminating insurance.Anotherpossibility would be that the insurance company, which pays most of themarginal cost of the procedure ($80, in this case) could decide whether theprocedure should be performed.But the insurance company doesn’ t get thebenefits of the procedure, so its decisions may not reflect the value to theconsumer.10. a. Figure 7-18 illustrates the effect of the drought. The supply curve shifts tothe left, leading to a rise in the equilibrium price from P 1 to P 2 and a decline inthe equilibrium quantity from Q 1 to Q 2 .Figure 7-18b.If the price of water is not allowed to change, there will be an excess demandfor water, with the shortage shown on the figure as the difference between Q 1and Q 3 .c.The system for allocating water is inefficient because it no longer allocateswater to those who value it most highly.Some people who value water atmore than its cost of production will be unable to obtain it, so societysurplus isn’ t maximized.The allocation system seems unfair as well.Water is allocated simply on pastusage, rewarding past wastefulness.If a family’ s demand for water increases,——say because of an increase in family size, the policy doesn ’ t allow them to obtain more water. Poor families, who probably used water mostly fornecessary uses like drinking, would suffer more than wealthier families whowould have to cut back only on luxury uses of water like operating backyardfountains and pools. However, the policy also keeps the price of water lower,which benefits poor families, since otherwise more of their family budgetwould have to go for water.d. If the city allowed the price of water to rise to its equilibrium price P 2 , theallocation would be more efficient. Quantity supplied would equal quantitydemanded and there would be no shortage. Total surplus would bemaximized.Whether the market allocation would be more or less fair than theproportionate reduction in water under the old policy is difficult to say, but it islikely to be more fair. Notice that the quantity supplied would be higher (Q 2)in this case than under the water restrictions (Q 3 ), so there ’ s less reduction inwater usage. To make the market solution even more fair, the governmentcould provide increased tax relief or welfare payments for poor families whosuffer from paying the higher water prices.。
曼昆《宏观经济学》(第6、7版)课后习题详解(第7章--经济增长Ⅰ:资本积累与人口增长)
曼昆《宏观经济学》(第6、7版)课后习题详解(第7章--经济增长Ⅰ:资本积累与⼈⼝增长)曼昆《宏观经济学》(第6、7版)第3篇增长理论:超长期中的经济第7章经济增长Ⅰ:资本积累与⼈⼝增长课后习题详解跨考⽹独家整理最全经济学考研真题,经济学考研课后习题解析资料库,您可以在这⾥查阅历年经济学考研真题,经济学考研课后习题,经济学考研参考书等内容,更有跨考考研历年辅导的经济学学哥学姐的经济学考研经验,从前辈中获得的经验对初学者来说是宝贵的财富,这或许能帮你少⾛弯路,躲开⼀些陷阱。
以下内容为跨考⽹独家整理,如您还需更多考研资料,可选择经济学⼀对⼀在线咨询进⾏咨询。
⼀、概念题1.索洛增长模型(Solow growth model )答:索洛增长模型是表明储蓄、⼈⼝增长和技术进步如何影响⼀个经济的产出⽔平及其随着时间推移⽽实现增长的⼀种经济增长模型。
它的基本假定有:(1)社会储蓄函数为S sY =,式中,s 是作为参数的储蓄率;(2)劳动⼒按照⼀个不变的⽐例增长;(3)⽣产的规模报酬不变。
其主要思想是:⼈均投资⽤于资本扩展化和资本深化,当⼈均投资⼤于资本扩展化时,⼈均产出就会增长;当⼈均投资等于资本扩展化时,经济达到稳定状态,⼈均产出不再增长,但总产出会继续增长,增长率等于⼈⼝增长率。
2.稳定状态(steady state )答:索洛模型的稳定状态是指长期中经济增长达到的⼀种均衡状态,在这种状态下,投资等于资本扩展化⽔平,⼈均资本存量维持不变,即()0k sf k k δ?=-=。
这个维持不变的⼈均资本存量k *称之为稳定状态⼈均资本存量。
在稳定状态下,不论经济初始位于哪⼀点,随着时间的推移,经济总是会收敛于该⼈均资本⽔平k *。
在稳定状态,由于⼈均资本存量保持不变,所以⼈均产出也保持不变,即⼈均产出增长率为零。
3.资本的黄⾦律⽔平(golden rule level of capital )答:资本的黄⾦律⽔平是指在稳定状态⼈均消费最⼤化时所对应的⼈均资本⽔平,由经济学家费尔普斯于1961年提出。
曼昆《经济学原理(微观经济学分册)》(第7版)课后习题详解-第8~9篇【圣才出品】
第8篇宏观经济学的数据第23章一国收入的衡量一、概念题1.微观经济学(microeconomics)答:微观经济学指研究家庭和企业如何做出决策,以及他们如何在市场上相互交易的经济学。
微观经济学以市场经济中的单个消费者(或称家户、家庭)和生产者(或称厂商、企业)为研究对象,通过分析他们的消费决策或生产决策,来说明消费品和生产要素的价格的决定及其变动,进而说明稀缺性的资源如何得到最有效的配置。
微观经济学的理论目的是为了论证亚当·斯密“看不见的手”原理,这只“看不见的手”就是价格机制。
因此,微观经济学又被称为价格理论。
微观经济学主要解决的问题可以概括为:生产什么、生产多少、如何生产、为谁生产。
其基本假设为:(1)经济行为个体是进行自由的、分散化决策的理性经济人,即消费者追求自身效用的最大化,生产者追求自身利润的最大化。
(2)完全竞争和完全信息。
微观经济学从这两个基本假定出发对上述问题的解决就构成了它的主要内容,具体地,它包括:①供求规律;②消费者行为理论,它构成消费品价格决定的需求方面;③生产者行为理论或厂商理论,它构成消费品价格决定的供给方面;④生产要素的价格决定理论或分配理论;⑤一般均衡理论;⑥福利经济学;⑦市场失灵和微观经济政策。
2.宏观经济学(macroeconomics)答:宏观经济学是与“微观经济学”相对而言的,指研究整体经济现象,包括通货膨胀、失业和经济增长的经济学。
宏观经济学以国民经济总体作为考察对象,研究经济生活中有关总量的决定与变动,解释失业、通货膨胀、经济增长与波动、国际收支与汇率的决定与变动等经济中的宏观整体问题,所以又称之为总量经济学。
宏观经济学的中心和基础是总供给—总需求模型。
具体来说,宏观经济学主要包括总需求理论、总供给理论、失业与通货膨胀理论、经济周期与经济增长理论、开放经济理论、宏观经济政策等内容。
对宏观经济问题进行分析与研究的历史十分悠久,但现代意义上的宏观经济学直到20世纪30年代才得以形成和发展起来。
曼昆经济学原理第七课后题及答案

答:按 1992 年的价格衡量, 1997 年的实际收入是 72419.7 亿元。
二十三章1 下列每种交易会影响 CDP 的哪一部分 (如果有影响的话 ) 并解释之。
A . 家庭购买了一台新冰箱。
答:家庭购买了一台新冰箱会增加GDP 中的消费 (C) 部分,因为家庭用于家用电器的支出计算在消费的耐用品类中。
B . 杰妮姑妈买了一所新房子。
答:杰妮姑妈买了一所新房子会增加 GDP 中的投资 (1) 部分,因为家庭住宅能长期供人 居住,提供服务。
它比一般耐用消费品的使用寿命更长,因此把住宅房屋的投资计算在 投资中。
C.福特汽车公司由其存货中出售了一部雷鸟牌汽车。
答:福利汽车公司由其存货中出售了一部雷鸟牌汽车会减少现期GDP 中的投资, 因为销售 中间物品存货时,企业的存货投资是负的,因而减少了当期的 GDP 。
C . 你买了一个比萨饼。
答:我买了一个比萨饼会增加 GDP 中的消费 (C) ,因为我用于购买食品的支出计算在消 费的非耐用品类中。
D . 加利福尼亚重新铺设了 101 号高速公路。
答:加利福尼亚重新铺设了 101 号高速公路增加了 GDP 中的政府购买 (G) ,因为修建高 速公路是政府的行为。
E . 你的父母购买了一瓶法国红酒。
答:我的父母购买了一瓶法国红酒会减少 GDP 中的净出口 (NX) ,因为法国红酒是进口食品,它的购买增加了美国的进口。
F . 本田公司扩大其在俄亥俄州马利斯维尔的工厂。
答:本田公司扩大其在俄亥俄州马利斯维尔的工厂增加了GDP 中的净出口 (NX) ,因为本 田公司是一家日本企业,它在美国的投资减少了美国对日本本田汽车的进口,使 NX 增 加2. GDP 组成部分中的“政府购买”并不包括用于社会保障这类转移支付的支出。
想想GDP 的定义,解释为什么转移支付不包括在政府购买内答: 因为转移支付并不是要交换现在生产的物品或劳务, 从宏观经济的角度看, 转移支付就像税收和回扣一样。
经济学原理曼昆课后答案chapter7

经济学原理曼昆课后答案chapter7Problems and Applications1. If an early freeze in California sours the lemon crop, the supply curve for lemons shifts to theleft, as shown in Figure 7-5. The result is a rise in the price of lemons and a decline inconsumer surplus from A + B + C to just A. So consumer surplus declines by the amount B + C.Figure 7-5In the market for lemonade, the higher cost of lemons reduces the supply of lemonade, asshown in Figure 7-6. The result is a rise in the price of lemonade and a decline in consumer surplus from D + E + F to just D, a loss of E + F. Note that an event that affects consumer surplus in one market often has effects on consumer surplus in other markets.Figure 7-62. A rise in the demand for French bread leads to an increase in producer surplus in the marketfor French bread, as shown in Figure 7-7. The shift of the demand curve leads to anincreased price, which increases producer surplus from area A to area A + B + C.Figure 7-7The increased quantity of French bread being sold increases the demand for flour, as shown in Figure 7-8. As a result, the priceof flour rises, increasing producer surplus from area D toD +E + F. Note that an event that affects producer surplus in one market leads to effectson producer surplus in related markets.Figure 7-83. a. Bert’s demand schedule is:Price Quantity DemandedMore than $70$5 to $71$3 to $52$1 to $33$1 or less4Bert’s demand curve is shown in Figure 7-9.Figure 7-9b. When the price of a bottle of water is $4, Bert buys two bottles of water. Hisconsumer surplus is shown as area A in the figure. He values his first bottle ofwater at $7, but pays only $4 for it, so has consumer surplus of $3. He values hissecond bottle of water at $5, but pays only $4 for it, so has consumer surplus of $1.Thus Bert’s total consumer surplus is $3 + $1 = $4, which is the area of A in thefigure.c. When the price of a bottle of water falls from $4 to $2, Bert buys three bottles ofwater, an increase of one. His consumer surplus consists of both areas A and B inthe figure, an increase in the amount of area B. He gets consumer surplus of $5from the first bottle ($7 value minus $2 price), $3 from the second bottle ($5 valueminus $2 price), and $1 from the third bottle ($3 value minus $2 price), for a totalconsumer surplus of $9. Thus consumer surplus rises by $5 (which is the size ofarea B) when the price of a bottle of water falls from $4 to $2.4. a. Er nie’s supply schedule for water is:Price Quantity SuppliedMore than $74$5 to $73$3 to $52$1 to $31Less than $10Ernie’s supply curve is shown in Figure 7-10.Figure 7-10b. When the price of a bottle of water is $4, Ernie sells two bottles of water. Hisproducer surplus is shown as area A in the figure. He receives $4 for his first bottleof water, but it costs only $1 to produce, so Ernie has producer surplus of $3. Healso receives $4 for his second bottle of water, which costs $3 to produce, so he hasproducer surplus of $1. Thus Ernie’s total producer surplusis $3 + $1 = $4, whichis the area of A in the figure.c. When the price of a bottle of water rises from $4 to $6, Ernie sells three bottles ofwater, an increase of one. His producer surplus consists of both areas A and B inthe figure, an increase by the amount of area B. He gets producer surplus of $5from the first bottle ($6 price minus $1 cost), $3 from the second bottle ($6 priceminus $3 cost), and $1 from the third bottle ($6 price minus $5 price), for a totalproducer surplus of $9. Thus producer surplus rises by $5 (which is the size of areaB) when the price of a bottle of water rises from $4 to $6.5. a. From Ernie’s supply schedule and Bert’s demand schedule, the quantity demandedand supplied are:Only a price of $4 brings supply and demand into equilibrium, with an equilibriumquantity of 2.b. At a price of $4, consumer surplus is $4 and producer surplus is $4, as shown inproblems 3 and 4. Total surplus is $4 + $4 = $8.c. If Ernie produced one fewer bottle, his producer surplus would decline to $3, asshown in problem 4. If Bert consumed one fewer bottle, his consumer surpluswould decline to $3, as shown in problem 3. So total surpluswould decline to $3 +$3 = $6.d. If Ernie produced one additional bottle of water, his cost would be $5, but the priceis only $4, so his producer surplus would decline by $1. If Bert consumed oneadditional bottle of water, his value would be $3, but the price is $4, so hisconsumer surplus would decline by $1. So total surplus declines by $1 + $1 = $2.6. a. The effect of falling production costs in the market for stereos results in a shift tothe right in the supply curve, as shown in Figure 7-11. As a result, the equilibriumprice of stereos declines and the equilibrium quantity increases.b. The decline in the price of stereos increases consumer surplus from area A to A + B+ C + D, an increase in the amount B + C + D. Prior to the shift in supply, producer surplus was areas B + E (the area above the supply curve and below the price).After the shift in supply, producer surplus is areas E + F + G. So producer surpluschanges by the amount F + G - B, which may be positive or negative. The increase in quantity increases producer surplus, while the decline in the price reducesproducer surplus. Since consumer surplus rises by B + C + D and producer surplus rises by F + G - B, total surplus rises by C + D + F + G.c. If the supply of stereos is very elastic, then the shift of thesupply curve benefitsconsumers most. To take the most dramatic case, suppose the supply curve were horizontal, as shown in Figure 7-12. Then there is no producer surplus at all.Consumers capture all the benefits of falling production costs, with consumersurplus rising from area A to area A + B.Figure 7-11Figure 7-127. Figure 7-13 shows supply and demand curves for haircuts. Supply equals demand at aquantity of three haircuts and a price between $4 and $5. Firms A, C, and D should cut the hair of Sally Jessy, Jerry, and Montel. Oprah’s willingness to pay is too low and firm B’s costs are too high, so they do not participate. The maximum total surplus is the areabetween the demand and supply curves, which totals $11 ($8 value minus $2 cost for thefirst haircut, plus $7 value minus $3 cost for the second, plus $5 value minus $4 cost for the third).Figure 7-138. a. The effect of falling production costs in the market for computers results in a shift tothe right in the supply curve, as shown in Figure 7-14. As a result, the equilibriumprice of computers declines and the equilibrium quantity increases. The decline inthe price of computers increases consumer surplus from area A to A + B + C + D, anincrease in the amount B + C + D.Figure 7-14Prior to the shift in supply, producer surplus was areas B + E (the area above thesupply curve and below the price). After the shift in supply, producer surplus isareas E + F + G. So producer surplus changes by the amount F + G - B, which maybe positive or negative. The increase in quantity increases producer surplus, whilethe decline in the price reduces producer surplus. Since consumer surplus rises byB +C +D and producer surplus rises by F + G - B, total surplus rises by C + D + F + G.Figure 7-15b. Since adding machines are substitutes for computers, the decline in the price ofcomputers means that people substitute computers for adding machines, shiftingthe demand for adding machines to the left, as shown in Figure 7-15. The result isa decline in both the equilibrium price and equilibrium quantity of adding machines.Consumer surplus in the adding-machine market changesfrom area A + B to A + C, a net gain of C - B. Producer surplus changes from area C + D + E to area E, a net loss of C + D. Adding machine producers are sad about technological advance in computers because their producer surplus declines.c. Since software and computers are complements, the decline in the price andincrease in the quantity of computers means that people’s demand for softwareincreases, shifting the demand for software to the right, as shown in Figure 7-16.The result is an increase in both the price and quantity of software. Consumersurplus in the software market changes from B + C to A + B, a net increase of A - C.Producer surplus changes from E to C + D + E, an increase of C + D, so softwareproducers should be happy about the technological progress in computers.d. Yes, this analysis helps explain why Bill Gates is one the world’s richest men, sincehis company pr oduces a lot of software that’s a complement with computers andthere has been tremendous technological advance in computers.Figure 7-169. a. Figure 7-17 illustrates the demand for medical care. If each procedure has a priceof $100, quantity demanded will be Q1 procedures.b. If consumers pay only $20 per procedure, the quantity demanded will be Q2procedures. Since the cost to society is $100, the number of proceduresperformed is too large to maximize total surplus. The quantity that maximizestotal surplus is Q1 procedures, which is less than Q2.c. The use of medical care is excessive in the sense that consumers get procedureswhose value is less than the cost of producing them. As a result, the economy’stotal surplus is reduced.d. To prevent this excessive use, the consumer must bear the marginal cost of theprocedure. But this would require eliminating insurance. Another possibilitywould be that the insurance company, which pays most of the marginal cost of theprocedure ($80, in this case) could decide whether the procedure should beperformed. But the insurance company doesn’t get the benefits of the procedure,so its decisions may not reflect the value to the consumer.10. a. Figure 7-18 illustrates the effect of the drought. The supply curve shifts to the left,leading to a rise in the equilibrium price from P1 to P2 and a decline in theequilibrium quantity from Q1 to Q2.b. If the price of water is not allowed to change, there will be an excess demand forwater, with the shortage shown on the figure as the difference between Q1 and Q3.c. The system for allocating water is inefficient because it no longer allocates water tothose who value it most highly. Some people who value water at more than itscost of productio n will be unable to obtain it, so society’s total surplus isn’tmaximized.The allocation system seems unfair as well. Water is allocated simply on pastusage, rewarding past wastefulness. If a family’s demand for water increases, saybecause of an increas e in family size, the policy doesn’t allow them to obtain morewater. Poor families, who probably used water mostly for necessary uses likedrinking, would suffer more than wealthier families who would have to cut backonly on luxury uses of water like operating backyard fountains and pools.However, the policy also keeps the price of water lower, which benefits poorfamilies, since otherwise more of their family budget would have to go for water.d. If the city allowed the price of water to rise to its equilibrium price P2, the allocationwould be more efficient. Quantity supplied would equal quantity demanded andthere would be no shortage. Total surplus would be maximized.Whether the market allocation would be more or less fair than the proportionatereduction in water under the old policy is difficult to say, but it is likely to be morefair. Notice that the quantity supplied would be higher (Q2) in this case than under the water restrictions (Q3), so there’s less reduction in water usage. To make themarket solution even more fair, the government could provide increased tax reliefor welfare payments for poor families who suffer from paying the higher waterprices.。
曼昆经济学原理第七章(第七版) PPT

7.1 消费者剩余
• 7.1.2用需求曲线衡量消费者剩余
• 各位看官原谅,由于内容假设你的朋友正在考虑两家手机服务提供商.A提供商每月 收取固定服务费120美元,无论打多少次电话都是如此.B提 供商不收取固定的服务费,而是每打1分钟电话费1美元.你 的朋友对每个月打电话时间的需求由方程Qd=150-50P给 出,其中P是每分钟电话的价格. a,对每个提供商,你朋友多打1分钟电话的费用是多少? b,根据你对a的回答,你朋友用每个提供商的服务会打多少 分钟电话? c,他每个月给每个提供商付费多少? d,他从每个提供商得到的消费剩余是多少? e,你会推荐选择哪个提供商?为什么?
曼昆经济学原理第七章(第七版)
大纲
• 引言 • 7.1 消费者剩余 • 7.2 生产者剩余 • 6.3 市场效率
引言
• 1、本书第一章引言中,经济学的定义是:研究社会如何管 理自己的稀缺资源。
• 2、换句话说,社会要对稀缺资源进行管理的目的是为了最 大限度地实现效率和平等这样两个目标。
• 3、如何考察一个市场或政府颁布的一项政策,是否最大限 度地实现了资源配置的效率和平等这样两个目标,需要用 科学的方法进行分析。
• C、(白话版)surplus若翻译为“盈余”可能理解起来更方 便些。消费者剩余说到底就是消费者觉得自己占了多少便宜, 因为愿意支付多少钱是每个人内心对商品价值的评价,若内 心估价较高,而实际价格较低,那购买此商品的“盈余”就 大了,占了大便宜,内心感觉很美好,这就是享受到市场经 济的“福利”了。所以商品要卖给对它评价最高者,因为这 样可以使福利最大化。
• A、 由Qd=150-50P,这个方程可以得出以下结论:P哪怕 是无限接近于0,Q也只能无限接近于150,由于打电话的 分钟只能按个位数计算,所以选择A提供商的话最多打149 分钟电话。(可能会有人说,超过或等于150分钟后的每 分钟就是0元啊,还是请回看一下方程式,P不可能为负数, 否则提供商要赔死了,所以方程式已经限定了最多150分 钟的,这时P=0,实际上这时已经是极限值了;综上所述: 选择A提供商,最多打149分钟电话,再多打1分钟的费用 是0美元。选择B提供商,根据方程得出,P=1时,共打100 分钟电话,再多打1分钟的费用仍是1美元。
- 1、下载文档前请自行甄别文档内容的完整性,平台不提供额外的编辑、内容补充、找答案等附加服务。
- 2、"仅部分预览"的文档,不可在线预览部分如存在完整性等问题,可反馈申请退款(可完整预览的文档不适用该条件!)。
- 3、如文档侵犯您的权益,请联系客服反馈,我们会尽快为您处理(人工客服工作时间:9:00-18:30)。
第7章消费者、生产者与市场效率
7.1知识结构导图
7.2考点难点归纳
考点1:消费者剩余与生产者剩余
(1)消费者剩余
消费者剩余等于买者对一种物品的支付意愿减去其实际为此所支付的量。
支付意愿是买者愿意为某种物品支付的最高价格,衡量买者对物品的评价。
消费者剩余可用几何图形表示,通过求出需求曲线以下、市场价格以上的面积,可计算消费者剩余。
价格下降可增加消费者剩余,这种消费者剩余的增加由两部分构成:①原有消费者可以为要购买的量少支付而得到了更多的剩余;②新的买者由于现在价格低于他们的支付意愿而进入市场,新的消费者剩余出现。
消费者剩余衡量买者参与市场中得到的利益,反映了买者的经济福利。
(2)生产者剩余
生产者剩余等于卖者出售其物品得到的量减去它们的生产成本。
生产成本是卖者为了生产一种物品而必须放弃的所有东西的价值,生产者剩余即生产者在提供一定数量的某种产品时实际接受的总支付和愿意接受的最小总支付之间的差额,可用几何图形表示,通过求出市场价格以下、供给曲线以上的面积,可计算生产者剩余。
价格上升可以增加生产者剩余,这种生产者剩余的增加由两部分构成:①原有卖者可以为要出卖的量而得到了更多的利益;②一些新卖者进入市场,新的生产者剩余出现。
生产者剩余衡量卖者从参与市场中得到的利益,反映了卖者的经济福利。
【名师点读】
消费者剩余、生产者剩余都是考试中的频繁考点,经常以概念题或计算题的形式出现,考生在复习过程中不仅要对该考点理解透彻,还应准确作图与分析计算。
相关考研真题如下:1.【概念题】消费者剩余[中央民族大学2015研;华东理工大学2015研]
2.【计算题】考虑以下古诺竞争模型。
市场中有N个企业,生产相同的产品,均没有生产成本。
市场需求函数为p=a-bQ,其中a,b>0,Q为行业总产量。
如果企业同时展开产量竞争,那么:
(1)均衡时价格是多少?
(2)此时消费者剩余是多少?[中央财经大学2014研]
考点2:市场效率
(1)市场的总剩余是用买者支付意愿衡量的买者对物品的总评价减去卖者提供这些物品的成本。
总剩余常被作为社会经济福利的衡量指标。
消费者剩余=买者的评价-买者支付的量;生产者剩余=卖者得到的量-卖者的成本;总剩余=消费者剩余+生产者剩余=买者的评价-卖者的成本。
(2)使消费者和生产者剩余的总和最大化的资源配置可以说是有效率的。
自由市场生产的产量是使消费者和生产者剩余总和最大化的产量。
①自由市场把物品的供给分配给对这些物品评价最高的买者,这种评价用买者的支付意愿来表示。
②自由市场将物品的需求分配给可以以最低成本生产这些物品的卖者。
因此,在生产与销售量达到市场均衡时,社会计划者不能通过改善买者之间的消费配置或卖者的生产配置来增加社会福利。
③自由市场生产的产量是使消费者和生产者剩余总和最大化的产量。
(3)供给与需求的均衡使消费者与生产者剩余的总和最大化。
即市场中“看不见的手”指引买者与卖者有效地配置资源。
(4)自由市场可能无效率的原因有两个:
①市场可能是不完全竞争的。
如果个别买者或卖者(或者他们一小群人)可以影响价格,他们就有市场势力,而且他们可以使价格和数量背离均衡。
②市场会起负作用或外部性,这会影响那些根本没有参与市场的人。
市场上的买者和卖者没有考虑污染之类的负作用,以致市场均衡也许对整个社会没有效率。
【名师点读】
本考点为基础性知识,除对总剩余计算的考查外,直接考查的频率不高,但仍需要理解
透彻。
一般会结合福利经济学、帕累托最优或市场失灵等其他相关内容,以概念题、判断题或者论述题的形式对本考点进行考查。
7.3课后习题详解
一、概念题
1.福利经济学(welfare economics)
答:福利经济学是一种规范经济学,研究的是整个经济的资源配置与个人福利的关系,特别是市场经济体系的资源配置与福利的关系,以及与此有关的各种政策问题。
福利经济学研究要素在不同厂商之间的最优分配以及产品在不同家庭之间的最优配置。
它的主要特点是:从一定的价值判断出发建立理论体系,在边际效用论的基础上建立福利概念,依据既定的社会目标和福利理论制定经济政策。
20世纪初,西方国家为调和日益尖锐的社会矛盾,福利经济学应运而生。
英国经济学家A·C·庇古是福利经济学的创始人和主要代表。
庇古1920年出版的《福利经济学》是福利经济学产生的标志。
庇古的福利经济学有两个基本命题:①国民收入总量愈大,社会经济福利愈大;②国民收入分配愈均等,社会经济福利愈大。
由于在1929~1933年的大危机以后,庇古的理论已经不能完全适应需要,因此他的理论被称为旧福利经济学。
与庇古的旧福利经济学相对的是其后出现的新福利经济学,代表人物有勒纳、卡尔多、希克斯等。
2.支付意愿(willingness to pay)
答:支付意愿指买者愿意为某种商品支付的最高价格。
支付意愿是衡量买者对物品的评价,评价越高支付意愿越强,愿意支付的价格越高;反之,评价越低支付意愿越弱,愿意支
付的价格越低。
3.消费者剩余(consumer surplus)
答:消费者剩余指消费者购买一定数量的某种产品时愿意支付的价格与其实际所支付的价格之间的差额。
由于各种物品的边际效用会递减,消费者对购买不同数量的同一种商品,往往愿意支付不同的价格,但市场上的商品一般只有一个价格,这便产生了消费者剩余。
例如在消费者持续购买某种商品时,根据边际效用递减规律,对于消费者来说,前面购买的单位商品要比最后购买的单位带来更多的效用。
因此,消费者愿意对前面购买的单位付出较多的价格,而一般商品的价格是固定的,那么在前面每一单位中消费者就可能因为所付的价格低于所愿意支付的价格而得到剩余。
若某产品需求函数为P=D(x),P 1和X 1分别代表成交价格和成交量,则从X=0到X =X 1时,
10()x D x dx ⎰
是消费者愿意支付的数额,P 1X 1为实际支付的数额,于是消费者剩余(用CS 表示)为111
0()x D x dx P X -⎰
4.成本(cost)答:成本也称为生产成本,指生产活动中用于购买各种生产要素的支出总和。
生产要素包括劳动、资本、土地和企业家才能。
生产活动中所使用的生产要素的价格包括付出劳动所得到的工资、付出资本所得到的利息、付出土地所得到的地租和付出企业家才能所得到的利润这四部分。
因此西方经济学中所说的成本,包括利润在内。
生产成本中所包括的利润称为
正常利润,它是作为企业家才能这一生产要素的报酬而被包括在成本之内的。
只有超额利润才不包含在成本以内。
在分析成本时,可以把成本分为总成本、平均成本和边际成本。
总成本是生产某一特定产量所需要的成本总额,它包括固定成本与可变成本。
平均成本是生产平均每个单位产品的成本,用总成本除以产量,就得出平均成本。
平均成本包括平均固定成本和平均可变成本。
边际成本是生产最后增加一个单位产品所花费的成本,也就是说,边际成本是增加一个单位产量所引起的总成本的增加量。
5.生产者剩余(producer surplus)
答:生产者剩余指厂商在提供一定数量的某种产品时实际接受的总支付和愿意接受的最小总支付之间的差额。
它通常用市场价格线以下、SMC曲线以上的面积来表示,如图7-1中的阴影部分面积所示。
图7-1生产者剩余
其原因在于:在生产中,只要价格大于边际成本,厂商进行生产总是有利的。
这时,厂商就可以得到生产者剩余。
因此,在图7-1中,在产量为零到最大产量Q0之间的价格线以下和供给曲线(即短期边际成本曲线)以上的阴影部分面积表示生产者剩余。
其中,价格线以下的矩形面积OP0EQ0表示总收益即厂商实际接受的总支付,供给曲线(即短期边际成本。