2007优秀的数学建模论文
2007数学建模优秀论文(最优公交路线选择)
目录 最优公交路线选择 .................................................................................................................... 1 1. 问题重述 ............................................................................................................................. 3 2. 模型假设 ............................................................................................ 3 3. 模型一:基于点搜索的多目标优化模型 ......................................................................... 4
3.3 问题三 .................................................................................................................... 11 3.3.1 问题分析: .................................................................................................. 11 3.3.2 图形改动: .................................................................................................. 12 3.3.3 建模求解: .................................................................................................. 13
数学建模全国赛07年A题一等奖论文

关于中国人口增长趋势的研究【摘要】本文从中国的实际情况和人口增长的特点出发,针对中国未来人口的老龄化、出生人口性别比以及乡村人口城镇化等,提出了Logistic、灰色预测、动态模拟等方法进行建模预测。
首先,本文建立了Logistic阻滞增长模型,在最简单的假设下,依照中国人口的历史数据,运用线形最小二乘法对其进行拟合,对2007至2020年的人口数目进行了预测,得出在2015年时,中国人口有13.59亿。
在此模型中,由于并没有考虑人口的年龄、出生人数男女比例等因素,只是粗略的进行了预测,所以只对中短期人口做了预测,理论上很好,实用性不强,有一定的局限性。
然后,为了减少人口的出生和死亡这些随机事件对预测的影响,本文建立了GM(1,1) 灰色预测模型,对2007至2050年的人口数目进行了预测,同时还用1990至2005年的人口数据对模型进行了误差检验,结果表明,此模型的精度较高,适合中长期的预测,得出2030年时,中国人口有14.135亿。
与阻滞增长模型相同,本模型也没有考虑年龄一类的因素,只是做出了人口总数的预测,没有进一步深入。
为了对人口结构、男女比例、人口老龄化等作深入研究,本文利用动态模拟的方法建立模型三,并对数据作了如下处理:取平均消除异常值、对死亡率拟合、求出2001年市镇乡男女各年龄人口数目、城镇化水平拟合。
在此基础上,预测出人口的峰值,适婚年龄的男女数量的差值,人口老龄化程度,城镇化水平,人口抚养比以及我国“人口红利”时期。
在模型求解的过程中,还对政府部门提出了一些有针对性的建议。
此模型可以对未来人口做出细致的预测,但是需要处理的数据量较大,并且对初始数据的准确性要求较高。
接着,我们对对模型三进行了改进,考虑人为因素的作用,加入控制因子,使得所预测的结果更具有实际意义。
在灵敏度分析中,首先针对死亡率发展因子θ进行了灵敏度分析,发现人口数量对于θ的灵敏度并不高,然后对男女出生比例进行灵敏度分析得出其灵敏度系数为0.8850,最后对妇女生育率进行了灵敏度分析,发现在生育率在由低到高的变化过程中,其灵敏度在不断增大。
2007美国大学生数学建模竞赛B题特等奖论文
American Airlines' Next Top ModelSara J. BeckSpencer D. K'BurgAlex B. TwistUniversity of Puget SoundTacoma, WAAdvisor: Michael Z. SpiveySummaryWe design a simulation that replicates the behavior of passengers boarding airplanes of different sizes according to procedures currently implemented, as well as a plan not currently in use. Variables in our model are deterministic or stochastic and include walking time, stowage time, and seating time. Boarding delays are measured as the sum of these variables. We physically model and observe common interactions to accurately reflect boarding time.We run 500 simulations for various combinations of airplane sizes and boarding plans. We analyze the sensitivity of each boarding algorithm, as well as the passenger movement algorithm, for a wide range of plane sizes and configurations. We use the simulation results to compare the effectiveness of the boarding plans. We find that for all plane sizes, the novel boarding plan Roller Coaster is the most efficient. The Roller Coaster algorithm essentially modifies the outside-in boarding method. The passengers line up before they board the plane and then board the plane by letter group. This allows most interferences to be avoided. It loads a small plane 67% faster than the next best option, a midsize plane 37% faster than the next best option, and a large plane 35% faster than the next best option.IntroductionThe objectives in our study are:To board (and deboard) various sizes of plane as quickly as possible."* To find a boarding plan that is both efficient (fast) and simple for the passengers.With this in mind:"* We investigate the time for a passenger to stow their luggage and clear the aisle."* We investigate the time for a passenger to clear the aisle when another passenger is seated between them and their seat.* We review the current boarding techniques used by airlines.* We study the floor layout of planes of three different sizes to compare any difference between the efficiency of a given boarding plan as plane size increases and layouts vary."* We construct a simulator that mimics typical passenger behavior during the boarding processes under different techniques."* We realize that there is not very much time savings possible in deboarding while maintaining customer satisfaction."* We calculate the time elapsed for a given plane to load under a given boarding plan by tracking and penalizing the different types of interferences that occur during the simulations."* As an alternative to the boarding techniques currently employed, we suggest an alternative plan andassess it using our simulator."* We make recommendations regarding the algorithms that proved most efficient for small, midsize, and large planes.Interferences and Delays for BoardingThere are two basic causes for interference-someone blocking a passenger,in an aisle and someone blocking a passenger in a row. Aisle interference is caused when the passenger ahead of you has stopped moving and is preventing you from continuing down the aisle towards the row with your seat. Row interference is caused when you have reached the correct row but already-seated passengers between the aisle and your seat are preventing you from immediately taking your seat. A major cause of aisle interference is a passenger experiencing rowinterference.We conducted experiments, using lined-up rows of chairs to simulate rows in an airplane and a team member with outstretched arms to act as an overhead compartment, to estimate parameters for the delays cause by these actions. The times that we found through our experimentation are given in Table 1.We use these times in our simulation to model the speed at which a plane can be boarded. We model separately the delays caused by aisle interference and row interference. Both are simulated using a mixed distribution definedas follows:Y = min{2, X},where X is a normally distributed random variable whose mean and standard deviation are fixed in our experiments. We opt for the distribution being partially normal with a minimum of 2 after reasoning that other alternative and common distributions (such as the exponential) are too prone to throw a small value, which is unrealistic. We find that the average row interference time is approximately 4 s with a standard deviation of 2 s, while the average aisle interference time is approximately 7 s with a standard deviation of 4 s. These values are slightly adjusted based on our team's cumulative experience on airplanes.Typical Plane ConfigurationsEssential to our model are industry standards regarding common layouts of passenger aircraft of varied sizes. We use an Airbus 320 plane to model a small plane (85-210 passengers) and the Boeing 747 for a midsize plane (210-330 passengers). Because of the lack of large planes available on the market, we modify the Boeing 747 by eliminating the first-class section and extending the coach section to fill the entire plane. This puts the Boeing 747 close to its maximum capacity. This modified Boeing 747 has 55 rows, all with the same dimensions as the coach section in the standard Boeing 747. Airbus is in the process of designing planes that can hold up to 800 passengers. The Airbus A380 is a double-decker with occupancy of 555 people in three different classes; but we exclude double-decker models from our simulation because it is the larger, bottom deck that is the limiting factor, not the smaller upper deck.Current Boarding TechniquesWe examine the following industry boarding procedures:* random-order* outside-in* back-to-front (for several group sizes)Additionally, we explore this innovative technique not currently used by airlines:* "Roller Coaster" boarding: Passengers are put in order before they board the plane in a style much like those used by theme parks in filling roller coasters.Passengers are ordered from back of the plane to front, and they board in seatletter groups. This is a modified outside-in technique, the difference being that passengers in the same group are ordered before boarding. Figure 1 shows how this ordering could take place. By doing this, most interferencesare avoided.Current Deboarding TechniquesPlanes are currently deboarded in an aisle-to-window and front-to-back order. This deboarding method comes out of the passengers' desire to be off the plane as quickly as possible. Any modification of this technique could leadto customer dissatisfaction, since passengers may be forced to wait while others seated behind them on theplane are deboarding.Boarding SimulationWe search for the optimal boarding technique by designing a simulation that models the boarding process and running the simulation under different plane configurations and sizes along with different boarding algorithms. We then compare which algorithms yielded the most efficient boarding process.AssumptionsThe environment within a plane during the boarding process is far too unpredictable to be modeled accurately. To make our model more tractable,we make the following simplifying assumptions:"* There is no first-class or special-needs seating. Because the standard industry practice is to board these passengers first, and because they generally make up a small portion of the overall plane capacity, any changes in the overall boarding technique will not apply to these passengers."* All passengers board when their boarding group is called. No passengers arrive late or try to board the plane early."* Passengers do not pass each other in the aisles; the aisles are too narrow."* There are no gaps between boarding groups. Airline staff call a new boarding group before the previous boarding group has finished boarding the plane."* Passengers do not travel in groups. Often, airlines allow passengers boarding with groups, especially with younger children, to board in a manner convenient for them rather than in accordance with the boarding plan. These events are too unpredictable to model precisely."* The plane is full. A full plane would typically cause the most passenger interferences, allowing us to view the worst-case scenario in our model."* Every row contains the same number of seats. In reality, the number of seats in a row varies due to engineering reasons or to accommodate luxury-class passengers.ImplementationWe formulate the boarding process as follows:"* The layout of a plane is represented by a matrix, with the rows representing rows of seats, and each column describing whether a row is next to the window, aisle, etc. The specific dimensions vary with each plane type. Integer parameters track which columns are aisles."* The line of passengers waiting to board is represented by an ordered array of integers that shrinks appropriately as they board the plane."* The boarding technique is modeled in a matrix identical in size to the matrix representing the layout of the plane. This matrix is full of positive integers, one for each passenger, assigned to a specific submatrix, representing each passenger's boarding group location. Within each of these submatrices, seating is assigned randomly torepresent the random order in which passengers line up when their boarding groups are called."* Interferences are counted in every location where they occur within the matrix representing the plane layout. These interferences are then cast into our probability distribution defined above, which gives ameasurement of time delay."* Passengers wait for interferences around them before moving closer to their assigned seats; if an interference is found, the passenger will wait until the time delay has finished counting down to 0."* The simulation ends when all delays caused by interferences have counted down to 0 and all passengers have taken their assigned seats.Strengths and Weaknesses of the ModelStrengths"* It is robust for all plane configurations and sizes. The boarding algorithms that we design can be implemented on a wide variety of planes with minimal effort. Furthermore, the model yields reasonable results as we adjust theparameters of the plane; for example, larger planes require more time to board, while planes with more aisles can load more quickly than similarlysized planes with fewer aisles."* It allows for reasonable amounts of variance in passenger behavior. While with more thorough experimentation a superior stochastic distribution describing the delays associated with interferences could be found, our simulationcan be readily altered to incorporate such advances."* It is simple. We made an effort to minimize the complexity of our simulation, allowing us to run more simulations during a greater time period and mini mizing the risk of exceptions and errors occurring."* It is fairly realistic. Watching the model execute, we can observe passengers boarding the plane, bumping into each other, taking time to load their baggage, and waiting around as passengers in front of them move out of theway. Its ability to incorporate such complex behavior and reduce it are key to completing our objective. Weaknesses"* It does not account for passengers other than economy-class passengers."* It cannot simulate structural differences in the boarding gates which couldpossibly speed up the boarding process. For instance, some airlines in Europeboard planes from two different entrances at once."* It cannot account for people being late to the boarding gate."* It does not account for passenger preferences or satisfaction.Results and Data AnalysisFor each plane layout and boarding algorithm, we ran 500 boarding simulations,calculating mean time and standard deviation. The latter is important because the reliability of plane loading is important for scheduling flights.We simulated the back-to-front method for several possible group sizes.Because of the difference in thenumber of rows in the planes, not all group size possibilities could be implemented on all planes.Small PlaneFor the small plane, Figure 2 shows that all boarding techniques except for the Roller Coaster slowed the boarding process compared to the random boarding process. As more and more structure is added to the boarding process, while passenger seat assignments continue to be random within each of the boarding groups, passenger interference backs up more and more. When passengers board randomly, gaps are created between passengers as some move to the back while others seat themselves immediately upon entering the plane, preventing any more from stepping off of the gate and onto the plane. These gaps prevent passengers who board early and must travel to the back of the plane from causing interference with many passengers behind them. However, when we implement the Roller Coaster algorithm, seat interference is eliminated, with the only passenger causing aisle interference being the very last one to boardfrom each group.Interestingly, the small plane's boarding times for all algorithms are greater than their respective boarding time for the midsize plane! This is because the number of seats per row per aisle is greater in the small plane than in the midsize plane.Midsize PlaneThe results experienced from the simulations of the mid-sized plane areshown in Figure 3 and are comparable to those experienced by the small plane.Again, the Roller Coaster method proved the most effective.Large PlaneFigure 4 shows that the boarding time for a large aircraft, unlike the other plane configurations, drops off when moving from the random boarding algorithm to the outside-in boarding algorithm. Observing the movements by the passengers in the simulation, it is clear that because of the greater number of passengers in this plane, gaps are more likely to form between passengers in the aisles, allowing passengers to move unimpeded by those already on board.However, both instances of back-to-front boarding created too much structure to allow these gaps to form again. Again, because of the elimination of row interference it provides for, Roller Coaster proved to be the most effective boarding method.OverallThe Roller Coaster boarding algorithm is the fastest algorithm for any plane pared to the next fastest boarding procedure, it is 35% faster for a large plane, 37% faster for a midsize plane, and 67% faster for a small plane. The Roller Coaster boarding procedure also has the added benefit of very low standard deviation, thus allowing airlines a more reliable boarding time. The boarding time for the back-to-front algorithms increases with the number of boarding groups and is always slower than a random boarding procedure.The idea behind a back-to-front boarding algorithm is that interference at the front of the plane is avoided until passengers in the back sections are already on the plane. A flaw in this procedure is that having everyone line up in the plane can cause a bottleneck that actually increases the loading time. The outside-in ("Wilma," or window, middle, aisle) algorithm performs better than the random boarding procedure only for the large plane. The benefit of the random procedure is that it evenly distributes interferences throughout theplane, so that they are less likely to impact very many passengers.Validation and Sensitivity AnalysisWe developed a test plane configuration with the sole purpose of implementing our boarding algorithms on planes of all sizes, varying from 24 to 600 passengers with both one or two aisles.We also examined capacities as low as 70%; the trends that we see at full capacity are reflected at these lower capacities. The back-to-front and outside-in algorithms do start to perform better; but this increase inperformance is relatively small, and the Roller Coaster algorithm still substantially outperforms them. Underall circumstances, the algorithms we test are robust. That is, they assign passenger to seats in accordance with the intention of the boarding plans used by airlines and move passengers in a realistic manner.RecommendationsWe recommend that the Roller Coaster boarding plan be implemented for planes of all sizes and configurations for boarding non-luxury-class and nonspecial needs passengers. As planes increase in size, its margin of success in comparison to the next best method decreases; but we are confident that the Roller Coaster method will prove robust. We recommend boarding groups that are traveling together before boarding the rest of the plane, as such groups would cause interferences that slow the boarding. Ideally, such groups would be ordered before boarding.Future WorkIt is inevitable that some passengers will arrive late and not board the plane at their scheduled time. Additionally, we believe that the amount of carry-on baggage permitted would have a larger effect on the boarding time than the specific boarding plan implemented-modeling this would prove insightful.We also recommend modifying the simulation to reflect groups of people traveling (and boarding) together; this is especially important to the Roller Coaster boarding procedure, and why we recommend boarding groups before boarding the rest of the plane.。
优秀的数学建模论文范文(通用8篇)
优秀的数学建模论文范文第1篇摘要:将数学建模思想融入高等数学的教学中来,是目前大学数学教育的重要教学方式。
建模思想的有效应用,不仅显著提高了学生应用数学模式解决实际问题的能力,还在培养大学生发散思维能力和综合素质方面起到重要作用。
本文试从当前高等数学教学现状着手,分析在高等数学中融入建模思想的重要性,并从教学实践中给出相应的教学方法,以期能给同行教师们一些帮助。
关键词:数学建模;高等数学;教学研究一、引言建模思想使高等数学教育的基础与本质。
从目前情况来看,将数学建模思想融入高等教学中的趋势越来越明显。
但是在实际的教学过程中,大部分高校的数学教育仍处在传统的理论知识简单传授阶段。
其教学成果与社会实践还是有脱节的现象存在,难以让学生学以致用,感受到应用数学在现实生活中的魅力,这种教学方式需要亟待改善。
二、高等数学教学现状高等数学是现在大学数学教育中的基础课程,也是一门必修的课程。
他能为其他理工科专业的学生提供很多种解题方式与解题思路,是很多专业,如自动化工程、机械工程、计算机、电气化等必不可少的基础课程。
同时,现实生活中也有很多方面都涉及高数的运算,如,银行理财基金的使用问题、彩票的概率计算问题等,从这些方面都可以看出人们不能仅仅把高数看成是一门学科而已,它还与日常生活各个方面有重要的联系。
但现在很多学校仍以应试教育为主,采取填鸭式教学方式,加上高数的教材并没有与时俱进,将其与生活的关系融入教材内,使学生无法意识到高数的重要性以及高数在日常生活中的魅力,因此产生排斥甚至对抗的心理,只是在临考前突击而已。
因此,对高数进行教学改革是十分有必要的,而且怎么改,怎么让学生发现高数的魅力,并积极主动学习高数也是作为教师所面临的一个重大问题。
三、将数学建模思想融入高等数学的重要性第一,能够激发学生学习高数的兴趣。
建模思想实际上是使用数学语言来对生活中的实际现象进行描述的过程。
把建模思想应用到高等数学的学习中,能够让学生们在日常生活中理解数学的实际应用状况与解决日常生活问题的方便性,让学生们了解到高数并不只是一门课程,而是整个日常生活的基础。
07年全国数学建模优秀论文

基于网络拓扑的公交查询方案摘 要公交、地铁线路和站点组成了一个极其复杂的网络结构,如何从这个网络的任意两 个节点找到一条最优的乘车方案,传统遍历算法是很费时甚至不可行的,必须采取一种 高效的方法。
本文运用了网络拓扑的知识来分析问题,结合隐含枚举,双向搜索遍历, 动态规划方法减少运算量,较好的解决了这一问题。
对于问题一,我们采用了网络拓扑进行分析,采用隐含枚举,双向搜索的方法,建 立了两点之间线路搜索的动态规划多目标模型,设计了基于直达站点间点—点最优距离 的广度优先搜索算法,得出了较好的结果,如:L436L176 311L15L201L41 4135S3359S1828S3359S 1784S 1828 S3359S 1327S 1790S 1828 ® ¾¾¾®¾¾¾® ¾¾®¾¾¾®¾¾¾ ® : 对于问题二,我们在问题一已经给出的纯公交路径基础上,采取了增加地铁连通站 点集合(两两可达)的方法,建立了求经地铁中转的最优线路的多目标模型,设计了基 于搜索地铁出入站点的最优路径算法,得到了令人满意的结果,如:T2 8S0087S3676S0087D27D36S3676 ® ®¾¾®® : 对于问题三,我们采用了网络拓扑进行分析,确立了两点之间的距离正比于步行时 间的原则,在此基础上,建立了基于归并相邻站点的最优线路的改良模型。
综合我们使用的各种方法,可以把原来很难实现的求解过程复杂度缩小数个数量 级,使算法可行并可以搜索更多的区域,最终得到了令人满意的路径。
关键词:网络拓扑 隐含遍历 动态规划 点—点最优距离 广度优先搜索 最优路径1.问题提出与分析2008年奥运会在京举行期间,将有大量游客到北京,北京公共交通系统的发展极大 的满足了游客们在京的出行需求,同时也产生了多条公交线路的选择问题。
2007年全国大学生数学建模竞赛优秀论文集

1 问题重述(略)
2 模型假设
(1)将出生人口数、死亡人口数、老龄化、人口迁移以及性别比作为衡量人口 状态变化的全部因素,不再考虑其他方面对人口状态的影响;
(2)所有表征和影响人口变化的因素都是在整个社会人口的平均意义下确定的; (3)人口死亡率函数只依赖于各个年龄段,而与时间的流逝无关,即针对同一
2000 126743 65437
51.63 61306
48.37 45906 36.22 80837 63.78
2001 127627 65672
51.46 61955
48.54 48064 37.66 79563 62.34
2002 128453 66115
51.47 62338
48.53 50212 39.09 78241 60.91
2007 年我校共有 29 队参赛,11 个队参加甲组比赛,获全国一等奖 2 项、全国二等奖 1 项、重庆市一等奖 6 项;18 个队参加乙组比赛,获全国一等奖 3 项、重庆市一等奖 5 项、 重庆市二等奖 6 项。我校获得全国奖的比例高出全国平均水平 11.37 个百分点。我校参赛队 数占重庆市高校参赛队数的 5.66%,获全国一等奖队数的比例却高达 35.71%,彰显我校实力, 为我校争得荣誉。
2007 年获全国甲组二等奖 关于我国人口增长问题的研究………………………………………弓毅等 (84)
中国人口增长的预测模型
李阳、罗虎、陈道森 指导教师:罗万春
摘要:
本文研究的是根据中国实际情况,结合近年中国人口发展出现的新特点(老 龄化加速、出生人口性别比持续升高以及乡村人口城镇化等),对中国人口的增 长趋势做出中短期及长期预测的问题。首先,我们扩充了中国历年的总人口数据, 建立了 BP 神经网络模型,对中国短、中、长期的人口增长分别做了简单预测; 其次借用 Logistic 人口增长模型,将各种影响人口发展的因素归结到环境的容量 因素中,建立了符合中国实际情况的人口增长模型,并编程求解。之后,我们对 宋健人口模型进行了改进,建立了一阶偏微分方程模型,并借用高斯赛德尔迭 代法的思想将已预测出的数据加以迭代来预测下一年的数据,使该模型具有更好 的时效性,利用 Excel 对所给数据进行统计和筛选,并用 Matlab6.5 编程实现, 对中国人口发展进行了预测。最后我们以改进的宋健模型为基础,将农村人口城 镇化的因素纳入考虑范围,提出了人口城镇化影响因子,从而建立了人口城镇化 进程中的人口增长模型四。
2007数学建模A题CUMCM全国二等奖

3 of page 45
f X (mi (t ),i di (t )) ——组间交换人口数; TFR——总和生育率;
S (t , a ) ——幸存矩阵; C (t , a ) ——人口组间交换矩阵;
mi (t ) ——组别迁入人口数; di (t ) ——组别迁出人口数;
μinf ant (t ) ——第 t 年代的婴儿死亡率; μ0 (t ) ——第 t 年代不能存活到 t 时代统计时刻的婴儿比率;
k =1
。
则 GM (1,1) 模型的微分方程为: dX (1) + aX (1) = u dt
2007CUMCM 全国二等奖
湖南大学
程雨
倪剑光
何良勇
湖南大学数学建模网站
4 of page 45
系数向量为:
a = [a , u]
Λ
T
。累加矩阵B为:
⎡ −[ X (1) (1) + X (1) (2)] 1⎤ ⎢ ⎥ −[ X (1) (2) + X (1) (3)] 1⎥ ⎢ B= ⎢M M⎥ ⎢ ⎥ (1) (1) ⎢− ⎣ [ X (n − 1) + X (n)]1⎦ , Yn = [ X (0) (2)
⎧ x1 (t , a) ⎫ ⎪ x (t , a ) ⎪ 2 ⎪ ⎪ ⎪ ⎪ X (t , a) = ⎨ x3 (t , a) ⎬ ⎪ x (t , a ) ⎪ ⎪ 4 ⎪ ⎪ ⎪ ( , ) x t a ⎩ 5 ⎭ 我们现在推导各年龄组的人口变化规律。 第 i 个年龄组第 t+1 年代人口数由两个因素决定:上一年代 t 的保留人口 f c (ui (t ), xi (t , a)) 和组间交换人口 f X (mi (t ),i di (t )) :
2007年全国数学建模大赛A题中国人口增长预测与控制题目和论文赏析(1)(1)

中国人口增长预测与控制摘要近年来,中国人口最突出的特点是:老龄化加速、出生人口性别比持续增高和乡村人口城镇化。
针对这些特点,建立各个影响因素的数学模型,最后建立中国人口的增长模型。
对于问题一,首先将人口增长的预测问题转化为对出生率、死亡率和城镇乡转移率的预测。
通过原题附录3数据的分析研究,发现影响人口增长的主要因素可以归结为出生率、死亡率和城镇乡转移率,并依此建立了不同参数随时间变化的递推数学模型,讨论了各个参数对人口增长的影响。
其次,分别拟合死亡率和生育率、城镇乡转移率对年龄的分布。
建立了差分数学模型,将死亡率、生育率与城镇乡转移率的预测归结到总和死亡率、总和生育率与城镇乡总和转移率的预测,由于概率分布是相对稳定的,模型参数整体健壮。
对中短期的预测而言,总和死亡率、生育率和转移率的变化是近似线性的;对长期的预测,采用SI和SIS模型来描述其非线性变化,其模型的控制参数变化体现了国家人口政策的控制力度,结果表明模型具有长期可控性。
对于问题二,采用所建模型对0—90岁人口做出中短期和长期预测。
2006-2030年总人口逐年增加,2006年为13.062亿,2007年为13.109亿,2008年为13.158亿,2010年为13.3亿,2023年达到高峰期13.829亿,以后开始下降趋于平缓,到2030年为13.805;乡城转移率逐年增加,短期线性变化,2006年为0.454,2007年为0.471,2008年为0.490,2010年为0.526,长期由非线性模型描述,到2030年,城乡比例为0.901;整体老龄化程度增大,2006年为0.129,2007年为0.134,2008年为0.139,2010年为0.150,到2030年为0.325,在农村老龄化尤其严重,可以确定为地区间的迁移。
同时在做长期预测时,不同的国家策略导致不同的人口状况(见图[26-30]),得到的结论可以作为国家制定人口方针的建议。
2007美国大学生数学建模竞赛A题特等奖论文翻译

1.序言定义的国会选区在美国长期以来一直是争论的来源。
由于district-drawers都是由当前的执政者选择,边界被用来将不支持的少数人口和支持的大多数分成一组来影响未来的选举,这一过程称为徇私。
各选区普遍呈现出奇特的形状,以一种随意的方式跨多城市和农村的纤细部门,唯一合法的立法边界的限制规定选区必须含有相同的人群,但各区的构造是完全留给district-drawers。
在英国和加拿大,各地区都更加紧凑和直观的。
他们在缓解徇私上的成功归因于将边界划分任务交给无党派顾问小组。
然而,这些独立的委员会可以采取2-3年才能最终确定一个新的划分方案,要求其有效性问题。
它似乎很清楚,美国应该建立类似的公正委员会,但应做出一些努力,以提高这些群体的效率。
因此,我们的目标是过程中,开发有助于选区重划得一个小的工具箱。
具体来说,我们将创建一个模型,使用简单的几何结构划定合理的边界。
1.1当前模型大多数用于创建选区的方法可分为两类:一是依赖于当前分界线布局(最常用县)和另一是那些不依赖于当前的分界线。
多数属于前一类。
通过使用当前的选区分界,问题归结为通过使用多种数学程序将选区分界以一个理想的方式分组。
特拉等人使用图形分割理论来聚集总人口的变化在2%左右的平均选区规模。
赫斯和韦弗使用一个迭代的过程来定义人口的重心,使用整数规划将各县分组成相等人口的选区,然后重复上述过程,直到的质心达到一个极限。
Garfinkel和Nemhauser的使用迭代矩阵操作搜索的选区组合,是连续和紧凑。
凯撒开始系统地用当前选区和相邻地区进行人口交换。
所有这些方法都使用县为他们的分界,因为它们将国家分割成数量相对较少的部分。
这是必要的,因为当使用更多分界时,大多数的他们使用的数学工具变得缓慢,不精确。
(这就像是说,当国家被划分为更多的连续部门,在极限状态下他们变得不可用。
)因此,使用小的部门,如邮政编码,平均比纽约的一个县小5倍,变得不切实际。
2007年大学生数学建模B题优秀论文 公共交通网络模型

•摘要:明年8月第29届奥运会将在北京举行,届时有大量观众到现场观看奥运比赛,这将对北京的交通带来巨大的影响。
本文以给出的北京地区公交路线为参考资料,根据公交网络换乘问题构建了公共交通网络模型。
对三个问题的解决方案如下:(1)针对问题1,本文首先利用MATLAB编程将公交线路读出,求出各站点间的邻接矩阵。
再根据所求的邻接矩阵。
对求得的邻接矩阵进行处理;判断起点和终点之间有没有直达的线路,如有就确定为最优线路,没有就在通过程序寻找一个合适的数值(记为M)作为限制(即找出邻接点最多的那部分站点),找出通过次数超过这个数值的站点。
下一步则寻找换乘站点。
通过把求得的站点与要求的起点和终点,建立循环逐个修改开始站点与最终站点的值可求出通过各站点的路线,再将经过所求得的站点的路线与经过起点和终点的路线进行比较,寻找相同的路线,若存在,则这个站点可以作为所给的这对起点与终点的中转站(但根据人们乘车的习惯,假设中转的次数不超过2次)。
如果的站点中无法找到中转站,则调整M的值,直到可以找到可行的乘车路线为止。
根据得到的可行乘车线路,利用路过分别与费用和时间的函数关系,计算出按照吸收较小转车次数的原则,比较用钱少、费时少的线路,最终得到最优的乘车方案。
(2)针对问题2,将换乘地铁站和公汽站视为对等的,与问题1相似,利用相同的方法求出最优线路,但是情况比问题1更复杂,特别是地铁与地铁之间还可以换乘,这需要单独进行考虑。
此时,站点数、费用和时间的函数发生了变化,因此,利用新的函数表达式求解再比较得到最优线路。
(3)针对问题3,考虑步行时,可先利用图论中的Floyd算法求出任意两站点间的最短道路,并在此基础上求出这段路步行所需要的时间。
再在第二问的基础上,对时间加一个阈值T。
当计算出的两点间最短路的步行时间<阈值T时,就选择步行,否则,选择问题2中求得的最优线路。
本文所考虑的算法,可以查询任意两个站点间的乘车最优路径。
2007年美国数学建模题论文-基于模式识别的选区划分

基于模式识别的选区划分1.摘要本文针对研究众议员的选区重新划分问题。
运用方法简洁有效、充分公平且可行性强的“简单”原则,引入类基尼系数,并通过0-1矩阵确定合并方案。
为确保类似于少数族裔群体的利益,运用建设性杰利蝾螈模型,将某些少数群体合并。
最后,扩展到多个城市同时合并的模型,以便提高运算速度。
经过理论分析和数值计算结果验证表明模型设计合理,实用性强。
关键词:选区划分类基尼系数 0-1矩阵建设性杰利蝾螈2.问题的提出美国宪法规定众议院由一定数目的众议员组成,目前是435人,他们是由各州按照该州人口占全国总人口的百分比选出来的。
尽管这种规定提供了确定每个州有多少众议员的方法,但是一点也没有说及有关一个特定的众议员所代表的选区应该怎样按地区决定的问题。
这种疏忽已经导致了按某种标准看来是违反常情的很不好的选区安排,至少某些人认为通常是不必这样做的。
因此提出以下问题:假设有机会去制定一个州的众议院的选区,如何把它作为一种纯“基础性”的练习来创建一个州的所有选区的“最简单”的划分。
这些划分规则中至少要包含一条:该州的每个选区必须有同样的人口。
确定“简单”的定义;并就解决方法公正的做出一个能够使该州选民信服的论证。
作为方法的应用,试创建纽约州的按地域来说是简单的选区划分。
3.问题的分析所谓选举,其实质就是在评选人对候选人先后(优劣)次序排队的基础上,根据某一事先规定的选举规则决定出候选人的一个先后次序,即得出选举结果。
为了便于管理,举办选举一般都需要按人口大致平均地划分选区,不仅如此,每隔一段时间,选区往往有必要重新划分或作出调整,因为每个选区里面能选出来的人是固定的,但是里面的人口是变化的;当选区内人口出现大幅波动时,会导致被选出来的人和选区人口不成比例的现象,“一人一票”的原则就会被破坏,这就有必要重新划分选区。
纽约州按地域的简单的划分选区是一个纯基础性研究。
基础研究是指为获得关于现象和可观察事实的基本原理及新知识而进行的实验性和理论性工作,它不以任何专门或特定的应用或使用为目的。
2007年全国大学生数学建模竞赛A题优秀论文—人口预测模型
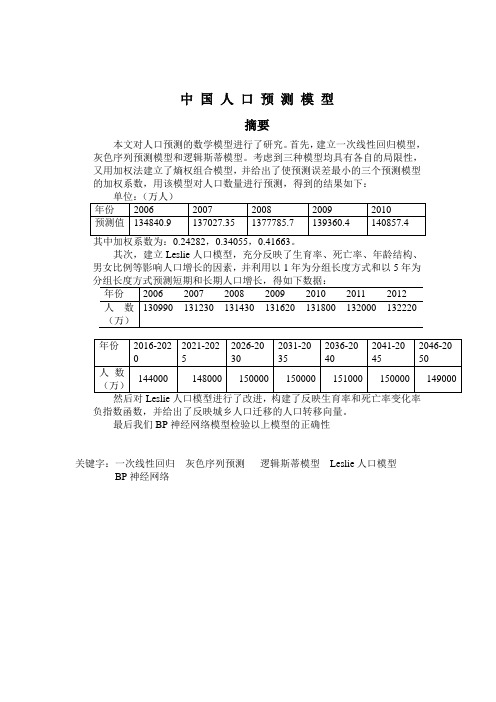
中国人口预测模型摘要本文对人口预测的数学模型进行了研究。
首先,建立一次线性回归模型,灰色序列预测模型和逻辑斯蒂模型。
考虑到三种模型均具有各自的局限性,又用加权法建立了熵权组合模型,并给出了使预测误差最小的三个预测模型的加权系数,用该模型对人口数量进行预测,得到的结果如下:其次,建立Leslie人口模型,充分反映了生育率、死亡率、年龄结构、男女比例等影响人口增长的因素,并利用以1年为分组长度方式和以5年为负指数函数,并给出了反映城乡人口迁移的人口转移向量。
最后我们BP神经网络模型检验以上模型的正确性关键字:一次线性回归灰色序列预测逻辑斯蒂模型Leslie人口模型BP神经网络一、问题重述1. 背景人口增长预测是随着社会经济发展而提出来的。
在过去的几千年里,由于人类社会生产力水平低,生产发展缓慢,人口变动和增长也不明显,生产自给自足或进行简单的以货易货,因而对未来人口发展变化的研究并不重要,根本不用进行人口增长预测。
而当今社会,经济发展迅速,生产力达到空前水平,这时的生产不仅为了满足个人需求,还要面向社会的需求,所以必须了解供求关系的未来趋势。
而人口增长预测是对未来进行预测的各环节中的一个重要方面。
准确地预测未来人口的发展趋势,制定合理的人口规划和人口布局方案具有重大的理论意义和实用意义。
2. 问题人口增长预测有短期、中期、长期预测之分,而各个国家和地区要根据实际情况进行短期、中期、长期的人口预测。
例如,中国人口预期寿命约为70岁左右,因此,长期人口预测最好预测到70年以后,中期40—50年,短期可以是5年、10年或20年。
根据2007年初发布的《国家人口发展战略研究报告》(附录一)及《中国人口年鉴》收集的数据(附录二),再结合中国的国情特点,如老龄化进程加速,人口性别比升高,乡村人口城镇化等因素,建立合理的关于中国人口增长的数学模型,并利用此模型对中国人口增长的中短期和长期趋势做出预测,同时指出此模型的合理性和局限性。
数学建模全国赛07年A题一等奖论文
数函 ztrepmoC
拟模态动
测预色灰
型模 citsigoL�字键关
。议建了出提府政给况情口人的国我对针�析 分性理合了行进型模对也时同�点缺优的型模个各了出指别特�价评了行进型模对文本�后最
。大增断不在度敏灵其 �中程过化变的高到低由在率育生在现发 �析分度敏灵了行进率育生女妇对后最 �0588.0 为数系度敏灵其出得析分度敏灵行进 例比生出女男对后然�高不并度敏灵的 θ 于 对量数口人现发�析分度敏灵了行进 θ 子因展发率亡死对针先首�中析分度敏灵在 。义意际实有具更果结的测预所得使 �子因制控入加�用作的素因为人虑考�进改了行进三型模对对们我�着接。高较求要性 确准的据数始初对且并�大较量据数的理处要需是但�测预的致细出做口人来未对以可 型模此。议建的性对针有些一了出提门部府政对还�中程过的解求型模在。期时”利红 口人“ 国我及以比养抚口人�平水化镇城�度程化龄老口人�值差的量数女男的龄年 婚适�值峰的口人出测预�上础基此在。合拟平水化镇城、目数口人龄年各女男乡镇市 年1002出求、合拟率亡死对、值常异除消均平取�理处下如了作据数对并�三型模立建 法方的拟模态动用利文本�究研入深作等化龄老口人、例比女男、构结口人对了为 。入深步一进有没�测预的数总口人了出做是只�素因的类一 龄年虑考有没也型模本�同相型模长增滞阻与。亿 531.41 有口人国中�时年 0302 出得 �测预的期长中合适�高较度精的型模此�明表果结�验检差误了行进型模对据数口人 的年 5002 至 0991 用还时同�测预了行进目数口人的年 0502 至 7002 对�型模测预色灰 )1,1(MG 了立建文本 �响影的测预对件事机随些这亡死和生出的口人少减了为 �后然 。性限局的定一有�强不性用实�好很上论 理�测预了做口人期短中对只以所�测预了行进的略粗是只�素因等例比女男数人生出 、龄年的口人虑考有没并于由�中型模此在。亿 95.31 有口人国中�时年 5102 在出得 �测预了行进目数口人的年 0202 至 7002 对 �合拟行进其对法乘二小最形线用运 �据数史 历的口人国中照依�下设假的单简最在�型模长增滞阻 citsigoL 了立建文本�先首 。测预模建 行进法方等拟模态动、测预色灰、citsigoL 了出提�等化镇城口人村乡及以比别性口人 生出、化龄老的口人来未国中对针�发出点特的长增口人和况情际实的国中从文本
2007年国际大学生数学建模竞赛B题获奖论文(1)
A Practical Approach toBoarding/Deboarding an A380Control #1724February 12, 2007ABSTRACT The highest source of inefficiency in an airplane's day of flying is its time spent on the ground. This paper presents an analysis of different boarding and deboarding methods onto an Airbus A380, the largest passenger airplane to date. The methods surveyed are various adaptations of the WilMA (Window, Middle and Aisle) method of boarding a plane, which are tested by computer program. The result of the analysis showed that loading the back of the plane before the front of the plane in the WilMA style yielded the fastest results. However, due to the impracticality and complexity involved in getting passengers lined up in WilMA order and in the “front to back” order at the same time, we decided to choose the second fastest method as the most efficient method for boarding the A380 airbus considering the method is more practical than our fastest method.Contents1. Introduction 32. A380 Boarding Efficiency 3 2.1 Important Considerations for the Model 42.2The Design and Seat Layout of the A380 (555 seats) 53. Boarding Results 144. Deboarding Efficiency 165. Conclusion 186. References 20 Executive Summary 221.IntroductionOn December 17th, 1903, Orville Wright was airborne for twelve seconds in what would be the first powered and piloted flight in history. More than a century since then, air travel has become the standard means of travel for millions of businessmen, immigrants, and tourists. A growing global population means a growing demand for mass transit, and the airline industry meets this demand by building more airports, airing more flights, and purchasing bigger planes. To deal with the growing market, engineers at Airbus devised the A380, reputed to have "the most spacious interior of any jetliner every built, the biggest wings, and the greatest overall thrust" (Norris). However, this spacious interior holds a huge number of seats, which must be filled in an efficient fashion to minimize the time that the jumbo jet spends on the ground. Two levels of passenger seating combined with several entry points to the plane provide both an unparalleled capacity and previously unseen potential for fast loading. Airports around the world are scrambling to retrofit their airports to make use of the two-level boarding options that the A380 presents, building two Passenger Load Bridges (PLBs) to the lower level of the plane and one to the top. This paper explores previously-researched boarding methods as well as several variations of the WilMA style of boarding.2. A380 Boarding EfficiencyAirports around the world are in preparation to allow for the A380 airplane to dock at terminals using two or three PLBs. Narita airport is expecting to have eight docks for A380’s and five of these to be equipped with three PLBs by 2008. Frankfurt airport is also preparing for the A380 and equipping all 13 of their terminals that the A380 will dock at with three PLBs each. Figure 1 displays the way the three PLBs will be placed for boarding the aircraft.The task to board airplanes as quickly as possible has always been a challenge for airlines. An efficient method of boarding for the A380’s claimed maximum seating of 853 passengers presents an even bigger problem. Currently, the A380 airbus that has been designed can carry only 555 passengers. As of today, there is no information available to the public about the design and the seat arrangement layout of the A380 with 853 seats, and no planes of this configuration have been ordered. Hence, in tackling the boarding problem given to us, we do not consider the A380 with 853 and our models will be based off the seating arrangement of 555 three-class seats for the A380.Figure 1: Location of three PLBs to the A380Boarding procedures in general have been meticulously calculated by experts around the world using examples of single aisle planes with 3 seats on each side of the aisle. There has also been some research done on boarding procedures by scientists at Arizona State University and a few graduate students across the country. Using the data and some results from their research, we have come up with the most efficient boarding method that takes advantage of the design of the plane (whose highlights are three PLBs, two decks connected by stairs and two aisles in each deck). Our method utilizes the design of the A380 and combines it with strategies that minimize seat interference during the boarding process. Our group has come up with a boarding method that is fast considering that there will be a large number of passengers (up to 555) to be loaded. In fact, our method devised for the 555-seater A380 allows for quicker boarding than single aisle planes with far fewer passenger capacities.2.1 Important Considerations for the ModelWhat goes into making a good model for boarding an airplane? Airlines want to be as fast as possible in the boarding of passengers but not in a way that will cause distress or complaints from the passengers. It is customary that first class passengers and those who may be disabled are boarded first on planes. Our model takes that into account and we have been able to maintain the expectance that many passengers have when boarding planes.Airlines want the process of boarding to be as fast as possible as well as maintain a controlled environment for the passengers. Typically airlines such as Southwest have adopted “random” seating in which passengers come on a first come first serve basis for sitting in an airplane. Studies have shown “random” seating to be faster than block seating arrangements or row seating. However due to the fact that the A380 is a double-decked plane and the fact that it has a passenger load of 555 people, the idea that “random” seating would work is realistically out of the question. With the number of people as large as 555 (the current A380 capacity), “random” seating would be very inefficient because of the great amount of seat and aisle interference from passengers transferring from one deck to another, looking for window seats, etc. In this situation, “random” seating will be far less efficient compared to calling out one row at a time.Our intuition and logic suggested that the best way to minimize seat interference would be by filling up all of the window or inner seats first, followed by the middle seats and then the aisle seats. This type of seating method has been mathematically proven to be the most time efficient way of boarding. This method is known as “WilMA” (Windows, Middle and Aisle).Given that we have three PLBs to the plane and two aisles in each of the decks, we can simultaneously board passengers to the lower and upper decks and to all classes (business, first and economy). At each of the PLBs, we can board the plane in three stages, each time boarding passengers with the same “type” (Window/Innermost, Middle and Aisle) of seats together. The presence of three PLBs, two aisles in each deck and the stairs connecting the two decks may even allow for a faster boarding time than a single aisle airplane that normally would take 23 minutes to fully load.2.2 The design and the seat arrangement layout of the A380 (555 seats)The A380 has three entry points for passengers to come in, which we have labeled as PLB A, PLB B and PLB C in Figure 2. This allows us to have three flows of passengers entering the plane simultaneously, thus reducing the boarding time significantly. The main question is which sections of the plane must be filled using which PLBs as there are only three PLBs and a total of seven sections to be filled. The sections are labeled 1, 2, 3, 4, 5, 6 and X+Y as show in Figure 2 below. Section 1 is the first class, sections 4 and 5 are business class and sections 2, 3, ‘X+Y’ and 6 are all economy class. We have carefully measured the length of each section in terms of how many economy-size class rows we are able to fit in each section. We used the length of one economy-size row as our standard unit of measurement for the length of the various sections of the airbus.Figure 2: Design of the A380 and the seat arrangement layout.Section 1 is first class, sections 4 and 5 are business class and sections 2, 3, 6 and X+Y are all economy class. A row, the unit of measurement for the length of the sections, is defined as follows: 1 row = length of 1 economy-size row.Using logical reasoning, we have come up with the following plan fordetermining the flow of passengers into the A380. Disabled passengers and passengers with special needs are boarded first to avoid any potential congestion these passengers may cause if boarded with the rest of the passengers. This will also make it easier for the disabled passengers, hence keeping the customer satisfaction high which to the airlines is as important as minimizing the boarding time. Disabled passengers and passengers with special needs whose seats are in Section 1(the first class) will be boarded through PLB A; those whose seats are in Section 4 and 5 (business class) and Section 6 (economy class) will enter through PLB C and those whose seats are in Section 2, 3 and X+Y will board through PLB B.PLB B PLBA PLBC Section 1 (1st class)Length =8 rowsSeats: 22Section 2 Length = 16 rows Section 3 Length = 13 rows Section X + Y Length = 9 rows Seats: 84 Length = 4 rows Section 4Length = 8rowsSeats: 30Section: 5 Length = 17 rows Seats: 66 Section: 6 Length = 15 rows Seats: 103 Length = 7 rowsTotal seats in Sections 2 and 3 = 250After the disabled passengers and passengers with special needs have beenboarded, the boarding of the rest of the passengers will begin. If we were to use PLB C for boarding all the passengers of the upper deck and PLB B for boarding all thepassengers of the lower deck, we would be boarding 169 passengers through PLB C and 334 passengers via PLB B. In this case, common logic suggests that the boarding of the passengers in the upper deck (through PLB C) will be complete long before the boarding of the passengers in the lower deck (through PLB B). No matter how fast boardingthrough PLB C is done, as long as the boarding through PLB B is not complete, theairplane cannot take off. Therefore, we must find a way which would allow for boarding through PLB B and PLB C to occur in the same amount of time so that no time is spent just waiting for boarding through PLB B to be done.The best way to do this is by having some of the passengers whose seats are in thelast section of the lower deck board through PLB C, go all the way to end of the upper deck and take the stairs down to the lower deck. The last (rear most) section of the lower deck is called ‘X + Y’ because it has X+Y number of rows, where X (unknown) isdefined to be the number of rows (counting from the back of the section ‘X +Y’) that will seat passengers coming in from PLB C and Y(unknown) is defined to be the number of rows (counting from the front of the section X +Y) that will seat passengers coming in from PLB B. So, we set the amount of time it takes for boarding through PLB B equal to the time it takes for boarding through PLB C in addition to the time that it takes forpassengers whose seats are in the ‘X’ region to walk some extra and walk down the stairs from the upper deck to the lower deck.passengers X by walk extra stairs C PLB B PLB T T T T ''++= (1) Since WilMA has been mathematically shown to be the best method for boardingpassengers in their seats i , there will be three calls made at each PLB: the first call will be for all passengers in the window/inner seats, the second call will be for all those who have middle seats and the third call will be for passengers who have aisle seats. The time it takes to board sections 2, 3, and ‘Y’ through PLB B is simply the time it takes to board all the window/inner seat passengers, followed by all the middle seat passengers and finally the aisle seat passengers in sections 2, 3 and ‘Y’:)''32()''32()''32(/Y Aisle Y Middle Y Inner Window B PLB T T T T ++++++++= (2) Similarly,)''65()''65()''65(/X Aisle X Middle X Inner Window C PLB T T T T ++++++++=(3) The time it takes to fill up all the window seats in sections 2, 3 and ‘Y’ is the time it takes for these window-seat passengers to walk the length of the sections 2, 3 and ‘Y’ and the length of the sections connecting each of these sections and the time taken by somepassengers to put away their luggage:)'('/)3(/)2(/)41316()''32(/Y Inner Window luggage Inner Window luggage Inner Window luggage rows Y Walk Y Inner Window T T T T T +++=+++++(4) Similarly,)'(')3()2()41316()''32(Y Middle luggage Middle luggage Middle luggage rows Y Walk Y Middle T T T T T +++=+++++ (5) and)'(')3()2()41316()''32(Y Aisle luggage Aisle luggage Aisle luggage rows Y Walk Y Aisle T T T T T +++=+++++ (6)We know from previous research done by a team of scientists at Arizona State University led by Menkes H. L. van Den Briel that the speed of a passenger traveling from one row to next is a triangular distribution with an average of 0.95 second/row. Van Den Briel’s data also measured that 60% of passengers stop to store their luggage with an average time of 7.1 seconds/person while 40% of passengers have a luggage time of 0seconds/person.1So,×=×=+++95.0)41316(Rows of Number Speed Row T rows Y Walk (16+13+4+Y) = 30.40 + 0.95Y(7) )8(sec 1.7)(sec %60)(passenger i tion in passengers seat of number the of T i luggage ×=passenger of T T Inner Window luggage Inner Window luggage sec 1.749%60)3(/)2(/×=+ (9) 1 /~dbvan1/papers/MatthewPanEssay.pdfWe find the number of passengers of a certain type (window/inner, middle or aisle) in a certain section i by counting the number of that type of seats in one half of the that section since there are two aisle serving the total number of passengers.=+)3()2(Middle luggage Middle luggage T T passengerpassengers of sec 1.750%60× (10) and=+)3()2(Aisle luggage Aisle luggage T T passengerpassengers of sec 1.726%60× (11) For the time taken by window seat passengers in Section ‘Y’ to load their luggage, we have:=)'('/Y Inner Window luggage T passengerpassengers y of sec 1.7)*2(%60× (12) passengerpassengers y of T Y Middle luggage sec 1.7)*2(%60)'('×= (13) passengerpassengers y of T Y Aisle luggage sec 1.7)(%60)'('×= (14) Substituting (7),(9) and (12) into (4) we get:Y T Y Inner Window 47.914.239)''32(/+=++(15) Substituting (7), (10) and 13 into (5), we get:Y T Y Middle 47.940.243)''32(+=++ (16)Substituting (7), (11) and (14) into (6), we get:Y T Y Aisle 21.516.141)''32(+=++(17) Now we substitute (15), (16) and (17) into (2):Y T B PLB 140.2470.623+= (18)Calculations analogous to those done in (9), (10) (11), (12), (13) and (14) were performed to find:)3()3()3(33)1517(stairs X for walk extra X walk stairs X for walk extra C PLB T T T T T T ×+×+×=++++)(/)6(/)5(/X Inner Window luggage Inner Window luggage Inner Window luggage T T T +++)()6()5(X Middle luggage Middle luggage Middle luggage T T T +++)()6()5(X Aisle luggage Aisle luggage Aisle luggage T T T +++The value used for T stairs was measured by doing three trials of going down 16 average size, which is the number of steps that the A380 has. Traversing sixteen steps took an average of 7.6 seconds, and by Matthew Pan’s calculations, this is equivalent to walking down eight rows. Thus, traversing the steps is the equivalent of walking eight rows. stairsX for walk extra C PLB T T T 33++)1.726.0()1.7266.0()1.7226.0(895.03)37(95.03)95.0(3)3295.0(3××+××+××+××++×++×=X X)1.76.0()1.726.0()1.7266.0()1.7116.0(×+××+××+××+X XX T T T stairs X for walk extra C PLB 150.2460.50433+=++∴ (19)Substituting (18) and (19) into (1):623.70 + 24.150Y = 504.60X +24.150 (20) Since we know that X+Y= 9, we can solve (20) for X:X= 6.964 rows rows Y rows 27=⇒≈ This means that, in order to board in the least amount of time, passengers whose seats are in sections 5, 6 and the last seven rows of section ‘X+Y’ should be boarded through PLBC. Passengers whose seats are in sections 2, 3 and the first two rows of section ‘X +Y’ should be boarded through PLB B.Figure 3: The flow of passengers through PLB C and PLB B which will minimize the time need to board the plane .Passengers who should be boarded through PLB C Passengers who should be boarded through PLB B PLB BPLBCPLBA The time it takes to board passengers through PLB B and PLBC is going to bemuch more than the time it takes to board passengers through PLB A. When considering the best way to minimize the boarding time, we do not bother about trying to minimize the time for boarding through PLB A because boarding through PLB A will be far faster than boarding PLB B and PLB C with even the most efficient strategies for B and C. This is because the number of passengers boarding through PLB A is only 52, while 268 board through PLB B and 235 passengers board through C.To minimize the amount of time for boarding, we have come up with fourmethods, each of which uses the basic concept of the WilMA method (i.e. boarding in the order: Windows, Middle and then Aisle) and based on the plan of boarding the last seven rows of the last section on the lower deck through PLB C. All four models are based on these two features but the order in which the passengers are boarded is slightly different. In all of these methods, passengers in the last seven rows of the lower deck are boarded through PLB C along with passengers of the upper deck. The calculations above show why the last seven rows of the lower deck were selected to board from PLB C.Figure 4: Method 1. For each stage of boarding we have as many people board as possible maintaining the WilMA method. This results in very few people boarding in stage 3 or “Call 3.”Figure 5: Method 2. In this method, we have more people boarding in the back of the plane during stage 1 and more boarding in the front of the plane in stage 2 and 3, while maintaining the WilMA method.The best case of WilMA would be if we could get all the passengers to board in the “back to front” order where the passengers whose seats are the farthest down an aisle are in the front of the boarding line. Getting all the passengers to line up in the WilMA order as well as in decreasing seat number order would be a challenging and most likely an impractical task to be undertaken in the limited amount of space available at the waiting area outside the PLBs and also because this process would require a lot more time to get the passengers organized. Although theoretically the best, this would be the most impractical and inconvenient method both for the airline employees as well as the passengers. Having passengers board in the WilMA order and the decreasing seat number order is impractical but the next best practical method of using WilMA would be to not to board the passengers according to their seat number but according to their section, i.e. passengers whose seats are in the section that is in the back most part of the plane should go first, followed by the middle section and then followed by the front section. This is the method illustrated on the next page.Figure 6: Method 3: Passengers are called in WilMA order but in each call, the passengers whose seats are in the back are called first followed by passengers whose seats are in the middle regions and finally passengers whose seats are in the front. Theoretically, this should be the ideal way of doing the WilMA method because this will minimize the amount of aisle interference and congestion. However, this may not be the most practical approach as it requires making upto seven calls, as in the case of PLB C.At each Passenger Loading Bridge (PLB), gate agents will make three calls asfollows:23X651 1PLBBPLBA PLBCIn order to properly analyze these methods of boarding, we needed to performexperimental trial runs. Not having an Airbus A380 at our disposal, we were forced to look for alternative means. We programmed a model of the A380 based on the seatingdiagrams that we had, and created functions allowing us to automate a passenger navigating the aisles of an airplane to reach his or her seat. Using a thousand trials for each method, we found the average amount of time that it took to fully board sections B and C. In addition, early tests of the simulation revealed that adding a row of seats to be boarded through PLB C and removing one row from PLB B boarding caused the difference in loading times between the two sections to become much closer to even. The psuedo-code describing the boarding algorithm used is as follows:Note that this assumes the WilMA method is being used, and as such there is no time incurred by sitting into one's seat.3. Boarding ResultsSimulations(Minutes): 1000 Tests / entryPassengerLoad 0 Sec. Int. 4.5 Sec. Int. 9 Sec. Int.Deck Lower Upper Lower Upper Lower UpperMethod 1 Large 6.328 5.99522.03321.35543.376 41.5623.9774.27512.77013.68024.880 26.231Medium1.8432.307 4.351 5.0188.052 8.926SmallMethod 2 Large 6.192 5.94722.01821.32443.386 41.5603.9194.25512.77713.64524.867 26.226Medium1.8272.259 4.358 4.9918.046 8.888SmallMethod 3 Large 6.388 5.25921.79120.76243.180 41.0593.689 3.48112.54413.09224.680 25.725Medium1.459 1.765 4.128 4.4297.849 8.392SmallMethod 4 Large 7.587 6.97122.14421.43143.529 41.7154.823 4.96112.89313.76825.031 26.390Medium2.212 2.621 4.484 5.1018.201 9.052SmallLarge(555 Passengers), Medium(330 Passengers), Small(105 Passengers)Here, upper deck is defined to be all the rows of the upper deck and the last eight rows of the last section of the lower deck.When running our simulations of each method we realized that the mathematically calculated value of X, which tells us how many of the last rows of the last section of the lower deck should be boarded through PLB C, was not the most efficient value. We ran the simulations with X = 7 but found that our results caused a smaller difference between the load times of PLBs B and C if we made X = 8. Thus, adding one more row from the last section of the lower deck to the boarding through PLB C and removing one row from the load of PLB B proved to be the most time efficient way to model the problem. Since, we had decided that the best method would provide the boarding times for PLB B and PLB C to be as close to being equal as possible, we decided to run all our simulation using X = 8.Figure 8: Boarding times found by simulations for Methods 1, 2, 3 and 4 for A. Large passenger load, B. Medium Passenger Load, and C. Small Passenger Load.Our second realization was that the intervals of passengers boarding the plane had a lot to do with the efficiency of boarding the A380. We had expected that the time to store baggage would be a main factor in the models but upon increasing it by a considerable amount we found it had little effect on the total time to board. We adjusted the models to be most optimal by doubling the flow of passengers boarding from PLBs B and C which meant that we needed to add another flight attendant to check tickets at each of these PLBs adjusting the total flight attendants needed in our method from three to five. The rate of boarding measured for single aisle planes by researchers at Arizona State University is 9 seconds/person.2 In our simulations, we made the passengers boarding through each PLB at a rate of 4.5 seconds per passenger. This cut the total boarding time by a little under 2 fold. This was expected as the A380 has two aisles and thus should be able to board twice the number of people as a regular single aisle plane through each PLB with only congestion near the front of each PLB affecting each aisle’s flow.To see how much time it would take if we removed the constraint of checking tickets (0 second interval), we were able to see that Method 2 had the lowest congestion of all the methods at the largest passenger load. However, with the interval of 4.5 seconds which our methods are primarily modeling, Method 3 was 13 seconds faster than Method 2 which took 22.018 minutes to board. However, due to the fact that Method 3 is more complex in managing the ticket checking and announcements for the flight attendants, we justified choosing Method 2 over Method 3 because Method 2 is more practical. Although every simulation was run for a value inside each interval assigned we focused primarily on the 555 seat results due to the fact many airlines are intending to use theA380 for traditionally high occupancy flights. Our conclusion from our results is that Method 2 will result in the most efficient as well as practical way for airlines to board the A380 in comparison to all our other methods.4. A380 Deboarding EfficiencyThe other factor in a planes turn around time that has to do directly with passengers is the deboarding of the plane once it reaches the terminal. Unlike boarding the deboarding of a plane is traditionally done in a first come first serve basis in meaning that those closest to the exits get off first and those furthest are last to leave the aircraft. The A380 will have three PLBs in which staff can use to deboard the aircraft. Assumptions:•The A380 plane will have three PLBs to deboard passengers.•Each PLB of the A380 will flow at the same rate as the others as passengers deboard the plane.•Passengers will not slow or obstruct the flow of each PLB.2 A research team at Arizona State University led by by Menkes H. L. van Den Briel obtained videotapes of actual airplane boarding and measured the passenger arrival rate, the row speed of the passengers and the luggage speed. This information was found in Mathew Pan’s paper found at/~dbvan1/papers/MatthewPanEssay.pdf•Passengers will generally follow the predicted flow for each PLB and not take erratic routes in order to exit the plane.Considerations:•Disabled passengers will exit the plane last, this is due to the fact the allotted time needed for a disabled passenger to exit is generally expected to be muchgreater than a non-disabled passenger.•First class passengers will exit first, again this is expected by the passengers and is to be done to maintain consistency in what passengers expect from the airlines. Statistics: A380 (555 seats) Full•For maximum efficiency all 3 PLBs will allow for deboarding passengers in a way that all three begin and end the deboarding process ideally at the same time.•PLB A will first deboard first class passengers then economy class passengers from the lower deck.•PLB B will deboard only economy seat passengers from the lower deck.•PLB C will deboard the business class passengers from the upper deck followed by the economy seat passengers from the upper deck.Figure 9: Deboarding FlowOur objective is to get all of the passengers to exit the plane in such a way that comes closest to the optimal flow rate possible for the aircraft. If the aircraft is full with 555 passengers then the optimal amount of time to deboard the plane is 9.25 minutes. This was determined using the statistic from Boeing that the time it takes for a person to exit an aircraft is 3 seconds. Our team’s strategy was to divide the plane up into 3 sections that were going to get us closest to the optimal value without having people take irregular routes that resulted in them walking further than they feel they should to exit the plane. For example someone in the back of the plane on the bottom deck will not appreciate walking up the stairs in the back of the plane in order to cross the entire plane to walk down the front stairs of the plane in order to exit through bridge A. With that in。
07年全国数学建模优秀论文
l23
N2 (t)) N2m
其中 p, q = 1, 2,3. 分别表示市、镇、乡这三个地区, lqp 是迁移系数,正数时表示迁
入,负数时表示迁出。lqp / Nm 体现了居民从地区 q 迁到地区 p 时对地区 p 人口增长的影
响。 为求解此方程,不失一般性的取 Dt = 1 ,则原微分方程组化为差分方程组:
现在考虑市、镇、乡三个地区的总人口变化规律,假定在一段时期内,这三个地区 各自均处于稳定状态,出生率和死亡率都没有太大变化。然而居民在三个地区间的迁移 会对总人口产生一定的影响。对原 Logistic 模型进行修改,得到多地区条件下的改进模 型:
ì ï ï
dN1 (t dt
)
=
r1 N1 (t )(1 -
题中所给 5 年我国人口 1%调查数据是对人口的抽样调查数据,由于数据的不完备 性,并不能由它来估计当时的全国总人口数。但基于抽样调查的等概率性,可以认为它 所反应的市、镇、乡三个地区的人口比例及男女比例是与实际较为接近的。从《中国人 口统计年鉴 2006》[1]可以得到 2001~2005 年具体的全国总人口数。进而可以得到各部分 人口数。所得数据见表 1。
建立模型对人口发展过程进行定量预测,就是根据现有的人口统计资料和原始数 据,从当前实际的人口状况出发,并对未来的人口发展过程,提出合理的控制要求和假 定,应用科学的方法,预测出未来几年、几十年甚至上百年的人口发展趋势,包括人口 总数、人口的性别、年龄和城乡结构,人口出生、死亡和自然增长率的变化以及在未来 的人口构成中劳力和抚养水平及老化水平等。
模型一需要的原始数据少,操作简单,适合于中短期预测,但长期预测效果不佳; 模型二综合考虑了各因素,对中短期和长期均有较好的预测效果,但所需数据量大,操 作较为复杂。
2007 华南师范大学第六届数学建模竞赛优秀论文
C k 1T ( k1 为常数且>0)
从运动生理学得知,肌肉的强度与其横截面积近似成正比,即:
(1)
T k 2 S ( k 2 为常数且>0),
从而可得
(2) (3)
C k1T k1k2 S 。
S k3 h 2 ,W k 4 h 3 ( k3 , k4 为常数且>0)
假设肌肉的横截面积正比于身高的平方,人的体重正比于身高的三次方[3],即可得: (4) (5)
3
(K
k1 k 2 k 3 k 4
2
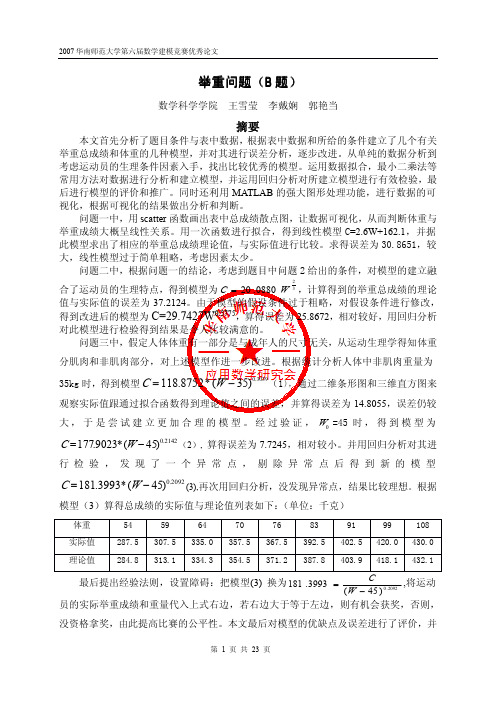
合了运动员的生理特点,得到模型为 C 20 . 0880 W 3 ,计算得到的举重总成绩的理论 值与实际值的误差为 37.2124。由于模型的假设条件过于粗略,对假设条件进行修改, 得到改进后的模型为 C=29.7427W0.5775,算得误差为 25.8672,相对较好,用回归分析 对此模型进行检验得到结果是令人比较满意的。 问题三中,假定人体体重有一部分是与成年人的尺寸无关,从运动生理学得知体重 分肌肉和非肌肉部分,对上述模型作进一步改进。根据统计分析人体中非肌肉重量为 35kg 时,得到模型 C 118.8752 * (W 35)
0.3039
(1), 通过二维条形图和三维直方图来
观察实际值跟通过拟合函数得到理论值之间的误差,并算得误差为 14.8055,误差仍较 大 , 于 是 尝 试 建 立 更 加 合 理 的 模 型 。 经 过 验 证 , W0 =45 时 , 得 到 模 型 为
C 177.9023* (W 45)0.2142 (2), 算得误差为 7.7245,相对较小。并用回归分析对其进
C ,将运动 (W 45 ) 0 .2092 员的实际举重成绩和重量代入上式右边,若右边大于等于左边,则有机会获奖,否则,
数学建模获奖论文(优秀范文10篇)11000字
数学建模获奖论文(优秀范文10篇)11000字数学建模竞赛从1992年始,到现如今已成为全国高校规模最大的基础性学科竞赛,也是世界上规模最大的数学建模竞赛。
本篇文章就为大家介绍一些数学建模获奖论文,供给大家欣赏和探讨。
数学建模获奖论文优秀范文10篇之第一篇:高中数学核心素养之数学建模能力培养的研究摘要:数学建模是一种比较重要的能力,教师在进行高中数学教学的过程中应该让学生们学习这种能力,这对于解决高中数学问题是比较有效的,而且对于学生们未来接受高等教育有更重要的意义。
教师在进行高中数学教学的过程中需要让学生们的能力得到锻炼,提升能力是教学的主要目的,学习知识是比较基础的教学目的,教师如果想让学生们的能力得到锻炼应该对教学方法进行更新,高中数学对于很多学生们来说都是比较困难的,所以教师应该不断更新教学方法,让学生们能理解教师的教学目的,而且找到适合自己的学习方法,这也是核心素养的基本内涵。
本文将对高中数学核心素养之数学建模能力培养进行研究。
关键词:高中数学; 核心素养; 数学建模; 能力培养; 应用研究;建模活动是一项比较有创造性的活动,学生们在学习的过程中一定要具备创新思维和自主学习能力,建模活动进行过程中可以让学生们独立,自觉运用数学理论知识去探索以及解决问题,构建模型解决实际问,教学活动中,让学生们的基础知识更加牢固、基本技能得到锻炼是最根本的目的。
学生们的运算能力以及逻辑思维能力也能在建模活动中得到锻炼,提升学生们的空间观念以及增强应用数学意识是延伸目的。
一、对数学建模的基本理解概述高中数学建模最简单的解释就是利用学生们学习过的理论知识来建立数学模型解决遇到的问题。
数学建模的基本过程就是对生活中或者课本中比较抽象问题解决的过程。
通过抽象可以建立刻画出一种较强的数学手段,通过运用数学思维也能观察分析各种事物的基本性质和特点。
学生们可以从复杂的问题中抽离出自己熟悉的模型,然后在利用好数学模型去解决实际问题基本就是事半功倍。
07年全国大学生数学建模一等奖获奖论文
承诺书我们仔细阅读了中国大学生数学建模竞赛的竞赛规则.我们完全明白,在竞赛开始后参赛队员不能以任何方式(包括电话、电子邮件、网上咨询等)与队外的任何人(包括指导教师)研究、讨论与赛题有关的问题。
我们知道,抄袭别人的成果是违反竞赛规则的, 如果引用别人的成果或其他公开的资料(包括网上查到的资料),必须按照规定的参考文献的表述方式在正文引用处和参考文献中明确列出。
我们郑重承诺,严格遵守竞赛规则,以保证竞赛的公正、公平性。
如有违反竞赛规则的行为,我们将受到严肃处理。
我们参赛选择的题号是(从A/B/C/D中选择一项填写): B我们的电子文件名:B0302所属学校(请填写完整的全名):广西师范学院参赛队员(打印并签名) :1. 钟兴智2. 尹海军3. 斯婷指导教师或指导教师组负责人(打印并签名):韦程东日期: 2007 年 9 月 24 日赛区评阅编号(由赛区组委会评阅前进行编号):编号专用页赛区评阅编号(由赛区组委会评阅前进行编号):全国统一编号(由赛区组委会送交全国前编号):全国评阅编号(由全国组委会评阅前进行编号):乘公交,看奥运摘要我们基于最小换乘次数算法,设计了公交查询系统,能够分别从时间和花费出发考虑,选择最优路径,以满足查询者的各种不同需求。
问题一:采用最小换乘次数算法,求出任意两站的最小换乘次数,在次数一定的情况下,分别选取花费最少和时间最少作为优化目标,建立两种模型:最少时间模型:∑∑==+-+⨯=31315)))1(((3),(min i i i i i i i x q x n x B A f ;最少花费模型:))1((),(min '''31i i i y x x B A g -+=∑;利用两种模型求出6组数局的最佳路线如下(两地铁的线路转化成公交的问题,改进问题一中的模型求出此问题的最少时间模型++-+⨯=∑∑∑===)))5)))1(((3((),(min 313131i i i i i i i i i x q x n x y B A f++-+⨯-∑∑∑===)4))))1(((5.2)(1((3131'31i i i i i i i i i x q x n x y ∑=-31i )z 1(7i i y +∑=31i z 6i i y最小换乘算法进行了改进。
2007高教社杯全国大学生数学建模竞赛(中国人口增长预测模型)II

中国人口增长预测模型的建立与分析摘要针对我国人口发展过程中出现的老龄化进程加快,出生人口性别比持续升高,乡村人口城镇化的新特点,我们基于LESLIE 矩阵,着重考虑城镇与乡村间的人口迁移及女性人口比例变化对我国人口增长的影响,经过两次改进建立了便于计算机求解的差分方程模型,对我国2005年以后45年的人口增长进行了预测。
随后利用时间段参数设置法,对差分方程模型又进行了一次改进。
然后运用等维灰色系统预测法对该差分方程模型的中短期预测进行了检验,同时根据2001年人口基本数据运用此模型对2001年~2005年进行了预测,并用实际数据对预测结果进行了检验。
我们将预测区间分为2006~2020年、2021~2035年、2036~2050年三个区间,以量化短期、中期与长期。
通过调整模型中相关参数及输入条件,定量地分析了男女性别比例、老龄化和乡村人口城镇化对我国人口增长的影响。
预测结果表明,从短期来看,我国的出生性别比变化不明显,将在短期内维持基本不变,老龄化进程在15年内在上升了8个百分点,人口扶养比持续升高,这将加重我国的人口压力,乡村人口城镇化水平进展缓慢;从中期来看,总人口性别比将保持在1与1.1之间,老龄化进程将呈线性增加趋势,乡村人口城镇化水平将持续发展;从长期来看,老龄化进程将在2035到2045年经历老龄人口高峰平台,老龄人口比重在0.3以上,育龄妇女人数持续下降,总人口数将在2023年达到峰值14.05亿。
关键词:LESLIE矩阵,人口预测,性别比例,城镇化,老龄化,灰色系统预测一、问题的重述人口问题是中国社会发展的重要问题,对中国人口的中长期预测有助于政府制定相应的政策保持中国的长治久安。
现需要解决的问题如下:1.主要根据2001~2005年的人口统计数据,对中国人口增长的中短期和长期趋势作出预测,特别要关注老龄化,出生人口性别比及乡村人口城镇化等因素。
2.指出所建模型的优点和不足之处。
- 1、下载文档前请自行甄别文档内容的完整性,平台不提供额外的编辑、内容补充、找答案等附加服务。
- 2、"仅部分预览"的文档,不可在线预览部分如存在完整性等问题,可反馈申请退款(可完整预览的文档不适用该条件!)。
- 3、如文档侵犯您的权益,请联系客服反馈,我们会尽快为您处理(人工客服工作时间:9:00-18:30)。
中国人口增长模型摘要人口问题涉及人口质量和人口结构等因素,是一个复杂的系统工程,稳定的人口发展直接关系到我国社会、经济的可持续发展。
如何从数量上准确的预测人口数量以及各种人口指标,对我国制定与社会经济发展协调的健康人口发展计划有着决定性的意义。
近年来我国的人口发展出现了许多新的特点,这些都影响着我国人口的增长。
鉴此,本文依据灰色预测方法和年龄移算理论,基于人口普查统计数据,从人口系统发展机理上展开讨论。
首先根据灰色预测理论,建立了一级的灰色预测模型,再将近几年我国的人口数量带入模型,便得到未来较短时间内我国的人口数量。
所得结果为我国总人口将于2006年、2007,2008,2009,2010年分别达到13.1495,13.2212,13.2909,13.3587,13.4246亿人。
然后分析人口发展方程中按年龄死亡率及生育模式等参数函数的内在变化规律,及其对总人口的影响,建立了莱斯利主模型,并在此基础上针对各参数函数的不同特点,建立了生育模型和死亡模型等子模型。
在将所得子模型和主模型结合,依据当前人口结构现状对我国的人口做了长期的预测。
所得结果是我国总人口将于2010年、2020年、2030年分别达到13.51058,14.38295,14.78661亿人与国家发展战略报告数据一致。
最后对所建模型的优缺点进行了客观的评价。
关键词:灰色预测模型,改进的莱斯利模型,老龄化指数,平均寿命,平均年龄。
一、问题的提出1.1问题:中国是一个人口大国,人口问题始终是制约我国发展的关键因素之一。
根据已有数据,运用数学建模的方法,对中国人口做出分析和预测是一个重要问题。
近年来中国的人口发展出现了一些新的特点,例如,老龄化进程加速、出生人口性别比持续升高,以及乡村人口城镇化等因素,这些都影响着中国人口的增长。
2007年初发布的《国家人口发展战略研究报告》还做出了进一步的分析。
关于中国人口问题已有多方面的研究,并积累了大量数据资料。
试从中国的实际情况和人口增长的上述特点出发,参考附录2中的相关数据(也可以搜索相关文献和补充新的数据),建立中国人口增长的数学模型,并由此对中国人口增长的中短期和长期趋势做出预测。
1.2背景分析:中国是世界上人口最多的发展中国家,人口多,底子薄,人均耕地少,人均占有资源相对不足,是我国的基本国情,人口问题一直是制约中国经济发展的首要因素。
人口数量、质量和年龄分布直接影响一个地区的经济发展、资源配置、社会保障、社会稳定和城市活力。
在我国现代化进程中,必须实现人口与经济、社会、资源、环境协调发展和可持续发展,进一步控制人口数量,提高人口质量,改善人口结构。
对此,单纯的人口数量控制(如已实施多年的计划生育)不能体现人口规划的科学性。
政府部门需要更详细、更系统的人口分析技术,为人口发展策略的制定提供指导和依据。
长期以来,对人口年龄结构的研究仅限于粗线条的定性分析,只能预测年龄结构分布的大致范围,无法用于分析年龄结构的具体形态。
随着对人口规划精准度要求的提高,通过数学方法来定量计算各种人口指数的方法日益受到重视,这就是人口控制和预测。
二、问题分析2.1 整体分析人口增长模型是由生育、死亡、疾病、灾害、环境、社会、经济等诸多因素影响和制约的共同结果,如此众多的因素不可能通过几个指标就能表达清楚,他们对人口增长的潜在而复杂的影响更是无法精确计算。
这反映出人口系统具有明显的灰色性,适宜采用灰色模型去发掘和认识原始时间序列综合灰色量所包含的内在规律。
灰色预测模型属于全因素的非线性拟合外推类法,其特点是单数列预测,在形式上只用被预测对象的自身序列建立模型,根据其自身数列本身的特性进行建模、预测,与其相关的因素并没有直接参与,而是将众多直接的明显的和间接的隐藏着的、已知的、未知的因素包含在其中,看成是灰色信息即灰色量,对灰色量进行预测,不必拼凑数据不准、关系不清、变化不明的参数,而是从自身的序列中寻找信息建立模型,发现和认识内在规律进行预测。
基于以上思想我们建立了灰色预测模型。
2.2 局部分析在灰色预测模型中,与起相关的因素并没有直接参与,但如果考虑到直接影响人口增长的因素,例如出生率、死亡率、迁入迁出人口数等,根据具体的数据进行计算,则可以根据年龄移算理论,从某一时点的某年龄组人数推算一年或多年后年龄相应增长一岁或增长多岁的人口数。
在这个人口数的基础上减去相应年龄的死亡人数,就可以得到未来某年龄组的实际人口数。
对于0岁的新生人口,则需要通过生育率作重新计算。
当社会经济条件变化不大时,各年龄组死亡率比较稳定,相应活到下一年龄组的比例即存活率也基本上稳定不变。
因而可以根据现有的分性别年龄组存活率推算未来各相应年龄组的人数。
即,若某t 年年初有i 岁人口数()t x i 人,次年即(t+1)年年初这些人长了一岁为(r+1)岁。
若()t d i 为这批人在一年内的死亡率,则(t+1)年年初(i+1)岁的人口数为()()()t d t x i i -⨯1。
0岁人口数需要通过妇女生育情况另行计算。
因此可以建立人口发展矩阵方程模型这一主模型,并在其基础上建立生育率模型和死亡率模型。
三、模型假设1. 假设附件中所给数据真实可靠且具有预测性。
2. 不考虑国内外的人口迁移对我国人口的影响。
3. 不考虑香港、台湾以及澳门人口。
4. 假设影响中国总人口数的主要因素是死亡率和出生率。
5. 假设在社会稳定的前提下,生育和死亡率都比较稳定。
6. 由国家人口发展战略研究报告知,我国总和生育率从20世纪70年代初的5.8下降到目前的1.8,低于更替水平。
假设在未来的发展进程中,我国妇女的总和生育率保持为1.8。
四、名词解释1. 人口:生活在一定社会生产方式、一定时期、一定地域,实现其生命活动并构成社会生活主体,具有一定数量和质量的人所组成的社会群体。
2. 出生率:指某年每1000人对应的活产数,又称总出生率或粗出生率。
它反映人口的出生水平,一般以千分数表示。
3. 生育率:某年每1000名15-49岁妇女的活产婴儿数。
又称一般生育率。
该指标比出生率要精确一些,因为它将同可能生育的特定性别年龄的人口联系起来(通常是15-49岁的妇女),排除了年龄性别结构不同引起的偏差。
生育率比出生率更能揭示生育水平的变化。
4. 总和生育率:指假定妇女按照某一年的年龄别生育率度过育龄期,平均每个妇女在育龄期生育的孩子数5. 死亡率:一定时期内(通常为一年)死亡人数与同期平均人数(或期中人数)之比。
说明该时期人口的死亡强度,通常用千分比表示。
6. 人口增长率:人口增长程度或增长速度,即一定时期内人口增长数与人口总数之比。
通常以一年为期计算,用百分数表示。
7. 人口年龄结构:某一年某一地区按年龄划分的人口数。
8. 老龄化指数:65岁以上人口对15岁以下人口的比例,数值越高说明老龄化程度越深。
9. 平均寿命:0岁时的期望寿命,用以反映同时出生的一群人预期可能存活的岁数。
10.灰生成:将原来数据通过某种运算交换为新数据,成为灰生成,新数据称为变换数据。
11.累加生成:将同一序列中数据逐次相加以生成新的数据。
五、模型的建立模型一 灰色预测模型灰色系统是指既含有已知信息、又含有未知信息或非确知信息的系统,也称为贫信息系统。
灰色模型是根据关联度、生成数灰导数、灰微分等观点和一系列数学方法建立起来的连续性的微分方程。
灰色预测是灰色系统理论的一个重要方面,它利用这些信息,建立灰色预测模型,从而确定系统未来的变化趋势。
灰色预测模型能够根据现有的少量信息进行计算和推测。
灰色建模的思路是:从序列角度剖析微分方程,是了解其构成的主要条件,然后对近似满足这些条件的序列建立近似的微分方程模型。
而对序列而言(一般指有限序列)只能获得有限差异信息,因此,用序列建立微分方程模型,实质上是用有限差异信息建立一个无限差异信息模型。
设原始序列为()()()()()()()},,2,1{0000n x x x x =这是一组信息不完全的灰色量,具有很大的随机性,将其进行生成处理,以提供更多的有用信息。
下面选用累加生成,则m 次累加生成的结果为()()()()()()()},,2,1{n x x x x m m m m =式中()()()()∑=-=ki m m i x k x11 (k=1,2,…,n )一般通过一次累加生成就能使数据呈现一定的规律,若规律不够,可增加累加生成的次数。
同理一次累加序列为()()()()()()()},2,1{1111n x x x x =在数据生成的基础上,用线性动态模型对生成数据拟合和逼近。
对()1x 建立模型()()()()b k az k x =+10其白化形式微分方程为()()()()()μ=+t ax t d t dx 11 记参序列T b a a ][=∧→,再按最小二乘法进行求解。
其向量形式为N T T TB B B b a a →→-→→→⎪⎪⎭⎫ ⎝⎛==∧γ1][其中()()()()()()k x k x k z 001121+-=; ()()()()()()()()()()()()⎥⎥⎥⎥⎥⎦⎤⎢⎢⎢⎢⎢⎣⎡+--+-+-=→1]1[5.01]32[5.01]21[5.0111111n x n x x x x x B ; ()()()()()()T N n x x x ]32[000 =→γ;白化形式微分方程的离散解为()()()()a e a x k xak μμ--=+-]1[1ˆ01 (k=0,1,2,…,n-1) 按()()()()()()t x t x t xm m m ˆ1ˆ1ˆ1-+=+-累减生成还原,计算后得到预测数据。
显然这里只需一次累减。
利用1999年-2005年的中国人口数据,然后根据最小二乘法原理运用Matlab 软件编程(程序见附录)对参数求解可以得到:0281.0=a ,0888.0=μ,初始序列的第一个元素为0.0975。
因此可得白化形式微分方程的离散解为()()[]0281.00888.00281.00888.00975.01ˆ0281.01--=+-k e k x即 ()()1601.30626.31ˆ02881.01--=+-k e k x通过上述GM (1,1)模型的建模过程可知,模型的解是一个指数函数,实际上对于任意非负离散点序列,其一次累加序列呈现指数规律,因此,用指数函数来拟合是可以的。
模型二 模型组下面以人口发展矩阵方程为主模型,并在此基础上进一不建立生育模型和死亡模型的子模型。
主模型:改进的莱斯利模型以年为组划分年龄组,令最长寿命为m,设第t 年满i 足岁不到i+1足岁的人数为()t x i ,t=0,1,2…,i=0,1,2,…,m.其中()t x i 表示符合条件的全部人口。