18-同位素地球化学知识讲解
同位素地球化学18
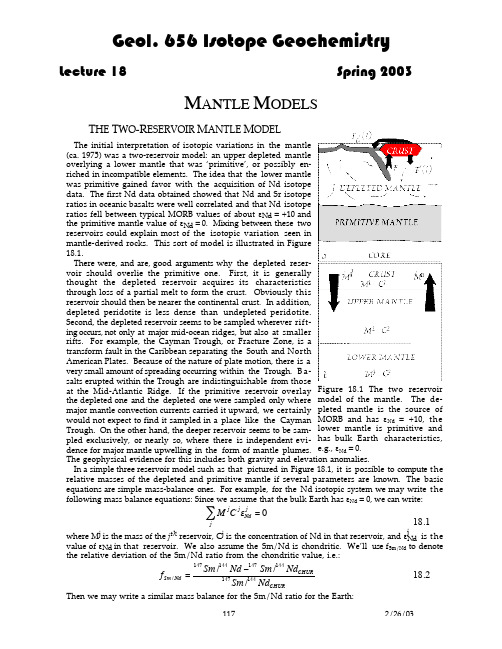
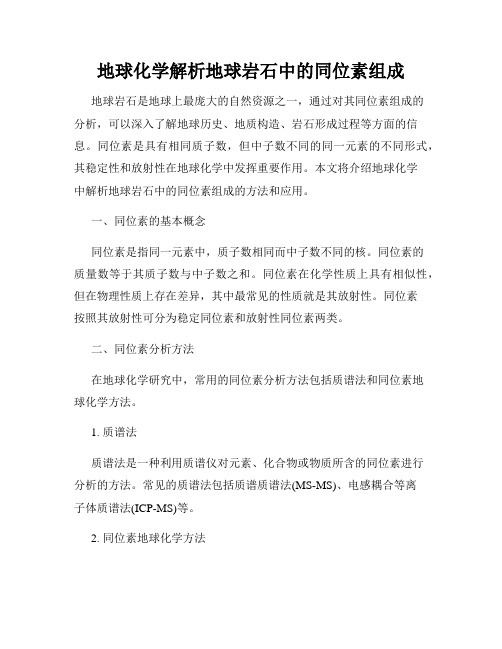
M ANTLE M ODELST HE T WO -R ESERVOIR M ANTLE M ODELThe initial interpretation of isotopic variations in the mantle(ca. 1975) was a two-reservoir model: an upper depleted mantleoverlying a lower mantle that was ‘primitive’, or possibly en-riched in incompatible elements. The idea that the lower mantlewas primitive gained favor with the acquisition of Nd isotopedata. The first Nd data obtained showed that Nd and Sr isotoperatios in oceanic basalts were well correlated and that Nd isotoperatios fell between typical MORB values of about e Nd = +10 andthe primitive mantle value of e Nd = 0. Mixing between these tworeservoirs could explain most of the isotopic variation seen inmantle-derived rocks. This sort of model is illustrated in Figure18.1.There were, and are, good arguments why the depleted reser-voir should overlie the primitive one. First, it is generallythought the depleted reservoir acquires its characteristicsthrough loss of a partial melt to form the crust. Obviously thisreservoir should then be nearer the continental crust. In addition,depleted peridotite is less dense than undepleted peridotite.Second, the depleted reservoir seems to be sampled wherever rift-ing occurs, not only at major mid-ocean ridges, but also at smallerrifts. For example, the Cayman Trough, or Fracture Zone, is atransform fault in the Caribbean separating the South and NorthAmerican Plates. Because of the nature of plate motion, there is avery small amount of spreading occurring within the Trough. B a -salts erupted within the Trough are indistinguishable from thoseat the Mid-Atlantic Ridge. If the primitive reservoir overlay the depleted one and the depleted one were sampled only where major mantle convection currents carried it upward, we certainly would not expect to find it sampled in a place like the Cayman Trough. On the other hand, the deeper reservoir seems to be sam-pled exclusively, or nearly so, where there is independent evi-dence for major mantle upwelling in the form of mantle plumes.The geophysical evidence for this includes both gravity and elevation anomalies.In a simple three reservoir model such as that pictured in Figure 18.1, it is possible to compute the relative masses of the depleted and primitive mantle if several parameters are known. The basic equations are simple mass-balance ones. For example, for the Nd isotopic system we may write the following mass balance equations: Since we assume that the bulk Earth has e Nd = 0, we can write:Mj C j e Nd j =0j Â18.1where M j is the mass of the j th reservoir, C j is the concentration of Nd in that reservoir, and e j Nd is thevalue of e Nd in that reservoir. We also assume the Sm/Nd is chondritic. We’ll use f Sm/Nd to denote the relative deviation of the Sm/Nd ratio from the chondritic value, i.e.:f Sm /Nd =147Sm /144Nd -147Sm /144Nd CHUR147Sm /144Nd CHUR18.2Then we may write a similar mass balance for the Sm/Nd ratio for the Earth:Figure 18.1 The two reservoir model of the mantle. The de-pleted mantle is the source of MORB and has e Nd = +10, the lower mantle is primitive and has bulk Earth characteristics,e.g., e Nd = 0.Mj C j f Sm /Nd j =0j Â18.3The mass balance for the Nd concentration is:Mj C Nd j =M o C Nd o j Â18.4where M o is the mass of the silicate Earth and C oNd in the concentration of Nd in the silicate Earth.Finally, the masses of our three reservoirs must sum to the mass of the silicate Earth:Mj =M o j Â18.5The first equation simply states that the bulk-earth e Nd = 0, the second that the Sm/Nd ratio is equal to the chondritic one, the third is the mass balance equation for Nd concentration (C Nd ), the fourth states that the masses of the three reservoirs must equal the total mass of the silicate earth (denoted by the superscript 0). We have implicitly assumed there is no Nd or Sm in the core. Assuming t h a t the crust has grown from primitive mantle, then *e Nd c =f Sm /Nd c QT c 18.6where T C is the average age of the crust. If the Earth consists of only three reservoirs for Nd, namely the continental crust, depleted mantle, and primitive mantle, and if the depleted mantle and crust evolved from a reservoir initially identical to ‘primitive mantle’ then the mass balance equations 18.1, 18.3, and 18.4 must hold for crust and depleted mantle alone. In this case, equations 18.1, 18.4and 18.6 can be combined to derived a relationship between the mass of the crust and the mass of the depleted mantle:M dm M c =C Nd c C Nd o -1Ê Ë Á ˆ ¯ ˜ -C Nd c C Nd o Ê Ë Á ˆ ¯ ˜ f Sm /Nd c QT ce Nd dm 18.7Thus the mass ratio of depleted mantle to crust can be calculated if we know the Sm/Nd ratio of the crust, the e Nd of the depleted mantle, and the concentration of Nd in the crust and in primitive man-tle. Figure 18.2 shows a plot that shows the solutions of 18.7 as a function of T C for various values of e dm obtained by DePaolo (1980). Most estimates of the average age of the crust are between 2 and 2.5Ga, and e dm is about +10. Possible solutions for the ratio of depleted mantle to whole mantle are in the range of 0.3 to 0.5. A number of such mass balance calculations that included other isotopic sys-tems as well were published between 1979 and 1980, all of which obtained rather similar results. In-terestingly, the fraction of the mantle above the 650 km seismic discontinuity is roughly 0.33. The mass balance calculations suggested the seismic discontinuity was the chemical boundary between upper and lower mantle.* A note on notation:The growth equation for 143Nd/144Nd is:143Nd/144Nd = 143Nd/144N d 0 + 147Sm/144Nd(e l t – 1)Since the half-live of 147Sm is long compared to the age of the Earth, we may use the approximation:e l t ≈ l t + 1and hence:143Nd/144Nd = 143Nd/144Nd i + 147Sm/144Nd l tThe equation may be transformed into epsilon notation, in which case it becomes:e Nd @e Nd i+Q Nd f Sm /Nd twhere e iNd is the initial value of e Nd (i.e., at t = 0), and Q are defined as:Q Nd=104l 147Sm /144Nd CHUR 143Nd /144Nd CHURQ Nd is a constant with a value of 25.13 Ga -1.This simple model of the mantle began to unravelas additional Nd isotopic data were acquired. Inparticular, it is now clear that the Sr and Nd isotopedata do not form a simple linear array, and that thee Nd = 0 point is not the minimum value observed in ba-salts (Figure 16.1). It is apparent then that thevariation observed in Sr and Nd isotope ratios is notsimply a result of mixing between depleted andprimitive mantle, and that reservoirs with time-in-tegrated LRE enrichment must exist in the mantle.Furthermore, Pb isotopic data never had been consis-tent with such a model. Many investigators had ig-nored the Pb isotope system because they felt it mayhave been disturbed by loss of Pb to the core.Mixing Lines on Isotope Ratio PlotsBefore going further, it should be pointed out thatscatter of the data from a linear array does not pre-clude a two-component model. This is because mixinglines on a plot of one isotope ratio against the an-other need not be straight. Indeed in the general casewhere one ratio is plotted against another, mixinglines will be curved. The degree of curvature is de-pendent of the ratio r :r =X 2/Y 2X 1/Y 118.8where X and Y are the denominators of the two ratios and subscripts 1 and 2 denote the two end mem-bers. The more this r deviates from 1, the higher the curvature of the mixing line. In the specific case of isotope ratios, the denominators are non-radiogenic isotopes whose abundance is essentially pro-portional to the abundance of the element. So for Sr and Nd isotope ratios in a mixture of components 1 and 2, the mixing line has a curvature given by:r =Sr 2/Nd 2Sr 1/Nd 118.9where Sr 1 is the concentration of Sr in component 1, etc. Only in the case where the Sr/Nd concentra-tion ratios are the same will the line be straight (r=1).Thus the scatter observed in Figure 16.3 could be due to variable Sr/Nd ratios. However, we must ask whether it is reasonable that the reservoirs could have variable Sr/Nd ratios but constant and uniform Sr and Nd isotopic compositions? The answer would seem to be no.M ULTI -R ESERVOIR M ANTLE M ODELSDePaolo and Wasserburg (1976) termed the linear correlation originally observed between Sr and Nd isotope ratios the "mantle array". Even though it is now clear that mantle does not always plot on the “mantle array”, the term has survived, and is useful for reference. In the subsequent discussion,we will use “mantle array” to refer to those data that plot close to a line passing through 143Nd/144Nd = 0.51315 (e Nd = +10) and 87Sr/86Sr = 0.7025 (typical depleted mantle) and 143Nd/144Nd = 0.51264 (e Nd =+0) and 87Sr/86Sr = 0.705 (hypothetical primitive mantle).If we consider where individual oceanic islands or island chains plot on various isotope ratio plots,we can see that there are some systematic features. For example, several islands, including St. He-lena Island in the Atlantic and the Austral Chain in the Pacific, plot slightly below the Sr-Nd man-tle array with87Sr/86Sr about 0.7029, only slightly higher than MORB. Basalts from these same is-Figure 18.2 The relationship between ratio of mass of the depleted mantle to mass of the continental crust as a function of mean age of the crust calculated from equation 18.6 using various values of e Nd for the depleted mantle.The arrows at the bottom enclose the range of probable values for the mean age of the crust.lands also plot below the Hf-Nd isotope correlation. In addition, they have remarkably radiogenic Pb, with 206Pb/204Pb > 20. Following this kind of procedure, I found that oceanic basalts fall into 5 or so groups (White, 1985). It is reasonable to suppose that this reflects the existence of 5 reservoirs, or perhaps more accurately, 5 types of reservoirs within the mantle. Although this need not necessarily be the case, the idea has been accepted as a sort of working hypothesis by mantle geochemists (al-though it is unclear exactly how many classes there are, some prefer 4 or 6).The next question to ask is what processes have lead to the distinct identities of these reservoirs.For the MORB reservoir, this question is relatively easy to answer: removal of a partial melt ac-counts for the principal isotopic characteristics. Two of the reservoirs types, called Kerguelen and Society by White (1985) but subsequently termed EM I and EM II (‘enriched mantles 1 and 2’) by Zin-dler and Hart (1986), have some characteristics of continental crust and sediment, and hence it is sus-pected that recycling of crustal material, via subduction, has been the principal process in the evolu-tion of these reservoirs. It is not clear, however, why recycling should lead to two apparently dis-tinct reservoirs. Numerous authors have suggested the St. Helena reservoir type,whose most distinc-Figure 18.3. Five reservoir types of White (1985) and the components of Zindler andHart (1986). They are essentially identical, except for Hawaii and PREMA (prevalentmantle). Other Zindler and Hart acronyms stand for high-µ (HIMU), enriched mantleI and II (EM I and EM II), and depleted MORB mantle (DMM). The main difference ininterpretation is that whereas White argued that each reservoir type many consist ofmany reservoirs, but all had evolved through similar processes, Zindler and Hart(1986) argued that five distinct reservoirs exist, and that variations in isotope ratiosresult from mixing of these reservoirs.tive characteristic is high Pb isotope ratios, and which Zindler and Hart (1986) called HIMU (for high-µ), has acquired its distinctive isotopic characteristics through recycling of the oceanic crust. The basis for this argument is the effects of ridge-crest hydrothermal activity, which apparently removes Pb from the oceanic crust, but transfers seawater U (which is ultimately of continental crustal derivation) to the oceanic crust, effectively increasing its µ. For the most part, it must be admitted that we do not yet understand the evolution of the OIB source reservoirs. It does seem, however, t h a t a number of processes have operated over geologic time to produce reservoirs in the mantle that are distinct from both depleted mantle and primitive mantle. The reservoir types of White (1985) and components of Zindler and Hart (1986) are shown in Figures 18.3 and 18.4.We should note that the existence of multiple reservoirs in the mantle does not necessarily invali-date the mass balance models discussed above if the mass of the various OIB reservoirs is insignifi-cant. Since the volume of OIB is small compared to MORB, this is certainly a possibility. However, these mass balance models also neglect the mass of the continental lithosphere, significant parts of which appear highly incompatible element enriched.Figure 18.4. Five reservoir types of White (1985) and the components of Zindler and Hart (1986)in a plot of e Nd vs. 87Sr/86Sr.O PEN S YSTEM M ODELS OF M ANTLE E VOLUTIONA radically different view of the mantle has been taken in papers by Galer and O’Nions (1985) and White (1993). The models we have discussed thus far assume that isotope ratios in mantle reservoirs reflect the time-integrated values of parent-daughter ratios in those reservoirs. Indeed, we devoted some time to the concept of time-integrated parent-daughter ratios in Lecture 16. Wasn’t this, after all, what Gast said, that (among other things) an isotope ratios reflects the time-integrated parent-daughter ratio?Indeed, what did Gast say? He said “The isotopic composition of a particular sample of stron-tium... may be the result of time spent in a number of such environments. In any case, the isotopic com-position is the time-integrated result of the Rb/Sr ratios in all past such environments.” If for exam-ple, a sample of Sr from the depleted upper mantle (we’ll adopt the acronym DUM * for this reser-voir) had spent the past 4.55 Ga in that reservoir, its isotopic composition should indeed reflect the time-integrated Rb/Sr in that reservoir. But suppose that sample of Sr had spend only the last few hundred million years in the DUM? Its isotopic composition will be more of a reflection of the Rb/Sr ratios in the previous environments than in DUM. This is exactly the point made by Galer and O’Nions.We have seen in previous lectures that the time integrated Th/U ratio is recorded by the 208Pb*/206Pb* ratio. Galer and O’Nions (1985) found that the average 208Pb*/206Pb* in MORB corre-sponded to a time-integrated Th/U ratio of about 3.75. The chondritic Th/U ratio, according to sev-eral compilations, is about 3.9. Since Th and U are both highly refractory elements, this should be the ratio of the bulk earth as well. The present-day Th/U ratio of the mantle source of a basalt can be deduced from Th isotope systematics, as we have seen. According to the compilation made by Galer and O’Nions, the Th/U ratio in DUM, based on Th isotope ratios in MORB, is about 2.5. That the present ratio is lower than the chondritic one makes perfect sense because Th is more incompatiblethan U, so we would expect thisratio to be low in DUM. Assumingthe upper mantle started out witha chondritic Th/U ratio of 3.9 a t4.55 Ga, and has decreasedthrough time to 2.5, the time-integrated ratio should be some-where in between these two val-ues. Indeed, it is. However, thetime-integrated value of 3.75 issurprisingly close to the initialvalue. This would imply in a sim-ple evolutionary model of themantle that the depletion in Threlative to U must have occurredrelatively recently. Indeed, as il-lustrated in Figure 18.5, this de-pletion must have occurred only 600 Ma ago. This is a surprising re-sult, and one that is inconsistent with other evidence. For example,Nd isotope ratios in ancient man-tle-derived volcanic rocks suggests depletion of the upper mantle be-* You may get the impression that to really succeed in mantle isotope geochemistry you need to be good at thinking upacronyms. As near as I can tell, this is true. This acronym is due to Claude Allegre.Figure 18.5. Evolution of 208Pb*/206Pb* is a system with Th/U =2.5 assuming a starting Th/U of 3.9. k – Pb is the time-integrated value of k . Lines indicate various values of µ ranging from 4 to 16. Histogram on the right shows the values of k – Pb in parison of these values with the evolution lines suggests a residence time for Pb in the upper mantle of 600 ±200 Ma. From Galer and O’Nions (1985).gan early in Earth’s history, as we shall see. Furthermore, the average age of the continental crust appears to be about 2-2.5 Ga. If the depleted mantle is the complimentary reservoir to the continen-tal crust, time-integrated parent-daughter ratios should indicate a depletion age of about 2-2.5 Ga. Galer and O’Nions (1985) concluded that something was very wrong with conventional views of the mantle. They suggested that Pb now in the upper mantle had not resided there for long, that it was ultimately derived from a lower mantle reservoir that had a primitive (i.e., chondritic) Th/U ratio. In other words, the upper mantle had not evolved simply by losing melt fractions to the continental crust, but was a completely open system, with fluxes into it as well as out of it. The argued that the apparent depletion time of 600 Ma was in reality simply the residence time‡ of Pb in the upper man-tle.Subsequently, most geochemists would now agree that the Th/U ratio for the bulk Earth is higher than 3.9, probably in the range of 4.0 to 4.2 (but perhaps as high as 4.3). However, additional Th iso-tope data on MORB indicates a lower present-day k for the depleted mantle than estimated by Galer and O’Nions in 1985 (2.3 vs. 2.5), so the dilemma posed by Galer and O’Nions remains.I (White, 1993) found that a similar problem arose with U/Pb ratios and came to similar conclu-sions as those of Galer and O’Nions. As we have seen, Pb isotope ratios in MORB rather surprisingly record a time-integrated value of µ that is higher than the bulk earth ratio (because they plot to the right of the geochron). However, I concluded from several lines of evidence that present value of µ in the upper mantle must be lower than bulk Earth. One of these lines of evidence involves solving a mass balance equation for the crust and upper mantle for U, Th, Pb and Ce. As we have seen, Pb is a volatile element, so its concentration in the bulk earth is not a priori known. It turns out, however, that the Pb/Ce ratio in MORB is constant. Since the other three elements are refractory, their con-centrations in the bulk Earth can be assumed to be chondritic, the following relation can then derived: mDM=18.10where M BSE = M C + M DM, and the subscripts DM, C, and BSE denote depleted mantle, continental crust, and bulk silicate Earth respectively. The constant arises from terms for the fractional abundance of 204Pb and conversion from ppm to molar units. When reasonable estimates for the various parameters are substituted into the right hand side of 18.10, one derives a value for µDM of 6 or less, whereas the best estimates for bulk silicate earth are around 8.Thus the depleted mantle does appear to have a µ that is lower than bulk Earth, just as we would expect. But this low ratio has not been recorded by Pb isotope ratios. The obvious conclusion is that Pb in MORB could not have be present in the depleted mantle, and that it must be some flux of Pb to the upper mantle as well as out of it. I found that Pb isotope systematics were not consistent with this Pb being derived from some primitive mantle reservoir, as suggested by Galer and O’Nions. Using Galer and O’Nions estimate of the residence time of Pb in the upper mantle, I calculated the necessary flux using equation 18.11. It turns out that this flux can easily be supplied by mantle plumes, which clearly penetrate the upper mantle, and as we shall see, mix with it. Thus it appears to be mantle plumes that supply Pb, and probably other highly incompatible elements to the upper mantle, per-haps maintaining their concentrations in near steady-state. Figure 18.6 is a box model and schematic that illustrates some of the possible important fluxes through the mantle.‡Residence time of some element i in a reservoir is defined as:t=CiMi¶i18.11where t is the residence time, C i is the concentration of element i in the reservoir, M i is the mass i in the reservoir, and ƒi is the flux of i into or out of the reservoir. The residence time of Pb in the depleted mantle is the average time an atom of Pb will spend there between entering and leaving.Figure 18.6. Box Model and corresponding schematic Earth illustrating the flow of U, Th and Pb through the Earth. Oceanic crust is created at mid-ocean ridges by partial melting of the de-pleted mantle. Th and U are partitioned into the melt to a greater extent than Pb. Hydrother-mal exchange removes Pb from the oceanic crust, depositing it in sediment, and also deposits seawater U in the oceanic crust, resulting in an oceanic crust with a high µ. Some U, Th, and Pb are removed from the oceanic crust in subduction zones, but most remains and sinks to the bound-ary layer below the depleted mantle. Most marine sediment, which has a low µ, is accreted to continents or purged of U, Th and Pb in subduction zones. New continental crust, consisting of ac-creted sediment and juvenile island arc magma, has a low µ, but intracrustal differentiation produces an upper crust of high µ. Plumes form from the boundary layer of high-µ subducted oceanic crust. They mix with the depleted mantle, resupplying the depleted mantle with in-compatible elements. Some flux of undegassed primitive mantle to the plume-source seems nec-essary to supply noble gases, but this has a trivial effect on the U-Th-Pb balance. The role of the subcontinental mantle lithosphere, as well as it’s Pb isotopic systematics, is uncertain. Size of the boxes does not correspond to the size of the reservoir.G EOGRAPHIC V ARIATION IN M ANTLE I SOTOPIC C OMPOSITIONAn interesting question is whether geographic variations in mantle chemistry can be identified on a larger scale that that of individual volcanic island chains. The answer turns out to be yes. The first such geographic variation observed was on the Mid-Atlantic Ridge. Sr and Pb isotope ratios in MORB were observed to decrease with distance from Iceland and the Azores. Figure 18.7 illustrates Sr isotopic variations along the Mid-Atlantic Ridge. These variations were interpreted as 'contam-ination' of the asthenosphere by the Azores and Iceland mantle plumes. Somehow, the rising mantle plume mixes with asthenosphere through which it ascends, with the effect on isotopic compositions being noticeable up to 1000 km from the center of the plume. Similar effects have also been noted where even a ridge is located in proximity to a hot spot or mantle plume, including Easter Island, the Galapagos, and several of the islands in the South Atlantic and Indian Oceans.These geographic variations are, however, recently imposed features of mantle plume dynamics.The do not necessarily imply mantle geochemical provinces. Is there evidence for such provinces,comparable to say tectonic provinces of the continents? The answer is again yes. Perhaps the first such 'province' to be identified was the Indian Ocean geochemical province. Data published as early as the early 1970's suggested MORB from the Indian Ocean were distinct from those of the Pacific and the Atlantic, having higher 87Sr/86Sr ratios. However, the scarcity and poor quality of data on In-dian Ocean MORB left the issue in doubt for more than a decade. It was resolved with a flood of data on Indian Ocean MORB, beginning with a paper by Dupré and Allègre (1983). Dupré and Allègre found Indian Ocean MORB has higher 87Sr/86Sr ratios but lower 206Pb/204Pb ratios compared to MORB from other oceans. They also have high 207Pb/204Pb and 208Pb/204Pb ratios for a given value of 206Pb/204Pb than other MORB. This is illustrated in Figure 17.1. Furthermore, these characteristics seem to be shared by many of the oceanic islands in the Indian Ocean. Subsequent work showed Indian Ocean MORB have low 143Nd/144Nd as well.Hart (1984) noticed that oceanic basalts with high 207Pb/204Pb and 208Pb/204Pb ratios for a given value of 206Pb/204Pb come mainly from a belt centered at about 30° S. Hart named this feature the DUPAL anomaly (after Dupré and Allègre). He defined the DUPAL isotopic signature as having higher ∆Sr (∆Sr = [87Sr/86Sr – 0.7030] ¥ 104) and high ∆8/4 and ∆7/4. The value of ∆8/4 and ∆7/4 are percent deviations from what Hart defined as the Northern Hemisphere Regression Line, regression lines through the 208Pb/204Pb—206Pb/204Pb and 207Pb/204Pb —206Pb/204Pb arrays for northern hemisphere data:∆8/4 = [208Pb/204Pb – 208Pb/204Pb NHRL ] ¥ 10018.12∆7/4 = [207Pb/204Pb – 207Pb/204Pb NHRL ] ¥ 10018.13Figure 18.7. Variation of 87Sr/86Sr in MORB along the Mid-Atlantic Ridge. FromWhite et al. (1976).where 207Pb/204Pb NHRL = 15.627 + 1.209 207Pb/204Pb18.14and208Pb/204Pb NHRL = 13.491 + 0.1804 208Pb/204Pb 18.15Subsequently, Castillo (1989) suggested that Hart’s “DUPAL anomaly” actually consisted of two separate regions: the DUPAL in the Indian Ocean, and the “SOPITA” (South Pacific Isotope andThermal Anomaly) inthe South Pacific andpointed out they corre-spond to regions of slowmantle seismic veloci-ties, which in turn im-ply high mantle tem-peratures. Castillo’smap is shown in Figure18.8.Interestingly, theDUPAL characteristicis shared by both In-dian Ocean OIB andMORB, but this doesnot seem to be the casein the Atlantic and Pa-cific. The DUPAL sig-nature has not been ob-served in Atlantic or Pacific MORB, exceptin the immediate vicin-ity of the Tristan da Cunhamantle plume in the southAtlantic. An additionalquestion relates to samplingcoverage. Nearly two-thirds of oceanic island oc-cur in this belt, so it is notsurprising that a particularchemistry in often foundthere. Nevertheless, it isclear that there is some-thing anomalous about thisregion.The Galapagos Archi-pelago provides another re-cent example of geographicvariation of isotope compo-sition in the mantle. TheGalapagos provide an un-usually favorable opportu-nity for producing a geo-chemical map of the man-tle because they consist of 20 or so volcanoes t h a t have all been activeover Figure 18.8. Map showing the distribution of mantle plumes (triangles), P-wave velocity anomalies (m/sec) averaged over the whole lower mantle (red lines), and location of the DUPAL and SOPITA isotope anomalies (pale red regions). Mantle plumes are located in regions of slow lower mantle seismic velocities, implying high temperatures. After Castillo(1989).Figure 18.9. Contour map of e Nd variation in the mantle beneath the Galapagos. Contouring is based on average e Nd from 21 volcanos, whoselocations are shown by solid dots (Locations were corrected for plate motion since time of eruption).the past 2 or 3 million years. Combining Nd isotope ratio determined on basalts from these volcanoes as well as data from previous geochemical studies of the Galapagos Spreading Center (GSC) just to the north, White et al. (1993) produced the contour map of Nd isotope ratios shown in Figure 18.9.The contours reflect regional geochemical variations in the mantle below.The contouring reveals a horseshoe-shaped region around the western, northern, and southern pe-riphery of the archipelago in which low e Nd values occur, and a region in the center of the archipel-ago in which high e Nd values occur. The high e Nd values are more typical of MORB than of oceanic is-land basalts. This pattern was unexpected. From what was observed along the MAR (Figure 18.7),one might expect e Nd to decrease radially from the center of the archipelago.The pattern in the Galapagos may reflect the fluid dynamics of plume-asthenosphere boratory experiments have shown that a thermal plume (i.e., one that rises because it is thermal buoyant rather than chemically buoyant) will entrain surrounding asthenosphere if it is bent by as-thenospheric motion. This is because the surrounding asthenosphere is heated by the plume, as a re-sult, it also begins to rise. This interpretation is illustrated in a Figure 18.10.R EFERENCES AND S UGGESTIONS FOR F URTHER R EADINGCastillo, P. 1989. The Dupal anomaly as a trace of the upwelling lower mantle. Nature . 336: 667-670.Hart, S. R. 1984. The DUPAL anomaly: A large scale isotopic mantle anomaly in the Southern Hemi-sphere. Nature . 309: 753-757.Galer, S. J. G. and R. K. O'Nions, 1985. Residence time of thorium, uranium and lead in the mantle with implications for mantle convection., Nature , 316, 778-782.DePaolo, D. J. 1980. Crustal growth and mantle evolution: inferences from models of element transport and Nd and Sr isotopes. Geochim Cosmochim Acta . 44: 1185-1196.Wasserburg, G. J. and D. J. DePaolo. 1977. Models of earth structure inferred from neodymium and strontium isotopic abundances. Proc. Natl. Acad. Sci. USA . 76: 3594-3598.White, W. M., 1985. Sources of oceanic basalts: radiogenic isotope evidence, Geology , 13: 115-118.White, W. M., 1993 238U/204Pb in MORB and open system evolution of the depleted mantle, Earth Planet. Sci. Lett., 115, 211-226.White, W. M., A. R. McBirney and R. A. Duncan. 1993. Petrology and Geochemistry of the Galapa-gos: Portrait of a Pathological Mantle Plume. J. Geophys. Res. 93: 19533-19563.Figure 18.10. Cartoon illustrating the sheared plume model. Stippled pattern represents litho-sphere, cross-hatched pattern is original plume material, grayed patterned is asthenosphere,darker gray is thermally buoyant asthenosphere. a.) East-west cross section beneath the center of the archipelago, b.) North-south cross section at the longitude of Isabela.。
第三章同位素地球化学一概论

达尔文在他的月球可能从地球分离出去的研究中,得
出一个5千7百万年的数值。
地质学家乔利用海洋里钠的聚积速率,计算出海洋的
年龄为8—9千万年。
在1893年里德根据沉积速率的研究,计算出从寒武纪
开始以来经历了6亿年。古德蔡尔德根据同样的方法计 算得出7亿年。
同位素地球化学 17 2018/11/15
成、丰度及其在地质作用中分馏
和衰变规律的科学。
同位素地球化学 4
2018/11/15
基本概念
核素 Nuclide 同位素 Isotope 稳定同位素 Stable isotope 放射性同位素 Radioactive isotope 同位素分馏 Isotope Fractionation 同位素衰变 Isotope radioactive decay
同位素地球化学 7
2018/11/15
基本概念
同量异位数:质子数不同而质量数相 同的一组核素,如:
86Rb-86Sr 144Sm-144Nd 40K-40Ar-40Ca 206Pb-206Tl, 204Pb-204Hg
教材中表1-9
2018/11/15
同位素地球化学 8
基本概念
同位素地球化学 5
2018/11/15
基本概念
核素:
核素是指具有一定数目质子和一定数目中子的一种原 子。例如,原子核里有6个质子和6个中子的碳原子, 质量数是12,称为碳-12核素,或写成12C核素。原 子核里有6个质子和7个中子的碳原子,质量数为13, 称13C核素。氧元素有16O,17O,18O三种核素。具
着,我们可以利用放射性同位素的这一特 同位素技术还可以用于矿产勘查、环境监测、 体形成的环境条件、机制,并能示踪物质来 关,因些可用来设计各种矿物对的同位素温 性测定各种地质体的年龄,特别适合岩浆 地质灾害预报 源。 度计来测定成岩 -成矿温度。 岩、显生宙的前寒武纪地变质地层及其它 复杂地质体的年龄。
百科知识精选同位素地球化学
分馏系数分馏系数表示同位素的分馏程度,反映了两种物质或两种物相之间同位素相对富集或亏损程度。
在自然界,分馏系数是指两种矿物或两种物相之间的同位素比值之商。
其表达式为:□ A-B=RA/RB式中A和B表示两种物质(物相),R代表重同位素对轻同位素的比值,如18O/16O,13C/12C等。
□ 值偏离1愈大,说明两种物质之间的同位素分馏程度也就愈大;□=1时,物质间没有同位素分馏。
δ值稳定同位素组成常用δ值表示,δ值指样品中某元素的稳定同位素比值相对标准(标样)相应比值的千分偏差。
其公式为□δ值能清楚地反映同位素组成的变化,样品的δ值愈高,反映重同位素愈富集。
样品的δ值总是相对于某个标准而言的,同一个样品,对比的标准不同得出的δ值各异。
所以必须采用同一标准;或者将各实验室的数据换算成国际公认的统一标准,这样获得的δ值才有实际应用价值。
比较普遍的国际公认标准为:①SMOW,即标准平均海洋水,作为氢和氧的同位素的国际统一标准;② PDB,是美国南卡罗来纳州白垩系皮狄组地层内的似箭石,一种碳酸钙样品,用作碳同位素的国际统一标准,有时也作为沉积碳酸盐氧同位素的标准;③CDT,是美国亚利桑纳州迪亚布洛峡谷铁陨石中的陨硫铁,用作硫同位素的国际统一标准。
稳定同位素实验研究表明,大多数矿物对体系(矿物-矿物)或矿物-水体系,在有地质意义的温度范围内,103ln□ 值与T 2成反比,T为绝对温度。
103ln□ 值可以近似地用两种物质的δ差值表示,即δ-δB=ΔA-B≈103ln□A-B。
因此,只要测得样品的δ值,就可直接计算出103ln□值。
它同样表示物质间同位素分馏程度的大小,利用它可绘制同位素分馏曲线,拟合同位素分馏方程式和计算同位素平衡温度(见地质温度计)。
在稳定同位素地球化学研究中,H、C、O、S等研究较深入。
它们在天然物质中分布广泛,可形成多种化合物,由于它们的同位素质量数都比较小,相对质量差别大,因而同位素分馏更明显,这对确定地质体的成因及其物质来源和判明地质作用特征具有重要意义。
同位素地球化学PPT课件
32
1)轻稳定同位素
A. 原子量小,同一元素的各同位素间
的相对质量差异较大(ΔA/A≧5%);
B. 轻同位素组成变化的主要原因是同
位素分馏作用造成的,其反应是可逆的。
2019/7/3
第五章 同位素地球化学Ⅰ
33
2)重稳定同位素
A. 原子量大,同一元素的各同位素间的相
对质量差异小(ΔA/A=0.7~1.2%),环境 的物理和化学条件的变化通常不导致重稳 定同位素组成的改变;
526262621放射性同位素衰变定律及同位素地质年代学原理622kar法及40ar39ar法年龄测定623rbsr法年龄测定624smnd法年龄测定625upb法年龄测定53621621同位素地质年代学的基本原理前提及分类541放射性原子释放出粒子和能量的现象即所谓的放2放射性衰变元素的原子核自发地发出粒子和释放能量而变成另一种原子核的过程
2019/7/3
第五章 同位素地球化学Ⅰ
11
5. 同位素地球化学发展现状
同位素地球化学发展迅速,已渗透到地 球科学的各个研究领域,如:大地构造 学、岩石学、矿床学、海洋学、环境科 学、空间科学等。
主要表现在以下方面:
♣ 实验测试技术不断完善和提高; ♣ 多元同位素体系的综合研究; ♣ 研究领域不断扩大; ♣ 各种新方法的出现 。
28
② 类型
1)放射性同位素(unstable or radioactive isotope)
其原子核是不稳定的,它们能自发地放出粒子并衰变成 另一种同位素。
2)稳定同位素(stable isotope)
原子核是稳定的,或者其原子核的变化不能被觉察。 元素周期表中,原子序数相同,原子质量不同,化学性
地球化学 第四讲 同位素地球化学

② 同位素交换反应:就是在化学反应中反应物和生成物之间由 于物态、相态及化学键性质的变化,使轻重同位素分别富集在不 同分子中而发生分异,称同位素交换反应。(轻同位素易断裂) 例如:大气圈与水圈之间发生氧同位素交换反应
2H 2 18O16O2 2H 2 16O18O2
(0℃:α=1.074, :α=1.006)
Geochemistry
College of geological science & engineering, Shandong university of science & technology
问题:如何用δ求解αA-B=RA/RB αA-B=RA/RB=(δA+1)/(δB+1) 4、同位素富集系数:
③ 生物化学反应:动植物及微生物在生存过程中经常与介质交换 物质、并通过生物化学过程引起同位素分馏。 例如:植物通过光合作用,使12C更多地富集在有机体中,因此 生物成因地质体如煤、油、气等具有高的12C。生物成因的34S低。 (前生物时代碳质成因?)
Geochemistry
College of geological science & engineering, Shandong university of science & technology
Creativity
Geochemistry
College of geological science & engineering, Shandong university of science & technology
元素:具有相同质子数的核素称为元素。
同位素:具有相同质子数,不同中子数的一组核
Geochemistry
第六章 同位素地球化学
第五章同位素地球化学第一节基本概念与原理一、同位素的定义:核素:是由一定数量的质子(P)和中子(N)构成的原子核。
核素具有质量、电荷、能量、放射性和丰度5中主要性质。
元素:具有相同质子数和中子数的核素。
同位素:原子核内质子数相同而中子数不同的一类原子叫做同位素(isotope),他们处在周期表上的同一位置二、同位素的分类放射性同位素(radioactive isotope):原子核是不稳定的,它们能够自发地衰变成其他核素的同位素。
最终衰变为稳定的放射性成因同位素。
目前已知的放射性同位素达1200种左右,由于大部分放射性同位素的半衰期较短,目前已知自然界中存在的天然放射性同位素只有60种左右。
放射性同位素例子:238U→234Th+4He(α)+Q→ 206Pb;235U→ 207Pb;232Th→ 208Pb稳定同位素(stable isotope):原子核是稳定的,迄今还未发现它们能够自发衰变形成其他的同位素。
稳定同位素又可以分为轻稳定同位素和重稳定同位素。
轻稳定同位素,又称天然的稳定同位素,是核合成以来就保持稳定。
其特点是①原子量小,同—元素的各同位素间的相对质量差异较大;②轻稳定同位素变化主要原因是同位素分馏作用所造成的,其反应是可逆的。
如氢同位素(1H和2H)、氧同位素(16O和18O)、碳同位素(12C和13C)等。
重稳定同位素,又称放射成因同位素(radiogenic isotope):稳定同位素中部分是由放射性同位素通过衰变后形成的稳定产物。
其特点是①原子量大,同—元素的各同位素间的相对质量差异小(0.7%~1.2%)环境的物理和化学条件的变化通常不导致重稳定同位素组成改变;②重稳定同位素变化主要原因是放射性同位素衰败引起,这种变化是单向的不可逆的。
如87Sr是由放射性同位素87Rb衰变而来的;三、同位素的丰度的表示方法同位素丰度(isotope abundance) :可分为绝对丰度和相对丰度。
同位素入门知识PPT课件

定量——相关模型
Iso Source 模型
Iso Source 模型以质量平衡混合模型为基础.在该模型中,在一定增量范围内,使用标准线型混合 模型来模拟每一种可能污染比例( 和为 1) ,模型在混合计算中满足同位素质量守恒,通过测试的 同位素值信息来确定混合物各部分的比例范围,因而同样可以用来估算各种硝酸盐来源对河流硝酸 盐污染的贡献率,计算出的每个解代表了一个资源百分比的组合。在软件中设置好模 型 的 增 量 参 数 ( increment ) 和 容 差 参 数( tolerance) ,模型利用迭代方法计算出水样中不同污染来源所 占贡献率的概率分布图,并给出所有来源计算结果的平均值。不同来源所有可能的百分比组合则按 下式计算:
PDB——Peedee Belemnite(南卡罗林纳州白 垩系)C/O同位素
CDT——Canyon Diablo troilite(亚利桑纳 州迪亚布罗峡谷铁陨石中的陨硫 铁)S同位素
氮同位素一般用大气氮(AIR)作为标准,氧同位素采用 维也纳标准海水(VSMOW)作为标准。
2019/11/3
9
定性——影响因素
氨化过程、硝化过程、反硝化过程引起的分馏分别是±1‰、- 12‰~-29‰、 -40‰~-5‰,其中反硝化作用的影响最大。
由于生物体降解、土壤有机氮矿化、地下水运动等过程需要 持续较长的时间,使得滞留氮库向河流的输移过程可能需要几个 月到几十年。
2019/11/4
10
定量——相关模型
费用 高 低 低
两步还原法 淡水、海水 N、O
少
δ 15N:±0.2 低 δ 18O:±0.3
2019/11/4
15
存在问题
• 如何利用最少指标得到最准确的数据?有没有更好的替代指标使得工作量小 且结果准确? • 用不用测当地源污染同位素范围?滞留作用会影响同位素值,使得计算得到 的同位素值存在误差。分馏作用的程度怎样判断?全面深入分析氮源在迁移转化 过程中对同位素值的影响因素,建立模型定量分析氮的分馏作用对同位素源识别 具有重要意义。 • 精确性的保证。从采样点的设置、样品预处理到最终的模型计算都会对结果 产生影响。如何有效提取和纯化样品,避免同位素制备过程中的同位素污染及分 馏? • 综合考虑氮源及引起同位素分馏的因素,如何优化现有的数学模型或者开发 新的计算模型?
地球化学第六章_同位素地球化学-放射性同位素
式中λ为衰变比例常数,简称衰变常数,dN/dt是任一时刻(t)时的衰变速率。 对上式积分得:
∫
t dN = −λ ∫ dt N0 N t0 N
设t=0时,放射性母体原子数为N0,得:lnN-lnN0=-λ t 化简得:
N=N0e
-λ t
,
该公式表示原子数为N0的放射性同位素, 与经过时间t后残存的母体原子数之间的关系。 设衰变产物的原子数为D*,当t=0时D=0,经过时间t的衰变反应,则, D*=N0-N 则,D*= N0(1-e ) or D= N(e -1) 如果一体系中,t=0 时的子体原子数为D0,则该体系子体原子总数为:
第六章 同位素地球化学 放射性同位素地球化学
第一节 放射性同位素地球化学基础
一、放射性衰变反应 1). α衰变 放射性母体同位素放出α粒子, 而转变为另一个新的子体核素。 α粒子由 2 个质子和 2 个中子组成,带正电荷+2。实际为 He 原子核。 衰变子体相对于母体来说,质子数和中子数各减少 2 ,同时质量数减少 4。
2
同位素及其衰变产物 (5)矿物岩石刚形成时只含某种放射性同位素,而不含与之有衰变关系的子体,或虽含一 部分子体但其数量可以估计 (6)对所测定的矿物、岩石的地球化学有相当可靠认识 2、同位素地质年代学所感兴趣的,是自然存在的为数不多的一些放射性同位素核素,主要 包括: – 具有非常慢的衰变速率的(如238U, 235U,232Th, 147Sm, 40K等)、 – 由长寿命放射性母体衰变产生的(如234U,230Th, 226Ra等)、 – 由天然核反应产生的(如14C, 10Be等)、以及由人工核试验产生的放射性同位素。 3、放射性同位素年龄的地质学含义 对同一地质体,选用不同的同位素测年方法,往往会得到不同的年龄值,它们所代表的 地质意义不同。 己有研究表明,对于一个缓慢冷却的岩体来说,不同矿物的封闭温度是不同的,不同的 同位素体系在同种矿物中的封闭温度也是不同的。 同位素年龄时钟是在低于封闭温度时才开 始启动的。 对于根据放射性同位素体系获得的地质年龄,Rollison(1993)划分出具有不同地质含义的 几种年龄: (1) 结晶年龄。对于火成岩体,矿物的结晶年龄记录了岩石的岩浆作用年龄。对于变质 岩体,如果变质矿物的结晶温度低于其封闭温度,则矿物一经形成,同位素时钟就 立即启动、开始记时,从而记录下变质岩结晶年龄。 (2) 冷却年龄。对于火成岩体,冷却年龄是指岩体固结之后的冷却过程中,达到矿物的 封闭温度时同位素时钟开始启动记录下来的年龄。对于变质岩体,矿物在变质高峰 期结晶生成,之后冷却过程中达到矿物的封闭温度时同位素时钟启动记录下来的年 龄。 (3) 变质年龄。很易与冷却年龄混淆,但它是指变质作用高峰期的年龄。变质年龄的确 定方法取决于变质作用的级别。对于低级变质作用,可选用封闭温度较高的某些特 定矿物来确定变质年龄; 对于高级变质作用, 则往往采用全岩的Rb-Sr或Sm-Nd同位 素体系来推断。 (4)地壳形成年龄。是指一个新的大陆地壳块体从地幔中分异出来的时间(O’Nions et al., 1983)。通常通过Sm-Nd模式年龄计算来获得。 (5)地壳滞留年龄。对来自大陆地壳块体剥蚀下来的沉积岩进行Sm-Nd同位素分析,可计 算获得一个地壳滞留年龄(tCR),反映地壳形成年龄。该年龄比地层沉积年龄值大。
同位素地球化学基础

衰变定律
母体和子体概念: 母体:放射性核素 子体:衰变产物
同位素地球化学基础
01
卢瑟福(1902)实验结果:
03
衰变的母体、子体原子数只与时间有关,与体系T,P等物理化学条件无关。
02
单位时间内衰变的原子数正比于放射性母体原子数。
同位素地球化学基础
同位素地球化学基础
衰变定律表达式: dN/dt = N (原子数目与时间的关系) dN / N = - dt, 左边由No积分到N, 右边由0积分到 t, 得: ln N - ln No = - t N/No = e - t 或 N = No e - t
04
例如:蒸发-凝聚:蒸汽富H2O,水体富D2O
05
扩散:高层富14N,低层富15N
06
等。
07
同位素地球化学基础
同位素地球化学基础
化学分馏
01
在化学反应过程中引起轻重同位素的分异称为化学分馏 分子振动频率 化学键强度 反应速率(K) = > 产物中富集轻同位素
02
同位素地球化学基础
同位素地球化学基础
同位素地球化学基础
01
偏差值:与国际通用标准样品之间的偏 差
03
R(样品) - R(标准样品)
05
(%o)= [(R样品- R标准)/ R标准]1000
02
绝对比值差:
04
相对比值差:
同位素地球化学基础
同位素地球化学基础
STEP1
STEP2
STEP3
STEP4
18O(%o)= [(18O / 16O )样品- (18O / 16O )标准]/ (18O / 16O )标准}1000
生物地球化学中的氧同位素
生物地球化学中的氧同位素氧同位素是氧原子核内所含的中子数不同而导致的同种元素的不同形态。
氧同位素主要有三种,分别是氧-16、氧-17和氧-18,其中氧-16占自然界中绝大部分的氧元素,占99.76%,氧-17和氧-18占剩下的0.24%。
在生物地球化学中,氧同位素主要应用于研究水、大气和生物界的循环过程,具有很广泛的应用前景。
氧同位素的分布氧同位素存在于大气层、海洋和陆地水体中的水分子中,同时还存在于生物体内的骨骼、齿齒、组织和营养物中。
氧同位素的分布与地理环境、生物区系、气象和地质过程密切相关。
对于自然界中的水分子,它们的氧同位素比值在不同的水体中是有差异的。
比如,冰雪中氧-18比例较高,而热带和亚热带降雨中氧-18比例偏低。
这是由于水分子的蒸发和降雨过程受到气温、大气压力、风向风速等因素的影响而导致的。
生物界中的氧同位素也表现出某些可观测规律。
例如,在不同海域中的浮游植物或浮游动物体内氧同位素组成的比值存在一定的差异,这是由于生物体内水分子的氧同位素组成差异而导致的。
氧同位素的应用氧同位素在地质、大气、海洋和生命科学等领域中都有广泛的应用。
地质领域研究氧同位素比率可以揭示出不同地质时期的环境变化,也可以对化石植物、矿物、沉积物等进行年代和来源的判别。
例如,有关地球历史上海洋水温度变化的研究表明,温度升高时海水中氧-18的比例将增加,而温度降低时氧-18的比例将降低。
因此,通过样品中氧同位素比率的变化可以反映出相对海洋表层温度的变化。
大气领域氧同位素可以用来追踪和识别大气中气体的来源和去向。
例如,通过大气中O2分子和CO2分子氧同位素的比率,可以识别出植物的光合作用贡献情况。
通过观测化石气泡等物料中的氧同位素,也可以重建太古时代的大气气候和气体成分的变化。
海洋领域氧同位素在海洋领域中有着丰富的应用前景。
例如,研究海洋沉积物中氧同位素比率的变化可以揭示出水文循环的变化、冰期和间冰期之间海平面变化的状况。
初中地理同位素知识点总结

初中地理同位素知识点总结同位素是指具有相同原子序数但质量数不同的同一元素的不同种类。
地理上的同位素主要应用在石油、矿产、环境、气候等领域,通过同位素的测定可以探究地球演化、地质过程、自然界的功能等。
一、同位素的定义和基本知识1. 同位素的概念:同位素是指具有相同原子序数(即原子核中质子的数目相等)但质量数不同(即原子核中质子与中子的总数不同)的同一元素的不同种类。
例如,氢的同位素有氘(质量数为2)和氚(质量数为3)。
2. 同位素的命名:同位素的命名以元素符号后加上质量数来表示,如氧的三个同位素分别为氧-16、氧-17和氧-18。
3. 同位素的相对丰度:地球上不同同位素的相对丰度是可以测定的。
例如,自然界中碳元素主要存在于两种同位素形式,碳-12(约占98.9%)和碳-13(约占1.1%)。
4. 同位素的稳定性和放射性:同位素可分为稳定同位素和放射性同位素两类。
稳定同位素指在地球上存在时间极长,可以长期稳定存在的同位素,如氢-1、氧-16等;放射性同位素指存在于地球上时间较短,通过自发核变而释放掉额外粒子和能量的同位素,如铀-235、铀-238等。
二、同位素在地质研究中的应用1. 同位素年代学:同位素年代学是地质学中常用的一种年代测定方法。
通过测定岩石或化石中的同位素含量,可以推断它们的年代。
例如,锆石中含有稳定的铀同位素和放射性的铅同位素,测量二者的相对丰度可以确定锆石的年龄。
2. 同位素地球化学:同位素地球化学研究地球上各个部分同位素的分布、转化和迁移,探究地球演化过程中的地质作用和环境变化。
例如,通过测量大气中氡同位素的含量,可以研究大气对氡同位素的吸附和释放过程。
3. 同位素地貌学:同位素地貌学研究地貌形成机制、历史演变和现代地理过程,利用同位素测定土壤、矿物、水体等中的同位素含量。
例如,通过测量河流水体中氧同位素的含量,可以揭示水文循环的过程和特点。
三、同位素在环境科学中的应用1. 同位素示踪技术:同位素示踪技术是环境科学研究中常用的一种方法,通过标记特定同位素来追踪和分析物质在环境中的迁移、转化和作用过程。
地球化学中的元素和同位素地球化学
地球化学中的元素和同位素地球化学地球化学是一个研究地球物质中元素、同位素分布和演化的学科。
元素是构成地球物质的基本物质,同位素则是同一元素中质量数不同的不同原子核。
元素和同位素的地球化学分析可以帮助我们了解地球的演化历史、地球环境变化、地质过程等多个方面。
一、元素的地球化学元素是地球化学研究的基本单位,地球上的元素分布受制于地球的演化历史和物质组成。
总体而言,地球表层分布的元素可以分为地壳元素、海洋元素和大气元素。
地壳元素是地壳中丰富的元素,包括氧、硅、铝、铁、钙等等,它们占到地壳质量的99%以上。
其中最丰富的是氧元素,它占地壳中质量的46.6%,其次是硅元素,占28.2%。
地壳元素的绝大部分都是宇宙尘埃在地球形成过程中沉积下来的,也有部分来自于岩浆的分异作用和地球内部的物质漏失。
海洋元素主要包括钠、氯、镁、钙等,以及微量元素如铬、钴、铜、锌、铅等。
这些元素常常被沉积在海洋底部的海底泥中,它们的含量一般很低且难以采集分析。
大气元素包括氢、氧、氮、碳以及其他的惰性气体。
其中氧和氮占了大气元素的绝大部分,占比分别为21%和78%。
大气元素是通过地球大气层的物理、化学和生物过程不断循环传输的,它们对地球环境的影响也很大。
二、同位素地球化学同位素是同一元素中质量数不同的不同原子核,同位素地球化学就是研究地球物质中同位素分布和演化的学科。
同位素地球化学的核心是同位素分析技术,它包括同位素质谱分析、放射性同位素年代学和同位素示踪技术。
同位素质谱分析是一种高精度的技术手段,它可以对地球物质中同位素的含量进行精确定量分析。
例如,氧同位素的分析可以用来研究古气候变化,硫同位素的分析可以用来追踪地球物质的来源和演化历史,铅同位素的分析可以用来研究地球内部物质演化和大气污染状况等。
放射性同位素年代学是利用放射性同位素的半衰期来测定物质年龄的技术手段。
不同放射性同位素的半衰期不同,因此可以用来测定不同时间尺度的物质年龄,例如,碳-14同位素可以用来测定古代有机物的年代,铀-铅同位素可以用来测定地球地质历史上的时间尺度。
第一部分 同位素地球化学原理

V
/V
46 / 44 1.022
②氧化还原反应中的动力同位素分馏 氧化还原反应过程是一个不可逆的化学过程。在这一过程中, 由于不同质量数的同位素原子或分子,参与反应的速度不同而引起 同位素分馏。反应速度的差别越大,所引起的动力分馏越明显。 一般而言,氧化反应过程中,反应速度总体较快,反应物与反 应产物之间的同位素分馏不太明显。但是,还原反应速度较慢,可 以产生明显的同位素分馏。
2.2 动力学同位素分馏
一种元素的同位素原子或分子,由于质量数不同而导致它们的物理 化学性质上的微小差异,在化学反应或蒸发作用过程中,出现反应速 度或运动速度的快慢不一,其所引起的同位素分馏,称为动力学同位 素分馏(isotope dynamic fractionation)。动力学同位素分馏伴随有化学 反应和物相转变的发生,并且是单相不可逆的过程。
(3)Slap(Standard light Antarctic Precipitation)南极原始的粒雪样品。 δD SMOW = -55.50‰,δ18O SMOW = -428.5±1‰; D/H=(89.02±0.05)×10-6, 18O/16O=1882.766×10-6。 (4) PDB(Pee Dee Belemnite)美国卡罗莱纳州白垩系Pee Dee组中拟箭 石制成的CO2,作为碳氧同位素标准。 PDB的 δ13CPDB=0‰,δ18OPDB=0‰;13C/12C=1123.72 ×10-6, 18O/16O=415.80 ×10-5。 (5) CDT(Canyon Diablo Troilite)美国亚利桑那州Comyon Diablo铁陨 石中陨硫铁相的硫同位素组成,34S/32S=0.0450045,δ34SCDT=0‰。 在不同类型的样品测定中,由于采用不同的标准样品得到不同的 δ值,如:水的δ18O值是相对于标准样品SMOW,而碳酸盐的δ18O值 是相对于PDB标准,在应用中要换算为相同标准。
同位素地球化学——绪论

元素地球化学 有机地球化学 同位素地球化学
一、同位素地球化学的 研究对象
地球上有92种天然元素,它们由340多种天然 同位素构成。这些天然同位素既有物理性质 相对稳定的稳定同位素,也有其丰度随时间 发生变化的放射性同位素。
天然元素
同位素地球化学就是利用天然元素的稳定
和不稳定同位素在时间和空间上的组成、 分布和演变规律,进而探讨地质现象的一 门学科。
• 稀有气体同位素地球化学主要用于物源、 特别是地幔源物质的示踪。此外也可用 于测年。 • 除上述研究领域外,以往不受重视的一 些元素的同位素地球化学的研究近年也 取得了长足的进展,如Li,B,Si等元素 的同位素。
• 同位素地球化学研究的具体内容包括: • ① 自然界同位素的起源、演化和衰亡历史; • ② 同位素在宇宙体、地球及其各圈层中的分 布分配、不同地质体中的丰度及其在地质过 程中活化与迁移、富集与亏损、衰变与增长 的规律;同位素组成变异的原因;并据此探 讨地质作用的演化历史和物质来源;
根据同位素类型及其研究内容,同位素地球 化学有如下分支学科: 放射性同位素 地球化学 放射成因同位素地球化学 放射性同位素地质年代学
稳定同位素 地球化学
轻稳定同位素地球化学
稀有气体同位素地球化学
其它稳定同位素地球化学
二、同位素地球化学研究概 况及其主要研究内容
• 根据同位素类型,同位素地球化学的研究领 域包括如下几方面: • 同位素地质年代学 • 稳定同位素地球化学 • 放射成因同位素地球化学 • 稀有气体同位素地球化学 • 其它同位素地球化学
已积累至少有8000多个年龄数据,其中约 80%为K-Ar数据;其次是U-Pb法数据, 约占5%,Rb-Sr法数据约占15%;其它方 法数据较少。 有些方法如Sm-Nd法正处于测试开始阶段。 这些年龄数据对确定我国古老地层层序、 岩体侵入时代、矿体与地层和岩体之间先 后次序等方面起有重要作用。
同位素地球化学
本章内容
自然界引起同位素成分变化的原因
同位素年代学及放射性同位素 稳定同位素地球化学
推荐参考书
• 陈骏,王鹤年主编. 2004. 地球化学. 科学出版社. • 中科院地球化学研究所编. 1998. 高等地球化学. 科学出 版社. • (美)G. 福尔(Faure,G.)著;潘曙兰,乔广生译 1983, 同位 素地质学原理. • Faure, G. and Mensing, 2005. Isotopes: Principles and Applications. 3th ed., Wiley & Sons. • W.M White. 2003. Isotope Geochemistry-Lectures. • 魏菊英等编. 1988. 同位素地球化学,地质出版社,北京.
•
部分重核素(原子量A≥40)不稳定,以释放出粒子和能 量的方式发生衰变,成为新的核素;
•
在核素图中,稳定核素形成一个连续区域,其N/P比值 具有从低质量数∼1到高质量数∼1.5的变化趋势,并且 相对于其两侧核素形成低值的能量谷地(energy valley), 即两侧核素地通过释放粒子和能量而进入稳定的能量谷 地,这便是不稳定核素发生衰变的驱动力;不稳定核素
在的时间大于1017年的就称稳定同位素,反之则称为放射性同 位素 。
(三) 同位素成分的测定及表示方法
一般来说质量数A<209的同位素大部分是稳定的,只有 少数是放射性的,如14C,40K,87Rb;而质量数大于209的同 位素全部属于放射性同位素。
一种元素可由不同数量的同位素组成。自然界中
同位素最多的是Sn元素,有10个同位素:
4.28 Ga.
超基性岩(橄榄岩、二辉橄榄岩等)、基性岩 (玄武岩、辉长岩等)、酸性岩(A型花岗岩、 S型花岗岩等)的源区问题?
地球化学解析地球岩石中的同位素组成
地球化学解析地球岩石中的同位素组成地球岩石是地球上最庞大的自然资源之一,通过对其同位素组成的分析,可以深入了解地球历史、地质构造、岩石形成过程等方面的信息。
同位素是具有相同质子数,但中子数不同的同一元素的不同形式,其稳定性和放射性在地球化学中发挥重要作用。
本文将介绍地球化学中解析地球岩石中的同位素组成的方法和应用。
一、同位素的基本概念同位素是指同一元素中,质子数相同而中子数不同的核。
同位素的质量数等于其质子数与中子数之和。
同位素在化学性质上具有相似性,但在物理性质上存在差异,其中最常见的性质就是其放射性。
同位素按照其放射性可分为稳定同位素和放射性同位素两类。
二、同位素分析方法在地球化学研究中,常用的同位素分析方法包括质谱法和同位素地球化学方法。
1. 质谱法质谱法是一种利用质谱仪对元素、化合物或物质所含的同位素进行分析的方法。
常见的质谱法包括质谱质谱法(MS-MS)、电感耦合等离子体质谱法(ICP-MS)等。
2. 同位素地球化学方法同位素地球化学方法主要利用同位素的物理性质,通过对岩石、矿物或水样品中同位素组成的测定,解析地球系统中的物质循环、地质历史和地球环境等。
常见的同位素地球化学方法包括稳定同位素地球化学和放射性同位素地球化学。
三、同位素地球化学的应用1. 稳定同位素地球化学的应用稳定同位素地球化学广泛应用于水文地球化学、岩石地球化学、大气环境等领域。
例如,利用氢氧同位素可以探究地球水循环过程、水源区的划分和水资源的管理。
利用碳同位素可以追踪地球上的碳循环和生物地球化学循环过程。
利用氧同位素可以研究古气候变化和古环境演化等。
2. 放射性同位素地球化学的应用放射性同位素地球化学主要应用于地质年代学和地下水资源勘探等领域。
例如,利用铀-铅同位素测年方法可以确定岩石和矿石的年龄。
利用钾-氩同位素方法可以测定火山岩的年龄。
利用同位素示踪技术可以研究地下水流动路径和补给来源等。
综上所述,地球岩石中的同位素组成是地球化学研究的重要内容之一,通过同位素的分析可以获取丰富的地质、地质历史和地球环境信息。
- 1、下载文档前请自行甄别文档内容的完整性,平台不提供额外的编辑、内容补充、找答案等附加服务。
- 2、"仅部分预览"的文档,不可在线预览部分如存在完整性等问题,可反馈申请退款(可完整预览的文档不适用该条件!)。
- 3、如文档侵犯您的权益,请联系客服反馈,我们会尽快为您处理(人工客服工作时间:9:00-18:30)。
Rosholt and Bartel (1969)
实例:
右图为美国怀俄明州 Granite Mountains 岩基 全岩238U-206Pb等时线图。 由于已知岩体的形成时 间为2.82Ga,图中所有 的数据点并不沿该等时 线分布,而是显示出不 同程度的低238U/204Pb比 值,即样品发生了明显 的U丢失,而无法给出 正确的年龄值。
206 204
Pb Pb
207 204
U-Th-Pb同位素体系
U、Th放射性衰变方程及参数
238U 234 Th ...... 226 Ra 222 Rn ...... 210 Pb ...... 206 Pb
238U → 206Pb + 8 + 6 - + E
t1/2 = 4.47 109yr 1= 1.55125 10-10yr-1
古土壤风化壳 中碳酸盐表壳 可起到类似混 凝土作用,使 体系内元素活 动性降低,可 供进行地层界 线精确定年。
Smith and Farquhar (1989)
成功实例:加拿大珊瑚碳酸盐U-Pb等时线年龄。所获的 等时线年龄与约375- 385 Myr的地层年龄相近。但图中 的空心符号代表的样品发生了不同程度的体系开放。
U-Th-Pb同位素体系
普通Pb-Pb法
206 204
Pb Pb
206 204
Pb Pb
i
238
U (e238t 204 Pb
1)
(1)
207 Pb 204 Pb
207 204
Pb Pb
i
235
U (e235t 204 Pb
1)
对定年基本方程分别进行变换,则:
(2)
207 204
Pb Pb
235U 231 Th ...... 227 Th 223 Ra ...... 211 Bi ...... 207 Pb
235U → 207Pb + 7 + 4 - + E
t1/2 = 704 106yr 2= 9.8485 10-10yr-1
232Th 228 Ra ...... 224 Ra 220 Rn ...... 212 Pb ...... 208 Pb
207 204
Pb Pb
i
235
U (e235t 204 Pb
1)
208 Pb 2
i
232Th 204 Pb
(e 232t
1)
U-Th-Pb同位素体系
由于U-Th-Pb体系可构成相互独立的衰变体系,原理上 对同一地质体进行同位素分析,可获得三个独立的年龄 值。如所分析样品符合等时线前提,238U-206Pb、235U207Pb、232Th-208Pb体系应该给出一致的年龄(相对误差 小于或等于10%);然而,由于U、Pb的易活动性,在 风化作用和低级变质作用,常可导致体系U-Pb同位素组 成不能保持封闭,往往得不到一致年龄,因此用等时线 法成功获得有意义年龄的实例相对有限。
其中206Pb、207Pb、208Pb为稳定同位素,分别为238U、 235U、232Th放射性形成的同位素子体同位素。204Pb 因无对应的放射性同位素母体,故不属于放射成因同 位素。
除上述同位素外,还有短命的210Pb、211Pb、212Pb和 214Pb,均是Th、U衰变过程中间产物,半衰期非常短
18-同位素地球化学
U-Th-Pb同位素体系
U-Th-Pb地球化学性质 • U和Th常为+4价,离子半径分别为1.05和1.10Ă; • U和Th均为强不相容元素,在地壳中富集,地幔中亏
损; • 多数条件下U和Th呈分散状分布于造岩矿物中或集中
于副矿物中(锆石、独居石、磷灰石、榍石);锆石 (ZrSiO4)选择性富U,独居石([La,Ce,Th]PO4)选择性富 Th。
沉积岩中:
(U6+O2)2+溶于碱性海水,故沉积碳酸盐中Th/U = 0.77; 但深海锰结核中,因粘土吸附Th,Th/U = 5.38。
U-Th-Pb同位素体系
U-Th-Pb同位素
铀由3个同位素组成:
Isotope 238U 235U 234U 232Th
Abundances, half-lives and decay constants of U and Th
钍由两同位素组成: 232Th100% M=232.038050 230Th≤0.0005%
U-Th-Pb同位素体系
Pb同位素主要由4个同位素组成: 204Pb 1.4% 203.973029 206Pb 24.1% 205.974449 207Pb 22.1% 206.975881 208Pb 52.4% 207.976636
232Th → 208Pb + 6 + 4 - + E
t1/2 = 14.01 109yr 3= 0.49475 10-10yr-1
U-Th-Pb同位素体系
U-Th-Pb定年的原理
206 204
Pb Pb
206 204
Pb Pb
i
238
U (e238t 204 Pb
1)
207 Pb 204 Pb
Abundance (%) Half-life (years) Decay constant (y-1)
99.2743
4.468×10⁹
1.55125×10⁻¹⁰
0.7200
0.7038×10⁹
9.8485×10⁻¹⁰
0.0057
2.47×10⁵
2.806×10⁻⁶
100.00
14.010×10⁹
4.9475×10⁻¹¹
U-Th-Pb同位素体系
U-Th-Pb地球化学性质
• Pb为中等不相容元素,其离子半径为1.32 ; • Pb的独立矿物为方铅矿,在硅酸盐矿物中,多与元素
K形成类质同象而趋向存在于钾长石等矿物中; • 通常条件下Pb性质稳定,但在高温和酸性条件下可形
成氯或硫的化合物,易溶解于热液中而发生迁移。
U-Th-Pb同位素体系
各类岩石中U,Th,Pb的平均含量
U-Th-Pb同位素体系
自然界中的U 、 Th 、 Pb的分布:
地幔 下地壳 上地壳 超基性岩 基性岩 中性岩 酸性岩
U 0.055 0.62 3.65 0.01 0.4 1.8 4.0
Th 0.19 3.6 12.1 <0.05 1.3
7.0 18.0
Pb 0.4 6.5 19.9 0.3 3.2 15.0 24.0