如何用英语描述图表
(完整)高考英语写作图表说明文模板范文
高考英语指导写作专题:图表说明文一,图表说明1,分类:数字表、函数关系图、曲线图(graph);表格(table);几何图形(figure);图形表、饼状图(pie chart);条状图、柱状图(bar chart);平面图、示意图、外形图(diagram)。
2,一般可分三个层次来写:按照题目要求描述图表反映的总情况,即概括大意。
对数字进行仔细的比较,抓住特点进行分析、归纳并找出产生变化的原因。
读图表后的想法、结论、评论或针对反映出的问题采取的解决措施。
二.表达方式:1,常用的描述句型The table/chart/diagram/graph shows that ...According to the table/chart/diagram/graph...As is shown in the table/chart/diagram/graph...As can be seen from the table/chart/diagram/graph/figures...We can see from the figures/statistics...It is clear/ apparent from the figures/statistics...2.图表中数据(data)的具体表达法数据(data)在某一个时间段固定不变:fixed in time在一系列的时间段中转变:changes over time增加:increase/raise/rise/...减少:decrease/grow down/drop/fall/decline稳定:remain stable3.描写变化的形容词及副词rapid/rapidly,dramatic/dramatically,significant/significantly,sharp/sharplysteep/steeply,steady/steadily,gradual/gradually,slow/slowly,slight/slightly三、写作模板As (is) shown/indicated by the figure/in the table/graph/pie chart/chart,_____ has been increased/decreased significantly/steadily from _____ to_____. From the sharp decline/rise in the chart,it goes without saying that_____.There are at least two reasons accounting for / contributing to ____. On the one hand, _____ On the other hand, _____. _____is due to the fact that_____. In addition,_____is responsible for_____. Maybe there are other reasons to show. But it is generally believed that the above mentioned reasons are commonlyconvincing/persuasive.As far as I am concerned,I hold the view that_____. I am sure my opinion is both sound and well-grounded.四,作文范例1,最近你校对中学生的消费情况进行了调查。
描述图表的英语范文 雅思

描述图表的英语范文雅思英文回答:The given bar chart depicts the average monthly expenditure of households in five different income groupsin a particular region. The data is presented in British pounds.The highest income group, with monthly earnings exceeding £5,000, spends the most on average, at £3,900 per month. This group also has the highest expenditure on housing, transport, food, and leisure activities.The second highest income group, with earnings between £4,000 and £5,000, spends an average of £3,200 per month. Their expenditure pattern is similar to that of the highest income group, with significant outlays on housing, transport, and food.The middle income group, with earnings between £3,000and £4,000, spends an average of £2,600 per month. Their expenditure is relatively evenly distributed acrossdifferent categories, with slightly higher spending on housing.The fourth income group, with earnings between £2,000 and £3,000, spends an average of £2,100 per month. They allocate a significant portion of their budget to housing and food, with less spending on transport, clothing, and leisure activities.The lowest income group, with earnings below £2,000, spends the least on average, at £1,500 per month. The majority of their expenditure goes towards housing and food, with limited spending on other categories.In summary, the bar chart shows that higher income households spend more on a wider range of goods and services, while lower income households spend less and prioritize essential expenses such as housing and food.中文回答:给定的柱状图描述了某个地区五个不同收入组家庭的平均每月开支。
图表描述英语作文模板

图表描述英语作文模板描述图表类,我们可以借用英语这类型写作的模板啊。
下面是小编给大家整理的图表描述英语作文模板,供大家参阅!图表描述英语作文模板1According to the chart / graph / diagram / table, we clearly learn that _________. As early as _________,___________. Then,_________. Last,__________. In contrast, by _________,__________.There are many reasons accounting for _________. Firstly, _________.Secondly,__________. Finally,_________. As a result,_________.As far as I am concerned,_________. For one thing,__________. For another,________. In brief, I hold that__________.图表描述英语作文模板2As is shown in the chart / graph / diagram / table above, __________ has charged drastically in the past _________. While ___________,now the percentage of__________ is __________. Meanwhile, the number of _________ has soared up to ________.There are mainly two possible reasons contributing to the rapid changes. The first is that _________. Secondly,__________.In my point of view, the changes have a great influence on_________. At the same time,_______. To sum up ,_________.图表描述英语作文模板3What is shown in the chart / graph / diagram / table above indicates that in recent years, more and more people pay attention to _________. The number of those who _________ has increased ________, and furthermore,____________.There are two factors responsible for the changes. In the first place,_________. Moreover,__________. Yet, it is noticeable that __________.From the analysis, we can safely draw the conclusion that__________. It is possible that in the future, the tendency will__________.图表描述英语作文模板4The chart gives us an overall picture of the ____________(图表主题). The first thing we notice is that_______________(图表最大特点). This means that as __________, _________________(进一步说明).We can see from the statistics given that _______________(图表细节一). After ving_________(细节一中的第一个变化), the _____Ved+幅度+时间(紧跟着的变化). The figures also tells us that_________________________(图表细节二). (数据位置,如In the second column), we can see that ____________accounts for _______(进一步描述).Judging from these figures, we can draw the conclusion that___________(结论). The reason for this, as far as I am concerned is that_____________(给出原因). / It is high time that we Ved(发出倡议).图表描述英语作文模板5According to the bar chart / pie chart / line graph displays the changes in the number of____________(图表整体趋势). There was an increase in ____________(图表细节).At the point of ____________, ____________reaches its peak value of ____________(数据或变化). What has caused these changes? There are mainly three reasons. Firstly, ____________ (原因一).Secondly, ____________(原因二). The number of ____________ increased over the period. ____________ rose by _________ from ________ to ________________. And there were____________. Finally, ____________(最后一个原因).In conclusion / We can safely draw the conclusion that ____________(结论). Therefore, ____________(进一步谈论更多个人想法).图表描述英语作文模板6It seems to me that the cartoon / drawing is sending a message about ____________(图画内容),which reveals ____________(稍作评价).In my perspective of view, ____________ (表明个人观点)。
图表描述英语范文

图表描述英语范文描述图表的英语写作是怎么写的,不妨看看别人的写作情况。
下面是店铺给大家整理例文的图表英语范文,供大家参阅!图表描述英语范文:Investment in Beijing不同国家和地区在京投资Investment in Beijing from different countries and regions From the pie chart given above, we can observe that it reflects the statistics of investmentin Beijing from different countries and regions. The proportion of investment from Hong Kongaccounts for 44%, ranking first. The percentage of investment from other 23 countries andregions ranks second among all, making up 20.8 %. Japan occupies 19.2%, ranking third. Whenit comes to the U.S.A., we can find that it takes up 16% , 28% lower than that of Hong Kong.The pie chart reveals the phenomenon that most of the investment in Beijing stem fromHong Kong. What exactly contribute to this phenomenon? Reasons can be listed as follows:in the first place, China's investment policy provide preferential treatment to investors fromHong Kong. They are more likely to be immune to high taxes and other charges. Moreover,quite a few Hong Kong investors hold the opinion that, with the same language, cultures,traditions and customs, mainland is an ideal and promising investment resort which will bebound to generate considerable profits. Last but not least, it will not take a long time tocommute between Hong Kong and Chinese mainland, the region advantage also has attractedmore Hong Kong investors to locate their companies and factories in the mainland.The public can benefit a lot from Hong Kong investment.People can buy products withsuperior quality at a comparatively cheaper price. However, balancing the investmentproportion from different countries is also a issue needed to be put at the top of relevantadministration departments’ agenda. Thus, people can be exposed to a greater variety ofproducts and have more purchasing options. (272 words)图表描述英语范文:坐下来餐厅发展趋势快餐和坐下来餐厅发展趋势The development tendency of fast food and sitdown restaurantFrom the curve chart given above, we can observe that the number meals of fast food andsitdown restaurant experienced some changes during the past several years. The number ofmeals of fast food increased slowly from 20 in 1970 to nearly 30 in 1980. From 1980 to 2000, itascended rapidly from 30 to approximately 90. On the contrary, when observing thestatistics of sitdown restaurant meals, we can find that it increased slowly from 20 in 1970 toroughly 50 in 2000.The curve chart informs us of the phenomenon that there exists some difference in thedevelopment tendency between fast food and sitdown restaurants. What exactly contributeto this phenomenon? Reasons can be listed as follows: for one thing, with the pace of modernlife quickening, people barely have much time to waste in lining up for restaurant meals, on thecontrary, fast food meals can do help busy people save a great deal of time. Additionally, theauthorities have issued some preferential policies to protect and encourage the rapidextension of fast food industry , thus the public can buy fast food at shops scattering aroundthe city. On the contrary , people in diminishing numbers are willing to eat at sitdownrestaurant. They think that eating atrestaurant is always time-consuming and inconvenient.Besides, food at restaurant is comparatively expensive than fast food.by observing the trend of the past, we may forecast that the number of fast food mealswill continue to rise in the years to come. However, we should also take the detrimental impactof fast food into consideration. Do remember that fast food is one of the main causing factorsof diseases such as heart attack, obesity and diabetes.图表描述英语范文:The changes of Chinese中国职业的变化The changes of Chinese professionsFrom the pie chart given above, we can observe that the professions structure of Chinesepeople experienced some changes during the past several years. From 1980 to 1999, thepercentage of agricultural professions decreased by 30% from 68% to 38%. During the sameperiod, however, service sectors increased rapidly from 5% to 22%. When it comes to themanufacturing professions, its percentage rose markedly from 27% in 1980 to 40% in 1999.The pie chart reveals the phenomenon that there exists some difference in thedevelopment tendency among different professions in China. What exactly contribute to thisphenomenon ? reasons can be listed as follows: for one thing, with the rapid process ofurbanization, people in mounting numbers, especially youngster, have left their village homes,moved into big cities and thus been out of agricultural industries. Moreover, quite a few people,especially college graduates hold that it is comparatively easy for them to make more money inthe service industry. When it comes to the manufacturing industry, its transformation mightbe attributed tothe adjustment of industrial structure: the authorities have issued somepreferential policies to promote the rapid extension of manufacturing industry, thus, moreworkforces are required.By observing the change over the past several years, we may forecast that theproportion of professions of service and manufacture will continue to rise. However, a highvalue should be placed on the development of agricultural industry by the public and theauthorities. Otherwise, with the number of people who are engaged in agriculture diminishing,we will one day have nothing to eat! (262words)图表描述英语范文:Different job inclination between boys and girls职业选择Different job inclination between boys and girlsFrom the bar chart given above, we can find that it reflects the statistics of professioninclination between girls and boys. Most obviously, 40% of boys intend to be a manager, withonly 15% of girls choosing this job. When it comes to the profession of teacher, we canobserve that 45% of girls prefer to take this job, while the proportion of boys only accountfor 5%, 40% lower than that of girls.The bar chart informs us of the phenomenon that there exists some difference inprofession inclination between boys and girls. What exactly contribute to this phenomenon? reasons can be listed as follow: for one thing, quite a few boys regard being a manager as asymbol of success. As this profession stands for promising futures, fat pay and competence.Moreover, boys’ decision to be a manager can also be attributed to the power of so-called“group dynamics”: whe n members of their social network prefer to be a manager aftergraduation, they are easilyinfluenced and imitate others’ behavior unconsciously orconsciously. When it comes to girls, the are more inclined to be a teacher. As this professionfeatures stability and respect. Take social and biological factors into account, we know that itis reasonable for girl to choose teacher as their ideal profession goals.Both girls and boys have rights to choose their profession. However, one thing we shouldbear in mind is that there exists no better or worse, superior or inferior jobs, but suitableand satisfactory ones. (254words).图表描述英语范文:大气污染空气污染范文Writing (图画提纲式议论文)1. Describe the picture2. Deduce the purpose of the drawer of the picture3. Suggest your counter – measures范文:The cartoon presents the Earth with a personified human face that seems quite unhappy.A examination of the picture immediately reveals that the source of its mood is the airpollution resulting from a huge number of automobiles spread around its surface.The cartoon, no doubt, aims at alarming humans of the heavy load we have exerted onEarth by our insatiable production and usage of automobiles. However, the majority of peoplemerely indulge in the celebration of the convenience brought by cars, while forgetting orsimply neglecting their harmful impact on the atmosphere. Admittedly, there are various factorscontributing to the current worldwide air pollution, but it is undeniable that the exhaustfrom automobiles is categorized asone of the major elements.I would like to make the following proposals to solve this problem: firstly, we should applythe most cutting-edge technologies in order to adopt new forms of energy as substitutes forfossil fuels. It should also be guaranteed that the clean energy be inexpensive so that it can bewidely accepted. Besides, there should be attempts to develop possible transportation means,so that citizens can be diverted from dependence on cars. In short, it is humans'responsibility to resume clean air for Earth.译文:这幅漫画以拟人的方式呈现地球,它的脸显得非常不高兴。
雅思图表类英语作文模板

雅思图表类英语作文模板英文回答:1. Introduce the chart/graph: Briefly describe the type of chart/graph, the data it presents, and the time period or geographical location it covers.2. Overall trend: State the general trend or pattern observed in the data. Use specific numbers or percentages to support your statement.3. Key features: Highlight the most important or noticeable features of the chart/graph, such as peaks, valleys, or changes over time.4. Possible reasons: Speculate on the reasons behind the trends or features you have identified. Consider external factors or events that may have influenced the data.5. Predictions or recommendations: Based on the data presented, make predictions about future trends or provide recommendations for action.中文回答:雅思图表类英语作文模板。
1. 图表介绍,简要描述图表类型、数据内容以及时间跨度或地理范围。
2. 总体趋势,陈述数据中观察到的总体趋势或模式。
关于英语图表作文万能句子
【导语】⾼中⽣的英语写作⽔平整体偏低,⾼考作⽂情况不容乐观。
以下是由精⼼收集了关于英语图表作⽂万能句⼦,供⼤家欣赏学习!【篇⼀】关于英语图表作⽂万能句⼦ 图表的总体描述 1. the table shows the changes in the number of……over the period from……to…… 该表格描述了在……年之……年间……数量的变化。
2. the data/statistics/figures lead us to the conclusion that…… 这些数据资料令我们得出结论…… 3. as can be seen from the diagram,great changes have taken place in……/ the two curves show the fluctuation of…… 从图中可以看出,……发⽣了巨⼤变化。
/两条曲线描述了……的波动情况。
4. from the table /art/diagram/figure,we can see clearly that……or it is clear/apparent from the chart that…… 从图表我们可以很清楚(明显)看到…… 5. this is a graph which illustrates…… 这个图表向我们展⽰了…… 6. the graph,presented in a pie chart, shows the general trend in…… 该图以圆形图形式描述了……总的趋势。
7. this is a column chart showing…… 这是个柱型图,描述了…… 时间段表达⽅式 1. over the period from…to…the…remained level. 在…⾄…期间,…基本不变。
2. in the year between……and…… 在……年到……期间…… 3. in the 3 years spanning from 1995 through 1998…… 1995年⾄1998三年⾥…… 4. from then on/from this time onwards…… 从那时起……【篇⼆】关于英语图表作⽂万能句⼦ 数据变化表达⽅式 1. the number of……remained steady/stable from (month/year) to (month/year)。
英语图表作文模板
英语图表作文模板在英语学习中,图表作文是一种常见的题型。
通过图表作文,我们可以学会如何描述图表、分析数据、比较差异、总结规律等。
下面是一个英语图表作文的模板,希望能够帮助大家更好地应对这类题型。
首先,我们需要介绍图表的来源和类型。
例如,我们可以说,“Thechart/table/diagram provides information about…”接着,我们可以简要描述图表的主要特点,包括横纵坐标的单位、数据的范围、时间跨度等。
然后,我们可以用一两句话来总结图表呈现的主要趋势或规律。
接下来,我们需要详细描述图表中的数据。
这时,我们可以使用一些形容词和副词来描述数据的变化趋势,比如“increase, decrease, rise, fall, sharply, steadily”等。
同时,我们也可以使用一些连接词来引导句子,比如“while, whereas, on the other hand, in contrast”等,来进行数据的对比和分析。
在描述数据的过程中,我们还可以引用一些具体的数字和比例来支撑我们的观点。
比如,“the number/percentage of…has increased/decreased from…to…”或者“…is twice/three times as much/many as…”这样的句式可以让我们的描述更加具体和可信。
最后,我们需要对图表中的数据进行总结和归纳。
我们可以用一两句话来概括图表所展现的主要特点和规律,同时也可以对未来的趋势进行预测或者提出建议。
比如,“Based on the data/figures/statistics provided, it can be concluded that…”或者“According to the trend/pattern shown in the chart, it is likely that…”这样的句式可以让我们的总结更加有力和有说服力。
准确使用英语词汇描述图表
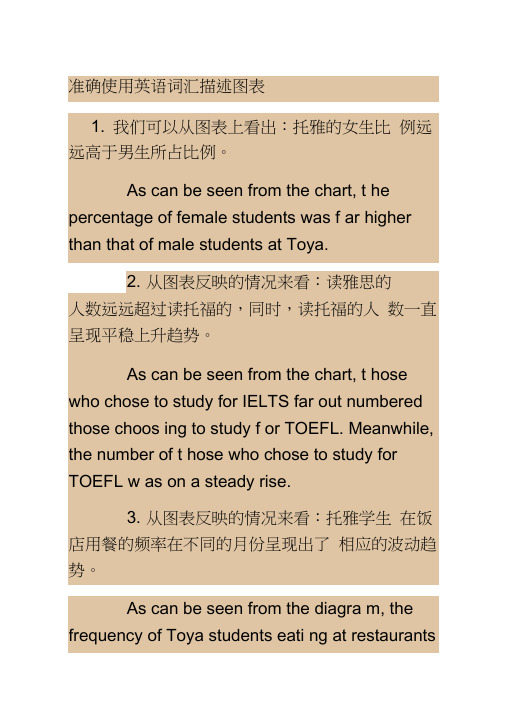
准确使用英语词汇描述图表1.我们可以从图表上看出:托雅的女生比例远远高于男生所占比例。
As can be seen from the chart, t he percentage of female students was f ar higher than that of male students at Toya.2.从图表反映的情况来看:读雅思的人数远远超过读托福的,同时,读托福的人数一直呈现平稳上升趋势。
As can be seen from the chart, t hose who chose to study for IELTS far outnumbered those choosing to study f or TOEFL. Meanwhile, the number of t hose who chose to study for TOEFL w as on a steady rise.3.从图表反映的情况来看:托雅学生在饭店用餐的频率在不同的月份呈现出了相应的波动趋势。
m, the frequency of Toya students eati ng at restaurants revealed a trend of fl uctuations in different months.4.从图表反映的情况来看:托雅男教师所承担的每周工作量要高于女教师的。
As can be seen from the charts, the weekly workload borne by male te achers outweighed that of female teach ers at Toya.5.从整个图表反映的情况来看:托雅总部以及五个分校的营业收入都呈现出了快速的增长趋势。
As can be seen from the chart, t he sales of Toya Headquarter and the five branch schools all revealed a trend of fast increase across the board.6.从整个图表反映的情况来看:托雅教师的收入状况呈现出了稳步增长的总态势。
图表类英语作文范文
图表类英语作文范文图表类型的英语写作如果不擅于观察漫画的话,作文写出来可能会偏题。
下面是小编给大家带来图表类英语作文,供大家参阅!图表类英语作文范文篇1第一段:说明图表开篇句:As the bar chart shows, ____ during the years of ____to____.扩展句:1、As early as _____.2、Then _____ years later, ____.3、And arriving in the year ____, ____.第二段:解释图表变化原因主题句:Several factors contribute to _____.扩展句:1、______. (原因1)2、And ______.(原因2)3、Furthermore, ______ (原因3)4、All these result in ____.第三段:提出解决办法结尾句:However, ____ is faced with some problems.扩展句:1、With _____, ____, the effect of which is not only discouraging, but also challenging.2、So my principle is to pay due attention to ___, but notjustto____.示范第一段:说明图表开篇句:As the bar chart shows, the number of people below the poverty line decreased dramatically during the years of 1978 to1997.扩展句:1、As early as 1978, about 250 million people were under the poverty line.2、Then seven years later, the number became three fifths thatof1978.3、And arriving in the year 1997, the number was reduced to50millions.第二段:解释图表变化原因主题句:Several factors contribute to the sharp decrease of the below-poverty population.扩展句:1、The reform and opening following 1978 enabled the peasants to become much better off. (原因1)2、And with the development of Chinese economy, that policy also improved city dwellers lives greatly. (原因2)3、Furthermore, the high-tech introduced made it possible for the countrys economy as a whole to take off. (原因3)4、All these result in the great fall of theChinesepopulationbelow the poverty line.第三段:提出解决办法结尾句:However, a further decrease in the number of poverty-stricken people is faced with some problems.扩展句:1、With quite few employees being laid off, the effect of which is not only discouraging, but also challenging.2、So my principle is to pay due attention to the newcomers, but not just to care for the poor, say, in remote mountain areas.范文As the bar chart shows, the number of people below the poverty line decreased dramatically during the years of 1978 to 1997. Asearly as 1978, about 250 million people were under the poverty line.Then seven years later, the number became three fifths that of 1978.And arriving in the year 1997, the number was reduced to 50 millions.Several factors contribute to the sharp decrease of the below-poverty population. The reform and opening following 1978 enabled the peasants to become much better off. And with the development of Chinese economy, that policy also improved city dwellers lives greatly. Furthermore, the high-tech introduced made it possible for the countryseconomy as a whole to take off. All these result in the great fall of the Chinese population below the poverty line.However, a further decrease in the number of poverty-stricken people is faced with some problems. With quite few employees being laid off, the effect of which is not only discouraging, but also challenging. So my principle is to pay due attention to the newcomers, but not just to care for the poor, say, in remote mountain areas.图表类英语作文范文篇2The past years have witnessed a mounting number of Chinese scholars returning from overseas. As is lively illustrated by the column chart, the number of returnees climbed from a mere 69.3 thousand in 2008 to over 272.9 thousand in 2012, at an annual increase rate of around 50%.A multitude of factors may have led to the tendency revealed by the chart, but the following are the critical ones from my perspective. First and foremost, along with the development of Chinese economy and society, the number of Chinese studying abroad has been soaring in the past years, which has provided an expanding base for the number of returnees. In the second place, the government has enacted a series of preferential policies to attract overseas Chinesescholars back home. Last but not least, the booming economy, science and technology in this country have generated more attative job opportunites for scholars returning from overseas.The waves of returnees will definitely contribute to this nation’s development, since they have brought back not only advanced science and technology but also pioneering concepts of education and management. With more scholars coming back from overseas, and with the concerted efforts of the whole nation, we have reasons to expect a faster rejuvenation of this country.图表类英语作文范文篇3一、图表类型基本单词图表类型:table(表格)、chart(图表)、diagram(图标)、graph(多指曲线图)、column chart(柱状图)、pie graph(饼图)、tree diagram(树形图)、饼图:pie chart、直方图或柱形图:bar chart/histogram、趋势曲线图:line chart/curve diagram、表格图:table、流程图或过程图:flow chart/sequence diagram、程序图:processing/procedures diagram二、图表描述基本词语1、描述:show、describe、illustrate、can be seen from、clear、apparent、reveal、represent2、内容:figure、statistic、number、percentage、proportion三、常用的描述句型The table/chart diagram/graph shows (that)According to the table/chart diagram/graphAs (is) shown in the table/chart diagram/graphAs can be seen from the table/chart/diagram/graph/figures,figures/statistics shows (that)……It can be seen from the figures/statisticsWe can see from the figures/statisticsIt is clear from the figures/statisticsIt is apparent from the figures/statisticstable/chart/diagram/graph figures (that) ……table/chart/diagram/graph shows/describes/illustrates看过图表类英语范文的人还。
图表类英语作文范文
图表类型的英语写作如果不擅于观察漫画的话,作文写出来可能会偏题。
下面是小编给大家带来图表类英语作文,供大家参阅!图表类英语作文范文篇1第一段:说明图表开篇句:As the bar chart shows, ____ during the years of ____to____.扩展句:1、As early as _____.2、Then _____ years later, ____.3、And arriving in the year ____, ____.第二段:解释图表变化原因主题句:Several factors contribute to _____.扩展句:1、______. (原因1)2、And ______.(原因2)3、Furthermore, ______ (原因3)4、All these result in ____.第三段:提出解决办法结尾句:However, ____ is faced with some problems.扩展句:1、With _____, ____, the effect of which is not only discouraging, but also challenging.2、So my principle is to pay due attention to ___, but not justto____.示范第一段:说明图表开篇句:As the bar chart shows, the number of people below the poverty line decreased dramatically during the years of 1978 to1997.扩展句:1、As early as 1978, about 250 million people were under the poverty line.2、Then seven years later, the number became three fifths thatof1978.3、And arriving in the year 1997, the number was reduced to50millions.第二段:解释图表变化原因主题句:Several factors contribute to the sharp decrease of the below-poverty population.扩展句:1、The reform and opening following 1978 enabled the peasants to become much better off. (原因1)2、And with the development of Chinese economy, that policy also improved city dwellers lives greatly. (原因2)3、Furthermore, the high-tech introduced made it possible for the countrys economy asa whole to take off. (原因3)4、All these result in the great fall of the Chinesepopulationbelow the poverty line.结尾句:However, a further decrease in the number of poverty-stricken people is faced with some problems.扩展句:1、With quite few employees being laid off, the effect of which is not only discouraging, but also challenging.2、So my principle is to pay due attention to the newcomers, but not just to care for the poor, say, in remote mountain areas.图表类英语作文范文篇3一、图表类型基本单词图表类型:table(表格)、chart(图表)、diagram(图标)、graph(多指曲线图)、column chart(柱状图)、pie graph(饼图)、tree diagram(树形图)、饼图:pie chart、直方图或柱形图:bar chart/histogram、趋势曲线图:line chart/curve diagram、表格图:table、流程图或过程图:flow chart/sequence diagram、程序图:processing/procedures diagram二、图表描述基本词语1、描述:show、describe、illustrate、can be seen from、clear、apparent、reveal、represent2、内容:figure、statistic、number、percentage、proportion三、常用的描述句型The table/chart diagram/graph shows (that)According to the table/chart diagram/graphAs (is) shown in the table/chart diagram/graphAs can be seen from the table/chart/diagram/graph/figures,figures/statistics shows (that)……It can be seen from the figures/statisticsWe can see from the figures/statisticsIt is clear from the figures/statisticsIt is apparent from the figures/statisticstable/chart/diagram/graph figures (that) ……table/chart/diagram/graph shows/describes/illustrates看过图表类英语范文的人还范文As the bar chart shows, the number of people below the poverty line decreased dramatically during the years of 1978 to 1997. Asearly as 1978, about 250 million people were under the poverty line.Then seven years later, the number became three fifths that of 1978.And arriving in the year 1997, the number was reduced to 50 millions.Several factors contribute to the sharp decrease of the below-poverty population. The reform and opening following 1978 enabled the peasants to become much better off. And with the development of Chinese economy, that policy also improved city dwellers lives greatly. Furthermore, the high-tech introduced made it possible for the countrys economy as a whole to take off. All these result in the great fall of the Chinese population below the poverty line.However, a further decrease in the number of poverty-stricken people is faced with some problems. With quite few employees being laid off, the effect of which is not only discouraging, but also challenging. So my principle is to pay due attention to the newcomers, but not just to care for the poor, say, in remote mountain areas.范文篇2The past years have witnessed a mounting number of Chinese scholars returning from overseas. As is lively illustrated by the column chart, the number of returnees climbed from a mere 69.3 thousand in 2008 to over 272.9 thousand in 2012, at an annual increase rate of around 50%.A multitude of factors may have led to the tendency revealed by the chart, but the following are the critical ones from my perspective. First and foremost, along with the development of Chinese economy and society, the number of Chinese studying abroad has been soaring in the past years, which has provided an expanding base for the number of returnees. In the second place, the government has enacted a series of preferential policies to attract overseas Chinese scholars back home. Last but not least, the booming economy, science and technology in this country have generated more attative job opportunites for scholars returning from overseas.The waves of returnees will definitely contribute to this nation’s development, since they have brought back not only advanced science and technology but also pioneering concepts of education and management. With more scholars coming back from overseas, and with the concerted efforts of the whole nation, we have reasons to expect a faster rejuvenation of this country.Directions: For this part, you are allowed 30 minutes to write a short essay entitled Education Pays based on the statistics provided in the chart below (Weekly earnings in 2010). Please give a brief deion of the chart first and then make comments on it. You should write at least 120 words but no more than 180 words.首段:图表描述(引出图表)This chart is provided by US Bureau of Labor and it is simple but enlightening. (图表描述万能) In 2010, it had become a trend for doctors, masters and bachelors to earn more money in a week in US--- $1551, $1272 and $1038. Meanwhile, other individuals could not enjoy satisfactory earnings, if they did not receive better education.二段:主题评论+现象+意义(图表联系主题)Obviously, this chart can be naturally associated with the importance of education: (图表内容评论)if individuals intend to acquire/ get better earnings, it is advisable for them to gain higher degrees. (现象)In the contemporary America, it is a common phenomenon for a host of companies/ firms/ corporations/ organizations to hire/ employ/ recruit doctors and masters and pay them better salaries. (相关人+感受) And an increasing number of youngsters find it rather difficult to get better jobs, if they do not get better education. (意义) It is education that enables them to build up adequate knowledge, skills and ability to deal with important tasks. (总结)As a matter of fact, employees and employers in large numbers have come to realize the significance of higher degrees.(观点)As a college student, I am convinced that it is of great necessity for youngsters to enhance ourselves by studying hard and getting better degrees. (号召)We should bear in mind that education is/means a worthy investmentDirections:Write an article on Changes on State-owned Houses and Private Houses of China. In your article you should(1) the present situation(2) the possible causes(3) its impactOwnership of Houses in BeijingOwnership of houses in Beijing has significantly changed in recent years. In 1990, 75 percent of the houses were state owned. But in 1995, the ratio of state-owned houses to private ones was 60 to 40. And the ownership changed dramatically since 1995 and by the end of the century, 80 percent of houses were private.There might have been two main reasons. One of the reasons was the policy of the government. In the 1990s, China carried on with its reform policy and the government called for privatization of the sate-owned estate. But it took time for the reform to come into effect. But from 1995 on when people have recognized its significance, the reformation took bigger steps. Another reason was that the people were getting better off and they could afford buying their own houses.Such changes have had great impact on individuals as well as the society. On one hand, the individuals must save money to buy an apartment or to pay the mortgage. On the other hand, a heaven burden has been taken off the government so that it can take more effective measures to improve people s life.题目:就中国公房和私房的变化写一篇短文。
准确使用英语词汇描述图表
11. 根据图表所示,托雅行政人员中男性员工的比例要高于女性。
As is indicated in the graph, mal e employees working in executive positi ons accounted for a much higher perce ntage than females.12. 根据图表所示,所有群体的收入都呈现了上升趋势,虽然上升的幅度有所差异。
As is indicated in the graph, the in come of all the groups revealed a ge n eral trend of in creaseacross the board though the mar gins of the rises varied.13. 根据图表所示,人们的教育程度越咼,收入便越咼。
As is indicated in the graph, the higher one' seducation level was, the hi gher his in come.25. 总体而言,求与供皆呈现了总的波动趋势,以2003年后供大于求为主要趋势。
In gen eral both dema nd and sup ply revealed a general trend of fluctuati ons across the boardwith supply surpass ing dema nd a s the main trend after the year 2003.26. 柱状图显示:收入越高者去饭店吃饭的频率和每次的消费额越高。
As is indicated in the bar chart, t he higher people ' income was, the mo re frequently they dined at restaurants and the more they spent each time.27. 根据图表显示:参加雅思考试的考生年龄呈现年轻化趋势。
如何用英语阐述图表信息

如何用英语阐述图表信息想在职场混,PPT得过关;想在外企混,PPT英语少不了。
不管你是普通职工还是公司高层,多多少少总会用到PPT做汇报,做图表,那么,如何用英语阐述会更有说服力呢?下面来学学职场中,如何恰当地阐述图表中的信息吧:描述图表信息常用表达句型:First quarter: Sales remained fairly steady throughout the months of January to March.第一季度:销售额从1月份到3月份一直都保持平稳。
Second quarter: There was a downturn in the second quarter with the sales falling to…in June.第二季度:销售额出现下降趋势,6月份降到…Third quarter: Sales rocketed in July and reached a peak in September.第三季度:7月份销售额陡增并于9月份达到峰值。
Fourth quarter: With the beginning of October, sales plummeted due to a significant drop in demands. A further decline continued into November and leveled off through the end of the year.第四季度:从10月初开始,由于需求的显著减少,销售额骤然下跌。
11月份销售额持续下降,在年底趋于平稳。
描述图表信息常用表达词Increase slightly 略微增长Increase dramatically 显著增长Decrease slowly 缓慢减少Decrease abruptly 急速减少Fluctuate mildly 轻微波动Fluctuate wildly 大幅度波动Nosedive to an all-time low 暴跌到空前最低点Reach a record high 达到历史最高点Start a spectacular ascension 开始惊人的上升/上涨Continue to skyrocket 继续飞涨Slide 逐渐降低Go up 上升;增长Go down 下降;减少原文来自必克英语/studydetail_49466682.html。
英文描述图表英语作文

英文描述图表英语作文下载温馨提示:该文档是我店铺精心编制而成,希望大家下载以后,能够帮助大家解决实际的问题。
文档下载后可定制随意修改,请根据实际需要进行相应的调整和使用,谢谢!并且,本店铺为大家提供各种各样类型的实用资料,如教育随笔、日记赏析、句子摘抄、古诗大全、经典美文、话题作文、工作总结、词语解析、文案摘录、其他资料等等,如想了解不同资料格式和写法,敬请关注!Download tips: This document is carefully compiled by theeditor. I hope that after you download them,they can help yousolve practical problems. The document can be customized andmodified after downloading,please adjust and use it according toactual needs, thank you!In addition, our shop provides you with various types ofpractical materials,such as educational essays, diaryappreciation,sentence excerpts,ancient poems,classic articles,topic composition,work summary,word parsing,copyexcerpts,other materials and so on,want to know different data formats andwriting methods,please pay attention!The chart shows different colors representing different things. It's really interesting to look at. There are all kinds of data and information displayed.Another chart has lines that go up and down. It's kind of confusing but also kind of fun to try to figure out.This one here has circles and they are different sizes. It makes you think about what they could mean.And then there's a chart with bars that are different lengths. It gives a clear picture of something.。
用英语描述图表方法

用英语描述图表方法一、图表的分类Line graphs(折线图)Bar charts(柱状图)pie charts(饼状图)二、常用描述图表的词汇increase上升 decrease下降rise 上升 decline 下降jump 跳跃式上升 dive 快速下降escalate 迅速上升 plument急速下降to reach a peak/high point 到达顶峰to reach a trough/low point 到达低点ro remain stable/constant/unchanged/static 保持稳定to level out 达到平衡点gradual 逐渐的 significant明显的slight 轻微的 dramatic 巨大的moderate平和的 sharp 尖锐的急剧的trend 趋势respectivel 分别的relative 相对greater than/less thanmore/mostless/least三、常用句子开头:The ________(什么类型的图表) illusrate the_____________(变量名)例如:The pie chart illustrate the proportion (占比)of five types of energy production in France in 1995 and 2005结尾: Overall, ___________(描述最突出的),inconstrac/while_______________(描述最不突出的),总结图表。
例如:Overall, in both years, the most significiant sources of energy were gas and coal, which together counted for over half of the production of energy in France, while nuclear and other kinds of energy sources generated the least. In All types of energy production there was a dramatic change over the 10 year period.中间部分:中间最好用两段表示,描述图表要注意一定要有引用图表中的确切数字。
英语描述图表资料汇总

英语描述图表资料汇总这类图标话题或作文描述时,注意以下几点:审题时,除了要把握好图表的表层信息外,还要分析图标的深层含义,如原因、根源、可能的发展趋势等。
图表中所提供的说明文字往往是问题的切入点,一定要仔细分析。
描述数据时要抓住重点,为中心服务,不必面面俱到,切忌毫无目的地罗列图表中的数据。
如果数据较多,抓住图表中的极端点(如最大或最小、最多或最少,最好或最差)和基本相同进行描述。
主题句应明确,最好放在文章的开头,这样会使重点突出,主题明了。
常见模板第一段:总体描述图表,指明时间段,指出突出变化或不同常用句型或短语:As is clearly shown in the chart(图表)/ table(表格)/graph(线性图), ___________ According to the figures given in the table/chart/graph, ____________It can be seen from the table/chart/graph, _____________________.The figures in the table/chart reflect that ________________.especially, ________________(指出突出变化)第二段:(分析原因)There are several factors leading to this change / difference ……..There are several reasons for _____________.(引出原因)To begin with, _______(原因一)In addition, ______________(原因二)For example, _________(举例说明)Last but not the least, __________(原因三)To sum up——————————————(简要总结)第三段:(解决方法)Perhaps the best way to solve this problem is to …Many workable solutions have been found to dealing with this problemHere are some suggestions that we should …My suggestion is that …It is suggested that …提出个人观点As for meFor my partAs far as I am concernedI am in favor of…In my opinion一、词汇积累:1.各种图表的名称(Types of chart)饼状图(Pie chart):饼状图内部分成一块一块,用于表示所占分量,那一块一块就叫"segment"。
考研英语二图表作文万能句型
考研英语(二)图表作文万能句型考研英语(二)中的图表作文是令很多同学头疼的问题,无从下手对于作文来说是非常可怕的,毕竟它所占的分值不低。
因此为了写出好的图表作文,积累并背诵一些相关的万能句型是非常有必要的。
写图表作文一般的思路是:首先对所看到的图表进行描述,接着分析图表所反映出来的问题,比如人们对这个问题的看法、这个问题产生的原因、造成的影响等,最后得出自己的结论。
因此针对每个段落都可以总结出一些相关的常用句型,同学们可以根据自己具体的情况选取使用。
描述段:1.引出话题,对图表进行总体描述(1)It is apparently from the pie chart / line graph / table/ bar chart that…从图表中,可以明显看出……(图表一般包括饼状图、柱状图、现状图、表格,根据具体情况选择使用哪个词)(2)The pie chart / line graph / table/ bar chart describes / presents / depicts / reveals that + 主题+对象+时间这幅图表描述了/呈现了/揭示了……(动词可以根据自己的熟悉程度来替换)(3)From the statistics given in the pie chart / line graph / table/ bar chart, we can see / estimate that … 从图表中给出的数据,我们可以得知……(动词可以根据自己的熟悉程度来替换)2.对图表进行细节描述,如果图表中出现具体数字可将其写出,如果是一个动态的图表,可以将变化的数值写出。
(1)The number / figure / percentage of …nearly doubled / tripled, as compared with that / those of last year.与去年的数据/百分比相比,……的数据几乎翻倍/翻了三倍(2)The number / percentage increased almost twice / two and a half times, compared with that of last years.与去年的数据/百分比相比,数据/百分比几乎上升了两倍/两倍半(3)By comparison with 2019, it jumped / dropped from X percent to Y percent. 与2019 年相比,数据从百分之X 上升/下降到百分之Y。
终结烧脑-如何用实用英语清晰地描述数据图表?

终结烧脑:如何用英语清晰地描述数据图表?无论就是市场分析还就是用户调研,结果之呈现都离不开各式各样之数据与图表。
看到数据就头疼?图表词汇储藏告急?满腹经纶说不出口?今日之文章教您在会议上侃侃而谈,轻松用英语讲解数据图表!各类图表都叫啥?图表之类型越来越多,它们在英语中之名称分别就是什么?表格咱们通常用“table〞表达,图形可以称为“chart〞或者“graph〞。
饼图“pie chart〞,折线图“line chart〞,条形图“bar chart〞,这些名称都get了吗?别再总就是用“this〞“that〞指代图表啦!As you can see from this bar graph for the year 2004, our business is getting big.从2004年之条形图中可以看出,咱们之业务正在逐渐扩大。
上升、下降怎么说?表现数据变化就是图表之重要功能之一。
表达数据上升咱们可以说“an increase of〞“a rise of〞“go up〞,描述数据下降那么可以说“drop from…to…〞“an decrease of〞“go down〞等等。
多种表达任您pick,让您之口语更加自如。
Our profit amounted to 725.33 million yuan, an increase of over 64% over 2003.咱们之利润为7亿2533万元,比2003年增长了64%以上。
描述数据量有哪些方法?图表中容纳之数据非常多,如果每个数值都用“is+数字〞来表达未免也太单调了。
实际上描述数据到达了多少有非常多种方法,“reach〞“amount to〞“stand at〞等等都就是常用之说法。
The total output of refrigerators stood at 2.1 million units, of which nearly half were exported.冰箱之总产量为210万台,其间近一半出口到国外。
- 1、下载文档前请自行甄别文档内容的完整性,平台不提供额外的编辑、内容补充、找答案等附加服务。
- 2、"仅部分预览"的文档,不可在线预览部分如存在完整性等问题,可反馈申请退款(可完整预览的文档不适用该条件!)。
- 3、如文档侵犯您的权益,请联系客服反馈,我们会尽快为您处理(人工客服工作时间:9:00-18:30)。
1、图形种类及概述法:泛指一份数据图表:a data graph(曲线图)/chart/diagram/illustration/table饼图:pie chart直方图或柱形图:bar chart/histogram趋势曲线图:line chart/curve diagram表格图:table流程图或过程图:flow chart/sequence diagram程序图:processing/procedures diagram2、常用的描述用法The table/chart diagram/graph shows (that)According to the table/chart diagram/graphAs (is) shown in the table/chart diagram/graphAs can be seen from the table/chart/diagram/graph/figures,figures/statistics shows (that)……It can be seen from the figures/statisticsWe can see from the figures/statisticsIt is clear from the figures/statisticsIt is apparent from the figures/statisticstable/chart/diagram/graph figures (that)……table/chart/diagram/graph shows/describes/illustrates 3、图表中的数据(Data)具体表达法数据(Data)在某一个时间段固定不变:fixed in time在一系列的时间段中转变:changes over time持续变化的data在不同情况下:增加:increase/raise/rise/go up ……减少:decrease/grow down/drop/fall ……波动:fluctuate/rebound/undulate/wave ……稳定:remain stable/stabilize/level off ……二、相关常用词组1、主章开头图表类型:table(表格)、chart(图表)、diagram(图标)、graph(多指曲线图)、column chart(柱状图)、pie graph(饼图)、tree diagram(树形图)描述:show、describe、illustrate、can be seen from、clear、apparent、reveal、represent内容:figure、statistic、number、percentage、proportion2、表示数据变化的单词或者词组rapid/rapidly 迅速的,飞快的,险峻的dramatic/dramatically 戏剧性的,生动的significant/significantly 有意义的,重大的,重要的sharp/sharply 锐利的,明显的,急剧的steep/steeply 急剧升降的steady/steadily 稳固的,坚定不移的gradual/gradually 渐进的,逐渐的slow/slowly 缓慢的,不活跃的slight/slightly 稍微的、略微地stable/stably 稳定的3、其它在描述中的常用到的词significant changes 图中一些较大变化noticeable trend 明显趋势during the same period 在同一时期grow/grew 增长distribute 分布unequally 不相等地in the case of 在……的情况下in terms of/in respect of/regarding 在……方面in contrast 相反,大不相同government policy 政府政策market forces 市场力量measuren n.尺寸,方法,措施v.估量,调节forecast n.先见,预见v.猜测三、图表描述套句精选1.the table shows the changes in the number of……over the period from……to……该表格描述了在……年之……年间……数量的变化。
2.the bar chart illustrates that……该柱状图展示了……3.the graph provides some inte resting data regarding……该图为我们提供了有关……有趣数据。
4.the diagram shows (that)……该图向我们展示了……5.the pie graph depicts (that)……该圆形图揭示了……6.this is a cure graph which describes the trend of……这个曲线图描述了……的趋势。
7.the figures/statistics show (that)……数据(字)表明……8.the tree diagram reveals how……该树型图向我们揭示了如何……9.the data/statistics show (that)……该数据(字)可以这样理解……10.the data/statistics/figures lead us to the conclusion that……这些数据资料令我们得出结论……11.as is shown/demonstrated/exhibited in thediagram/graph/chart/table……如图所示……12.according to the chart/figures……根据这些表(数字)……13.as is shown in the table……如表格所示……14.as can be seen from the diagram,great changes have taken place in……从图中可以看出,……发生了巨大变化。
15.from the table/chart/diagram/figure,we can see clearly that……or it is clear/apparent from the chart that……从图表我们可以很清楚(明显)看到……16.this is a graph which illustrates……这个图表向我们展示了……17.this table shows the changing proportion of a & b from……to……该表格描述了……年到……年间a与b的比例关系。
18.the graph,presented in a pie chart,shows the general trend in……该图以圆形图形式描述了……总的趋势。
19.this is a column chart showing……这是个柱型图,描述了……20.as can be seen from the graph,the two curves show the flutuation of……如图所示,两条曲线描述了……的波动情况。
21.over the period from……to……, the……remained level.在……至……期间,……基本不变。
22.in the year between……and……在……年到……期间……23.in the 3 years spanning from 1995 through 1998……1995年至1998三年里……24.from then on/from this time onwards……从那时起……25.the number of……remained steady/stable from(month/year) to (month/year)。
……月(年)至……月(年)……的数量基本不变。
类别:默认分类 | | 添加到搜藏 | 分享到i贴吧 | 浏览(1290) | 评论(0)上一篇:如何用英语描述各种图表(上)下一篇:如何用英语描述各种图表(下)相关文章:•英语音标图表大全,英语音标图表...•英语图表作文常用句型(待续)•关于图表的英语表达•英语:考研英语图表,情景作文模板...26.the number sharply went up to……数字急剧上升至……27.the percentage of……stayed the same between……and…… ……至……期间……的比率维持不变。
28.the figures peaked at……in(month/year)……的数目在……月(年)达到顶点,为……29.the percentage remained steady at……比率维持在……30.the percentage o f……is sightly larger/smaller than that of…………的比例比……的比例略高(低)。
31.there is not a great deal of difference between……and…………与……的区别不大。
32.the graphs show a threefold increase in the number of……该图表表明……的数目增长了三倍。
四倍(fourfold),五倍(fivefold)33……decreased year by year while……increased steadily.……逐年减少,而……逐步上升。
34.the situation reached a peak(a high point at) of[%].……的情况(局势)到达顶(高)点,为……百分点。
35.the figures/situation bottomed out in……数字(情况)在……达到底部。
36.the figures reached the bottom/a low point/hit a trough.数字(情况)达到底部(低谷)。
37.a is ……times as much/many as b.a是b的……倍。
38.a increased by……a增长了……39.a increased to……a增长到……40.high/low/great/small/ percentage.比率高(低)41.there is an upward trend in the number of…………数字呈上升趋势。