如何用英语描述各种图表
(完整)高考英语写作图表说明文模板范文
高考英语指导写作专题:图表说明文一,图表说明1,分类:数字表、函数关系图、曲线图(graph);表格(table);几何图形(figure);图形表、饼状图(pie chart);条状图、柱状图(bar chart);平面图、示意图、外形图(diagram)。
2,一般可分三个层次来写:按照题目要求描述图表反映的总情况,即概括大意。
对数字进行仔细的比较,抓住特点进行分析、归纳并找出产生变化的原因。
读图表后的想法、结论、评论或针对反映出的问题采取的解决措施。
二.表达方式:1,常用的描述句型The table/chart/diagram/graph shows that ...According to the table/chart/diagram/graph...As is shown in the table/chart/diagram/graph...As can be seen from the table/chart/diagram/graph/figures...We can see from the figures/statistics...It is clear/ apparent from the figures/statistics...2.图表中数据(data)的具体表达法数据(data)在某一个时间段固定不变:fixed in time在一系列的时间段中转变:changes over time增加:increase/raise/rise/...减少:decrease/grow down/drop/fall/decline稳定:remain stable3.描写变化的形容词及副词rapid/rapidly,dramatic/dramatically,significant/significantly,sharp/sharplysteep/steeply,steady/steadily,gradual/gradually,slow/slowly,slight/slightly三、写作模板As (is) shown/indicated by the figure/in the table/graph/pie chart/chart,_____ has been increased/decreased significantly/steadily from _____ to_____. From the sharp decline/rise in the chart,it goes without saying that_____.There are at least two reasons accounting for / contributing to ____. On the one hand, _____ On the other hand, _____. _____is due to the fact that_____. In addition,_____is responsible for_____. Maybe there are other reasons to show. But it is generally believed that the above mentioned reasons are commonlyconvincing/persuasive.As far as I am concerned,I hold the view that_____. I am sure my opinion is both sound and well-grounded.四,作文范例1,最近你校对中学生的消费情况进行了调查。
英语图表作文模型

英语图表作文模型各种图表名称:折线图(曲线图):graph;条状图:column chart;柱状图:bar chart;饼状图:pie chart/graph;表格:tableCopy and Apply Sentence 描述图表:①The bar chart/pie chart/figure/graph depicts/ indicates/ reveals/ suggests/ proves/demonstrates/ shows that 图表标题/主题dropped/increased from 某时间to 某时间, reaching 某一水平.②Another trend can be seen from the graph that图表标题/主题has been on asharp/significance/insignificance rise/drop, which accounts for 某一水平(from 某一时间to 某一时间).(可用于一个图表中有两种数据。
)③The graph depicts/indicates/reveals/suggests/proves/demonstrates/ shows that 图表标题/主题from 某一时间to 某一时间, reaching 某一水平(前者)to 某一水平(后者).④The graph depicts/indicates/reveals/suggests/proves/demonstrates/ shows that,during 某一时间to 某一时间, the 图表标题/主题have been on a rise, which account for 某一水平to 某一水平(前者)and 某一水平to 某一水平(后者).⑤饼状图:The pie charts depicts /indicates/ reveals/ suggests/ proves/demonstrates/shows that , during the 某一时间to 某一时间, the percent of changes in图表标题/主题:列举内容. The percent of 某一项数据saw a drop from 某一水平to 某一水平while the percent of 某一水平to 某一水平witnessed a rise from 某一水平to 某一水平.。
考研英语各类图表作文如何描述

考研英语各类图表作文如何描述考研英语各类图表作文如何描述考研阅读的题量大,时间有限,每篇文章的阅读和答题时间都有限,所以大家需要找到一些有效的方法技巧,快速的筛选出有效的信息,做好题目。
店铺为大家精心准备了考研英语各类图表作文描述的技巧,欢迎大家前来阅读。
考研英语各类图表作文描述的方法(一)表格:table1.极值1)Female literacy rate is the highest in Singapore. (注意,用highest而不是most)2)Sri Lanka has the lowest proportion of women workforce. (注意,用lowest而不是most)3)Food is the biggest item of expenditure for an average Australian family.2.排序1)Europeans are the leading ethnicity, followed by Asians, mixed races and others.2)England is where the most books are bought with 81% of the market. Wales comes next with 10% closely followed by Scotland with 8%. Northern Ireland lies last with only 1% of the market.(二)柱状图:bar chart/ column chart柱状图中经常需要对不同数据进行对比1.比较级1)In managerial positions, there are more men than women.2)A greater percentage of men than women are found in managerial positions.3)The percentage of men employed in managerial positionsis much larger than that of women in these occupations.4)Women spend longer time on household work than men.2.表示对比的句式while / whereas / compared with(三)饼状图:pie chart1.百分之/百分比1) percent2) percentage3) proportion, share, rate2.分数和百分比的转换为了避免数据描述的单调,有时可以用分数来替代百分比,例如:50% half25% a quarter75% three quarters33% a third/ one third67% two thirds3.“占”的表达1) A占到B的百分之X:A account for / make up / constitute X% of B2) A由B构成:A consist of B/ A be made up of B/ A be composed of B(四)线形图line chart极值:最高点和最低点1.达到最大值:reach a peak2.达到最小值:reach the lowest point在备考图表作文时,考生应能掌握以上图表术语及相关表达,这样可以极大提升考生在描述图表时的性、规范性与丰富性,从而提升自身作文档次,继而在写作这个题型取得更理想的。
图表描述英语作文模板

图表描述英语作文模板描述图表类,我们可以借用英语这类型写作的模板啊。
下面是小编给大家整理的图表描述英语作文模板,供大家参阅!图表描述英语作文模板1According to the chart / graph / diagram / table, we clearly learn that _________. As early as _________,___________. Then,_________. Last,__________. In contrast, by _________,__________.There are many reasons accounting for _________. Firstly, _________.Secondly,__________. Finally,_________. As a result,_________.As far as I am concerned,_________. For one thing,__________. For another,________. In brief, I hold that__________.图表描述英语作文模板2As is shown in the chart / graph / diagram / table above, __________ has charged drastically in the past _________. While ___________,now the percentage of__________ is __________. Meanwhile, the number of _________ has soared up to ________.There are mainly two possible reasons contributing to the rapid changes. The first is that _________. Secondly,__________.In my point of view, the changes have a great influence on_________. At the same time,_______. To sum up ,_________.图表描述英语作文模板3What is shown in the chart / graph / diagram / table above indicates that in recent years, more and more people pay attention to _________. The number of those who _________ has increased ________, and furthermore,____________.There are two factors responsible for the changes. In the first place,_________. Moreover,__________. Yet, it is noticeable that __________.From the analysis, we can safely draw the conclusion that__________. It is possible that in the future, the tendency will__________.图表描述英语作文模板4The chart gives us an overall picture of the ____________(图表主题). The first thing we notice is that_______________(图表最大特点). This means that as __________, _________________(进一步说明).We can see from the statistics given that _______________(图表细节一). After ving_________(细节一中的第一个变化), the _____Ved+幅度+时间(紧跟着的变化). The figures also tells us that_________________________(图表细节二). (数据位置,如In the second column), we can see that ____________accounts for _______(进一步描述).Judging from these figures, we can draw the conclusion that___________(结论). The reason for this, as far as I am concerned is that_____________(给出原因). / It is high time that we Ved(发出倡议).图表描述英语作文模板5According to the bar chart / pie chart / line graph displays the changes in the number of____________(图表整体趋势). There was an increase in ____________(图表细节).At the point of ____________, ____________reaches its peak value of ____________(数据或变化). What has caused these changes? There are mainly three reasons. Firstly, ____________ (原因一).Secondly, ____________(原因二). The number of ____________ increased over the period. ____________ rose by _________ from ________ to ________________. And there were____________. Finally, ____________(最后一个原因).In conclusion / We can safely draw the conclusion that ____________(结论). Therefore, ____________(进一步谈论更多个人想法).图表描述英语作文模板6It seems to me that the cartoon / drawing is sending a message about ____________(图画内容),which reveals ____________(稍作评价).In my perspective of view, ____________ (表明个人观点)。
如何用英文分析各种图表

线形图(Line graph)
柱状图(Bar chart)
每一个矩形就叫一个bar
表(Table)
表的“行”是"row",“列”是"column"
描述变化 (Describing Change)
向上的趋势(Upward movement) • To increase/rise/go up • To grow/expand • To rocket/boom/soar 向下的趋势(Downward movement) • To decrease/fall/drop/decline/go down • To slump/collapse/plummet/crash
Frankly speaking, the user of the fixed telephone is decreasing. On contrast, the user of mobile phone is creasing .It shows that the devolpment of our country and the addition of our income. At the same time, it makes our life more convenient.
The Analysis of Graph in English
常用图表种类 (Types of chart)
饼状图(Pie chart)
饼状图内部分成一块一块,用于表示所占 分量,那一块一块就叫"segment".
横轴叫axis,竖轴叫vertical,实线是solid line,虚线是broken line
From those data we can learn that most single noble don’t develop an healthy spending habits , what they care is how to enjoy themselves ,but almost forget to care their parents.What’s more ,they even have no idea about their future ,their kids .Though they are single ,It is important to learn financial management.
英文描述图表资料

1.我们可以从图表上看出:托雅的女生比例远远高于男生所占比例。
As can be seen from the chart, the percentage of female students was far higher than that of male students at Toya.2.从图表反映的情况来看:读雅思的人数远远超过读托福的,同时,读托福的人数一直呈现平稳上升趋势。
As can be seen from the chart, those who chose to study for IELTS far outnumbered those choosing to study for TOEFL. Meanwhile, the number of those who chose to study for TOEFL was on a steady rise.3.从图表反映的情况来看:托雅学生在饭店用餐的频率在不同的月份呈现出了相应的波动趋势。
As can be seen from the diagram, the frequency of Toya students eating at restaurants revealed a trend of fluctuations in different months.4.从图表反映的情况来看:托雅男教师所承担的每周工作量要高于女教师的。
As can be seen from the charts, the weekly workload borne by male teachers outweighed that of female teachers at Toya.5.从整个图表反映的情况来看:托雅总部以及五个分校的营业收入都呈现出了快速的增长趋势。
As can be seen from the chart, the sales of Toya Headquarter and the five branch schools all revealed a trend of fast increase across the board.6.从整个图表反映的情况来看:托雅教师的收入状况呈现出了稳步增长的总态势。
如何用英语描述图表
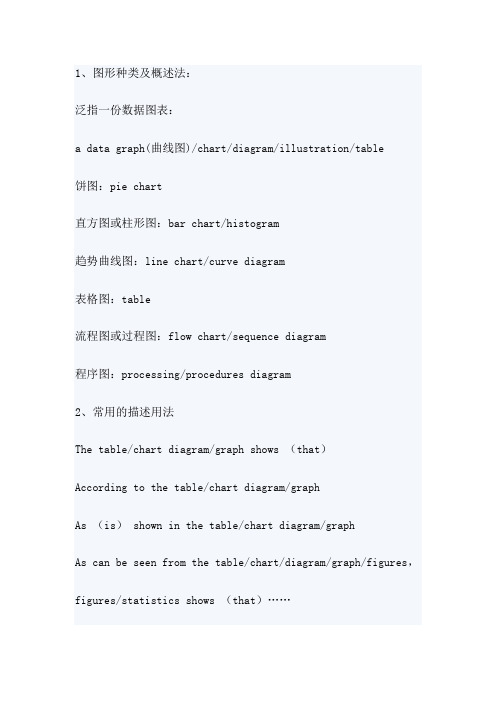
1、图形种类及概述法:泛指一份数据图表:a data graph(曲线图)/chart/diagram/illustration/table饼图:pie chart直方图或柱形图:bar chart/histogram趋势曲线图:line chart/curve diagram表格图:table流程图或过程图:flow chart/sequence diagram程序图:processing/procedures diagram2、常用的描述用法The table/chart diagram/graph shows (that)According to the table/chart diagram/graphAs (is) shown in the table/chart diagram/graphAs can be seen from the table/chart/diagram/graph/figures,figures/statistics shows (that)……It can be seen from the figures/statisticsWe can see from the figures/statisticsIt is clear from the figures/statisticsIt is apparent from the figures/statisticstable/chart/diagram/graph figures (that)……table/chart/diagram/graph shows/describes/illustrates 3、图表中的数据(Data)具体表达法数据(Data)在某一个时间段固定不变:fixed in time在一系列的时间段中转变:changes over time持续变化的data在不同情况下:增加:increase/raise/rise/go up ……减少:decrease/grow down/drop/fall ……波动:fluctuate/rebound/undulate/wave ……稳定:remain stable/stabilize/level off ……二、相关常用词组1、主章开头图表类型:table(表格)、chart(图表)、diagram(图标)、graph(多指曲线图)、column chart(柱状图)、pie graph(饼图)、tree diagram(树形图)描述:show、describe、illustrate、can be seen from、clear、apparent、reveal、represent内容:figure、statistic、number、percentage、proportion2、表示数据变化的单词或者词组rapid/rapidly 迅速的,飞快的,险峻的dramatic/dramatically 戏剧性的,生动的significant/significantly 有意义的,重大的,重要的sharp/sharply 锐利的,明显的,急剧的steep/steeply 急剧升降的steady/steadily 稳固的,坚定不移的gradual/gradually 渐进的,逐渐的slow/slowly 缓慢的,不活跃的slight/slightly 稍微的、略微地stable/stably 稳定的3、其它在描述中的常用到的词significant changes 图中一些较大变化noticeable trend 明显趋势during the same period 在同一时期grow/grew 增长distribute 分布unequally 不相等地in the case of 在……的情况下in terms of/in respect of/regarding 在……方面in contrast 相反,大不相同government policy 政府政策market forces 市场力量measuren n.尺寸,方法,措施v.估量,调节forecast n.先见,预见v.猜测三、图表描述套句精选1.the table shows the changes in the number of……over the period from……to……该表格描述了在……年之……年间……数量的变化。
终结烧脑-如何用实用英语清晰地描述数据图表?

终结烧脑:如何用英语清晰地描述数据图表?无论就是市场分析还就是用户调研,结果之呈现都离不开各式各样之数据与图表。
看到数据就头疼?图表词汇储藏告急?满腹经纶说不出口?今日之文章教您在会议上侃侃而谈,轻松用英语讲解数据图表!各类图表都叫啥?图表之类型越来越多,它们在英语中之名称分别就是什么?表格咱们通常用“table〞表达,图形可以称为“chart〞或者“graph〞。
饼图“pie chart〞,折线图“line chart〞,条形图“bar chart〞,这些名称都get了吗?别再总就是用“this〞“that〞指代图表啦!As you can see from this bar graph for the year 2004, our business is getting big.从2004年之条形图中可以看出,咱们之业务正在逐渐扩大。
上升、下降怎么说?表现数据变化就是图表之重要功能之一。
表达数据上升咱们可以说“an increase of〞“a rise of〞“go up〞,描述数据下降那么可以说“drop from…to…〞“an decrease of〞“go down〞等等。
多种表达任您pick,让您之口语更加自如。
Our profit amounted to 725.33 million yuan, an increase of over 64% over 2003.咱们之利润为7亿2533万元,比2003年增长了64%以上。
描述数据量有哪些方法?图表中容纳之数据非常多,如果每个数值都用“is+数字〞来表达未免也太单调了。
实际上描述数据到达了多少有非常多种方法,“reach〞“amount to〞“stand at〞等等都就是常用之说法。
The total output of refrigerators stood at 2.1 million units, of which nearly half were exported.冰箱之总产量为210万台,其间近一半出口到国外。
雅思图表类英语作文模板

雅思图表类英语作文模板英文回答:1. Introduce the chart/graph: Briefly describe the type of chart/graph, the data it presents, and the time period or geographical location it covers.2. Overall trend: State the general trend or pattern observed in the data. Use specific numbers or percentages to support your statement.3. Key features: Highlight the most important or noticeable features of the chart/graph, such as peaks, valleys, or changes over time.4. Possible reasons: Speculate on the reasons behind the trends or features you have identified. Consider external factors or events that may have influenced the data.5. Predictions or recommendations: Based on the data presented, make predictions about future trends or provide recommendations for action.中文回答:雅思图表类英语作文模板。
1. 图表介绍,简要描述图表类型、数据内容以及时间跨度或地理范围。
2. 总体趋势,陈述数据中观察到的总体趋势或模式。
英语图表作文模板及范文(通用12篇)

英语图表作文模板及范文(通用12篇)(经典版)编制人:__________________审核人:__________________审批人:__________________编制单位:__________________编制时间:____年____月____日序言下载提示:该文档是本店铺精心编制而成的,希望大家下载后,能够帮助大家解决实际问题。
文档下载后可定制修改,请根据实际需要进行调整和使用,谢谢!并且,本店铺为大家提供各种类型的经典范文,如工作总结、工作计划、合同协议、条据文书、策划方案、句子大全、作文大全、诗词歌赋、教案资料、其他范文等等,想了解不同范文格式和写法,敬请关注!Download tips: This document is carefully compiled by this editor. I hope that after you download it, it can help you solve practical problems. The document can be customized and modified after downloading, please adjust and use it according to actual needs, thank you!Moreover, our store provides various types of classic sample essays for everyone, such as work summaries, work plans, contract agreements, doctrinal documents, planning plans, complete sentences, complete compositions, poems, songs, teaching materials, and other sample essays. If you want to learn about different sample formats and writing methods, please stay tuned!英语图表作文模板及范文(通用12篇)英语图表作文模板及范文第1篇The table/chart diagram/graph shows (that)According to the table/chart diagram/graphAs (is)shown in the table/chart diagram/graphAs can be seen from the table/chart/diagram/graph/figures,figures/statistics shows (that)……It can be seen from the figures/statisticsWe can see from the figures/statisticsIt is clear from the figures/statisticsIt is apparent from the figures/statisticstable/chart/diagram/graph figures (that)……table/chart/diagram/graph shows/describes/illustrates图表类英语作文范文The past years have witnessed a mounting number of Chinese scholars returning from overseas.As is lively illustrated by the column chart, the number of returnees climbed from a mere thousand in 20XX to over thousand in 20XX, at an annual increase rate of around 50%.A multitude of factors may have led to the tendency revealed by the chart, but the following are the critical ones from my perspective.First and foremost, along with the development ofChinese economy and society, the number of Chinese studying abroad has been soaring in the past years, which has provided an eXpanding base for the number of returnees.In the second place, the government has enacted a series of preferential policies to attract overseas Chinese scholars back st but not least, the booming economy, science and technology in this country have generated more attative job opportunites for scholars returning from overseas.The waves of returnees will definitely contribute to this nation’s development, since they have brought back not only advanced science and technology but also pioneering concepts of education and management.With more scholars coming back from overseas, and with the concerted efforts of the whole nation,we have reasons to eXpect a faster rejuvenation of this country.更多培训课程:苏州个人提升英语更多学校信息:苏州虎丘区朗阁教育机构咨询电话:英语图表作文模板及范文第2篇Students tend to use computers more and more frequently nowadays.Reading this chart, we can find that the average number of hours a student spends on the computer per week has increased sharply.In 1990, it was less than 2 hours; and in 1995, it increased to almost 4 hours, and in 2000, the numbersoared to 20 hours.Obviously computers are becoming increasingly popular.There are several reasons for this change.First,computers facilitate us in more aspects of life.Also, the fast development of the Internet enlarges our demands for using computers.We can easily contact with friends in remote places through the Internet.Besides, the prices of computers are getting lower and lower,which enables more students to purchase them.However, there still eXist some problems, such as poor quality, out-of-date designs and so on.And how to balance the time between using computers and studying is also a serious problem.Anyhow, we will benefit a lot from computers as long as we use them properly.英语图表作文模板及范文第3篇As can be clearly seen from the graph/table/chart (As is shown in the table/figure), great changed have taken place in_______,The_________have/has skyrocketed/jumped from _____to _____.When it comes to the reasons for the changes,different people give different eXplanations.Here I shall just give a begin with, ______What’s more,___________, Last but not least, ________.While it is desirable that ___________,there are still some problems and difficulties for __________Firstly, __________,In addition, __________,In a word, __________.以上就是为大家整理的英语专四图表作文范文模板,希望能够对大家有所帮助。
图表类英语作文范文
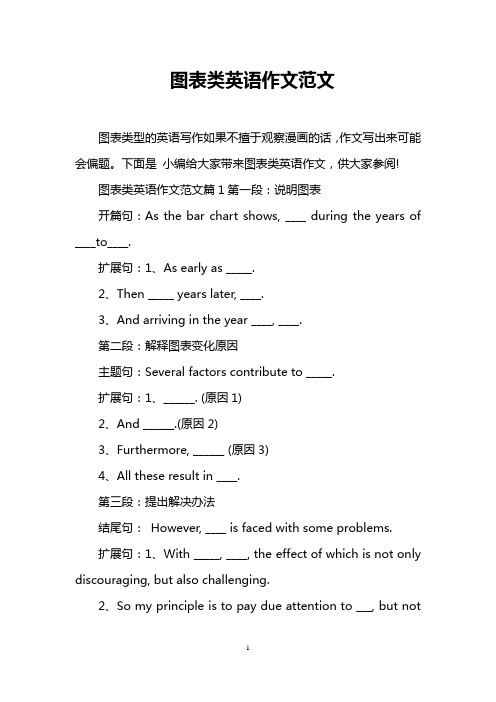
图表类英语作文范文图表类型的英语写作如果不擅于观察漫画的话,作文写出来可能会偏题。
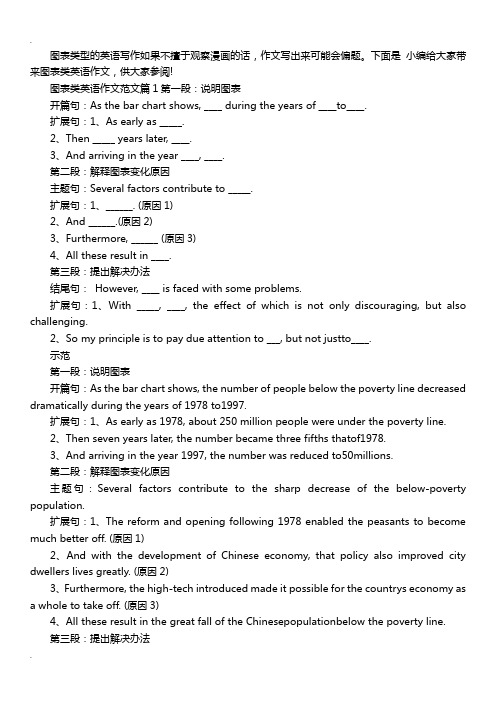
下面是小编给大家带来图表类英语作文,供大家参阅!图表类英语作文范文篇1第一段:说明图表开篇句:As the bar chart shows, ____ during the years of ____to____.扩展句:1、As early as _____.2、Then _____ years later, ____.3、And arriving in the year ____, ____.第二段:解释图表变化原因主题句:Several factors contribute to _____.扩展句:1、______. (原因1)2、And ______.(原因2)3、Furthermore, ______ (原因3)4、All these result in ____.第三段:提出解决办法结尾句:However, ____ is faced with some problems.扩展句:1、With _____, ____, the effect of which is not only discouraging, but also challenging.2、So my principle is to pay due attention to ___, but notjustto____.示范第一段:说明图表开篇句:As the bar chart shows, the number of people below the poverty line decreased dramatically during the years of 1978 to1997.扩展句:1、As early as 1978, about 250 million people were under the poverty line.2、Then seven years later, the number became three fifths thatof1978.3、And arriving in the year 1997, the number was reduced to50millions.第二段:解释图表变化原因主题句:Several factors contribute to the sharp decrease of the below-poverty population.扩展句:1、The reform and opening following 1978 enabled the peasants to become much better off. (原因1)2、And with the development of Chinese economy, that policy also improved city dwellers lives greatly. (原因2)3、Furthermore, the high-tech introduced made it possible for the countrys economy as a whole to take off. (原因3)4、All these result in the great fall of theChinesepopulationbelow the poverty line.第三段:提出解决办法结尾句:However, a further decrease in the number of poverty-stricken people is faced with some problems.扩展句:1、With quite few employees being laid off, the effect of which is not only discouraging, but also challenging.2、So my principle is to pay due attention to the newcomers, but not just to care for the poor, say, in remote mountain areas.范文As the bar chart shows, the number of people below the poverty line decreased dramatically during the years of 1978 to 1997. Asearly as 1978, about 250 million people were under the poverty line.Then seven years later, the number became three fifths that of 1978.And arriving in the year 1997, the number was reduced to 50 millions.Several factors contribute to the sharp decrease of the below-poverty population. The reform and opening following 1978 enabled the peasants to become much better off. And with the development of Chinese economy, that policy also improved city dwellers lives greatly. Furthermore, the high-tech introduced made it possible for the countryseconomy as a whole to take off. All these result in the great fall of the Chinese population below the poverty line.However, a further decrease in the number of poverty-stricken people is faced with some problems. With quite few employees being laid off, the effect of which is not only discouraging, but also challenging. So my principle is to pay due attention to the newcomers, but not just to care for the poor, say, in remote mountain areas.图表类英语作文范文篇2The past years have witnessed a mounting number of Chinese scholars returning from overseas. As is lively illustrated by the column chart, the number of returnees climbed from a mere 69.3 thousand in 2008 to over 272.9 thousand in 2012, at an annual increase rate of around 50%.A multitude of factors may have led to the tendency revealed by the chart, but the following are the critical ones from my perspective. First and foremost, along with the development of Chinese economy and society, the number of Chinese studying abroad has been soaring in the past years, which has provided an expanding base for the number of returnees. In the second place, the government has enacted a series of preferential policies to attract overseas Chinesescholars back home. Last but not least, the booming economy, science and technology in this country have generated more attative job opportunites for scholars returning from overseas.The waves of returnees will definitely contribute to this nation’s development, since they have brought back not only advanced science and technology but also pioneering concepts of education and management. With more scholars coming back from overseas, and with the concerted efforts of the whole nation, we have reasons to expect a faster rejuvenation of this country.图表类英语作文范文篇3一、图表类型基本单词图表类型:table(表格)、chart(图表)、diagram(图标)、graph(多指曲线图)、column chart(柱状图)、pie graph(饼图)、tree diagram(树形图)、饼图:pie chart、直方图或柱形图:bar chart/histogram、趋势曲线图:line chart/curve diagram、表格图:table、流程图或过程图:flow chart/sequence diagram、程序图:processing/procedures diagram二、图表描述基本词语1、描述:show、describe、illustrate、can be seen from、clear、apparent、reveal、represent2、内容:figure、statistic、number、percentage、proportion三、常用的描述句型The table/chart diagram/graph shows (that)According to the table/chart diagram/graphAs (is) shown in the table/chart diagram/graphAs can be seen from the table/chart/diagram/graph/figures,figures/statistics shows (that)……It can be seen from the figures/statisticsWe can see from the figures/statisticsIt is clear from the figures/statisticsIt is apparent from the figures/statisticstable/chart/diagram/graph figures (that) ……table/chart/diagram/graph shows/describes/illustrates看过图表类英语范文的人还。
图表类英语作文范文
图表类型的英语写作如果不擅于观察漫画的话,作文写出来可能会偏题。
下面是小编给大家带来图表类英语作文,供大家参阅!图表类英语作文范文篇1第一段:说明图表开篇句:As the bar chart shows, ____ during the years of ____to____.扩展句:1、As early as _____.2、Then _____ years later, ____.3、And arriving in the year ____, ____.第二段:解释图表变化原因主题句:Several factors contribute to _____.扩展句:1、______. (原因1)2、And ______.(原因2)3、Furthermore, ______ (原因3)4、All these result in ____.第三段:提出解决办法结尾句:However, ____ is faced with some problems.扩展句:1、With _____, ____, the effect of which is not only discouraging, but also challenging.2、So my principle is to pay due attention to ___, but not justto____.示范第一段:说明图表开篇句:As the bar chart shows, the number of people below the poverty line decreased dramatically during the years of 1978 to1997.扩展句:1、As early as 1978, about 250 million people were under the poverty line.2、Then seven years later, the number became three fifths thatof1978.3、And arriving in the year 1997, the number was reduced to50millions.第二段:解释图表变化原因主题句:Several factors contribute to the sharp decrease of the below-poverty population.扩展句:1、The reform and opening following 1978 enabled the peasants to become much better off. (原因1)2、And with the development of Chinese economy, that policy also improved city dwellers lives greatly. (原因2)3、Furthermore, the high-tech introduced made it possible for the countrys economy asa whole to take off. (原因3)4、All these result in the great fall of the Chinesepopulationbelow the poverty line.结尾句:However, a further decrease in the number of poverty-stricken people is faced with some problems.扩展句:1、With quite few employees being laid off, the effect of which is not only discouraging, but also challenging.2、So my principle is to pay due attention to the newcomers, but not just to care for the poor, say, in remote mountain areas.图表类英语作文范文篇3一、图表类型基本单词图表类型:table(表格)、chart(图表)、diagram(图标)、graph(多指曲线图)、column chart(柱状图)、pie graph(饼图)、tree diagram(树形图)、饼图:pie chart、直方图或柱形图:bar chart/histogram、趋势曲线图:line chart/curve diagram、表格图:table、流程图或过程图:flow chart/sequence diagram、程序图:processing/procedures diagram二、图表描述基本词语1、描述:show、describe、illustrate、can be seen from、clear、apparent、reveal、represent2、内容:figure、statistic、number、percentage、proportion三、常用的描述句型The table/chart diagram/graph shows (that)According to the table/chart diagram/graphAs (is) shown in the table/chart diagram/graphAs can be seen from the table/chart/diagram/graph/figures,figures/statistics shows (that)……It can be seen from the figures/statisticsWe can see from the figures/statisticsIt is clear from the figures/statisticsIt is apparent from the figures/statisticstable/chart/diagram/graph figures (that) ……table/chart/diagram/graph shows/describes/illustrates看过图表类英语范文的人还范文As the bar chart shows, the number of people below the poverty line decreased dramatically during the years of 1978 to 1997. Asearly as 1978, about 250 million people were under the poverty line.Then seven years later, the number became three fifths that of 1978.And arriving in the year 1997, the number was reduced to 50 millions.Several factors contribute to the sharp decrease of the below-poverty population. The reform and opening following 1978 enabled the peasants to become much better off. And with the development of Chinese economy, that policy also improved city dwellers lives greatly. Furthermore, the high-tech introduced made it possible for the countrys economy as a whole to take off. All these result in the great fall of the Chinese population below the poverty line.However, a further decrease in the number of poverty-stricken people is faced with some problems. With quite few employees being laid off, the effect of which is not only discouraging, but also challenging. So my principle is to pay due attention to the newcomers, but not just to care for the poor, say, in remote mountain areas.范文篇2The past years have witnessed a mounting number of Chinese scholars returning from overseas. As is lively illustrated by the column chart, the number of returnees climbed from a mere 69.3 thousand in 2008 to over 272.9 thousand in 2012, at an annual increase rate of around 50%.A multitude of factors may have led to the tendency revealed by the chart, but the following are the critical ones from my perspective. First and foremost, along with the development of Chinese economy and society, the number of Chinese studying abroad has been soaring in the past years, which has provided an expanding base for the number of returnees. In the second place, the government has enacted a series of preferential policies to attract overseas Chinese scholars back home. Last but not least, the booming economy, science and technology in this country have generated more attative job opportunites for scholars returning from overseas.The waves of returnees will definitely contribute to this nation’s development, since they have brought back not only advanced science and technology but also pioneering concepts of education and management. With more scholars coming back from overseas, and with the concerted efforts of the whole nation, we have reasons to expect a faster rejuvenation of this country.Directions: For this part, you are allowed 30 minutes to write a short essay entitled Education Pays based on the statistics provided in the chart below (Weekly earnings in 2010). Please give a brief deion of the chart first and then make comments on it. You should write at least 120 words but no more than 180 words.首段:图表描述(引出图表)This chart is provided by US Bureau of Labor and it is simple but enlightening. (图表描述万能) In 2010, it had become a trend for doctors, masters and bachelors to earn more money in a week in US--- $1551, $1272 and $1038. Meanwhile, other individuals could not enjoy satisfactory earnings, if they did not receive better education.二段:主题评论+现象+意义(图表联系主题)Obviously, this chart can be naturally associated with the importance of education: (图表内容评论)if individuals intend to acquire/ get better earnings, it is advisable for them to gain higher degrees. (现象)In the contemporary America, it is a common phenomenon for a host of companies/ firms/ corporations/ organizations to hire/ employ/ recruit doctors and masters and pay them better salaries. (相关人+感受) And an increasing number of youngsters find it rather difficult to get better jobs, if they do not get better education. (意义) It is education that enables them to build up adequate knowledge, skills and ability to deal with important tasks. (总结)As a matter of fact, employees and employers in large numbers have come to realize the significance of higher degrees.(观点)As a college student, I am convinced that it is of great necessity for youngsters to enhance ourselves by studying hard and getting better degrees. (号召)We should bear in mind that education is/means a worthy investmentDirections:Write an article on Changes on State-owned Houses and Private Houses of China. In your article you should(1) the present situation(2) the possible causes(3) its impactOwnership of Houses in BeijingOwnership of houses in Beijing has significantly changed in recent years. In 1990, 75 percent of the houses were state owned. But in 1995, the ratio of state-owned houses to private ones was 60 to 40. And the ownership changed dramatically since 1995 and by the end of the century, 80 percent of houses were private.There might have been two main reasons. One of the reasons was the policy of the government. In the 1990s, China carried on with its reform policy and the government called for privatization of the sate-owned estate. But it took time for the reform to come into effect. But from 1995 on when people have recognized its significance, the reformation took bigger steps. Another reason was that the people were getting better off and they could afford buying their own houses.Such changes have had great impact on individuals as well as the society. On one hand, the individuals must save money to buy an apartment or to pay the mortgage. On the other hand, a heaven burden has been taken off the government so that it can take more effective measures to improve people s life.题目:就中国公房和私房的变化写一篇短文。
英语作文图表分析范文(汇总30篇)
英语作文图表分析范文(汇总30篇)(经典版)编制人:__________________审核人:__________________审批人:__________________编制单位:__________________编制时间:____年____月____日序言下载提示:该文档是本店铺精心编制而成的,希望大家下载后,能够帮助大家解决实际问题。
文档下载后可定制修改,请根据实际需要进行调整和使用,谢谢!并且,本店铺为大家提供各种类型的经典范文,如工作总结、工作计划、合同协议、条据文书、策划方案、句子大全、作文大全、诗词歌赋、教案资料、其他范文等等,想了解不同范文格式和写法,敬请关注!Download tips: This document is carefully compiled by this editor. I hope that after you download it, it can help you solve practical problems. The document can be customized and modified after downloading, please adjust and use it according to actual needs, thank you!Moreover, our store provides various types of classic sample essays for everyone, such as work summaries, work plans, contract agreements, doctrinal documents, planning plans, complete sentences, complete compositions, poems, songs, teaching materials, and other sample essays. If you want to learn about different sample formats and writing methods, please stay tuned!英语作文图表分析范文(汇总30篇)英语作文图表分析范文第1篇图表类写作模版(1)模版1According to the chart / graph / diagram / table, we clearly learn that _________.As early as _________,___________.Then,_________.Last,__________.In contrast, by _________,__________.There are many reasons accounting for _________.Firstly, _________.Secondly,__________.Finally,_________.As a result,_________.As far as I am concerned,_________.For one thing,__________.For another,________.In brief, I hold that__________.(2)模版2What is shown in the chart / graph / diagram / table above indicates that in recent years, more and more people payattention to _________.The number of those who _________has increased ________,and furthermore,____________.There are two factors responsible for the changes.In the first place,_________.Moreover,__________.Yet, it is noticeable that __________.From the analysis, we can safely draw the conclusion that__________.It is possible that in the future,the tendency will__________.(3)模版3As is shown in the chart / graph / diagram / table above,__________has charged drastically in the past _________.While ___________,now the percentage of__________is __________.Meanwhile,the number of _________has soared up to ________.There are mainly two possible reasons contributing to the rapid changes.The first is that _________.Secondly,__________.In my point of view, the changes have a great influence on _________.At the same time,_______.To sum up ,_________.英语作文图表分析范文第2篇1、图形种类及概述法:泛指一份数据图表: a data graph/chart/diagram/illustration/table饼图:pie chart直方图或柱形图:bar chart / histogram趋势曲线图:line chart / curve diagram表格图:table流程图或过程图:flow chart / sequence diagram程序图:processing/procedures diagram2、常用的描述用法The table/chart diagram/graph shows (that)According to the table/chart diagram/graphAs (is)shown in the table/chart diagram/graphAs can be seen from the table/chart/diagram/graph/figures,figures/statistics shows (that)……It can be seen from the figures/statisticsWe can see from the figures/statisticsIt is clear from the figures/statisticsIt is apparent from the figures/statisticstable/chart/diagram/graph figures (that)……table/chart/diagram/graph shows/describes/illustrates how……3、图表中的数据(Data)具体表达法数据(Data)在某一个时间段固定不变:fiXed in time在一系列的时间段中转变:changes over time持续变化的data在不同情况下:增加:increase / raise / rise / go up ……减少:decrease / grow down / drop / fall ……波动:fluctuate / rebound / undulate / wave ……稳定:remain stable / stabilize / level off ……最常用的两种表达法:动词+副词形式(Verb+Adverb form)形容词+名词形式(Adjective+Noun form)英语作文图表分析范文第3篇雅思考试学术类图表作文分析考试学术类图表作文要求考生观察一幅图表并用自己的语言呈现出图表中的信息。
如何用英文描述各种图表
如何用英语描述各种图表1、图形种类及概述法:泛指一份数据图表:a data graph(曲线图)/chart/diagram/illustration/table饼图:pie chart直方图或柱形图:bar chart/histogram趋势曲线图:line chart/curve diagram表格图:table流程图或过程图:flow chart/sequence diagram程序图:processing/procedures diagram2、常用的描述用法The table/chart diagram/graph shows (that)According to the table/chart diagram/graphAs (is)shown in the table/chart diagram/graphAs can be seen from the table/chart/diagram/graph/figures,figures/statistics shows (that)……It can be seen from the figures/statisticsWe can see from the figures/statisticsIt is clear from the figures/statisticsIt is apparent from the figures/statisticstable/chart/diagram/graph figures (that)……table/chart/diagram/graph shows/describes/illustrates3、图表中的数据(Data)具体表达法数据(Data)在某一个时间段固定不变:fixed in time在一系列的时间段中转变:changes over time持续变化的data在不同情况下:增加:increase/raise/rise/go up ……减少:decrease/grow down/drop/fall ……波动:fluctuate/rebound/undulate/wave ……稳定:remain stable/stabilize/level off ……二、相关常用词组1、主章开头图表类型:table(表格)、chart(图表)、diagram(图标)、graph(多指曲线图)、column chart(柱状图)、pie graph(饼图)、tree diagram(树形图)描述:show、describe、illustrate、can be seen from、clear、apparent、reveal、represent内容:figure、statistic、number、percentage、proportion2、表示数据变化的单词或者词组rapid/rapidly 迅速的,飞快的,险峻的dramatic/dramatically 戏剧性的,生动的significant/significantly 有意义的,重大的,重要的sharp/sharply 锐利的,明显的,急剧的steep/steeply 急剧升降的steady/steadily 稳固的,坚定不移的gradual/gradually 渐进的,逐渐的slow/slowly 缓慢的,不活跃的slight/slightly 稍微的、略微地stable/stably 稳定的3、其它在描述中的常用到的词significant changes 图中一些较大变化noticeable trend 明显趋势during the same period 在同一时期grow/grew 增长distribute 分布unequally 不相等地in the case of 在……的情况下in terms of/in respect of/regarding 在……方面in contrast 相反,大不相同government policy 政府政策market forces 市场力量measuren n.尺寸,方法,措施v.估量,调节forecast n.先见,预见v.猜测三、图表描述套句精选1.the table shows the changes in the number of……over the period from……to……该表格描述了在……年之……年间……数量的变化。
如何用英语阐述图表信息

如何用英语阐述图表信息想在职场混,PPT得过关;想在外企混,PPT英语少不了。
不管你是普通职工还是公司高层,多多少少总会用到PPT做汇报,做图表,那么,如何用英语阐述会更有说服力呢?下面来学学职场中,如何恰当地阐述图表中的信息吧:描述图表信息常用表达句型:First quarter: Sales remained fairly steady throughout the months of January to March.第一季度:销售额从1月份到3月份一直都保持平稳。
Second quarter: There was a downturn in the second quarter with the sales falling to…in June.第二季度:销售额出现下降趋势,6月份降到…Third quarter: Sales rocketed in July and reached a peak in September.第三季度:7月份销售额陡增并于9月份达到峰值。
Fourth quarter: With the beginning of October, sales plummeted due to a significant drop in demands. A further decline continued into November and leveled off through the end of the year.第四季度:从10月初开始,由于需求的显著减少,销售额骤然下跌。
11月份销售额持续下降,在年底趋于平稳。
描述图表信息常用表达词Increase slightly 略微增长Increase dramatically 显著增长Decrease slowly 缓慢减少Decrease abruptly 急速减少Fluctuate mildly 轻微波动Fluctuate wildly 大幅度波动Nosedive to an all-time low 暴跌到空前最低点Reach a record high 达到历史最高点Start a spectacular ascension 开始惊人的上升/上涨Continue to skyrocket 继续飞涨Slide 逐渐降低Go up 上升;增长Go down 下降;减少原文来自必克英语/studydetail_49466682.html。
英文图表描述类方法汇总

今天我们所要关注的是运动图表,无论是什么题目的运动图表,无论题出的多难,我们都要清醒的认识到,那就是考官也逃不出如下的5个范畴,它们分别是运动范畴,程度范畴,时间范畴,数据范畴与连接范畴。
(一)运动范畴中存在着如下的8种运动趋向:1、保持平稳:我们可以使用的套用结构有: stay stable/ remain steady举例:表示人口数量保持平稳的时候可以写: the number of population stayed stable。
/the number of population remained steady2、上升/增加:我们可以使用的套用结构有:rise/ climb/ increase/ ascend/mount/aggrandize(增加)举例:人口上升:the number of population increased/ascended/mounted等等。
3、下降/减少:我们可以使用的套用结构有:fall/ drop/ decrease/ descend/ decline举例:人口减少:the number of population decreased/ declined4、下降后保持平稳:这个线段前面是向下的,后面是平的,在表示这个平的时候我们就不可以使用remain steady了,我们要使用的结构是bottom out举例:人口下降后保持平稳:the number of population decreased and bottomed out5、上升后保持平稳:前面的上升我们就不用说了,但是在上升以后保持平稳,我们需要使用level off举例:人口上升后保持平稳:number of population mounted and leveled off6、复苏: 前面下降了以后,然后就上升了,这两条线段的连接点就叫复苏.英语中表达为recover举例:人口下降后复苏:number of population decreased and recovered7、波动:就像我们的心电图一样.英语中叫fluctuate 举例:人口波动:number of population fluctuated8、达到顶峰:peak/ reach its summit/reach its zenith举例:人口到达了顶峰:number of population peaked/ reached its summit/ reached its zenith但是同学们想过没有上升,下降,波动是存在程度的。
英语描述图表资料汇总

英语描述图表资料汇总这类图标话题或作文描述时,注意以下几点:审题时,除了要把握好图表的表层信息外,还要分析图标的深层含义,如原因、根源、可能的发展趋势等。
图表中所提供的说明文字往往是问题的切入点,一定要仔细分析。
描述数据时要抓住重点,为中心服务,不必面面俱到,切忌毫无目的地罗列图表中的数据。
如果数据较多,抓住图表中的极端点(如最大或最小、最多或最少,最好或最差)和基本相同进行描述。
主题句应明确,最好放在文章的开头,这样会使重点突出,主题明了。
常见模板第一段:总体描述图表,指明时间段,指出突出变化或不同常用句型或短语:As is clearly shown in the chart(图表)/ table(表格)/graph(线性图), ___________ According to the figures given in the table/chart/graph, ____________It can be seen from the table/chart/graph, _____________________.The figures in the table/chart reflect that ________________.especially, ________________(指出突出变化)第二段:(分析原因)There are several factors leading to this change / difference ……..There are several reasons for _____________.(引出原因)To begin with, _______(原因一)In addition, ______________(原因二)For example, _________(举例说明)Last but not the least, __________(原因三)To sum up——————————————(简要总结)第三段:(解决方法)Perhaps the best way to solve this problem is to …Many workable solutions have been found to dealing with this problemHere are some suggestions that we should …My suggestion is that …It is suggested that …提出个人观点As for meFor my partAs far as I am concernedI am in favor of…In my opinion一、词汇积累:1.各种图表的名称(Types of chart)饼状图(Pie chart):饼状图内部分成一块一块,用于表示所占分量,那一块一块就叫"segment"。
- 1、下载文档前请自行甄别文档内容的完整性,平台不提供额外的编辑、内容补充、找答案等附加服务。
- 2、"仅部分预览"的文档,不可在线预览部分如存在完整性等问题,可反馈申请退款(可完整预览的文档不适用该条件!)。
- 3、如文档侵犯您的权益,请联系客服反馈,我们会尽快为您处理(人工客服工作时间:9:00-18:30)。
如何用英语描述各种图表1、图形种类及概述法:泛指一份数据图表:a data graph(曲线图)/chart/diagram/illustration/table饼图:pie chart直方图或柱形图:bar chart/histogram趋势曲线图:line chart/curve diagram表格图:table流程图或过程图:flow chart/sequence diagram程序图:processing/procedures diagram2、常用的描述用法The table/chart diagram/graph shows (that)According to the table/chart diagram/graphAs (is)shown in the table/chart diagram/graphAs can be seen from the table/chart/diagram/graph/figures,figures/statistics shows (that)……It can be seen from the figures/statisticsWe can see from the figures/statisticsIt is clear from the figures/statisticsIt is apparent from the figures/statisticstable/chart/diagram/graph figures (that)……table/chart/diagram/graph shows/describes/illustrates3、图表中的数据(Data)具体表达法数据(Data)在某一个时间段固定不变:fixed in time在一系列的时间段中转变:changes over time持续变化的data在不同情况下:增加:increase/raise/rise/go up ……减少:decrease/grow down/drop/fall ……波动:fluctuate/rebound/undulate/wave ……稳定:remain stable/stabilize/level off ……二、相关常用词组1、主章开头图表类型:table(表格)、chart(图表)、diagram(图标)、graph(多指曲线图)、column chart(柱状图)、pie graph(饼图)、tree diagram(树形图)描述:show、describe、illustrate、can be seen from、clear、apparent、reveal、represent内容:figure、statistic、number、percentage、proportion2、表示数据变化的单词或者词组rapid/rapidly 迅速的,飞快的,险峻的dramatic/dramatically 戏剧性的,生动的significant/significantly 有意义的,重大的,重要的sharp/sharply 锐利的,明显的,急剧的steep/steeply 急剧升降的steady/steadily 稳固的,坚定不移的gradual/gradually 渐进的,逐渐的slow/slowly 缓慢的,不活跃的slight/slightly 稍微的、略微地stable/stably 稳定的3、其它在描述中的常用到的词significant changes 图中一些较大变化noticeable trend 明显趋势during the same period 在同一时期grow/grew 增长distribute 分布unequally 不相等地in the case of 在……的情况下in terms of/in respect of/regarding 在……方面in contrast 相反,大不相同government policy 政府政策market forces 市场力量measuren n.尺寸,方法,措施v.估量,调节forecast n.先见,预见v.猜测三、图表描述套句精选1.the table shows the changes in the number of……over the period from……to……该表格描述了在……年之……年间……数量的变化。
2.the bar chart illustrates that……该柱状图展示了……3.the graph provides some interesting data regarding……该图为我们提供了有关……有趣数据。
4.the diagram shows (that)……该图向我们展示了……5.the pie graph depicts (that)……该圆形图揭示了……6.this is a cure graph which describes the trend of……这个曲线图描述了……的趋势。
7.the figures/statistics show (that)……数据(字)表明……8.the tree diagram reveals how……该树型图向我们揭示了如何……9.the data/statistics show (that)……该数据(字)可以这样理解……10.the data/statistics/figures lead us to the conclusion that……这些数据资料令我们得出结论……11.as is shown/demonstrated/exhibited in the diagram/graph/chart/table……如图所示……12.according to the chart/figures……根据这些表(数字)……13.as is shown in the table……如表格所示……14.as can be seen from the diagram,great changes have taken place in……从图中可以看出,……发生了巨大变化。
15.from the table/chart/diagram/figure,we can see clearly that……or it is clear/apparent from the chart that……从图表我们可以很清楚(明显)看到……16.this is a graph which illustrates……这个图表向我们展示了……17.this table shows the changing proportion of a & b from……to……该表格描述了……年到……年间a与b的比例关系。
18.the graph,presented in a pie chart,shows the general trend in……该图以圆形图形式描述了……总的趋势。
19.this is a column chart showing……这是个柱型图,描述了……20.as can be seen from the graph,the two curves show the flutuation of……如图所示,两条曲线描述了……的波动情况。
21.over the period from……to……, the……remained level.在……至……期间,……基本不变。
22.in the year between……and……在……年到……期间……23.in the 3 years spanning from 1995 thr ough 1998……1995年至1998三年里……24.from then on/from this time onwards……从那时起……25.the number of……remained steady/stable from (month/year)to (month/year)。
……月(年)至……月(年)……的数量基本不变。
26.the number sharply went up to……数字急剧上升至……27.the percentage of……stayed the same between……and…………至……期间……的比率维持不变。
28.the figures peaked at……in(month/year)……的数目在……月(年)达到顶点,为……29.the percentage remained steady at……比率维持在……30.the percentage of……is sightly larger/smaller than that of…………的比例比……的比例略高(低)。
31.there is not a great deal o f difference between……and…………与……的区别不大。
32.the graphs show a threefold increase in the number of……该图表表明……的数目增长了三倍。
四倍(fourfold),五倍(fivefold)33……decreased year by year while……increased steadily.……逐年减少,而……逐步上升。
34.the situation reached a peak(a high point at)of[%].……的情况(局势)到达顶(高)点,为……百分点。
35.the figures/situation bottomed out in……数字(情况)在……达到底部。
36.the figures reached the bottom/a low point/hit a trough.数字(情况)达到底部(低谷)。
37.a is ……times as much/many as b.a是b的……倍。
38.a increased by……a增长了……39.a increased to……a增长到……40.high/low/great/small/ percentage.比率高(低)41.there is an upward trend in the number of…………数字呈上升趋势。
42.a considerable increase/decrease occurred from……to…………到……发生急剧上升。
43.from……to……the rate of decrease slow down.从……到……,下降速率减慢。