matlab绘制动态三维心形代码(蛋疼的情人节奉献)
浪漫公式Love分段函数和各种心型函数matlab实现

浪漫公式Love分段函数和各种⼼型函数matlab实现采⽤函数分段LOVE字体函数matlab源码:%Lfigure('NumberTitle', 'off', 'Name', 'love函数');x=0:0.1:5.5;y=1./x.*(x>=0&x<6);plot(x,y,'b','linewidth',2);xlabel('X轴');ylabel('Y轴');%坐标轴表⽰对象标签axis on;%显⽰坐标轴hold on;%下⾯的图形继续在此坐标图上作图axis([0,23,0.2,6]);%x,y的范围限制%Ox0=7.5;y0=3;r=2.8;theta=0:pi/50:2*pi;x=x0+r*cos(theta);y=y0+0.2+r*sin(theta);plot(x,y,'b','linewidth',2);axis square;%Vx=11:0.1:17;y=0.2+abs(-2*(x-14)).*(x>10&x<18); plot(x,y,'b','linewidth',2);%Ey=-2*pi:0.1:2*pi;x=22-4*abs(sin(y));hold onplot(x,y,'b','linewidth',2);axis([0 23 0.2 6])此函数采⽤分段函数实现:另外再附⼏个⼼型函数:⼼函数:MATLAB源代码:figure('NumberTitle', 'off', 'Name', '⼼函数');ezplot('(x^2-1+y^2)^3-x^2*y^3 = 0') %隐函数作图,想⽐于plot不⽤指定变量范围axis([-2.5 2.5 -2 2]) %范围三维⼼型函数:源代码:figure('NumberTitle', 'off', 'Name', '⽴体⼼函数');n=100;x=linspace(-3,3,n); %nirvy=linspace(-3,3,n);z=linspace(-3,3,n);[X,Y,Z]=ndgrid(x,y,z);F=((-(X.^2) .* (Z.^3) -(9/80).*(Y.^2).*(Z.^3)) + ((X.^2) + (9/4).* (Y.^2) + (Z.^2)-1).^3); %⼼型函数,《⾼数(同济⼤学版)-附录》isosurface(F,0)lighting phongcaxisaxis equalcolormap('flag'); %颜⾊view([60 30]); %视⾓x1=xlabel('x轴');x2=ylabel('y轴');x3=zlabel('z轴');。
matlab粒子爱心代码
matlab粒子爱心代码
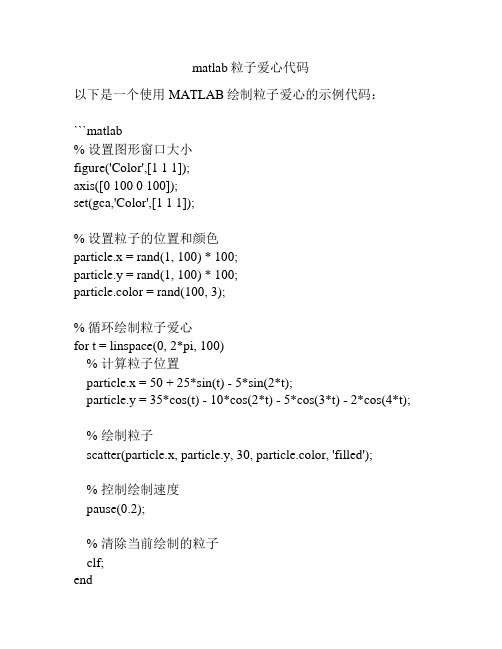
以下是一个使用MATLAB绘制粒子爱心的示例代码:
```matlab
% 设置图形窗口大小
figure('Color',[1 1 1]);
axis([0 100 0 100]);
set(gca,'Color',[1 1 1]);
% 设置粒子的位置和颜色
particle.x = rand(1, 100) * 100;
particle.y = rand(1, 100) * 100;
particle.color = rand(100, 3);
% 循环绘制粒子爱心
for t = linspace(0, 2*pi, 100)
% 计算粒子位置
particle.x = 50 + 25*sin(t) - 5*sin(2*t);
particle.y = 35*cos(t) - 10*cos(2*t) - 5*cos(3*t) - 2*cos(4*t);
% 绘制粒子
scatter(particle.x, particle.y, 30, particle.color, 'filled');
% 控制绘制速度
pause(0.2);
% 清除当前绘制的粒子
clf;
end
```
该代码利用scatter函数绘制了100个不同的粒子,随着时间的变化,这些粒子将形成一个爱心形状。
通过控制粒子的位置和颜色,可以创造出各种不同的效果。
注意:运行该代码可能需要MATLAB的图形库支持,确保已正确设置和安装MATLAB。
matlab动态爱心代码
Matlab动态爱心代码简介动态爱心代码是一种使用Matlab编程语言实现的动画效果,能够在屏幕上以爱心形状展示出美丽的动态效果。
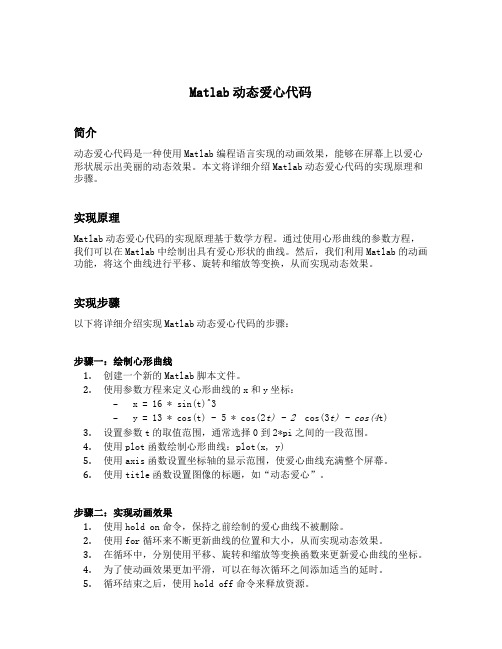
本文将详细介绍Matlab动态爱心代码的实现原理和步骤。
实现原理Matlab动态爱心代码的实现原理基于数学方程。
通过使用心形曲线的参数方程,我们可以在Matlab中绘制出具有爱心形状的曲线。
然后,我们利用Matlab的动画功能,将这个曲线进行平移、旋转和缩放等变换,从而实现动态效果。
实现步骤以下将详细介绍实现Matlab动态爱心代码的步骤:步骤一:绘制心形曲线1.创建一个新的Matlab脚本文件。
2.使用参数方程来定义心形曲线的x和y坐标:–x = 16 * sin(t)^3–y = 13 * cos(t) - 5 * cos(2t) - 2 cos(3t) - cos(4t)3.设置参数t的取值范围,通常选择0到2*pi之间的一段范围。
4.使用plot函数绘制心形曲线:plot(x, y)5.使用axis函数设置坐标轴的显示范围,使爱心曲线充满整个屏幕。
6.使用title函数设置图像的标题,如“动态爱心”。
步骤二:实现动画效果1.使用hold on命令,保持之前绘制的爱心曲线不被删除。
2.使用for循环来不断更新曲线的位置和大小,从而实现动态效果。
3.在循环中,分别使用平移、旋转和缩放等变换函数来更新爱心曲线的坐标。
4.为了使动画效果更加平滑,可以在每次循环之间添加适当的延时。
5.循环结束之后,使用hold off命令来释放资源。
示例代码下面是一个示例的Matlab动态爱心代码:% 步骤一:绘制心形曲线t = 0:0.01:2*pi;x = 16 * sin(t).^3;y = 13 * cos(t) - 5 * cos(2*t) - 2 * cos(3*t) - cos(4*t);plot(x, y);axis([-20 20 -20 20]);title('动态爱心');% 步骤二:实现动画效果hold on;for scale = 0.1:0.1:2% 平移tx = 5 * scale;ty = -3 * scale;x_new = x + tx;y_new = y + ty;% 旋转angle = scale * pi/4;x_new = x_new * cos(angle) - y_new * sin(angle);y_new = x_new * sin(angle) + y_new * cos(angle);% 缩放x_new = x_new * scale;y_new = y_new * scale;plot(x_new, y_new);pause(0.1);endhold off;结论通过以上步骤,我们可以实现一个简单但美丽的Matlab动态爱心代码,展示出令人惊叹的动画效果。
c语言动态爱心代码
c语言动态爱心代码
// 动态爱心代码: #include <stdio.h> #include
<math.h> #define PI 3.1415926 int main()
{ int i,j; double x,y,r;
for(i=0;i<=14;i++) { for(j=0;j<=14;j++) { x=j-7; y=i-7;
r=sqrt(x*x+y*y); if((r<=7)&&(r>=6.5)) printf("*"); else printf("
"); } printf("\n"); }
return 0; }
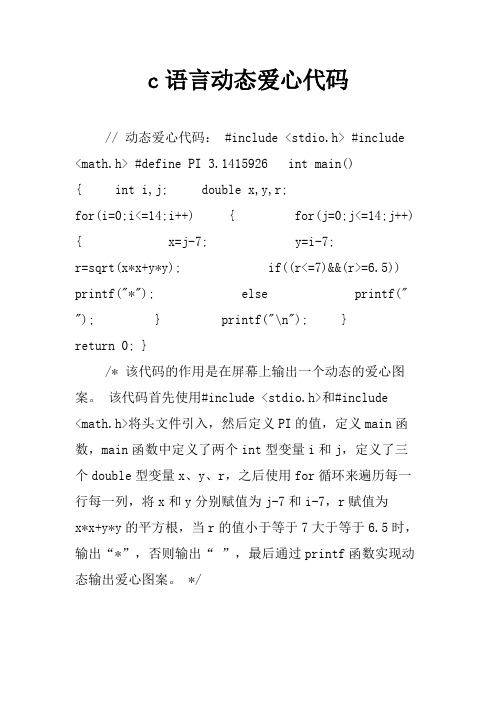
/* 该代码的作用是在屏幕上输出一个动态的爱心图
案。
该代码首先使用#include <stdio.h>和#include
<math.h>将头文件引入,然后定义PI的值,定义main函
数,main函数中定义了两个int型变量i和j,定义了三
个double型变量x、y、r,之后使用for循环来遍历每一
行每一列,将x和y分别赋值为j-7和i-7,r赋值为
x*x+y*y的平方根,当r的值小于等于7大于等于6.5时,
输出“*”,否则输出“ ”,最后通过printf函数实现动
态输出爱心图案。
*/。
MATLAB中的三维图形绘制与动画制作技巧

MATLAB中的三维图形绘制与动画制作技巧引言MATLAB是一种强大的科学计算软件,广泛应用于工程、物理、数学等各个领域。
其中,三维图形绘制和动画制作是其功能的重要一部分。
本文将深入探讨MATLAB中三维图形绘制与动画制作的技巧,并给出一些实用的示例。
一、三维图形绘制1. 坐标系的设定在绘制三维图形之前,我们需要设定坐标系。
通过使用MATLAB的figure函数和axes函数,我们可以创建一个三维坐标系,并设置其属性,如坐标轴的范围、标签等。
2. 点的绘制在三维图形中,最基本的图元是点。
通过scatter3函数,我们可以绘制出一系列点的三维分布情况。
可以通过设置点的大小、颜色、透明度等属性,增加图像的美观性。
3. 曲线的绘制MATLAB提供了多种绘制曲线的函数,如plot3、line、quiver等。
通过这些函数,我们可以绘制各种样式的曲线,例如直线、曲线、矢量、流线等。
我们可以根据需要设置线条的样式、颜色、宽度等属性。
4. 曲面的绘制除了曲线,我们还可以绘制三维曲面。
通过函数mesh、surf和contour,我们可以绘制出具有平滑外形的曲面。
可以通过设置颜色映射和透明度等属性,使得曲面具有更加细腻的外观。
二、动画制作1. 创建动画对象要制作动画,我们需要先创建一个动画对象。
通过使用MATLAB的videoWriter函数,我们可以创建一个视频文件,并设置其参数,如帧率、分辨率等。
2. 绘制关键帧动画的核心是绘制一系列关键帧,并在每一帧之间进行插值。
通过在每一帧中修改图形对象的属性,我们可以实现对象的平移、旋转和缩放等变换。
通过MATLAB提供的getframe函数,我们可以将当前图像存储为一个帧对象。
3. 帧之间的插值在关键帧之间,我们需要进行插值,以平滑动画的过渡。
通过使用MATLAB 的linspace函数,我们可以生成两个关键帧之间的若干插值。
然后,我们可以在每个插值处更新图形对象的属性,从而实现动画效果。
用matlab制作love代码
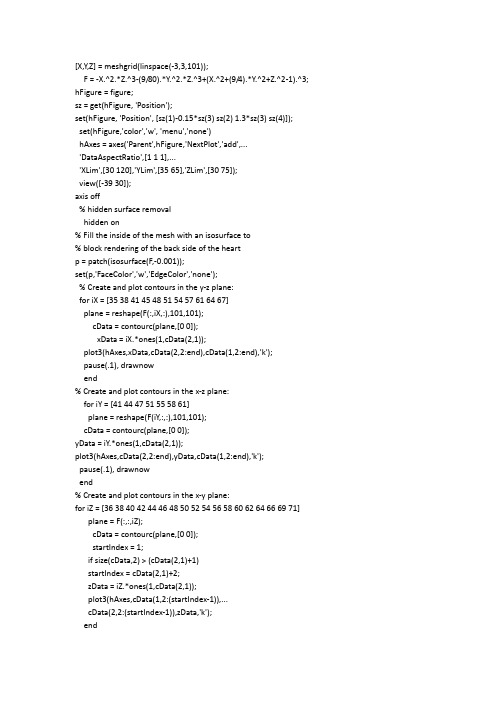
[X,Y,Z] = meshgrid(linspace(-3,3,101));F = -X.^2.*Z.^3-(9/80).*Y.^2.*Z.^3+(X.^2+(9/4).*Y.^2+Z.^2-1).^3; hFigure = figure;sz = get(hFigure, 'Position');set(hFigure, 'Position', [sz(1)-0.15*sz(3) sz(2) 1.3*sz(3) sz(4)]);set(hFigure,'color','w', 'menu','none')hAxes = axes('Parent',hFigure,'NextPlot','add',...'DataAspectRatio',[1 1 1],...'XLim',[30 120],'YLim',[35 65],'ZLim',[30 75]);view([-39 30]);axis off% hidden surface removalhidden on% Fill the inside of the mesh with an isosurface to% block rendering of the back side of the heartp = patch(isosurface(F,-0.001));set(p,'FaceColor','w','EdgeColor','none');% Create and plot contours in the y-z plane:for iX = [35 38 41 45 48 51 54 57 61 64 67]plane = reshape(F(:,iX,:),101,101);cData = contourc(plane,[0 0]);xData = iX.*ones(1,cData(2,1));plot3(hAxes,xData,cData(2,2:end),cData(1,2:end),'k');pause(.1), drawnowend% Create and plot contours in the x-z plane:for iY = [41 44 47 51 55 58 61]plane = reshape(F(iY,:,:),101,101);cData = contourc(plane,[0 0]);yData = iY.*ones(1,cData(2,1));plot3(hAxes,cData(2,2:end),yData,cData(1,2:end),'k');pause(.1), drawnowend% Create and plot contours in the x-y plane:for iZ = [36 38 40 42 44 46 48 50 52 54 56 58 60 62 64 66 69 71] plane = F(:,:,iZ);cData = contourc(plane,[0 0]);startIndex = 1;if size(cData,2) > (cData(2,1)+1)startIndex = cData(2,1)+2;zData = iZ.*ones(1,cData(2,1));plot3(hAxes,cData(1,2:(startIndex-1)),...cData(2,2:(startIndex-1)),zData,'k');endzData = iZ.*ones(1,cData(2,startIndex));plot3(hAxes,cData(1,(startIndex+1):end),...cData(2,(startIndex+1):end),zData,'k');pause(.1), drawnowendpause(.2)text(7,50,70,'I', 'fontWeight','bold','FontAngle','italic','fontsize',100) pause(.5)text(80,50,43,'you', 'fontWeight','bold','FontAngle','italic','fontsize',100) pause(.2)line([20 80],[50 50],[52.5 52.5], 'color','k')line([50 50],[20 80],[52.5 52.5], 'color','k')line([50 50],[50 50],[30 80], 'color','k')text(20,50,50,'x')text(48,20,50,'y')text(45,50,80,'z')text(30,60,30,'(x^2+9/4y^2+z^2-1)^3 - x^2z^3-9/80y^2z^3=0', 'fontsize',8) text(35,45,30,'-3<x,y,z<3', 'fontsize',8)。
MATLAB教程三维图形

x=sin(t); y=cos(t); z=t;
plot3(x,y,z) ,
axis square; grid on
Kjqx.m
x1=[0.5, 0.5, 0, 0.5]; y1=[0.5, 0.5, 0, 0.5]; z1=[ 1, 0, 0, 1 ]; x2=[0.5, 0.5, 1, 0.5]; y2=[0.5, 0.5, 0, 0.5]; z2=[ 1, 0, 0, 1 ]; x3=[0,1]; y3=[0,0]; z3=[0,0]; plot3(x1,y1,z1,x2,y2,z2,x3,y3,z3)
三.网线和表面图
1、三维绘图数据的产生
在matlab中,曲面是用x y平面上各个格点的 Z坐标 来定义的。画曲面前先要生成三维绘图数据。
(1)利用meshgrid函数生成平面网格坐标矩阵。再 利用函数关系求Z.
x=a:△x:b; y=c:△y:d; [X,Y]=meshgrid(x,y); Z=f (x,y) (2)利用双峰函数peaks [x,y,z]=peaks(n) 分别创建x,y,z三个均为n×n阶的方阵 peaks(n)直接使用peaks函数所创建的矩阵绘制表面图
色图矩阵是m×3 的数值矩阵,它的每一行是RGB三元组。 [0 0 0] 黑色 [1 0 0] 红色 [0 1 0]蓝色 [0 0 1]绿色
色图函数 pink 粉色 copper 铜色 hot 暖色 cool 冷色 flag 四色旗 prism光谱色
setu.m spring summer autumn winter
ys.m ys02.m
1.5.4 动画
1、彗星轨迹图
Comet(x,y,p)
彗长为p*length(y)的二维彗星轨迹,p的默认值为0y)的三维彗星轨迹,p的默认值为0.1 ddqxn.m huixing.m
c语言程序3d心形代码
以下是一个使用C 语言编写的绘制3D 心形的示例代码:```c#include <stdio.h>#include <math.h>#define PI 3.14159265void printHeart(int size) {int row, col, r;double x, y, distance;for (row = 0; row <= 2 * size; row++) {for (col = 0; col <= 2 * size; col++) {x = (col - size) * 1.0 / size;y = (size - row) * 1.0 / size;distance = sqrt(x * x + y * y);if (distance <= 1.0) {if (distance > 0.9) {printf("*");} else {if (x <= 0.0) {if (y >= 0.0 && y <= 0.5 * sqrt(1 - x * x)) {printf("*");} else if (y < 0.0 && y >= -1.2 * pow(1 - x * x, 1.0 / 3.0)) {printf("*");} else {printf(" ");}} else {if (y >= 0.0 && y <= sqrt(1 - x * x)) {printf("*");} else if (y < 0.0 && y >= -1.2 * pow(1 - x * x, 1.0 / 3.0)) {printf("*");} else {printf(" ");}}}} else {printf(" ");}}printf("\n");}}int main() {int size;printf("Enter the size of the heart (1-10): ");scanf("%d", &size);if (size < 1 || size > 10) {printf("Invalid size! Please enter a value between 1 and 10.\n");return 1;}printHeart(size);return 0;}```这段代码通过在一个二维坐标系中绘制心形图案。
MATLAB教程:教你画三维曲线三维图形(含图形处理)制作三维动画
MA TLAB教程:教你画三维曲线三维图形(含图形处理)制作三维动画三维曲线plot3函数与plot函数用法十分相似,其调用格式为:plot3(x1,y1,z1,选项1,x2,y2,z2,选项2,…,xn,yn,zn,选项n)其中每一组x,y,z组成一组曲线的坐标参数,选项的定义和plot 函数相同。
当x,y,z是同维向量时,则x,y,z 对应元素构成一条三维曲线。
当x,y,z是同维矩阵时,则以x,y,z对应列元素绘制三维曲线,曲线条数等于矩阵列数。
例绘制三维曲线。
程序如下:t=0:pi/100:20*pi;x=sin(t);y=cos(t);z=t.*sin(t).*cos(t);plot3(x,y,z);title('Line in 3-D Space');xlabel('X');ylabel('Y');zlabel('Z');三维曲面1.产生三维数据在MA TLAB中,利用meshgrid函数产生平面区域内的网格坐标矩阵。
其格式为:x=a:d1:b; y=c:d2:d;[X,Y]=meshgrid(x,y);语句执行后,矩阵X的每一行都是向量x,行数等于向量y的元素的个数,矩阵Y的每一列都是向量y,列数等于向量x的元素的个数。
2.绘制三维曲面的函数surf函数和mesh函数的调用格式为:mesh(x,y,z,c):画网格曲面,将数据点在空间中描出,并连成网格。
surf(x,y,z,c):画完整曲面,将数据点所表示曲面画出。
一般情况下,x,y,z是维数相同的矩阵。
x,y是网格坐标矩阵,z 是网格点上的高度矩阵,c用于指定在不同高度下的颜色范围。
例绘制三维曲面图z=sin(x+sin(y))-x/10。
程序如下:[x,y]=meshgrid(0:0.25:4*pi); %在[0,4pi]×[0,4pi]区域生成网格坐标z=sin(x+sin(y))-x/10;mesh(x,y,z);axis([0 4*pi 0 4*pi -2.5 1]);此外,还有带等高线的三维网格曲面函数meshc和带底座的三维网格曲面函数meshz。
Matlab绘图基础——其他三维图形(绘制填充的五角星)

Matlab绘图基础——其他三维图形(绘制填充的五⾓星)其他三维图形%绘制魔⽅阵的三维条形图subplot(2,2,1);bar3(magic(4));%以三维杆图形式绘制曲线y=2sin(x)subplot(2,2,2);y=2*sin(0:pi/10:2*pi);stem3(y);%已知x=[2347,1827,2043,3025],绘制饼图subplot(2,2,3);pie3([2347,1827,2043,3025]);%⽤随机的顶点坐标值画出2个黄⾊三⾓形subplot(2,2,4);fill3(rand(3,2),rand(3,2),rand(3,2), 'y' );%fill3函数等效于⼆维函数fill,可在三维空间内绘制出_填充多边形_%格式:fill3(x,y,z,c)应⽤⽰例:例⼀:统计灰度图⽚的“灰度频率直⽅图”和“累计直⽅图”A = imread('pout.tif') ; %读取⼀个内置图⽚%%内置图⽚放在……MATLAB\R2010*\toolbox\images\imdataA = A(:)';count0=zeros(1,256); %设置矩阵⼤⼩for x=1:length(A),count0(A(x)+1)=count0(A(x)+1)+1;end%各灰度级像素个数P=count0/length(A); %频率stem(P,'Marker','none'); axis tight; %作图显⽰频率直⽅图Hp=P;for i=2:256,Hp(i)=P(i)+Hp(i-1);end%累计直⽅图stem(Hp,'Marker','none'); axis tight; %作图显⽰例⼆:绘制填充空间五⾓星%%%⽅法⼀t=1:2:11;x = sin(0.4*t*pi); %五⾓星嘛!六⾓星可以除以6y = cos(0.4*t*pi);z=0.5*x+0.3*y; %放置到三维空间中,这是该五⾓星所在的三维平⾯函数fill3(x,y,z,'r')xlabel('x');ylabel('y');zlabel('z');haxes = gca; axis square;box on;set(haxes,'xticklabel','','yticklabel','','zticklabel','') %移除原图坐标轴轴的标注%注意fill是顺时针⽅向的,所以五⾓星闭合后,中间的五边形并没有填充%%地图多边形⽮量化你懂得hold on; %填充五边形t=1:2:11;x=cos(0.4*pi)/cos(0.2*pi)*sin(0.2*t*pi);y=cos(0.4*pi)/cos(0.2*pi)*cos(0.2*t*pi);z=0.5*x+0.3*y;fill3(x,y,z,'r','EdgeColor','r'); %将五边形的边界颜⾊设置为红⾊%%%显⽰五⾓星所在的边界⼀个圆圈t=1:0.1:11;x = cos(0.4*t*pi);y = sin(0.4*t*pi);z=0.5*x+0.3*y;plot3(x,y,z);hold off;%%%⽅法⼆i=1;for ag=0.2*pi:0.2*pi:2.2*piif mod(i,2)==1 %i是奇数,长边,按照长边的计算公式x(i) = sin(ag); %五⾓星嘛!六⾓星可以除以6y(i) = cos(ag);else%i是偶数,短边,按照短边的计算公式x(i)=cos(0.4*pi)/cos(0.2*pi)*sin(ag);y(i)=cos(0.4*pi)/cos(0.2*pi)*cos(ag);endi=i+1;end;clear i ag;z=0.5*x+0.3*y;fill3(x,y,z,'r','EdgeColor','r');xlabel('x');ylabel('y');zlabel('z');haxes = gca; axis square;box on;set(haxes,'xticklabel','','yticklabel','','zticklabel','')。
matlab做心形函数
matlab做心形函数Matlab是一款广泛应用于科学计算与工程设计等领域的软件,也可以用来画出各种各样的函数图形。
其中,心形函数是一种非常有趣的图形,而Matlab也可以轻易地绘制出它。
下面就让我们来学习一下如何用Matlab绘制心形函数吧!首先,我们需要了解一下什么是心形函数。
心形函数是一种极坐标方程,也称作Cardioid,用来表示具有心形的曲线。
它的参数方程为:x = a(2cos(t) - cos(2t))y = a(2sin(t) - sin(2t))其中,a是心形的大小,t是角度。
接下来,我们可以用Matlab来进行绘制了。
首先,打开Matlab软件,新建一个脚本文件,然后输入以下代码:t = 0:0.01:2*pi;a = 1;x = a*(2*cos(t) - cos(2*t));y = a*(2*sin(t) - sin(2*t));plot(x,y)axis equaltitle('Heart-shaped function')xlabel('x')ylabel('y')legend('Heart')运行代码,就可以得到一个美丽的心形图案了。
如果想要改变心形的大小,只需要修改a的值即可。
如果想要将心形颜色改为红色,可以在plot函数中添加一个'-'和一个'r',代码如下:plot(x,y,'-r')这样,就可以得到一个红色的心形图案了。
总之,Matlab是一款非常强大的软件,可以帮助我们轻易地绘制各种各样的函数图形。
而心形函数作为一种有趣的图形,在Matlab中也可以轻松实现。
希望本文能够帮助大家学习Matlab绘图,并且在绘制心形函数时取得成功。
matlab绘制‘心’形,动画版的
function demoDisplayclearclcclose all;[x,y,z] = heart;bottomZ = min(z(:));radius = abs(bottomZ);axis vis3daxis offdaspect([1.6, 1, 1.875]);hold on;markerColor = [0.5, 0.5, 0.5];lineColor = [0.7, 0.7, 0.7];figWidth = 800figHeight = 600;screenSize = get(0, 'ScreenSize');X0 = (screenSize(3)-figWidth)/2;Y0 = (screenSize(4)-figHeight)/2;set(gcf, 'Position', [X0,Y0, figWidth, figHeight]);camtarget([0, 0, 0]);set(gcf,'Renderer','zbuffer');set(gcf,'DoubleBuffer','on');% RGB(255 105 180) is for pink colorset(gcf, 'color', [255 255 255]/255);startAZ = 30;satrtEL = 20;view(startAZ, satrtEL);% draw pointsfor iLoop = 1:size(x, 1)plot3(x(iLoop, :), y(iLoop,:), z(iLoop, :), 'Marker', '.', 'MarkerEdgeColor', markerColor, 'LineStyle', 'none');pause(0.2);end% draw wire framesfor iLoop = 1:size(x, 1)plot3(x(iLoop, :), y(iLoop,:), z(iLoop, :), 'color', lineColor, 'LineStyle', '-');pause(0.1);endfor iLoop = 1:size(x, 2)plot3(x(:, iLoop), y(:, iLoop), z(:, iLoop), 'color', lineColor, 'LineStyle', '-');pause(0.1);end% rotate wire framefor i=1:36camorbit(10,0,'data');pause(0.1);end% clean the curent axesdelete(get(gca, 'Children'));camlight left;newLineColor = [0.7, 0.4, 0.4];% re-draw the whole heart with surf functionh = surf(x,y,z, 'EdgeColor', newLineColor, 'FaceColor', 'r');for i=1:36camorbit(10,0,'data');pause(0.1);endmediumColor = [0.8, 0.3, 0.3];set(h, 'EdgeColor', mediumColor,'FaceLighting','gouraud');for i=1:36camorbit(10,0,'data');endset(h, 'EdgeColor', 'none');drawnow;% define the Z-path for heart re-shapedeltaZ = linspace(-.3, 0, 5);deltaZ = [fliplr(deltaZ), deltaZ];deltaZ = repmat(deltaZ, 1, 3);zlim('manual');for iLoop = 1:length(deltaZ)% draw the bouncing heartcurDeltaZ = deltaZ(mod(iLoop,length(deltaZ))+1);ratio = (radius+curDeltaZ)*radius;newZ = z*ratio + curDeltaZ;if exist('h', 'var')&& ishandle(h), delete(h);end;h = surf(x,y, newZ, 'EdgeColor', 'none', 'FaceColor','r','FaceLighting','gouraud');camorbit(-1, 0, 'data');drawnow;end% draw the bouncing heartdeltaZ = generateSimulatedBouncingPath;zlim([-1, 3]);for iLoop = 1:length(deltaZ)if exist('h', 'var')&& ishandle(h), delete(h);end;curDeltaZ = deltaZ(iLoop);if curDeltaZ < 0% when deltaZ is under the zero bar, it's hitting the groundratio = (radius+curDeltaZ)*radius;newZ = z*ratio + curDeltaZ;else% when deltaZ is bigger than zero, it's a free objectnewZ = z + curDeltaZ;endh = surf(x, y, newZ, 'EdgeColor', 'none', 'FaceColor','r','FaceLighting','gouraud');% zoom in and out for more vivid effectif iLoop <= length(deltaZ)/2camzoom(0.99);elsecamzoom(1.005);endcamorbit(390/length(deltaZ), 0, 'data');drawnow;endtext(0.3,2.4, 'X','FontSize',25,'FontName','Times New Roman')%%%%%%%text(0.3,1.8, 'X','FontSize',30,'FontName','Times New Roman')%%%%%%%endfunction z = generateSimulatedBouncingPath(iterationNum, roundTimes)% define the z path of the center of ball for rountTimes of bouncing along z-axisif nargin < 2roundTimes = 3;endif nargin < 1iterationNum = 40;endradius = 1;deltaH = 1.5; % the highest point comapred with radiusdeltaL = -0.3;% the lowest point comapred with radiusrangeY = [-2, 1];% gravity accelerator constant% Note: this is smaller to the real 9.8 value, but this makes the bouncingg = 5;% define the accelerator for the z < 0% k is similar to spring coefficient, but it's more complicated than that.% k just needs to satisfy one condition here, i.e. it will stop at location defined by% deltaL*radiusk = g * deltaH/(-deltaL);% start pointstartZ = deltaH*radius;% speed when z =0V0 = sqrt(2*startZ*g);% calcualte the total time for rountTimes of bouncing% time for z > 0plusZtime = sqrt(2*deltaH*radius/g);% time for z < 0minusZtime = sqrt(-2*deltaL*radius/k);% half periodqPeriod = plusZtime + minusZtime;% define totalTimeqPeriodTime = linspace(0, qPeriod, iterationNum);% z path when z > 0zPlus = startZ - 0.5 * g * qPeriodTime(qPeriodTime<plusZtime).^2;% z path when z < 0zMinus = -V0 * (qPeriodTime(qPeriodTime >=plusZtime)-plusZtime) + 0.5 * k* (qPeriodTime(qPeriodTime >=plusZtime)-plusZtime).^2;z = [zPlus, zMinus, fliplr(zMinus), fliplr(zPlus)];% the last zPlus is for the stop actionz = [repmat(z, 1, roundTimes), zPlus];y = linspace(rangeY(1), rangeY(2), numel(z));endfunction [cordX, cordY, cordZ] = heart(sizeTheta, sizeFai)if nargin ==0sizeTheta = 30;sizeFai = 40;elseif nargin < 2error('heart:NotEnoughArugments', 'Please give at least two input arugments'); end;theta = linspace(0, pi, sizeTheta)';nudge = 0.0001; % used to avoid the operlappingfai = linspace(0 + nudge, pi/2 - nudge, round(sizeFai/4));a = 9/4;b = 9/80;A = 1+(a-1)*(sin(theta).^2) * (sin(fai).^2);B = (sin(theta).^2.*cos(theta).^3) * (1 + (b-1)*(sin(fai).^2));rou = zeros(size(A));for iLoop = 1:numel(A);curA = A(iLoop);curB = B(iLoop);% this is the polar coordinates version of the sextic equation found on% /HeartSurface.htmlpolyFactors = [curA^3, -curB, -3*curA^2, 0, 3*curA, 0, -1];solutions = roots(polyFactors);realRou = real(solutions(abs(imag(solutions))< 1e-9));rou(iLoop) = realRou(realRou>0);end% x,y,z for the quater of whole heartx = rou .* (sin(theta) * cos(fai));y = rou .* (sin(theta) * sin(fai));z = rou .* (cos(theta) * ones(size(fai)));% x,y,z for the whole heartcordX = [x, -fliplr(x) , -x, fliplr(x)];cordY = [y, fliplr(y) , -y, -fliplr(y)];cordZ = [z, fliplr(z), z, fliplr(z)]; end。
matlab绘制动态三维心形代码(蛋疼的情人节奉献)
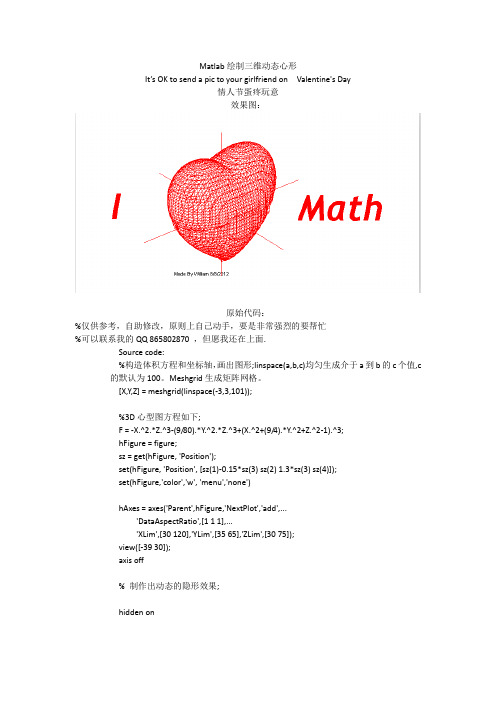
Matlab绘制三维动态心形It’s OK to send a pic to your girlfriend on Valentine's Day情人节蛋疼玩意效果图:原始代码:%仅供参考,自助修改,原则上自己动手,要是非常强烈的要帮忙%可以联系我的QQ 865802870 ,但愿我还在上面.Source code:%构造体积方程和坐标轴,画出图形;linspace(a,b,c)均匀生成介于a到b的c个值,c 的默认为100。
Meshgrid生成矩阵网格。
[X,Y,Z] = meshgrid(linspace(-3,3,101));%3D心型图方程如下;F = -X.^2.*Z.^3-(9/80).*Y.^2.*Z.^3+(X.^2+(9/4).*Y.^2+Z.^2-1).^3;hFigure = figure;sz = get(hFigure, 'Position');set(hFigure, 'Position', [sz(1)-0.15*sz(3) sz(2) 1.3*sz(3) sz(4)]);set(hFigure,'color','w', 'menu','none')hAxes = axes('Parent',hFigure,'NextPlot','add',...'DataAspectRatio',[1 1 1],...'XLim',[30 120],'YLim',[35 65],'ZLim',[30 75]);view([-39 30]);axis off% 制作出动态的隐形效果;hidden on% 画出网格,制作网格动态效果;% 快渲染心得背面:p = patch(isosurface(F,-0.001));set(p,'FaceColor','w','EdgeColor','w');% 构造Y-Z平面,,描完函数在该平面的点:for iX = [35 38 41 45 48 51 54 57 61 64 67]plane = reshape(F(:,iX,:),101,101);cData = contourc(plane,[0 0]);xData = iX.*ones(1,cData(2,1));plot3(hAxes,xData,cData(2,2:end),cData(1,2:end),'r');pause(.1), drawnowend% 构造X-Z平面,描完函数在该平面的点:for iY = [41 44 47 51 55 58 61]plane = reshape(F(iY,:,:),101,101);cData = contourc(plane,[0 0]);yData = iY.*ones(1,cData(2,1));plot3(hAxes,cData(2,2:end),yData,cData(1,2:end),'r');pause(.1), drawnowend% 构造X-Y平面,描完函数在该平面的点:for iZ = [36 38 40 42 44 46 48 50 52 54 56 58 60 62 64 66 69 71] plane = F(:,:,iZ);cData = contourc(plane,[0 0]);startIndex = 1;if size(cData,2) > (cData(2,1)+1)startIndex = cData(2,1)+2;zData = iZ.*ones(1,cData(2,1));plot3(hAxes,cData(1,2:(startIndex-1)),...cData(2,2:(startIndex-1)),zData,'r');endzData = iZ.*ones(1,cData(2,startIndex));plot3(hAxes,cData(1,(startIndex+1):end),...cData(2,(startIndex+1):end),zData,'r');pause(.1), drawnowend%给三维心着色set(p,'FaceColor','r','EdgeColor','w');pause(.2);set(p,'FaceColor','w','EdgeColor','r');%函数已经画完,接下来为文字部分;pause(.2)%设置字体大小,粗细,位置等,以下是打出I (心型图) Wendy;text(7,50,70,'I', 'fontWeight','bold','FontAngle','italic','FontName','Trebuchet MS','fontsize',60,'Color','r')pause(.5)text(80,50,43,'Math', 'fontWeight','bold','FontAngle','italic','FontName','Trebuchet MS','fontsize',60,'Color','r')pause(.2)line([20 80],[50 50],[52.5 52.5], 'color','r')line([50 50],[20 80],[52.5 52.5], 'color','r')line([50 50],[50 50],[30 80], 'color','r')%制作者签名;text(40,60,30,'Made By William 8/8/2012', 'fontsize',8)text(35,45,30,'', 'fontsize',8)%制作心的动态效果% for i =1:28% set(p,'FaceColor','r','EdgeColor','w');% pause(.1);% set(p,'FaceColor','r','EdgeColor','r');% pause(.2)% end% refer to ...%and%笛卡尔;x=0:0.01:2*pi;y=1-cos(x);polar(x,y)复制代码2%简单心;figure(2)ezplot(vectorize('17*x^2-16*abs(x)*y+17*y^2-225'));复制代码3%完美心;4figure(1)5N=200;6f1=@(x,y,z)(x.^2+(9/4)*y.^2+z.^2-1).^3-x.^2.*z.^3-(11/80)*y.^2.*z.^3;7[X,Y,Z]=meshgrid(linspace(-1.5,1.5,N));8set(patch(isosurface(X,Y,Z,f1(X,Y,Z),0)),'facecolor','r','edgecolor','none');9light10view(-10,24)复制代码11%心痕;12[x,y,z]=meshgrid(linspace(-1.3,1.3));13val=(x.^2 + (9/4)*y.^2 + z.^2 - 1).^3 - x.^2.*z.^3 - (1/9)*y.^2.*z.^3;%画出等值面14isosurface(x,y,z,val,0);% View 视角colormap 色图0-115axis equal;view(-10,10);colormap([1 0.2 0.2])复制代码16%花心;17clear;clc;close all18c=5;19t=linspace(-c,c);20[x,y]=meshgrid(t);21z=17*x.^2-16*abs(x).*y+17*y.^2-225;22pcolor(x,y,z);23shading interp24pause(2);25spinmap(10)复制代码26%构造体积方程和坐标轴,画出图形;27[X,Y,Z] = meshgrid(linspace(-3,3,101));2829%3D心型图方程如下;30 F = -X.^2.*Z.^3-(9/80).*Y.^2.*Z.^3+(X.^2+(9/4).*Y.^2+Z.^2-1).^3;31hFigure = figure;32sz = get(hFigure, 'Position');33set(hFigure, 'Position', [sz(1)-0.15*sz(3) sz(2) 1.3*sz(3) sz(4)]); 34set(hFigure,'color','w', 'menu','none')3536hAxes = axes('Parent',hFigure,'NextPlot','add',...37'DataAspectRatio',[1 1 1],...38'XLim',[30 120],'YLim',[35 65],'ZLim',[30 75]);39view([-39 30]);40axis off4142% 制作出动态的隐形效果;4344hidden on4546% 画出网格,制作网格动态效果;474849% 快渲染心得背面:5051p = patch(isosurface(F,-0.001));52set(p,'FaceColor','w','EdgeColor','w');5354% 构造Y-Z平面,,描完函数在该平面的点:55for iX = [35 38 41 45 48 51 54 57 61 64 67]56plane = reshape(F(:,iX,:),101,101);57cData = contourc(plane,[0 0]);58xData = iX.*ones(1,cData(2,1));59plot3(hAxes,xData,cData(2,2:end),cData(1,2:end),'k');60pause(.1), drawnow61end6263% 构造X-Z平面,描完函数在该平面的点:64for iY = [41 44 47 51 55 58 61]65plane = reshape(F(iY,:,:),101,101);66cData = contourc(plane,[0 0]);67yData = iY.*ones(1,cData(2,1));68plot3(hAxes,cData(2,2:end),yData,cData(1,2:end),'k');69pause(.1), drawnow70end7172% 构造X-Y平面,描完函数在该平面的点:73for iZ = [36 38 40 42 44 46 48 50 52 54 56 58 60 62 64 66 69 71] 74plane = F(:,:,iZ);75cData = contourc(plane,[0 0]);76startIndex = 1;77if size(cData,2) > (cData(2,1)+1)78startIndex = cData(2,1)+2;79zData = iZ.*ones(1,cData(2,1));80plot3(hAxes,cData(1,2:(startIndex-1)),... 81cData(2,2:(startIndex-1)),zData,'k');82end83zData = iZ.*ones(1,cData(2,startIndex)); 84plot3(hAxes,cData(1,(startIndex+1):end),... 85cData(2,(startIndex+1):end),zData,'k');86pause(.1), drawnow87end。
Matlab中的3D图形绘制方法

Matlab中的3D图形绘制方法Matlab是一种常用于科学计算和数据可视化的高级编程语言和开发环境。
它的强大功能使得它成为工程师、科学家和研究人员的首选工具之一。
其中一个引人注目的特点是它对3D图形的支持。
在本文中,我们将探讨Matlab中的一些3D图形绘制方法。
Matlab提供了多种绘制3D图形的函数和工具。
最基本的方法是使用“plot3”函数绘制三维数据。
这个函数接受x、y和z三个参数,分别表示三维坐标系上的数据点。
通过给定一系列的数据点,我们可以在三维空间中绘制出线条或散点图。
这种方法适用于简单的数据展示和初步的分析。
除了基本的线条和散点图,Matlab还提供了一些更高级的3D图形绘制函数,如“surface”和“mesh”。
这些函数可以用来绘制三维曲面和网格图。
例如,我们可以使用“surface”函数绘制一个三维山丘的图像,其中x和y轴表示地面上的位置,z轴表示地面的高度。
通过调整x、y和z的数值,我们可以创建出各种形状和复杂度的三维表面。
Matlab还在其图形库中提供了许多其他类型的3D图形绘制函数。
例如,“bar3”函数可以用来绘制三维柱状图,其中x和y轴表示不同的类别,z轴表示各类别的数值。
这种图形可以更直观地展示不同类别之间的关系和差异。
类似地,“contour”函数可以用来绘制三维的等值线图,用于可视化函数的等值线和等高面。
另一个值得一提的技术是使用Matlab的“patch”函数绘制复杂的三维图形。
这个函数可以用来创建和修改三维物体的表面,例如绘制球体、立方体和多面体等。
我们可以通过更改物体的属性和位置来构建各种形状和几何体。
这种灵活性使得“patch”函数在计算机图形学和动画领域中得到广泛应用。
除了这些函数和工具,Matlab还允许用户通过编写自定义的脚本和函数来实现更高级的3D图形绘制。
例如,我们可以使用Matlab的3D绘图工具箱中的一些高级函数和方法来创建特定类型的三维图形,如体积渲染、光线追踪和动画效果等。
- 1、下载文档前请自行甄别文档内容的完整性,平台不提供额外的编辑、内容补充、找答案等附加服务。
- 2、"仅部分预览"的文档,不可在线预览部分如存在完整性等问题,可反馈申请退款(可完整预览的文档不适用该条件!)。
- 3、如文档侵犯您的权益,请联系客服反馈,我们会尽快为您处理(人工客服工作时间:9:00-18:30)。
Matlab绘制三维动态心形It’s OK to send a pic to your girlfriend on Valentine's Day情人节蛋疼玩意效果图:原始代码:%仅供参考,自助修改,原则上自己动手,要是非常强烈的要帮忙%可以联系我的QQ 865802870 ,但愿我还在上面.Source code:%构造体积方程和坐标轴,画出图形;linspace(a,b,c)均匀生成介于a到b的c个值,c 的默认为100。
Meshgrid生成矩阵网格。
[X,Y,Z] = meshgrid(linspace(-3,3,101));%3D心型图方程如下;F = -X.^2.*Z.^3-(9/80).*Y.^2.*Z.^3+(X.^2+(9/4).*Y.^2+Z.^2-1).^3;hFigure = figure;sz = get(hFigure, 'Position');set(hFigure, 'Position', [sz(1)-0.15*sz(3) sz(2) 1.3*sz(3) sz(4)]);set(hFigure,'color','w', 'menu','none')hAxes = axes('Parent',hFigure,'NextPlot','add',...'DataAspectRatio',[1 1 1],...'XLim',[30 120],'YLim',[35 65],'ZLim',[30 75]);view([-39 30]);axis off% 制作出动态的隐形效果;hidden on% 画出网格,制作网格动态效果;% 快渲染心得背面:p = patch(isosurface(F,-0.001));set(p,'FaceColor','w','EdgeColor','w');% 构造Y-Z平面,,描完函数在该平面的点:for iX = [35 38 41 45 48 51 54 57 61 64 67]plane = reshape(F(:,iX,:),101,101);cData = contourc(plane,[0 0]);xData = iX.*ones(1,cData(2,1));plot3(hAxes,xData,cData(2,2:end),cData(1,2:end),'r');pause(.1), drawnowend% 构造X-Z平面,描完函数在该平面的点:for iY = [41 44 47 51 55 58 61]plane = reshape(F(iY,:,:),101,101);cData = contourc(plane,[0 0]);yData = iY.*ones(1,cData(2,1));plot3(hAxes,cData(2,2:end),yData,cData(1,2:end),'r');pause(.1), drawnowend% 构造X-Y平面,描完函数在该平面的点:for iZ = [36 38 40 42 44 46 48 50 52 54 56 58 60 62 64 66 69 71] plane = F(:,:,iZ);cData = contourc(plane,[0 0]);startIndex = 1;if size(cData,2) > (cData(2,1)+1)startIndex = cData(2,1)+2;zData = iZ.*ones(1,cData(2,1));plot3(hAxes,cData(1,2:(startIndex-1)),...cData(2,2:(startIndex-1)),zData,'r');endzData = iZ.*ones(1,cData(2,startIndex));plot3(hAxes,cData(1,(startIndex+1):end),...cData(2,(startIndex+1):end),zData,'r');pause(.1), drawnowend%给三维心着色set(p,'FaceColor','r','EdgeColor','w');pause(.2);set(p,'FaceColor','w','EdgeColor','r');%函数已经画完,接下来为文字部分;pause(.2)%设置字体大小,粗细,位置等,以下是打出I (心型图) Wendy;text(7,50,70,'I', 'fontWeight','bold','FontAngle','italic','FontName','Trebuchet MS','fontsize',60,'Color','r')pause(.5)text(80,50,43,'Math', 'fontWeight','bold','FontAngle','italic','FontName','Trebuchet MS','fontsize',60,'Color','r')pause(.2)line([20 80],[50 50],[52.5 52.5], 'color','r')line([50 50],[20 80],[52.5 52.5], 'color','r')line([50 50],[50 50],[30 80], 'color','r')%制作者签名;text(40,60,30,'Made By William 8/8/2012', 'fontsize',8)text(35,45,30,'', 'fontsize',8)%制作心的动态效果% for i =1:28% set(p,'FaceColor','r','EdgeColor','w');% pause(.1);% set(p,'FaceColor','r','EdgeColor','r');% pause(.2)% end% refer to /art/898961...%and/questions/1526898/how-do-i-reproduce-this-heart-shaped-m esh-in-matlab1%笛卡尔;x=0:0.01:2*pi;y=1-cos(x);polar(x,y)2%简单心;figure(2)ezplot(vectorize('17*x^2-16*abs(x)*y+17*y^2-225'));3%完美心;4figure(1)5N=200;6f1=@(x,y,z)(x.^2+(9/4)*y.^2+z.^2-1).^3-x.^2.*z.^3-(11/80)*y.^2.*z.^3;7[X,Y,Z]=meshgrid(linspace(-1.5,1.5,N));8set(patch(isosurface(X,Y,Z,f1(X,Y,Z),0)),'facecolor','r','edgecolor','none');9light10view(-10,24)11%心痕;12[x,y,z]=meshgrid(linspace(-1.3,1.3));13val=(x.^2 + (9/4)*y.^2 + z.^2 - 1).^3 - x.^2.*z.^3 - (1/9)*y.^2.*z.^3;%画出等值面14isosurface(x,y,z,val,0);% View 视角colormap 色图0-115axis equal;view(-10,10);colormap([1 0.2 0.2])16%花心;17clear;clc;close all18c=5;19t=linspace(-c,c);20[x,y]=meshgrid(t);21z=17*x.^2-16*abs(x).*y+17*y.^2-225;22pcolor(x,y,z);23shading interp24pause(2);25spinmap(10)26%构造体积方程和坐标轴,画出图形;27[X,Y,Z] = meshgrid(linspace(-3,3,101));2829%3D心型图方程如下;30 F = -X.^2.*Z.^3-(9/80).*Y.^2.*Z.^3+(X.^2+(9/4).*Y.^2+Z.^2-1).^3;31hFigure = figure;32sz = get(hFigure, 'Position');33set(hFigure, 'Position', [sz(1)-0.15*sz(3) sz(2) 1.3*sz(3) sz(4)]); 34set(hFigure,'color','w', 'menu','none')3536hAxes = axes('Parent',hFigure,'NextPlot','add',...37'DataAspectRatio',[1 1 1],...38'XLim',[30 120],'YLim',[35 65],'ZLim',[30 75]);39view([-39 30]);40axis off4142% 制作出动态的隐形效果;4344hidden on4546% 画出网格,制作网格动态效果;474849% 快渲染心得背面:5051p = patch(isosurface(F,-0.001));52set(p,'FaceColor','w','EdgeColor','w');5354% 构造Y-Z平面,,描完函数在该平面的点:55for iX = [35 38 41 45 48 51 54 57 61 64 67]56plane = reshape(F(:,iX,:),101,101);57cData = contourc(plane,[0 0]);58xData = iX.*ones(1,cData(2,1));59plot3(hAxes,xData,cData(2,2:end),cData(1,2:end),'k');60pause(.1), drawnow61end6263% 构造X-Z平面,描完函数在该平面的点:64for iY = [41 44 47 51 55 58 61]65plane = reshape(F(iY,:,:),101,101);66cData = contourc(plane,[0 0]);67yData = iY.*ones(1,cData(2,1));68plot3(hAxes,cData(2,2:end),yData,cData(1,2:end),'k');69pause(.1), drawnow70end7172% 构造X-Y平面,描完函数在该平面的点:73for iZ = [36 38 40 42 44 46 48 50 52 54 56 58 60 62 64 66 69 71] 74plane = F(:,:,iZ);75cData = contourc(plane,[0 0]);76startIndex = 1;77if size(cData,2) > (cData(2,1)+1)78startIndex = cData(2,1)+2;79zData = iZ.*ones(1,cData(2,1));80plot3(hAxes,cData(1,2:(startIndex-1)),... 81cData(2,2:(startIndex-1)),zData,'k');82end83zData = iZ.*ones(1,cData(2,startIndex)); 84plot3(hAxes,cData(1,(startIndex+1):end),... 85cData(2,(startIndex+1):end),zData,'k');86pause(.1), drawnow87end。
